Article

Effect of Screw Configuration on the Recyclability of Natural Fiber-Based Composites

1
Centre for Industrial Services and Design, Technological University of the Shannon, N37 HD68 Athlone, Ireland
2
Applied Polymer Technology (APT) Gateway, Technological University of the Shannon, N37 HD68 Athlone, Ireland
3
PRISM Research Institute, Technological University of the Shannon, N37 HD68 Athlone, Ireland
*
Author to whom correspondence should be addressed.
Fibers 2025, 13(7), 98; https://doi.org/10.3390/fib13070098
Submission received: 17 April 2025 / Revised: 12 June 2025 / Accepted: 15 July 2025 / Published: 18 July 2025

Abstract

The burgeoning crisis of plastic waste accumulation necessitates innovative approaches towards sustainable packaging solutions. Polylactic acid (PLA), a leading biopolymer, emerges as a promising candidate in this realm, especially for environmentally friendly packaging. PLA is renowned for its compostable properties, offering a strategic avenue to mitigate plastic waste. However, its dependency on specific industrial composting conditions, characterized by elevated temperatures, humidity, and thermophilic microbes, limits its utility for household composting. This study aims to bridge the research gap in PLA’s recyclability and explore its feasibility in mechanical recycling processes. The research focuses on assessing the mechanical characteristics of PLA and PLA-based composites post-recycling. Specifically, we examined the effects of two extrusion methods—conical and parallel—on PLA and its composites containing 20 wt.% basalt fibers (BF). The recycling process encompassed repeated cycles of hot melt extrusion (HME), followed by mechanical grinding to produce granules. These granules were then subjected to injection moulding (IM) after 1, 3 and 5 recycling cycles. The tensile properties of the resulting IM-produced bars provided insights into the material’s durability and stability. The findings reveal that both PLA and PLA/BF composites retain their mechanical integrity through up to 5 cycles of mechanical recycling. This resilience underscores PLA’s potential for integration into existing recycling streams, addressing the dual challenges of environmental sustainability and waste management. The study contributes to the broader understanding of PLA’s lifecycle and opens new possibilities for its application in eco-friendly packaging, beyond the limits of composting. The implications of these findings extend towards enhancing the circularity of biopolymers and reducing the environmental footprint of plastic packaging.

1. Introduction

Owing to their exceptional versatility and wide array of tailorable properties, plastic materials have become the undoubted “go to” material for packaging applications. Given the fast-paced consumer lifestyle of the modern world, this has unfortunately led to an ongoing environmental crisis spurred by the vast quantities of plastic waste generated on an annual basis. The Organization for Economic Cooperation and Development (OECD) currently estimate that each person produces 69–221 kg of plastic waste on an annual basis. Worse still, of this vast amount only 9% is properly recycled and 22% is improperly managed to such an extent that it becomes uncollected litter [1]. One of the most prominent issues with plastic waste is its persistence in the environment. Unlike organic materials, most plastic materials do not biodegrade and instead break down into microplastics that persist for hundreds if not thousands of years [2,3,4]. Improper disposal and mismanagement lead to plastic waste contaminating waterways and oceans, to such an extent where 60–80% of marine litter globally is made of plastic materials [5,6]. This significantly endangers marine life through ingestion and entanglement [7,8]. The toxic chemicals in plastics further threaten wildlife and have the potential to enter the human food chain through contaminated sources [9].
Depending on the type of polymer, design of the product, and the sources of the polymers, many techniques have been developed to recycle plastic materials. Because there are so many different approaches for recycling, the classification and their definition have been defined by the International Organization for Standardization (ISO) and the American Society for Testing and Materials (ASTM) into four categories as can be seen in Table 1 [10].
Mechanical recycling, also known as physical recycling, is the most common method for recycling of plastics and involves the collection, sorting, and processing of plastic waste to produce new products. In this method, plastics are sorted based on their resin type, cleaned, shredded, and melted to create pellets or flakes that can be used as raw materials for manufacturing new plastic items [13]. Mechanical recycling is particularly effective for plastics that can be easily sorted and have a similar chemical composition, such as PET bottles and HDPE containers. This process helps reduce the consumption of virgin materials, saves energy, and mitigates the environmental impact associated with plastic waste [14].
Chemical recycling, also referred to as feedstock recycling or advanced recycling, employs various chemical processes to break down complex plastic polymers into their original monomers or convert them into other valuable chemicals [15,16]. Unlike mechanical recycling, chemical recycling can handle a wider range of plastic types, including mixed plastics and contaminated materials that are challenging to recycle mechanically [17,18]. Through techniques like pyrolysis, depolymerization, or solvent-based processes, chemical recycling can convert plastic waste into chemical feedstocks or energy sources, which can then be used to produce new plastics, fuels, or other valuable products. Chemical recycling offers a promising solution to the plastic waste crisis by enabling the recovery of plastics that would otherwise end up in landfills or incinerators [19].
Recycled and bioplastic polymers are playing an increasingly vital role in addressing the environmental impact of plastic production and waste. Recycled polymers are derived from post-consumer or post-industrial plastic waste, which is processed and transformed into new plastic materials [20]. By utilizing recycled polymers, the need for virgin plastic production is reduced, minimizing resource consumption and energy usage [21]. Furthermore, recycling helps divert plastic waste from landfills and natural environments, contributing to a more circular economy [22].
On the other hand, bioplastic polymers are an interesting class of polymers that are derived from natural sources, they exhibit a wide range of properties and functionalities and offer a more sustainable alternative to traditional petroleum-based plastics [23]. Many of these materials have the advantage of being biodegradable or compostable, meaning they can break down naturally in specific conditions [24]. Microbes convert the bioplastic mass to CO2, CH4 and microbial biomass, using the carbon substrate for energy and carbon assimilation [25]. Bioplastics can help mitigate the environmental impact of plastic waste, as they reduce the persistence of plastic in the environment and minimize the release of harmful chemicals during degradation [26].
Both recycled and bioplastic polymers play a crucial role in addressing the plastic waste crisis and transitioning towards a more sustainable future [27,28]. However, it is essential to consider their limitations and challenges. Recycled polymers may have certain limitations in terms of quality and performance compared to virgin plastics, and the availability of suitable recycling infrastructure can be a limiting factor [29]. Bioplastics, while offering environmental benefits, require careful management to ensure they are disposed of correctly in appropriate composting facilities [30]. Additionally, the scalability and cost-effectiveness of bioplastic production still need further development to compete with traditional plastics on a larger scale [31].
Polylactic acid (PLA) has become the most widely used bioplastic commercially available today [32,33]. Available at large-scale, PLA is biocompatible, sustainably sourced and compostable. A linear aliphatic thermoplastic, PLA is produced via the polymerization of L- and D- lactic acid isomers obtained from starch fermentation [33,34] Though oft described as a compostable plastic, this only refers to industrial composting settings, requiring very specific conditions of temperature, pressure and others [35]. Consumer misconceptions regarding this status can lead to mismanagement of PLA at its end of life (EoL), where it may be sent to landfill, remaining there for years like any conventional plastic material [36]. This has resulted in the current growth of studies investigating the possibility to incorporate PLA into conventional mechanical recycling processes [37,38,39]. Though many of these papers investigate the effect of recycling cycles on the thermo-mechanical properties of PLA and various PLA composites, there is a notable lack of studies comparing the formats of extruders utilized. As such this study aimed to investigate two such formats: conical twin screw extrusion (CTSE) and more conventional parallel twin screw extrusion (PTSE) and the implications on PLA and PLA composites resulting from their use.

2. Materials and Methods

2.1. Materials

For this research project, the PLA used for melt processing and injection moulding of the samples was Ingeo™ Biopolymer 4032D, batch number IG2428B111, obtained from NatureWorks (Minneapolis, MN, USA). Typical material and application properties of Ingeo 4032D extrusion grade for higher heat products are shown in Table 2. Basalt fiber (BF) utilised for PLA composite samples was BASFIBER® direct roving, monofilament diameter 13 µm, sizing for polyamides, linear density 600 tex (g/km), external unwinding, batch number 19120-329 supplied by Basalt Fiber Tech (Salt Lake City, UT, USA).

2.2. Blends Formulated for This Study

The objective of this study was to compare virgin PLA with a PLA/BF composite. The composition of the prepared batches is detailed in Table 3, presenting the individual components as weight percentages (wt.%) of the total formulation. Individual materials were weighed out using a mass balance according to the provided table, placed in polyethylene bags and were subsequently sealed. To achieve a uniform blend, the sealed bags were manually tumble mixed for 5-min. Before processing, all materials were pre-dried at 80 °C for 4-h This drying step aimed to minimize potential degradation caused by moisture absorption.

2.3. Hot Melt Extrusion Conditions

2.3.1. Material Compounding

The process of melt compounding of the baseline materials was conducted using a benchtop Prism™ TSE 16 parallel twin extruder (PTSE) (Waltham, MA, USA). The extruder had 16 mm diameter screws with a length to diameter (L/D) ratio of 15:1. The operational parameters were set to ensure optimal performance: the extruder ran at a consistent speed of 150 rotations per minute, while the torque applied ranged between 20% and 25%. To facilitate the shaping of the extrudate, an annular die with a rod-like structure was attached to the end of the extruder barrel. The extrusion process involved feeding the prepared samples into the extruder using an automated oscillatory feeder. The barrel temperature was set at 180 °C for all previously prepared materials: PLA100 and PLA80BF20. The extruded materials were then cooled by air, and the resulting extrudates were granulated to acquire pellets with a length of approximately 5 mm using a Prism™ TSE systems granulator. For all extrusion processes the feed rate was controlled to obtain a constant material throughput of ~1.5 kg.h−1.

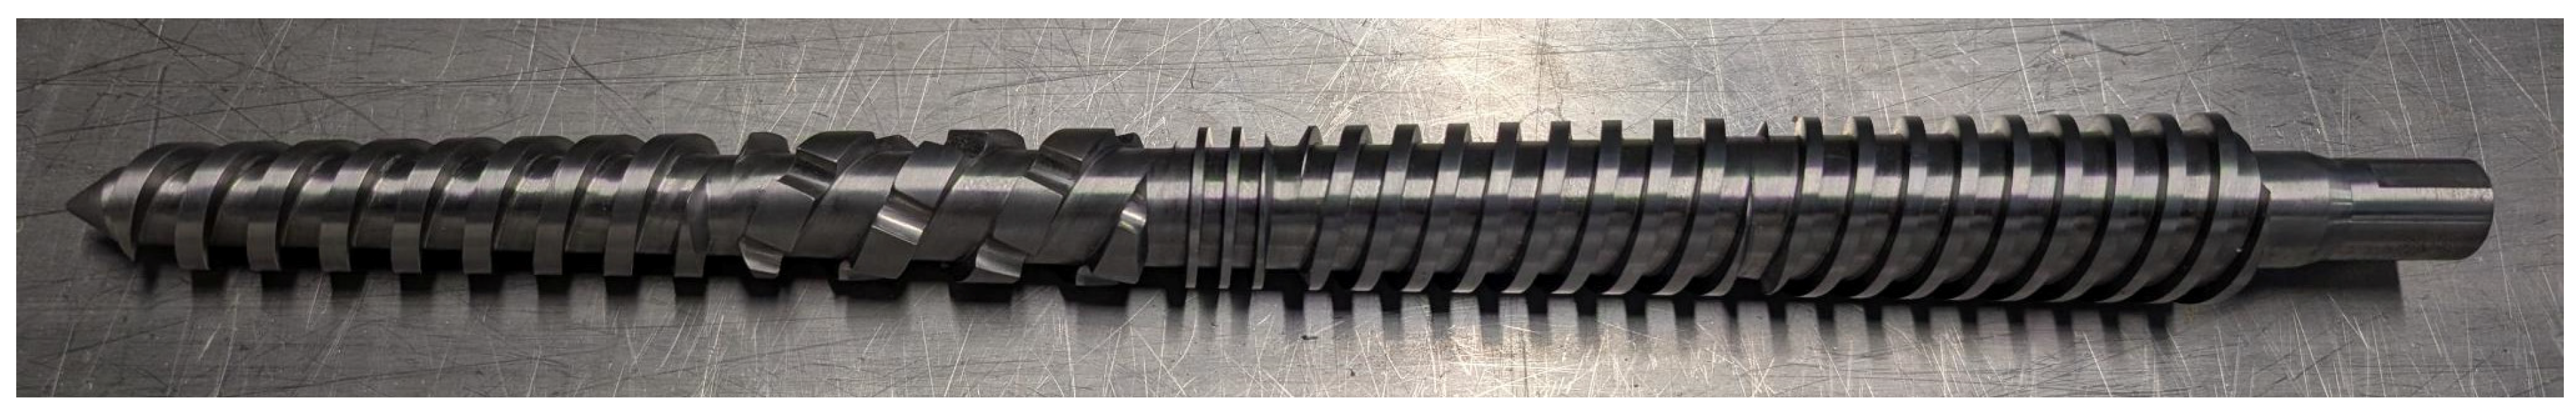
2.3.2. Mechanical Recycling via PTSE

Mechanical recycling through PTSE was carried out utilizing identical conditions as described previously. This encompassed the deployment of the benchtop Prism™ TSE 16 PTSE with 16 mm diameter screws and a 15:1 length-to-diameter (L/D) ratio (Figure 1), operating at a constant speed of 150 rotations per minute. The torque parameters ranging from 20% to 25% were upheld to maintain uniformity during this stage of mechanical recycling. The barrel temperature was set at the established 180 °C for the recycling of materials. Subsequent to mechanical recycling, air-cooling was employed, followed by granulation of the extrudates to generate pellets of approximately 5 mm in length, mirroring the previous granulation process.

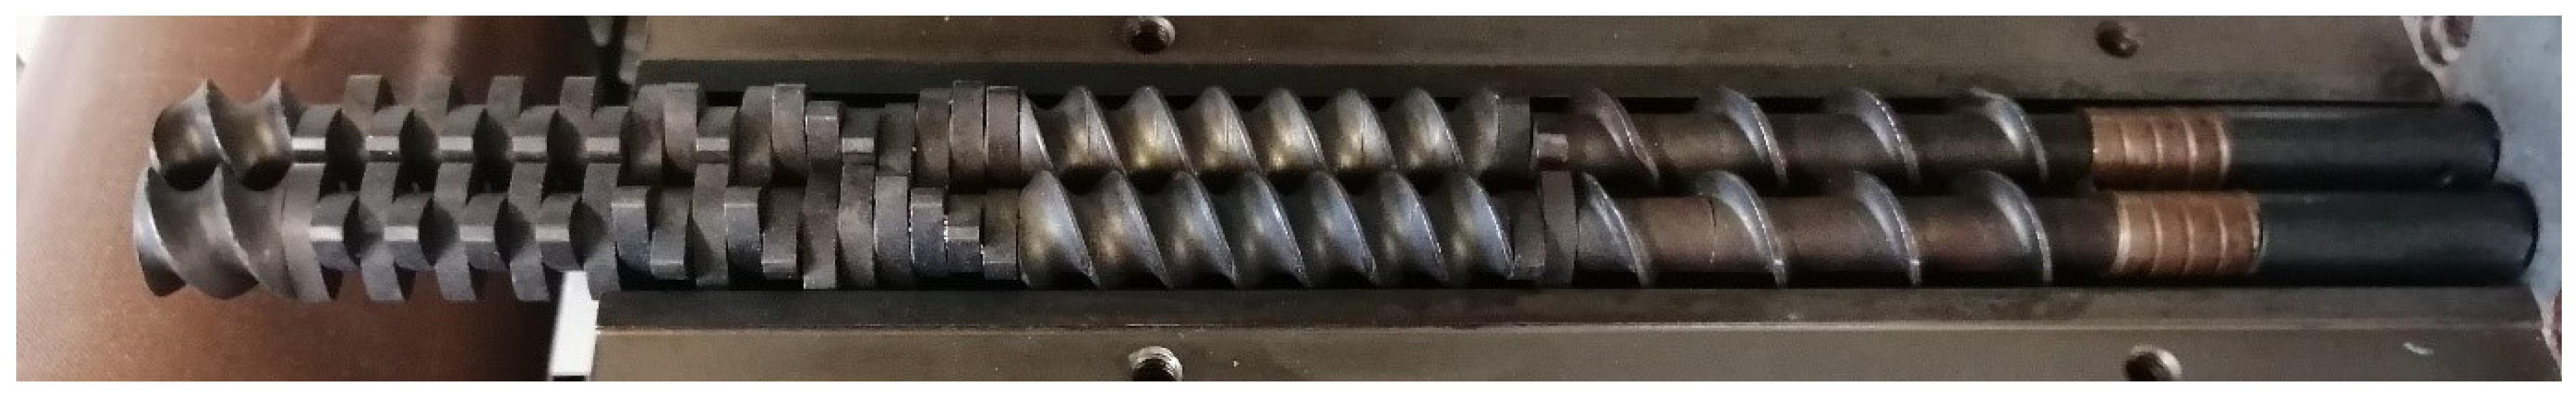
2.3.3. Mechanical Recycling via CTSE

Alternative batches for this research project were produced using a Brabender MetaStation 4E conical twin-screw extruder (CTSE) (Duisburg, Germany). The CTSE was equipped with counter-rotating screws (Figure 2) and the resulting extrudate was shaped into a strand using a 5 mm filament die. The Brabender extruder used for this investigation is owned by APT, located in the Athlone campus of the TUS:MD-MW. The temperature profile of the extruder barrel for producing the extrudates is provided in Table 4. As in previous step, four material blends were extruded a total of five times. After each extrusion step, the resulting strands were granulated using a bench-top Prism granulator to obtain pellets approximately 5 mm in length. Following the extrusion and granulation, the materials were micro injection moulded (μIM) to create tensile test specimens, which will be discussed in the subsequent section.

2.4. Micro Injection Molding

Injection moulding is a process that includes melting a thermoplastic material through extrusion, injecting the molten polymer into a mould, allowing the moulded part to cool, and ultimately ejecting the finished product [40].
In this body of work, a Babyplast 6/10P (Molteno, Italy) was utilised for the μIM of tensile test specimens, shown with dimensions in Figure 3. The μIM capabilities afforded by the Babyplast allow for precise moulding of small components, ensuring that the test samples meet the required specifications with a high degree of accuracy, thus making it an ideal choice for producing the small quantity of tensile bar samples required for testing. Unlike traditional injection moulding machines, the setup and operation of the Babyplast is more cost-effective and the flexibility of the equipment enables quick adjustments to the moulding process, which is crucial when producing a small batch of samples, optimizing the overall efficiency and reducing material waste.
The manufacturing parameters for the injection moulded samples for PLA100 and PLA80BF20 composites are summarized in Table 5. Before undergoing this processing step, the extruded granules underwent a drying procedure in an air convection oven for a duration of 4 h at a temperature of 80 °C.

2.5. Mechanical Analysis

2.5.1. Tensile Testing

Tensile testing is a fundamental mechanical test used to evaluate the mechanical properties of materials, particularly their response to tensile or pulling forces. The outcomes of the tensile test, typically presented on a stress-strain graph, offer important characteristics such as the material’s yield strength, ultimate tensile strength, modulus of elasticity, and elongation at break [41]. During a typical tensile test, a sample of the material, often shaped like a dog-bone, is carefully prepared to ensure uniform force distribution. This specimen is then placed into a testing machine that applies controlled pulling forces. The machine records the force applied and the corresponding response of the sample over time, generating a stress-strain curve that reveals valuable insights into the material’s behaviour [42]. This type of testing helps engineers and researchers understand how materials behave under tension and aids in designing and selecting appropriate materials for various applications.
Tensile testing on prepared specimens for this project was conducted on Lloyd LRX Tensometer (Lloyd Instruments, Bognor Regis, UK) after conditioning for a minimum of 24 h at 23 ± 2 °C. The Tensometer was fitted with a 2.5 kN loadcell and Lloyd Vice Grips 01/4265 with Jaw Faces 01/4271 5 kN Capacity Tensile Testing Grip. A test speed of 50.0 mm/minute was used and temperature during testing was 23.3 °C. The average tensile strength results were calculated from testing five individual specimens tested, with the specimens subjected to assessment representing the baseline, first, and fifth recycling cycle.

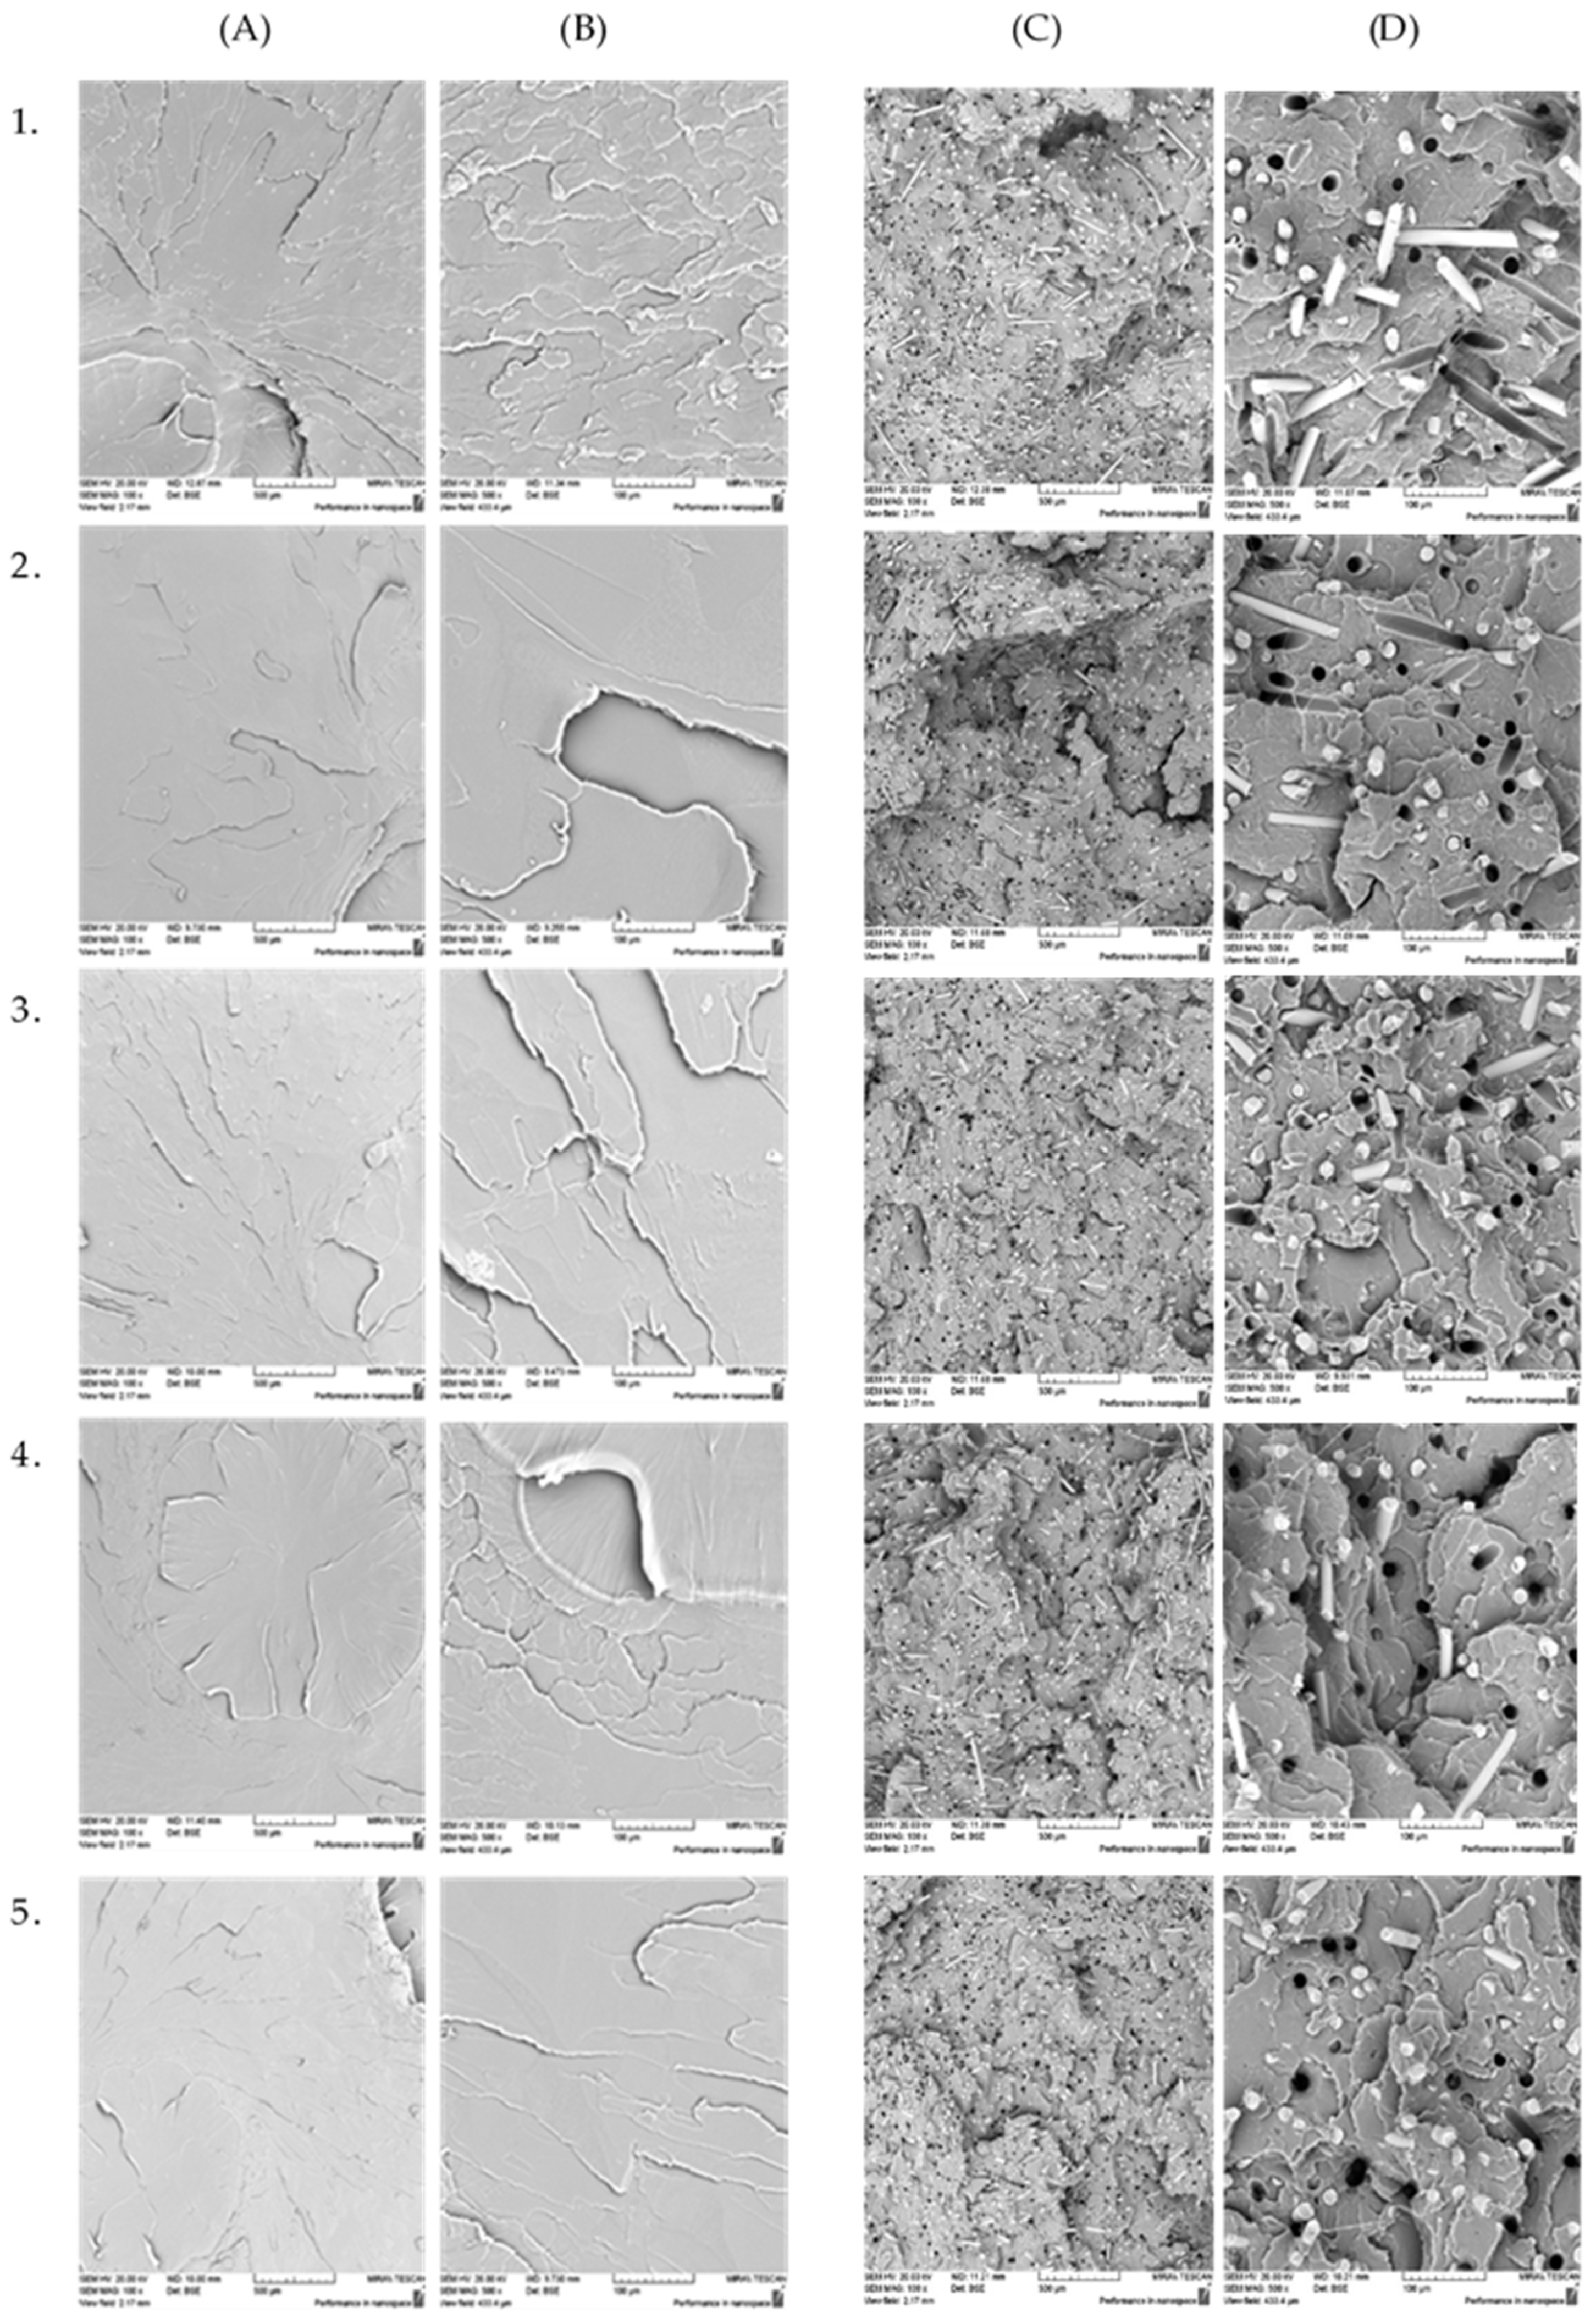
2.5.2. Fracture Surface Morphology

In this study, the fracture surface morphology was observed via scanning electron microscopy (SEM). SEM analysis was conducted employing a TESCAN MIRA SEM (Tescan, Brno, Czech Republic) owned by Centre for industrial services and design (CISD) located in the Athlone campus of the TUS: MD-MW. Instrument was set at 20 kV, with a magnification level of 500×, and utilizing the backscattered electrons (BSEs) mode. These high-energy electrons, known as BSEs, were employed to capture detailed images illustrating the arrangement of different constituent elements within the sample. The surface of the samples was examined at the location where they fractured following the tensile testing. These specimens were affixed into aluminium sample holder to secure their position and were subsequently coated with a layer of gold prior to the analysis.

2.5.3. Shore D Hardness

Shore hardness is a quick and non-destructive method commonly used to measure the hardness of polymers and other materials. It is a technique to assess the material’s resistance to indentation or penetration by a rigid object. There are two primary scales used in Shore hardness testing: Shore A and Shore D. The Shore A scale is used for softer materials, while the Shore D scale is used for harder materials [43].
As the materials produced in this research study were rigid, the Shore D scale of hardness measure was used. The first step was to ensure that the surface of the injection moulded sample was flat, clean, and free from any contaminants or irregularities. The Shore durometer was then held vertically and positioned perpendicular to the material’s surface. Under a 4 kg load, a sharp conical point from the shore apparatus was pressed onto the sample surface, exerting substantial pressure on the durometer’s indenter, which was sustained for 15 s to facilitate the indenter’s penetration to the desired depth. The hardness value was indicated on the display of the Shore durometer. To ensure accurate results, multiple tests were performed at 5 different points on the material, and the average hardness value was calculated based on these results.

2.6. Thermal Analysis

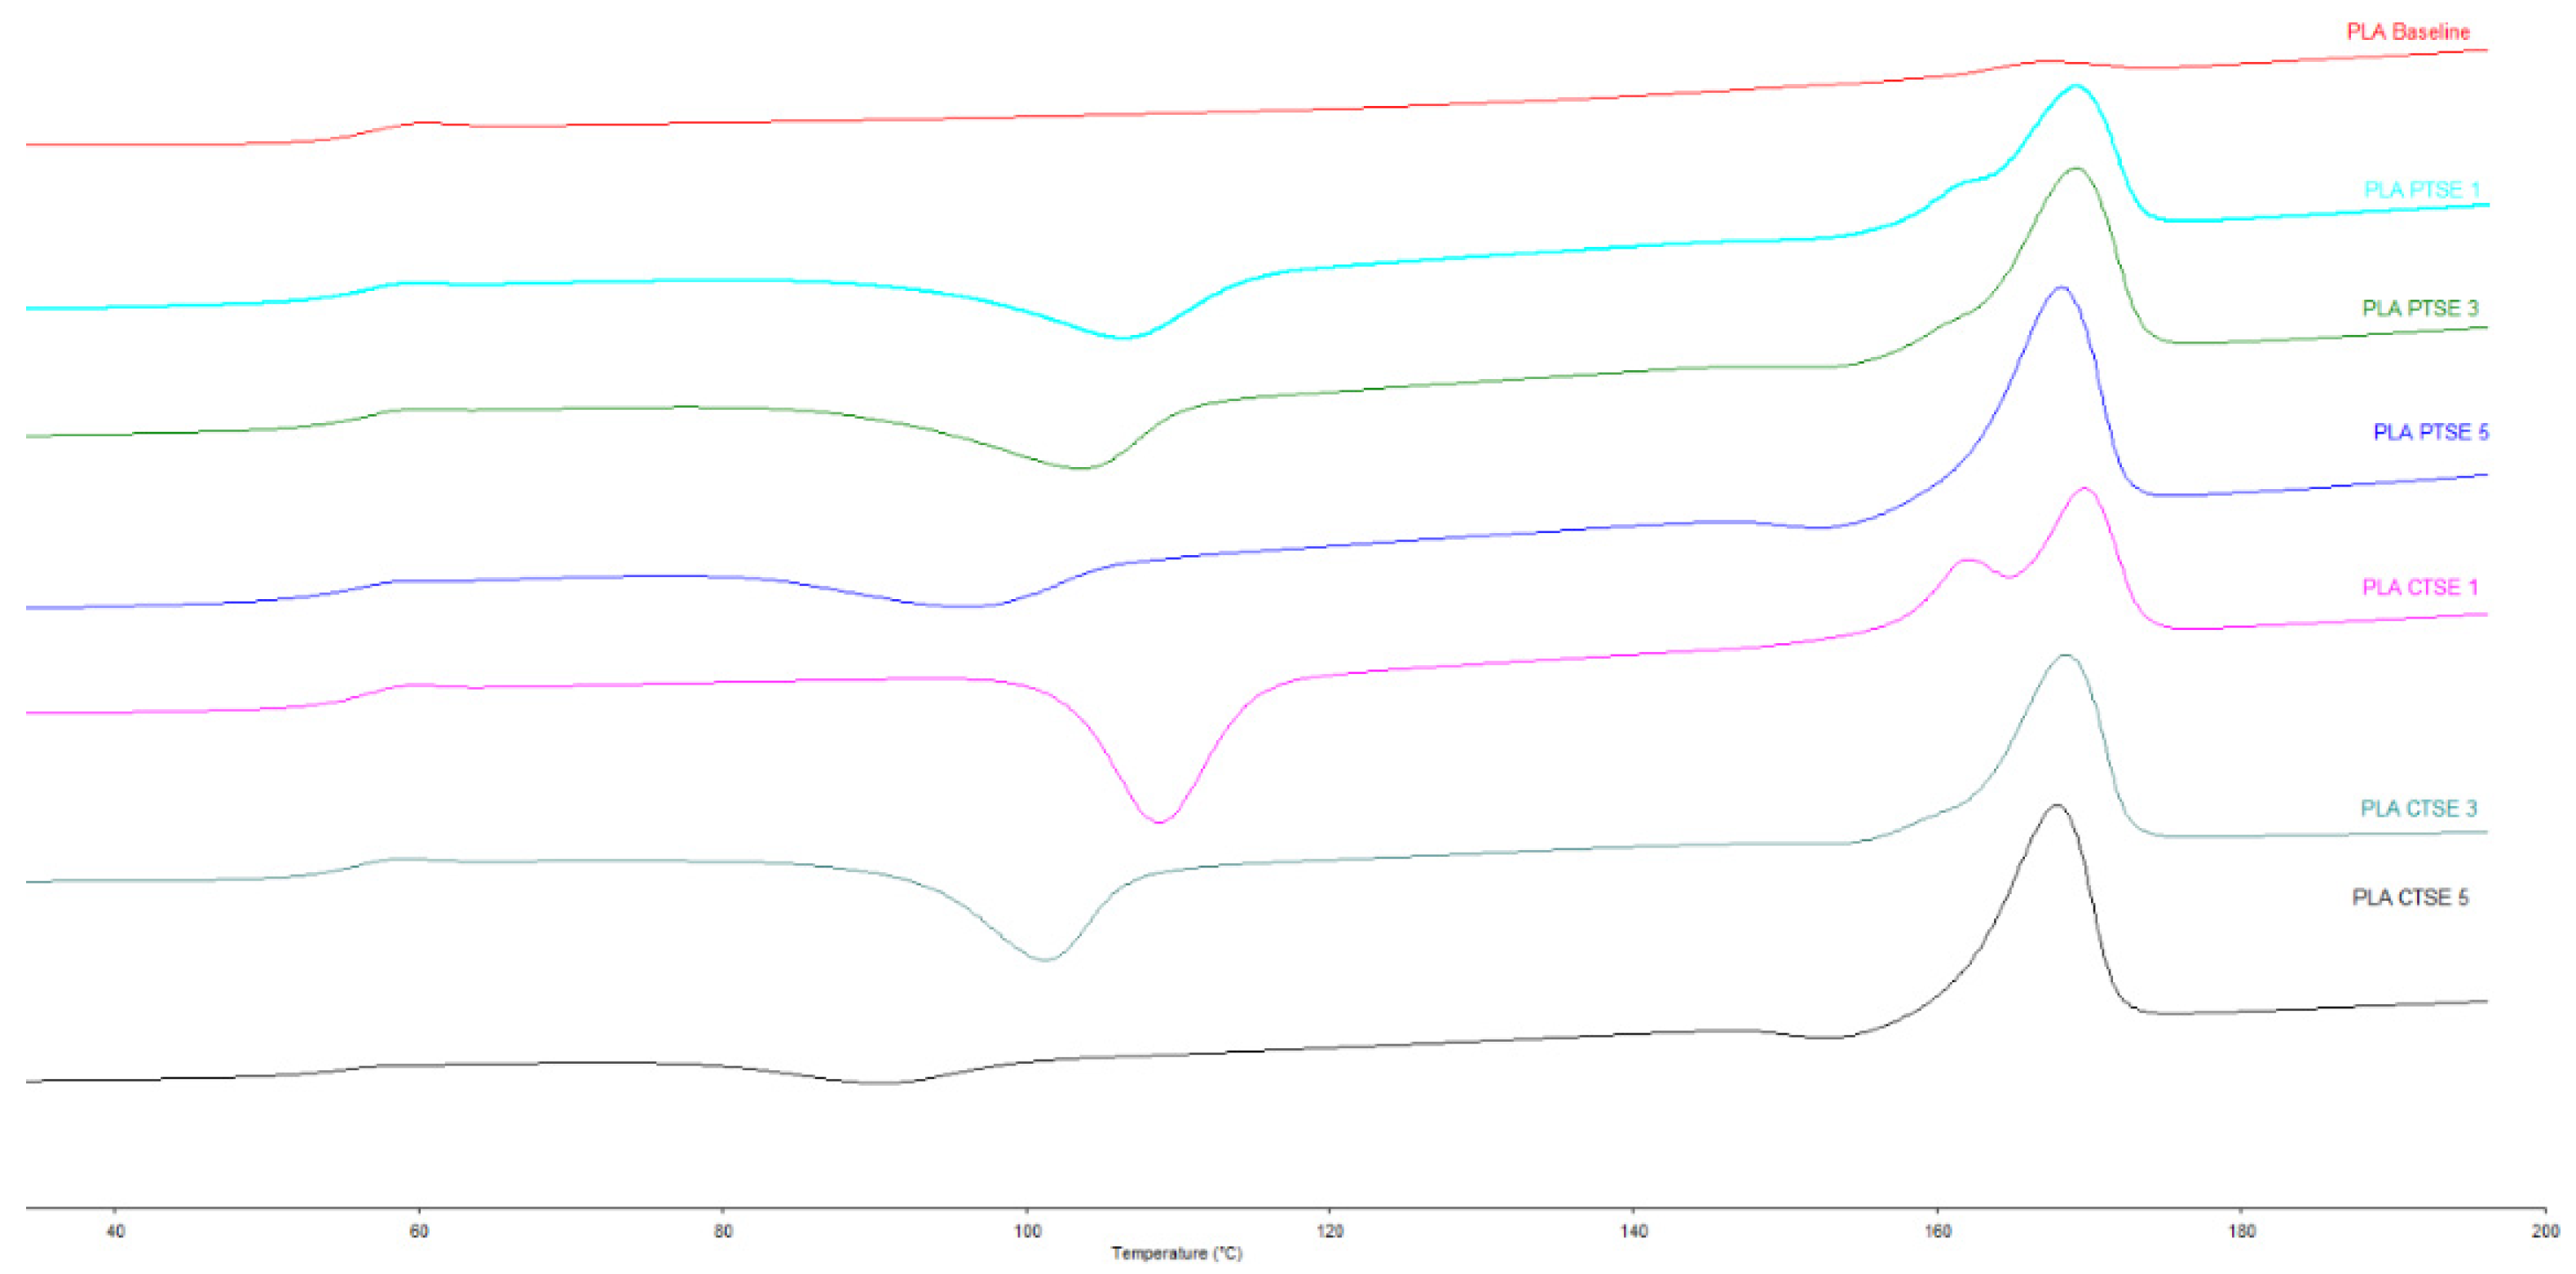
2.6.1. Differential Scanning Calorimetry

DSC analysis were carried out using a Perkin Elmer DSC 4000 (Waltham, MA, USA), which was calibrated using indium as the reference material. Tested samples of approximately 5 mg were placed in aluminium hermetic pans. The measurements were performed in three cycles (heat–cool–heat), in a temperature range from −20 to 200 °C with a heating and cooling rate 10 °C/min in the presence of purge nitrogen, with a flow rate of 10 mL/min. The results described in this work were obtained from the second heating curves of the samples under investigation. Prior to collecting these results, a first heating and subsequent cooling process were performed on the samples. This step was crucial to reduce any potential thermal history effects that might have been present in the tested samples. This approach ensured that the obtained results were reliable and represented the intrinsic thermal characteristics of the materials, independent of any prior thermal treatments or external factors. Obtained DSC curves were used to analyse the glass transition temperature (Tg), crystallization temperature (Tc), cold crystallization enthalpy (∆Hc), melting temperature (Tm), and fusion enthalpy (∆Hm). The degree of crystallinity (Xc) for the samples was calculated according to Equation (1):
X c = Δ H m Δ H m 100 × 100
where ΔHm100 = 93.7 J/g—the fusion of enthalpy of 100% crystalline PLA [44].

2.6.2. Gel Permeation Chromatography

An Agilent 1260 Infinity II Multi-Detector GPC/SEC System (Agilent, Santa Clara, CA, USA)—with light scattering, refractive index and viscometry detectors was used to performed GPC analysis on virgin PLA and PLA blends. In the analysis, 10 mg of each sample was individually dissolved in 10 mL of tetrahydrofuran (THF) and then filtered to remove any particulates or impurities. The prepared samples were then subjected to GPC using a TSKgel GMHHR-M column with dimensions of 30 cm × 7.8 mm and a particle size of 5 μm (Sigma-Aldrich, Burlington, MA, USA). The mobile phase used for the chromatography was high-performance liquid chromatography (HPLC) grade THF. The GPC analysis was conducted at a flow rate of 1.0 mL/min, with the sample concentration set of 1.0 mg/mL. A 100 μL injection size was employed for each sample, and the column temperature was maintained at 30 °C throughout the analysis. These specific GPC conditions were chosen to ensure accurate and reliable determination of the molecular weight distribution of the samples in the study.

3. Results & Discussion

3.1. Tensile Properties

Tensile testing was performed on the injection moulded samples and the results are compiled in Table 6. The dataset offers a comprehensive overview of the mechanical properties of PLA and PLA-based composite materials. These mechanical properties serve as essential indicators of how these materials respond to external forces and stresses, offering insights into their performance and potential applications. Of the PLA100 samples, initially CTSE appears to have the lesser negative impact on the tensile properties of the material. The maximum load of PLA100 decreases by 3.26% when subjected to a single recycling cycle via PTSE and only 0.31% when undergoing CTSE. Conversely after undergoing 5 recycling cycles this increases to a loss of 3.96% and 7.06% for PTSE and CTSE respectively. A similar observation is to be made for the Youngs moduli of the samples. The PTSE process yields a loss of 3.30% after 1-cycle, increasing to 3.98% after 5-cycles. The CTSE process meanwhile yields 0.27% loss and 7.14% loss in Youngs modulus after 1 and 5 cycles respectively. This lends credence to CTSE being a gentler mechanical recycling method for PLA should a single recycling cycle be required, however, should multiple recycling steps be required then PTSE offers more versatility in that regard. It is generally accepted that plastics and plastic-composites have a finite life-cycle of undergoing mechanical recycling due to the effects o these thermal processes on the properties of the material [45]. As multiple recycling processes are more favorable for a circular economy, limiting resource loss and adding value to waste materials it is imperative to choose a recycling methodology that allows for more repeated cycles of re-use.
The effect of multiple recycling cycles is much more pronounced on the PLA80BF20 samples. Compared to the initial PLA80BF20 samples (max load = 922 MPa) there is a decrease of 17.75% and 23.37% when undergoing 5-cycles of recycling via PTSE and CTSE respectively. The deterioration in mechanical properties if hypothesized to arise due to a combination of two mechanism, progressive fiber breakage due to shear forces and inadequate interfacial adhesion between the BF and PLA matrix. Although this study did not perform quantitative analysis of fiber length, SEM observations qualitatively indicate a noticeable reduction in average fiber size with increasing recycling cycles. The impact of mechanical recycling, particularly the effect of shear on the reduction of fiber length has additionally been shown by numerous authors [46,47,48].
The increased shear forces imparted on the fiber containing blends constantly have an additive effect on the reduction in fiber length of the BF. It is a known effect that, in general, as fiber length decreases so too does the tensile strength of fiber reinforced composites [49]. As the number of recycling process increases, it is more likely that the fibers are reduced closer to the critical fiber length and as such no reinforcement effect is obtained and instead a decrease in tensile strength is a result [50].
Multiple recycling steps have been shown to alter the degree of crystallinity of a polymeric material, altering properties such as flexural strength, impact strength and elongation at break [51]. It has been shown that repeated recycling processes of polypropylene (PP), result in an increase in crystallinity attributed to increased crystal growth afforded by reduction in polymer chain length. This is primarily reflected by negative impacts on stress at break while properties such as Youngs modulus are only minorly affected [52]. Such observations can be made herein where there is a consistent downward trend in properties such as maximum load and tensile stress at break whereas for Youngs modulus there is not a particularly discernible trend. One such causation for this trend, posited by Pillin et al. is that though the reprocessing cycles lead to a reduction in molecular weight, thus leading to reduced tensile properties, this is counteracted by the increased crystallinity observed in the polymer [53,54]. The major degradation mechanism of PLA is brought about as a result of hydrolysis. As this hydrolysis takes place primarily within the amorphous regions of the polymeric structure, this leads to an increase in net crystallinity during the degradation process [35]. Numerous authors have detailed the thermo-hydrolytic degradation of PLA and the subsequent impacts on the processibility of the recyclate. Badia et al. [55] Zenkiewicz et al. [56] and Pillin et al. [53] showed significant decreases in mechanical properties and a reduction in Mw of the polymer following multiple reprocessing stages, Yarahmadi et al. [57] displayed an 80% increase in the melt flow rate of PLA after 6 sequential extrusion steps and Sirin et al. showed a correlation between the thermal stability of TPS/PLA blends with the number of recycling processes.
As PLA is known to be a brittle polymer, it has a relatively low strain at break (ε) as a homopolymer, while repeated mechanical recycling may cause further brittleness. Pillin et al. noted a relatively strong reduction in ε with respect to recycling cycles, decreasing from 6 to 0.8% after 7 recycling steps. This was similarly reported by Duigou et al. whom reprocessed PLLA with increasing loadings of natural fibers [58].

3.2. Fracture Surface Morphology

SEM was used to observe the morphology of the fracture surfaces of the samples post tensile testing. This involved utilizing high-energy electrons referred to as BSEs to capture intricate images depicting the arrangement of distinct constituent elements present within the sample. This approach allowed for a comprehensive analysis of the fracture surface characteristics and the distribution of elements within the material. Figure 4 displays SEM images of PLA100 and PLA80BF20 composites captured at magnifications of 100× and 500×. The smooth and uniform surface displayed by virgin PLA in Figure 4A,B is indicative of its inherent brittle characteristics. In general, PLA is recognized as a brittle polymer, characterized by its tendency to undergo a brittle fracture mechanism that involves minimal to no significant deformation [59]. As the recycling steps progress, the fracture surfaces become more irregular and roughened, pronouncing the brittleness. After 3 and 5 recycling processes the surfaces display pronounced microcracking and complex fracture patterns, suggestive of molecular weight reduction. This impact of recycling processes on the fracture morphology of PLA and inherent embrittlement processes has similarly been displayed by Agüero et al. [59].
The SEM images portraying addition of BFs in PLA/BF (Figure 4C,D) provide a clear visual representation of the material’s structural features. It is evident from these images that regardless of the format of extruder utilized, the fibers display a homogenous distribution with no generation of BF agglomerates. These images distinctly show two prominent characteristics: first, the presence of fibers that have been pulled out from the matrix, and second, voids within the PLA matrix resulting from the removal of BFs. These observations collectively suggest a notable deficiency in adhesion between the reinforcing BFs and the surrounding PLA matrix. This “pull out” phenomenon of BF incorporated into a PLA matrix has similarly been shown by Kuciel et al. whom posited that it is a result of the manufacturing process of the fibers [60].
As recycling cycles progressed, there was a noticeable trend of decreasing BF size. This reduction in size can be attributed to the cumulative impact of recycling on the fibers, likely stemming from mechanical stresses and thermal effects. The repeated recycling process appears to gradually break down the fibers, resulting in their fragmentation and subsequent reduction in size. While the current study did not statistically quantify the length of fibers, this trend of fiber length shortening is consistent with the findings of Persico et al. [61]. The extent of fiber fragmentation appears to differ between the two extrusion methods with the samples recycled via CTSE exhibiting greater fiber breakage with a less unfirm dispersion compared to those processes via PTSE. Likely, this results as a consequence of CTSEs conical geometry, tapered and forcing the material inro a progressively smaller channel, which results in increased shear intensity, prolonged residence time and more aggressive mixing, all of which may contribute to increased fiber degradation. Conversely, PTSE meanwhile appears to have a better preservative effect on fiber integrity while providing greater distribution over the repeated recycling steps.
The combination of these findings thus emphasizes the crucial nature of addressing this adhesion deficiency. Without a strong and cohesive bond between the reinforcing fibers and the surrounding PLA matrix, the composite material’s ability to withstand external forces, distribute loads effectively, and achieve its intended mechanical properties is severely compromised. Consequently, rectifying this deficiency stands as a critical step toward enhancing the overall performance and functionality of the composite material in various applications and scenarios.
While the appearance of voids and fiber pull-out confirms the weak interfacial adhesion commonly observed between PLA and BF, this study did not implement any strategies to improve the interfacial adhesion. This is a known limitation of the materials, especially in recycled PLA composites whereby mechanical recycling may further degrade the interface through iterative thermal and shear stresses.

3.3. Shore D Hardness

The effect of recycling steps on the hardness of PLA100 and PLA80BF20 was characterized via Shore D hardness. Surface hardness of a material is one of the key attributes that determine the overall behavior and characteristics of the material [62]. The Shore D hardness results for the various samples shown in Table 7. For the samples comprised of PLA100 it can be seen that there is no discernible detrimental effect on the hardness of samples regardless of extruder used or number of recycling cycles with all tested samples in the range of 80–81. For the composite samples, PLA80BF20, the reinforcement effect provided by the fibers can be seen through the increase in shore D hardness (80.1 to 83.5). This is similar to the results of Graupner and Müssig. They had shown through manufacturing composites of PLA and kenaf or lyocell that the shore D hardness could be increased from 81.5 to 83.6 and 67.5 to 73.1 respectively [63]. Similarly, Singh et al. produced 3D printed composites of PLA and almond skin to prepare polymeric matrices with improved surface hardness [64]. Jagadeesh et al. studied the effect of BF-biocomposites comprised of BF and bio-epoxy. The authors noted how the increase in surface hardness afforded by the BF was due to the fibers reducing the inter-molecular distance by acting as an occupant in the vacant regions and thus acting as a support material against the force of indentation [62]. Again, regardless of extruder used or recycling steps implemented there is no significant effect on the hardness of samples. It may be posited that as the recycling steps increase and fiber length decreases that there may be a greater presence of voids within the samples thus leading to discrepancies in the overall hardness of samples due to poor interfacial adhesion between the fibers and polymer matrix. It has been reported that there is a direct relationship between Youngs modulus and the hardness of a material [59,65]. It has been shown previously that there was a greater effect on the elongation at break and strength at break with respect to recycling steps while the values for Youngs modulus remained relatively consistent. Such trends are in agreement with the results found for Shore D hardness herein. Though both Shore D hardness and Youngs modulus provide insight into the stiffness of a material, the correlation of the two is not always linear, particularly in systems not homogenous in nature, such as fiber-reinforced composites. The nature of the Shore D hardness test, surface-sensitive, may be impacted by localized fiber concentration, dispersion and presence of surface voids. Should these factors be present in the system, the Shore D hardness may be reduced despite unchanged stiffness of the material.

3.4. Thermal Characterization

DSC analysis was performed to examine the effect the repeated melt processing techniques had on the thermal transitions of the PLA. An overlay thermogram of the PLA materials is shown in Figure 5 with the thermograms of the BF-composite samples shown in Figure 6. PLA, as many aliphatic polyesters, is known to be susceptible to thermal degradation at elevated temperatures [66]. A reduction in the melting temperature (Tm) is often an indicator of thermal degradation or a reduction in molecular weight caused by chain scission [67]. For PLA specifically, the thermal degradation is posed to occur as a combination of random main chain scission and unzipping depolymerisation reactions [68]. As is apparent throughout Table 8, the Tm of all trialed materials decreased with respect to additional mechanical recycling steps. This has similarly been reported by Agüero et al. [59]. The absence of cold crystallization was observed in virgin PLA and the melting point occurred at approximately 166 °C. However, the intensity of the melting peak was relatively low, indicating low crystallinity in the PLA. The intensity of the melting peaks observed for all recycled samples exhibited a significant increase in comparison to virgin PLA. This increase strongly suggests that the crystallinity level of PLA achieved after undergoing reprocessing cycles displayed a notably higher quality. This increase can be directly linked to the previously mentioned chain scission. The emergence of shorter PLA chains with improved mobility played a role in their increased tendency to arrange themselves in an organized structure, thereby increasing crystallinity [37,38].
As the reprocessing cycles increased in frequency, both the cold crystallization and melting peaks demonstrated higher intensities [69] as can be seen in the increase in percentage of crystallinity (Xc). All samples showed a large increase at the point of initial recycling step followed by a gradual increase with additional recycling. This effect is greater in samples recycled using CTSE compared to PTSE as can be seen in Table 8. It may arise due to a combination of unique operational factors inherent to its design. The conical screw configuration of the extruder leads to the generation of increased shear forces due to its tapered geometry [70]. These elevated shear forces result in a higher likelihood of chain scission, where polymer chains are broken down, causing a reduction in molecular weight. Additionally, the conical extruder’s design promotes more efficient heat transfer and mixing within the polymer melt. This intensified thermal energy input, coupled with the augmented shear forces, accelerates degradation reactions within the PLA polymer chains. Furthermore, the longer residence time of the polymer melt within the conical extruder due to its design allows for prolonged exposure to elevated temperatures and intensified shear, further contributing to increased degradation. The unique combination of heightened shear forces, enhanced thermal energy transfer, extended residence time, and improved mixing inherent to the conical extruder collectively contribute to the heightened degradation effects observed in PLA samples processed using this method compared to PTSE. Additionally, the potential nucleating effect of the BF should not be overlooked as the nucleation effect of natural fibers has been elsewhere described in the literature [71]. This in part may explain the consistently greater values for Tc observed in the BF reinforced samples compared to the virgin PLA samples, especially after repeated recycling stages. The combinatory effects of fiber induced nucleation, shear induced scission and thermal exposure complicate the attribution of crystallinity changes to a sole factor however. Similar results pertaining to the effect of BF on increasing the cold crystallization temperature of PLA have so too been displayed by Ying et al. [72].

3.5. Molecular Weight

Gel permeation chromatography (GPC) was employed within this study to quantify the effect of the recycling processes on the molecular weight of the polymer and polymer composite. GPC measurements have been often employed to compare the variance between weight average molecular weight (Mw) and number average molecular weight (Mn) of a polymeric material [73]. The resultant values for Mw and Mn with respect to recycling cycle and extruder format are shown in Table 9. It is evident that all samples show a decrease in both Mw and Mn as the number of recycling steps increases. In general, this effect is attributed to the increased exposure to thermal and shear effects resulting in chain scission of the polymer matrix [74]. Repeated exposure of PLA to elevated temperatures in an oxygen rich environment result in increased chain scission of alkoxyl radicals. Subsequently this leads to the formation of free radicals thus inducing further chain scission of the PLA chains [75].
There is a noticeable trend observed for both the virgin PLA and PLA80BF20 wherein the initial recycling step performed via CTSE appears to have a lesser effect on both Mw and Mw of the materials. However, as the number of recycling steps increases, the inverse trend is observed with repeated recycling process via CTSE having a much more pronounced negative impact on both properties. The Mw of PLA100 decreases by 13.4% after 1 recycling step via PTSE and 29.6% by recycling step 5. This is in stark contrast compared to CTSE where the same value decreases by 9.9% and 44.3% after 1 and 5 recycling steps respectively. As the molecular weight of a polymeric material is a vital parameter for various other properties (viscosity, thermal properties, mechanical properties) it can be inferred that for multiple recycling process, PTSE is a more versatile method than CTSE which would only be suitable for a single recycling process.

3.6. Limitations of Current Study

While this study aimed to provide insights into the mechanical recyclability of PLA and PLA/BF composites using both parallel (PTSE) and conical (CTSE) extrusion, certain limitations of the current study must be acknowledged. A constraint faced by the study is the variance in processing temperature between the two extrusion processes. The PTSE was operated at a single, constant temperature whereas the CTSE was performed with a gradient temperature profile. This limitation was caused by a hardware issue as the PRISM extruder utilised possesses a single heating zone and as such a gradient profile is unobtainable. Additional variance between the equipment lies in the feed system utilised. The PTSE is fitted with an attached vibratory feeder whereas the CTSE is fed using a mobile single screw feeder. As such the feed rate was controlled in a starve-fed manner so as to maintain a throughout of approximately 1.5 kg.h−1. As such, for greater interpretation of the results derived in this study, future studies should aim to utilize equipment with consistent auxiliary equipment and hardware set up so as to be able to define that the impact on the materials are solely down to the geometry of the extruder format in use.

4. Conclusions

Growth in the demand for sustainable materials has prompted increased interest in integration bioplastics (such as PLA) into mechanical recycling streams. This study aimed to evaluate the effects of parallel (PTSE) and conical (CTSE) twin-screw extrusion on the recyclability of virgin PLA and BF reinforced PLA composites across 5 reprocessing cycles. The results indicate that while PLA shows some capacity for reprocessing, progressive degradation of mechanical strength, molecular weight and thermal characteristics occurs with additive recycling stages. GPC showed a clear decline in molecular weight, particularly under CTSE which additionally showed decreased tensile strength and crystallinity.
Overall, the comparison between PTSE and CTSE formats reveals that PTSE demonstrated a more favourable performance overall. It exhibited better retention of mechanical properties during multiple recycling cycles, maintained steadier thermal behaviour with minimal impact on Tm, and caused less reductions in molecular weight compared to CTSE. This suggests that PTSE is more effective in preserving material integrity and stability throughout the recycling process. Though the incorporation of BF enhances mechanical properties, the reinforcement effect is diminished after multiple recycling stages due to potential fiber degradation and poor interfacial adhesion.
The claim that PLA is resilient under mechanical recycling must be tempered. The material shows limited recyclability with 1–2 reprocessing cycles appearing to the upper threshold before critical losses in performance occur. This study was, however, performed under controlled laboratory conditions and as such did not account for oxidative ageing, highly relevant to real-world scenarios where oxygen exposure may further accelerate chain scission and further reduce the viability of recycling the materials. As such, PLA may be considered partially recyclable under controlled conditions and its integration into recycling processes must account for this finite recyclability, future efforts should be such to explore more real-world recycling conditions in order to extend the usable life of PLA-based materials.

Author Contributions

Conceptualization, V.C. and D.M.C.; methodology, V.C., S.R., J.F., T.H., C.D. and S.C.; formal analysis, V.C.; investigation, V.C., A.P., S.R., J.F., T.H., C.D. and S.C.; writing—original draft preparation, V.C.; writing—review and editing, V.C., S.R. and D.M.C.; supervision, A.M., N.G., D.M.D. and D.M.C.; project administration, D.M.C. All authors have read and agreed to the published version of the manuscript.

Funding

This research received no external funding.

Data Availability Statement

Data pertaining to this study is available within the manuscript.

Conflicts of Interest

The authors declare no conflicts of interest.

References

  1. OECD. Global Plastics Outlook: Economic Drivers, Environmental Impacts and Policy Options; Organisation for Economic Cooperation and Development: Paris, France, 2022. [Google Scholar]
  2. Wojnowska-Baryła, I.; Bernat, K.; Zaborowska, M. Plastic Waste Degradation in Landfill Conditions: The Problem with Microplastics, and Their Direct and Indirect Environmental Effects. Int. J. Environ. Res. Public Health 2022, 19, 13223. [Google Scholar] [CrossRef]
  3. Taipale, S.J.; Vesamäki, J.; Kautonen, P.; Kukkonen, J.V.K.; Biasi, C.; Nissinen, R.; Tiirola, M. Biodegradation of microplastic in freshwaters: A long-lasting process affected by the lake microbiome. Environ. Microbiol. 2023, 25, 2669–2680. [Google Scholar] [CrossRef] [PubMed]
  4. Chamas, A.; Moon, H.; Zheng, J.; Qiu, Y.; Tabassum, T.; Jang, J.H.; Abu-Omar, M.; Scott, S.L.; Suh, S. Degradation Rates of Plastics in the Environment. ACS Sustain. Chem. Eng. 2020, 8, 3494–3511. [Google Scholar] [CrossRef]
  5. Derraik, J.G.B. The pollution of the marine environment by plastic debris: A review. Mar. Pollut. Bull. 2002, 44, 842–852. [Google Scholar] [CrossRef] [PubMed]
  6. Thevenon, F.; Carroll, C.; Sousa, J. (Eds.) Plastic Debris in the Ocean: The Characterization of Marine Plastics and Their Environmental Impacts, Situation Analysis Report; International Union for Conservation of Nature: Gland, Switzerland, 2015. [Google Scholar] [CrossRef]
  7. Woods, J.S.; Verones, F.; Jolliet, O.; Vázquez-Rowe, I.; Boulay, A.-M. A framework for the assessment of marine litter impacts in life cycle impact assessment. Ecol. Indic. 2021, 129, 107918. [Google Scholar] [CrossRef]
  8. Kühn, S.; van Franeker, J.A. Quantitative overview of marine debris ingested by marine megafauna. Mar. Pollut. Bull. 2020, 151, 110858. [Google Scholar] [CrossRef]
  9. Pinto da Costa, J.; Rocha-Santos, T.; Duarte, A.C. The Environmental Impacts of Plastics and Micro-Plastics Use, Waste and Pollution: EU and National Measures; European Parliament: Strasbourg, France, 2020. [Google Scholar]
  10. Maris, J.; Bourdon, S.; Brossard, J.-M.; Cauret, L.; Fontaine, L.; Montembault, V. Mechanical recycling: Compatibilization of mixed thermoplastic wastes. Polym. Degrad. Stab. 2018, 147, 245–266. [Google Scholar] [CrossRef]
  11. ASTM D7209-06; Standard Guide for Waste Reduction, Resource Recovery, and Use of Recycled Polymeric Materials and Products 2015. ASTM: West Conshohocken, PA, USA, 2015.
  12. ISO 15270:2008; Plastics—Guidelines for the Recovery and Recycling of Plastics Waste. ISO: Geneva, Switzerland, 2008.
  13. Schyns, Z.O.G.; Shaver, M.P. Mechanical Recycling of Packaging Plastics: A Review. Macromol. Rapid Commun. 2021, 42, 2000415. [Google Scholar] [CrossRef]
  14. Hopewell, J.; Dvorak, R.; Kosior, E. Plastics recycling: Challenges and opportunities. Philos. Trans. R. Soc. B Biol. Sci. 2009, 364, 2115–2126. [Google Scholar] [CrossRef]
  15. Plastics Europe. Chemical Recycling • Plastics Europe. 2022. Available online: https://plasticseurope.org/sustainability/circularity/recycling/chemical-recycling/ (accessed on 8 July 2023).
  16. McKeown, P.; Jones, M.D. The Chemical Recycling of PLA: A Review. Sustain. Chem. 2020, 1, 1–22. [Google Scholar] [CrossRef]
  17. Ragaert, K.; Delva, L.; Van Geem, K. Mechanical and chemical recycling of solid plastic waste. Waste Manag. 2017, 69, 24–58. [Google Scholar] [CrossRef]
  18. Shen, L.; Worrell, E. Chapter 31—Plastic recycling. In Handbook of Recycling, 2nd ed.; Meskers, C., Worrell, E., Reuter, M.A., Eds.; Elsevier: Amsterdam, The Netherlands, 2024; pp. 497–510. [Google Scholar] [CrossRef]
  19. Zheng, J.; Arifuzzaman, M.; Tang, X.; Chelsea Chen, X.; Saito, T. Recent development of end-of-life strategies for plastic in industry and academia: Bridging their gap for future deployment. Mater. Horiz. 2023, 10, 1608–1624. [Google Scholar] [CrossRef] [PubMed]
  20. EcoEnclose. Post Consumer vs. Post Industrial Recycled Content. 2021. Available online: https://www.ecoenclose.com/blog/post-consumer-vs-post-industrial-recycled-content/ (accessed on 8 July 2023).
  21. Grabiel, T.; Gammage, T.; Perry, C.; Dixon, C. Achieving sustainable production and consumption of virgin plastic polymers. Front. Mar. Sci. 2022, 9, 981439. [Google Scholar] [CrossRef]
  22. Department of the Environment, Climate and Communications Waste Action Plan for a Circular Economy. 2020. Available online: https://www.gov.ie/en/publication/4221c-waste-action-plan-for-a-circular-economy/ (accessed on 8 July 2023).
  23. Baranwal, J.; Barse, B.; Fais, A.; Delogu, G.L.; Kumar, A. Biopolymer: A Sustainable Material for Food and Medical Applications. Polymers 2022, 14, 983. [Google Scholar] [CrossRef] [PubMed]
  24. Abhilash, M.; Thomas, D. 15—Biopolymers for Biocomposites and Chemical Sensor Applications. In Biopolymer Composites in Electronics; Sadasivuni, K.K., Ponnamma, D., Kim, J., Cabibihan, J.-J., AlMaadeed, M.A., Eds.; Elsevier: Amsterdam, The Netherlands, 2017; pp. 405–435. [Google Scholar] [CrossRef]
  25. Flury, M.; Narayan, R. Biodegradable plastic as an integral part of the solution to plastic waste pollution of the environment. Curr. Opin. Green. Sustain. Chem. 2021, 30, 100490. [Google Scholar] [CrossRef]
  26. Atiwesh, G.; Mikhael, A.; Parrish, C.C.; Banoub, J.; Le, T.-A.T. Environmental impact of bioplastic use: A review. Heliyon 2021, 7, e07918. [Google Scholar] [CrossRef]
  27. Kumar, R.; Verma, A.; Shome, A.; Sinha, R.; Sinha, S.; Jha, P.K.; Kumar, R.; Kumar, P.; Shubham; Das, S.; et al. Impacts of Plastic Pollution on Ecosystem Services, Sustainable Development Goals, and Need to Focus on Circular Economy and Policy Interventions. Sustainability 2021, 13, 9963. [Google Scholar] [CrossRef]
  28. Moshood, T.D.; Nawanir, G.; Mahmud, F.; Mohamad, F.; Ahmad, M.H.; AbdulGhani, A. Biodegradable plastic applications towards sustainability: A recent innovations in the green product. Clean. Eng. Technol. 2022, 6, 100404. [Google Scholar] [CrossRef]
  29. Alassali, A.; Picuno, C.; Chong, Z.K.; Guo, J.; Maletz, R.; Kuchta, K. Towards Higher Quality of Recycled Plastics: Limitations from the Material’s Perspective. Sustainability 2021, 13, 13266. [Google Scholar] [CrossRef]
  30. Kearney; Walberer, A.; Prabhakar, R.; Rowe, E. Bioplastics Have Shown Promise, but Are They Truly a Sustainable Packaging Solution? 2023. Available online: https://www.kearney.com/service/sustainability/article/bioplastics-have-shown-promise-but-are-they-truly-a-sustainable-packaging-solution (accessed on 8 July 2023).
  31. Rosenboom, J.-G.; Langer, R.; Traverso, G. Bioplastics for a circular economy. Nat. Rev. Mater. 2022, 7, 117–137. [Google Scholar] [CrossRef]
  32. Hidalgo-Carvajal, D.; Muñoz, Á.H.; Garrido-González, J.J.; Carrasco-Gallego, R.; Alcázar Montero, V. Recycled PLA for 3D Printing: A Comparison of Recycled PLA Filaments from Waste of Different Origins after Repeated Cycles of Extrusion. Polymers 2023, 15, 3651. [Google Scholar] [CrossRef]
  33. Taib, N.-A.A.B.; Rahman, M.R.; Huda, D.; Kuok, K.K.; Hamdan, S.; Bakri, M.K.B.; Julaihi, M.R.M.B.; Khan, A. A review on poly lactic acid (PLA) as a biodegradable polymer. Polym. Bull. 2023, 80, 1179–1213. [Google Scholar] [CrossRef]
  34. Armentano, I.; Bitinis, N.; Fortunati, E.; Mattioli, S.; Rescignano, N.; Verdejo, R.; Lopez-Manchado, M.A.; Kenny, J.M. Multifunctional nanostructured PLA materials for packaging and tissue engineering. Prog. Polym. Sci. 2013, 38, 1720–1747. [Google Scholar] [CrossRef]
  35. Mistry, A.N.; Kachenchart, B.; Pinyakong, O.; Assavalapsakul, W.; Jitpraphai, S.M.; Somwangthanaroj, A.; Luepromchai, E. Bioaugmentation with a defined bacterial consortium: A key to degrade high molecular weight polylactic acid during traditional composting. Bioresour. Technol. 2023, 367, 128237. [Google Scholar] [CrossRef] [PubMed]
  36. Maitz, M.F. Applications of synthetic polymers in clinical medicine. Biosurface Biotribology 2015, 1, 161–176. [Google Scholar] [CrossRef]
  37. Moreno, E.; Beltrán, F.R.; Arrieta, M.P.; Gaspar, G.; Muneta, L.M.; Carrasco-Gallego, R.; Yáñez, S.; Hidalgo-Carvajal, D.; Orden, M.U.d.l.; Urreaga, J.M. Technical Evaluation of Mechanical Recycling of PLA 3D Printing Wastes. Proceedings 2020, 69, 19. [Google Scholar] [CrossRef]
  38. Beltrán, F.R.; Arrieta, M.P.; Moreno, E.; Gaspar, G.; Muneta, L.M.; Carrasco-Gallego, R.; Yáñez, S.; Hidalgo-Carvajal, D.; de la Orden, M.U.; Martínez Urreaga, J. Evaluation of the Technical Viability of Distributed Mechanical Recycling of PLA 3D Printing Wastes. Polymers 2021, 13, 1247. [Google Scholar] [CrossRef]
  39. Ramos-Hernández, T.; Robledo-Ortíz, J.R.; González-López, M.E.; del Campo, A.S.M.; González-Núñez, R.; Rodrigue, D.; Pérez Fonseca, A.A. Mechanical recycling of PLA: Effect of weathering, extrusion cycles, and chain extender. J. Appl. Polym. Sci. 2023, 140, e53759. [Google Scholar] [CrossRef]
  40. Wilczyński, K.; Wilczyński, K.J.; Buziak, K. Modeling and Experimental Studies on Polymer Melting and Flow in Injection Molding. Polymers 2022, 14, 2106. [Google Scholar] [CrossRef]
  41. Milisavljevi, J.; Đorđević, M. Tensile testing for different types of polymers. In Proceedings of the 29th Danubia—Adria Symposium on Advances in Experimental Mechanics, Belgrade, Serbia, 26–29 September 2012. [Google Scholar]
  42. Biopdi. Mardoqueu Tensile Testing. 2019. Available online: https://biopdi.com/tensile-testing/ (accessed on 23 July 2023).
  43. MatWeb Shore Durometer Hardness Testing of Rubber and Plastics. 2023. Available online: https://www.matweb.com/reference/shore-hardness.aspx (accessed on 29 July 2023).
  44. Oksiuta, Z.; Jalbrzykowski, M.; Mystkowska, J.; Romanczuk, E.; Osiecki, T. Mechanical and Thermal Properties of Polylactide (PLA) Composites Modified with Mg, Fe, and Polyethylene (PE) Additives. Polymers 2020, 12, 2939. [Google Scholar] [CrossRef]
  45. Shamsuyeva, M.; Endres, H.-J. Plastics in the context of the circular economy and sustainable plastics recycling: Comprehensive review on research development, standardization and market. Compos. Part C 2021, 6, 100168. [Google Scholar] [CrossRef]
  46. Hummel, S.; Obermeier, K.; Zier, K.; Krommes, S.; Schemme, M.; Karlinger, P. Analysis of Mechanical Properties Related to Fiber Length of Closed-Loop-Recycled Offcuts of a Thermoplastic Fiber Composites (Organo Sheets). Materials 2022, 15, 3872. [Google Scholar] [CrossRef] [PubMed]
  47. Finnerty, J.; Rowe, S.; Howard, T.; Connolly, S.; Doran, C.; Devine, D.M.; Gately, N.M.; Chyzna, V.; Portela, A.; Bezerra, G.S.N.; et al. Effect of Mechanical Recycling on the Mechanical Properties of PLA-Based Natural Fiber-Reinforced Composites. J. Compos. Sci. 2023, 7, 141. [Google Scholar] [CrossRef]
  48. MohammadKarimi, S.; Neitzel, B.; Lang, M.; Puch, F. Investigation of the Fiber Length and the Mechanical Properties of Waste Recycled from Continuous Glass Fiber-Reinforced Polypropylene. Recycling 2023, 8, 82. [Google Scholar] [CrossRef]
  49. Graupner, N.; Albrecht, K.; Ziegmann, G.; Enzler, H.; Muessig, J. Influence of reprocessing on fibre length distribution, tensile strength and impact strength of injection moulded cellulose fibre-reinforced polylactide (PLA) composites. Express Polym. Lett. 2016, 10, 647–663. [Google Scholar] [CrossRef]
  50. Thomson, C.I.; Lowe, R.M.; Ragauskas, A.J. Imaging cellulose fibre interfaces with fluorescence microscopy and resonance energy transfer. Carbohydr. Polym. 2007, 69, 799–804. [Google Scholar] [CrossRef]
  51. Billmeyer, F.W. Textbook of Polymer Science; John Wiley & Sons: Hoboken, NJ, USA, 1984. [Google Scholar]
  52. Da Costa, H.M.; Ramos, V.D.; de Oliveira, M.G. Degradation of polypropylene (PP) during multiple extrusions: Thermal analysis, mechanical properties and analysis of variance. Polym. Test. 2007, 26, 676–684. [Google Scholar] [CrossRef]
  53. Pillin, I.; Montrelay, N.; Bourmaud, A.; Grohens, Y. Effect of thermo-mechanical cycles on the physico-chemical properties of poly(lactic acid). Polym. Degrad. Stab. 2008, 93, 321–328. [Google Scholar] [CrossRef]
  54. Fazelinejad, S.; Åkesson, D.; Skrifvars, M. Repeated Mechanical Recycling of Polylactic Acid Filled with Chalk. Prog. Rubber Plast. Recycl. Technol. 2016, 33, 1–16. [Google Scholar] [CrossRef]
  55. Badia, J.D.; Strömberg, E.; Karlsson, S.; Ribes-Greus, A. Material valorisation of amorphous polylactide. Influence of thermo-mechanical degradation on the morphology, segmental dynamics, thermal and mechanical performance. Polym. Degrad. Stab. 2012, 97, 670–678. [Google Scholar] [CrossRef]
  56. Żenkiewicz, M.; Richert, J.; Rytlewski, P.; Moraczewski, K.; Stepczyńska, M.; Karasiewicz, T. Characterisation of multi-extruded poly(lactic acid). Polym. Test. 2009, 28, 412–418. [Google Scholar] [CrossRef]
  57. Yarahmadi, N.; Jakubowicz, I.; Enebro, J. Polylactic acid and its blends with petroleum-based resins: Effects of reprocessing and recycling on properties. J. Appl. Polym. Sci. 2016, 133. [Google Scholar] [CrossRef]
  58. Le Duigou, A.; Pillin, I.; Bourmaud, A.; Davies, P.; Baley, C. Effect of recycling on mechanical behaviour of biocompostable flax/poly(l-lactide) composites. Compos. Part A Appl. Sci. Manuf. 2008, 39, 1471–1478. [Google Scholar] [CrossRef]
  59. Agüero, A.; Morcillo, M.d.C.; Quiles-Carrillo, L.; Balart, R.; Boronat, T.; Lascano, D.; Torres-Giner, S.; Fenollar, O. Study of the Influence of the Reprocessing Cycles on the Final Properties of Polylactide Pieces Obtained by Injection Molding. Polymers 2019, 11, 1908. [Google Scholar] [CrossRef] [PubMed]
  60. Kuciel, S.; Mazur, K.; Hebda, M. The Infuence of Wood and Basalt Fibres on Mechanical, Thermal and Hydrothermal Properties of PLA Composites. J. Polym. Environ. 2020, 28, 1204–1215. [Google Scholar] [CrossRef]
  61. Persico, L.; Giacalone, G.; Cristalli, B.; Tufano, C.; Saccorotti, E.; Casalone, P.; Mattiazzo, G. Recycling Process of a Basalt Fiber-Epoxy Laminate by Solvolysis: Mechanical and Optical Tests. Fibers 2022, 10, 55. [Google Scholar] [CrossRef]
  62. Jagadeesh, P.; Puttegowda, M.; Mavinkere Rangappa, S.; Siengchin, S. Accelerated weathering of sustainable and micro-filler Basalt reinforced polymer biocomposites: Physical, mechanical, thermal, wettability, and water absorption studies. J. Build. Eng. 2023, 80, 108040. [Google Scholar] [CrossRef]
  63. Graupner, N.; Müssig, J. A comparison of the mechanical characteristics of kenaf and lyocell fibre reinforced poly(lactic acid) (PLA) and poly(3-hydroxybutyrate) (PHB) composites. Compos. Part A Appl. Sci. Manuf. 2011, 42, 2010–2019. [Google Scholar] [CrossRef]
  64. Singh, R.; Kumar, R.; Singh, M.; Preet, P. On compressive and morphological features of 3D printed almond skin powder reinforced PLA matrix. Mater. Res. Express 2020, 7, 025311. [Google Scholar] [CrossRef]
  65. Qi, H.J.; Joyce, K.; Boyce, M.C. Durometer Hardness and the Stress-Strain Behavior of Elastomeric Materials. Rubber Chem. Technol. 2003, 76, 419–435. [Google Scholar] [CrossRef]
  66. Carrasco, F.; Santana Pérez, O.; Maspoch, M.L. Kinetics of the Thermal Degradation of Poly(lactic acid) and Polyamide Bioblends. Polymers 2021, 13, 3996. [Google Scholar] [CrossRef]
  67. Effect of Thermal Degradation on Polymer Thermal Properties—TA Instruments. Available online: https://www.tainstruments.com/applications-notes/effect-of-thermal-degradation-on-polymer-thermal-properties/ (accessed on 16 February 2024).
  68. Niaounakis, M. Chapter 2—Properties. In Biopolymers: Processing and Products; Elsevier: Amsterdam, The Netherlands, 2015; pp. 79–116. [Google Scholar] [CrossRef]
  69. Rojas-Gonzáles, A.F.; Carrero-Mantilla, J.I. Thermal degradation kinetic of polylactic acid in multiple extrusions. Ing. Univ. 2015, 19, 189–206. [Google Scholar]
  70. Parallel Twin Screw Extruder VS. Conical Twin Screw Extruder—KAILIDA EXTRUSION 2023. Available online: https://www.kailidaextrusion.com/parallel-twin-screw-extruder-vs-conical-twin-screw-extruder/ (accessed on 17 February 2024).
  71. Wypych, G. Handbook of Nucleating Agents; Elsevier: Amsterdam, The Netherlands, 2021. [Google Scholar]
  72. Ying, Z.; Wu, D.; Zhang, M.; Qiu, Y. Polylactide/basalt fiber composites with tailorable mechanical properties: Effect of surface treatment of fibers and annealing. Compos. Struct. 2017, 176, 1020–1027. [Google Scholar] [CrossRef]
  73. Beltrán, F.R.; Infante, C.; De La Orden, M.U.; Martínez Urreaga, J. Mechanical recycling of poly(lactic acid): Evaluation of a chain extender and a peroxide as additives for upgrading the recycled plastic. J. Clean. Prod. 2019, 219, 46–56. [Google Scholar] [CrossRef]
  74. Lee, D.; Lee, Y.; Kim, I.; Hwang, K.; Kim, N. Thermal and Mechanical Degradation of Recycled Polylactic Acid Filaments for Three-Dimensional Printing Applications. Polymers 2022, 14, 5385. [Google Scholar] [CrossRef]
  75. Mysiukiewicz, O.; Barczewski, M.; Skórczewska, K.; Matykiewicz, D. Correlation between Processing Parameters and Degradation of Different Polylactide Grades during Twin-Screw Extrusion. Polymers 2020, 12, 1333. [Google Scholar] [CrossRef]
Figure 1. Screw geometry utilised for PTSE.
Fibers 13 00098 g001
Figure 2. Screw geometry utilised for CTSE.
Fibers 13 00098 g002
Figure 3. µIM samples of PLA. (A—Top L–R) Virgin PLA, 1 recycling step, 2 recycling steps, 3 recycling steps, 4 recycling steps & 5 recycling steps via PTSE; (Bottom L–R) Virgin PLA, 1 recycling step, 2 recycling steps, 3 recycling steps, 4 recycling steps & 5 recycling steps via CTSE. (B—Top L–R) PLA80BF20, 1 recycling step, 2 recycling steps, 3 recycling steps, 4 recycling steps & 5 recycling steps via PTSE; (Bottom L–R) PLA80BF20, 1 recycling step, 2 recycling steps, 3 recycling steps, 4 recycling steps & 5 recycling steps via CTSE.
Fibers 13 00098 g003
Figure 4. SEM images of PLA100 & PLA80BF20: (A) PLA100 100× magnification (B) PLA100 500× magnification (C) PLA80BF20 100× magnification (D) PLA80BF20 500× magnification. 1. Baseline; 2. CTSE 1; 3. CTSE 5; 4. PTSE 1; 5. PTSE 5.
Fibers 13 00098 g004
Figure 5. Overlay thermogram showing the thermal transitions of the mechanically recycled PLA materials. (top–bottom) virgin PLA, PLA recycled via 1 step PTSE, PLA recycled via 3 steps PTSE, PLA recycled via 5 steps PTSE, PLA recycled via 1 step CTSE, PLA recycled via 3 steps CTSE & PLA recycled via 5 steps CTSE.
Fibers 13 00098 g005
Figure 6. Overlay thermogram showing the thermal transitions of the mechanically recycled PLA/BF materials. (top–bottom) PLA80BF20, PLA80BF20 recycled via 1 step PTSE, PLA80BF20 recycled via 3 steps PTSE, PLA80BF20 recycled via 5 steps PTSE, PLA80BF20 recycled via 1 step CTSE, PLA80BF20 recycled via 3 steps CTSE & PLA80BF20 recycled via 5 steps CTSE.
Fibers 13 00098 g006
Table 1. Terminology related to recycling plastic recreated from [10].
ASTM D7209-06 Standard Definitions [11]Equivalent ISO 15270 Standard Definitions [12]Other Equivalent Terms
Primary recyclingMechanical recyclingRe-extrusion, re-use, closed-loop recycling
Secondary recyclingMechanical recyclingDowngrading
Tertiary recyclingChemical recyclingFeedstock recycling
Quaternary recyclingEnergy recoveryValorisation
Table 2. Material and application properties of Ingeo 4032D recreated from [38].
Physical Properties
Ingeo 4032DASTM Method
Specific Gravity1.24D792
MFR, g/10 min (210 °C, 2.16 kg)7D1238
Melt Density (g/cc)1.08 at 230 °C-
Mechanical Properties
Tensile Strength @ Break, psi (MPa)7700 (53)D882
Tensile Yield Strength, psi (MPa)8700 (60)D882
Tensile Modulus, kpsi (GPa)500 (3.5)D882
Tensile Elongation, %6.0D882
Notched Izod Impact, ft-lb/in (J/m)0.3 (16)D256
Melting Point(°C)155–170-
Table 3. PLA blends formulated for this study.
Sample NamePLA (wt.%)BF (wt.%)
PLA100100-
PLA80BF208020
Table 4. Extrusion profile utilised for CTSE.
Heating ZoneBarrell Temperatures (°C)
Zone 1150
Zone 2160
Zone 3170
Zone 4180
Zone 5190
Die200
Screw speed (RPM)150
Table 5. Parameters for μIM of the samples.
ParameterVirgin PLAPLA-Based Composites
Temperature190 °C—plasticising
180 °C—chamber
170 °C—nozzle
180 °C—plasticising
170 °C—chamber
170 °C—nozzle
Piston diameter14 mm14 mm
Shot size42 mm39 mm
Cooling time30 s23 s
1st injection pressure55 bar60 bar
2nd injection pressure50 bar50 bar
1st injection pressure time3.5 s3.5 s
2nd injection pressure time4.0 s3.0 s
Decompression2 mm2 mm
Table 6. Tensile values for all tested specimens (n = 5). (σ) standard deviation, (δ) tensile stress at break, (Ε) Young’s modulus and (ε) percentage strain at break.
Max. Load (N)σ (n = 5)δ (MPa)σ (n = 5)Ε (MPa)σ (n = 5)ε (%)σ (n = 5)
PLA100828.612.972.81.11483.549.19.72.4
PLA100 PTSE 1801.69.570.40.81514.522.812.81.7
PLA100 PTSE 5795.825.269.92.21491.736.610.93.1
PLA100 CTSE 182618.772.61.61510.851.612.51.0
PLA100 CTSE 5770.117.867.61.61458.233.38.30.8
PLA80BF20922.045.581.04.01714.896.16.70.5
PLA80BF20PTSE 1901.917.379.21.51772.5106.07.10.8
PLA80BF20PTSE 5758.37.466.60.71621.893.56.60.3
PLA80BF20CTSE 1812.923.471.42.11537.6142.47.10.3
PLA80BF20CTSE 5706.514.562.11.31553.961.46.00.5
Table 7. Results of shore hardness testing of PLA and PLA-based samples.
Sample IDShore D HardnessΔ (n = 5)
PLA10080.1±0.8
PLA100 PTSE 180.8±0.6
PLA100 PTSE 580.1±1.6
PLA100 CTSE 180.4±0.4
PLA100 CTSE 580.3±0.8
PLA80BF20 83.5±0.9
PLA80BF20PTSE 181.5±0.6
PLA80BF20PTSE 582.6±0.9
PLA80BF20CTSE 183.1±1.0
PLA80BF20CTSE 583.6±1.2
Table 8. Thermal transitions identified for PLA. PTSE: Parallel twin screw extrusion & CTSE: Conical twin screw extrusion. (Tg) glass transition temperature, (Tc) temperature of cold crystallization, (∆Hc) cold crystallization enthalpy, (Tm) melting temperature, (∆Hm) fusion enthalpy and (Xc) percentage crystallinity.
Sample IDTg (°C)Tc (°C)HcTm (°C)HmXc (%)
PLA10056.30--166.573.213.42
PLA100 PTSE 156.98106.5027.53169.0536.0138.43
PLA100 PTSE 357.13103.8028.33168.9943.6046.51
PLA100 PTSE 555.2896.1320.08168.1648.3051.52
PLA100 CTSE 156.97108.7037.13169.6740.1042.79
PLA100 CTSE 354.84101.3632.95168.3740.4443.16
PLA100 CTSE 554.5190.509.88167.8646.9050.00
PLA80BF2056.47107.9924.41169.7028.1430.03
PLA80BF20 PTSE 159.64111.1731.93169.5632.7334.93
PLA80BF20 PTSE 354.85102.1524.15168.3431.7333.87
PLA80BF20 PTSE 555.4097.8120.84167.9939.1741.80
PLA80BF20 CTSE 156.48106.8228.83169.3631.4533.56
PLA80BF20 CTSE 354.4795.1812.66167.7432.5934.79
PLA80BF20 CTSE 556.56--167.5234.4036.71
Table 9. Material properties ascertained via GPC.
Sample IDMn (g/mol)% DecreaseMw (g/mol)% Decrease
PLA10049,2710.00132,9540.00
PLA100 PTSE 146,1826.27115,08913.44
PLA100 PTSE 335,98526.9797,03127.02
PLA100 PTSE 532,94433.1493,58829.61
PLA100 CTSE 146,3166.00119,8519.86
PLA100 CTSE 337,52123.85104,42821.46
PLA100 CTSE 528,30742.5574,11644.25
PLA80BF2053,5270.00130,1020.00
PLA80BF20 PTSE 148,4629.46120,8157.14
PLA80BF20 PTSE 344,11617.58105,69118.76
PLA80BF20 PTSE 535,51433.6590,74330.25
PLA80BF20 CTSE 150,2046.21122,5785.78
PLA80BF20 CTSE 336,18132.4182,51836.57
PLA80BF20 CTSE 521,82859.2257,67455.67
Disclaimer/Publisher’s Note: The statements, opinions and data contained in all publications are solely those of the individual author(s) and contributor(s) and not of MDPI and/or the editor(s). MDPI and/or the editor(s) disclaim responsibility for any injury to people or property resulting from any ideas, methods, instructions or products referred to in the content.

