Highlights
What are the main findings?
- This research developed custom software add-ins for data processing and statistical analysis of cotton fiber length distributions using the mixed Weibull distribution model.
- The add-ins were generated for JMP and MS Excel and are available to cotton researchers for use with data from the Advanced Fiber Information System (AFIS).
What is the implication of the main finding?
- Using the tools developed in this research, breeders, geneticists, and processors can effectively parameterize cotton fiber length distribution and extract the intrinsic and process-related factors shaping the distribution patterns.
- Breeders can use the tools to better discriminate between varieties based on intrinsic length, processors can optimize ginning and spinning to minimize fiber damage and to classify cottons based on length distribution parameters.
Abstract
In this study, software add-ins were developed and presented to allow data processing and statistical analysis of the unique shape of cotton fiber length distribution. The approach uses VBA coding in Excel to process the data, as well as the JMP 14-17 application and add-in builder tools to fit finite mixture models to empirical fiber length distributions. The resulting model derives a parametric expression for the fiber length probability density function. The analysis add-in was applied and validated on a wide range of empirical length distributions and proved to parameterize the complex distribution patterns with an excellent goodness of fit. Both tools were compiled into installable add-ins that extended the capabilities of MS Excel for the processing of AFIS distribution reports and the statistical toolbox of JMP using the Application Builder JSL coding. Installable add-ins, along with a user manual, are available for download by cotton researchers.
1. Introduction
Fiber length measurement is a longstanding problem in the characterization of textile materials. This is particularly challenging in applications using natural fibers, such as cotton. Length has always been considered the most crucial of all measured characteristics of cotton. Fiber length is a strong predictor of yarn quality and processing performance in spinning mills [1,2]. Thus, the market value and end use of fibers are largely determined by their length. Fiber length is a critical measurement in the raw stage of cotton fibers to allow variety ranking in breeding efforts and bale classification in commercial settings. Classification data obtained after ginning allow the selection of appropriate fiber quality ranges for targeted applications [3,4]. Subsequently, fiber length is typically monitored throughout the process to ensure quality and productivity in successive steps. Beyond the array of parameters commonly used to characterize fiber length (e.g., HVI staple and uniformity), it is well established that consideration of the distribution of fiber length is crucial for understanding the key interactions that determine the industrial performance and use value of cotton [5,6,7,8]. Issues related to fiber length distribution have become a major concern in the global cotton industry (e.g., short fiber content and length uniformity). Understanding fiber trait interactions and the importance of distribution data in the interpretation of fiber quality has been highlighted as a critical need in breeding [7,8,9], as well as in cotton ginning, classification, and processing [10,11,12]. Consequently, there is an incessant need to produce cotton varieties with improved length distribution and to optimize post-harvest processes that alter length distributions to foster the competitiveness of cotton in the textile market [8,12,13].
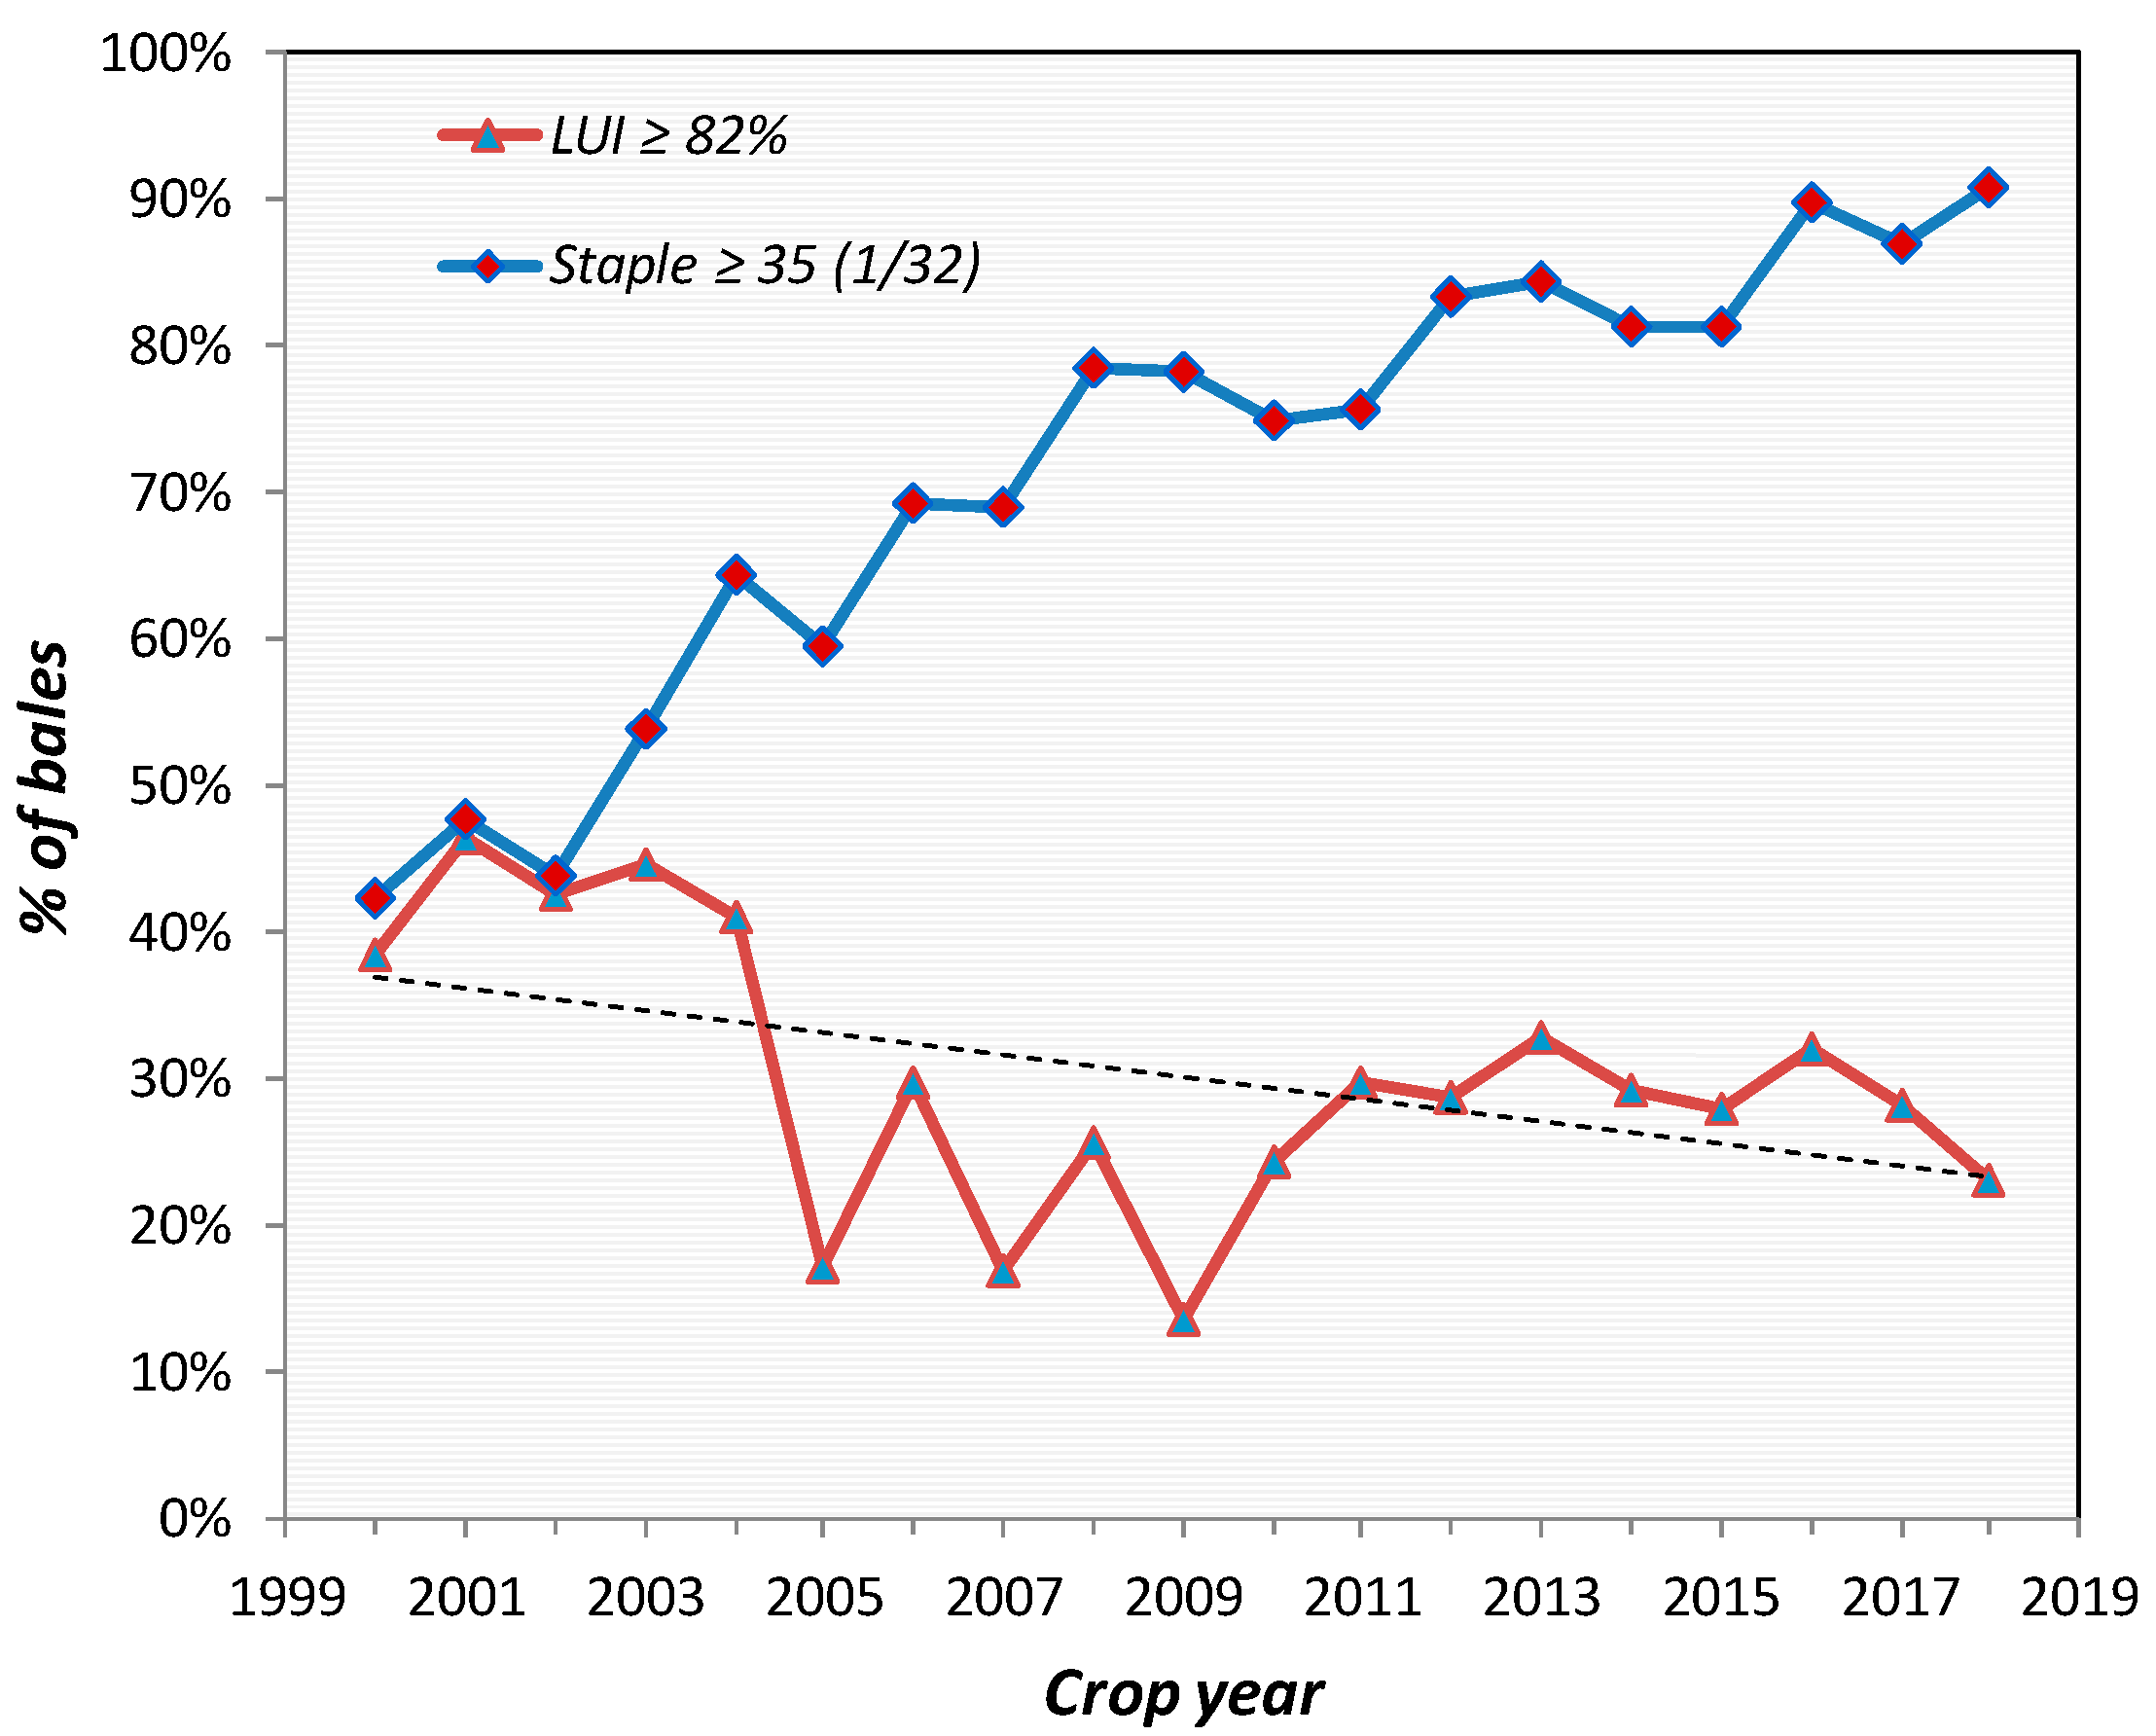
Unfortunately, reliably characterizing the length distribution in a bulk fiber sample is challenging, and existing solutions present multiple biases and shortcomings. The first major challenge stems from the intrinsic variability of the single fiber length, which is typically determined by complex interactions involving genetic, environmental, and processing factors [5,14]. As a result, obtaining a representative sample from a bulk fiber lot is challenging. Consequently, despite continuous efforts by cotton breeders and geneticists to improve both the yield and quality of cotton cultivars available to US farmers, improvements in the length uniformity index (LUI) have been marginal at best. Breeding efforts to improve the mean values of fiber length have been consistent and successful over the past decades [8,15,16]. Thus, crop quality results over the last two decades have shown a notable improvement in staple length (upper half mean length or UHML). Unfortunately, there have been no commensurate improvements in length uniformity, and the lack of cotton with both improved uniformity and improved staple may reduce the portion of the crop that could effectively compete in the high-value-added export market. For instance, the results in Figure 1 show that the percentage of bales that meet or exceed what is considered the international market base of 35 (1/32 inch) staple length has increased consistently from approximately 40% in 2000 to more than 90% in the 2018 crop. On the other hand, the curve representing the portion of the crop meeting the threshold for the Length Uniformity Index (LUI) showed no sign of improvement. On the contrary, the trend shows an overall downward pattern, with only 23% of the US crop exhibiting a uniformity of 82% or better in 2018, compared to close to 40% in 2000.
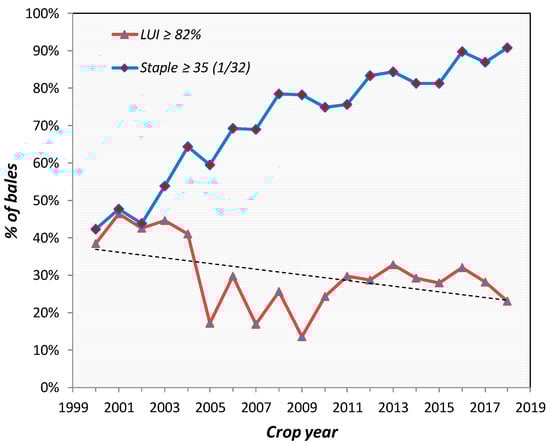
Figure 1.
Percentage of the US cotton crop meeting the international market “base” for staple length (Staple ≥35) and Length Uniformity Index (LUI ≥ 82%). As the staple length improves at a sustained rate, the length uniformity tends to stagnate and even deteriorate. (Results compiled based on classing office data, EFSTM USCROP [17]; x-axis shows crop year and y-axis the % of bales observed in the stated ranges).
The factors affecting the length distribution of cotton fibers are complex. Dispersion or lack of uniformity of fiber length can be associated with sources of different natures and impacted by complex interactions involving genetics, field practices, and growth conditions, as well as stresses put on the fibers in harvesting, ginning, and textile processing [18,19]. Due to the combination of these effects, the length distributions of cotton fibers have complex patterns and exhibit features that are often not adequately described using the usual summary statistics. Thus, there has traditionally been a lack of focus on length distribution because of the absence of reliable analytic tools for interpreting and exploiting fiber trait distributions in breeding programs, despite the availability of such data provided by single-fiber testing instruments (e.g., Advanced Fiber Information System or AFIS, by USTER Technologies AG, Switzerland).
This remains a serious impediment to improving length uniformity because breeders cannot effectively include distribution parameters in their selection criteria without the ability to parameterize and quantify the sources of variability in fiber trait distributions. Recent research by Hinds et al. [20] demonstrated the statistical stability of the AFIS length distribution measurement, which suggests the ability to use the instrument for the purpose of selecting against improved fiber length distributions in breeding programs. However, the research also concluded that the standard length parameters provided in the AFIS reports (i.e., Upper Quartile Length, Mean Length, and Short Fiber Content) do not capture the variability in fiber length distribution shapes [20].
Early attempts to parameterize the cotton fiber length distribution have focused on breakage models [21,22]. Other studies have used non-parametric approaches to extract the probability density function for cotton fibers [23] and pulp fibers used in paper [24]. Research on parametric modeling approaches has shown adequate parameterization of the complex distribution patterns of cotton fiber length generated by the Advanced Fiber Information System (AFIS) by USTER Technologies AG [5,14,25,26,27]. The fiber length distribution was shown to follow a mixed Weibull probability function [5,14,25,26,27] with a PDF expressed as follows:
where, is the mixing weight, η1 and η2 are the scale parameters, and β1 and β2 are the shape parameters of the distribution components.
Using the distribution patterns extracted from the AFIS individual fiber measurement, new length parameters can be extracted, and useful inferences can be made about the intrinsic and process-related factors determining its shape [5,14]. Approaches resulting from this research have been shown to adequately discriminate between cotton samples with diverse distribution shapes and a broad range of interactions among fiber properties [10,28] as well as predict yarn properties [27].
The research reported in this paper utilizes the approaches discussed above to enable geneticists, agronomists, and processors to interpret cotton fiber length distribution data. The goal is to provide reliable tools that will help exploit fiber length distribution data as provided by the AFIS (USTER Technologies AG). Specifically, data processing and statistical modeling tools were developed for fiber length distributions using Excel VBA (Microsoft) and JMP script coding (JMP Statistical Discovery) to provide standalone procedures and add-ins for cotton researchers to model length distributions. The tools developed in this research were compiled as installable add-ins and are shared in this paper. They can be downloaded from the Supplementary Materials.
2. Methodology and Approach
The tools developed in this research focus on the AFIS measurement of fiber length by number (Ln). The length by number measurement has been shown to more adequately characterize the length distribution and provide a statistically unbiased measure of short fiber content as opposed to length by weight (Lw). The AFIS distribution data are provided in the histogram report generated by the machine in various formats, depending on the version of the equipment and the data reporting tool used. For the purpose of this research, data were collected from four different AFIS report versions in three major laboratories. As multiple versions of AFIS files are available, the code takes into account different versions of AFIS files (based on labs and software updates) and remains customizable in the case of further updates. The primary objective is to allow seamless use of fiber histogram data in the Excel format from AFIS reports, as provided by the laboratories, to then perform and output length distribution analysis using JMP. This was achieved using a combination of VBA coding within Microsoft Excel and JSL (JMP Script Language) scripting within JMP-Pro (formerly by SAS Institute 9.4 and currently by JMP Statistical Discovery 2009). Multiple steps were necessary to develop and execute these procedures.
- (1)
- Data cleaning and formatting
- (2)
- JMP Application Builder coding
- (3)
- Converting the JMP application into an installable JMP Add-In for distribution to users.
- (4)
- Validation
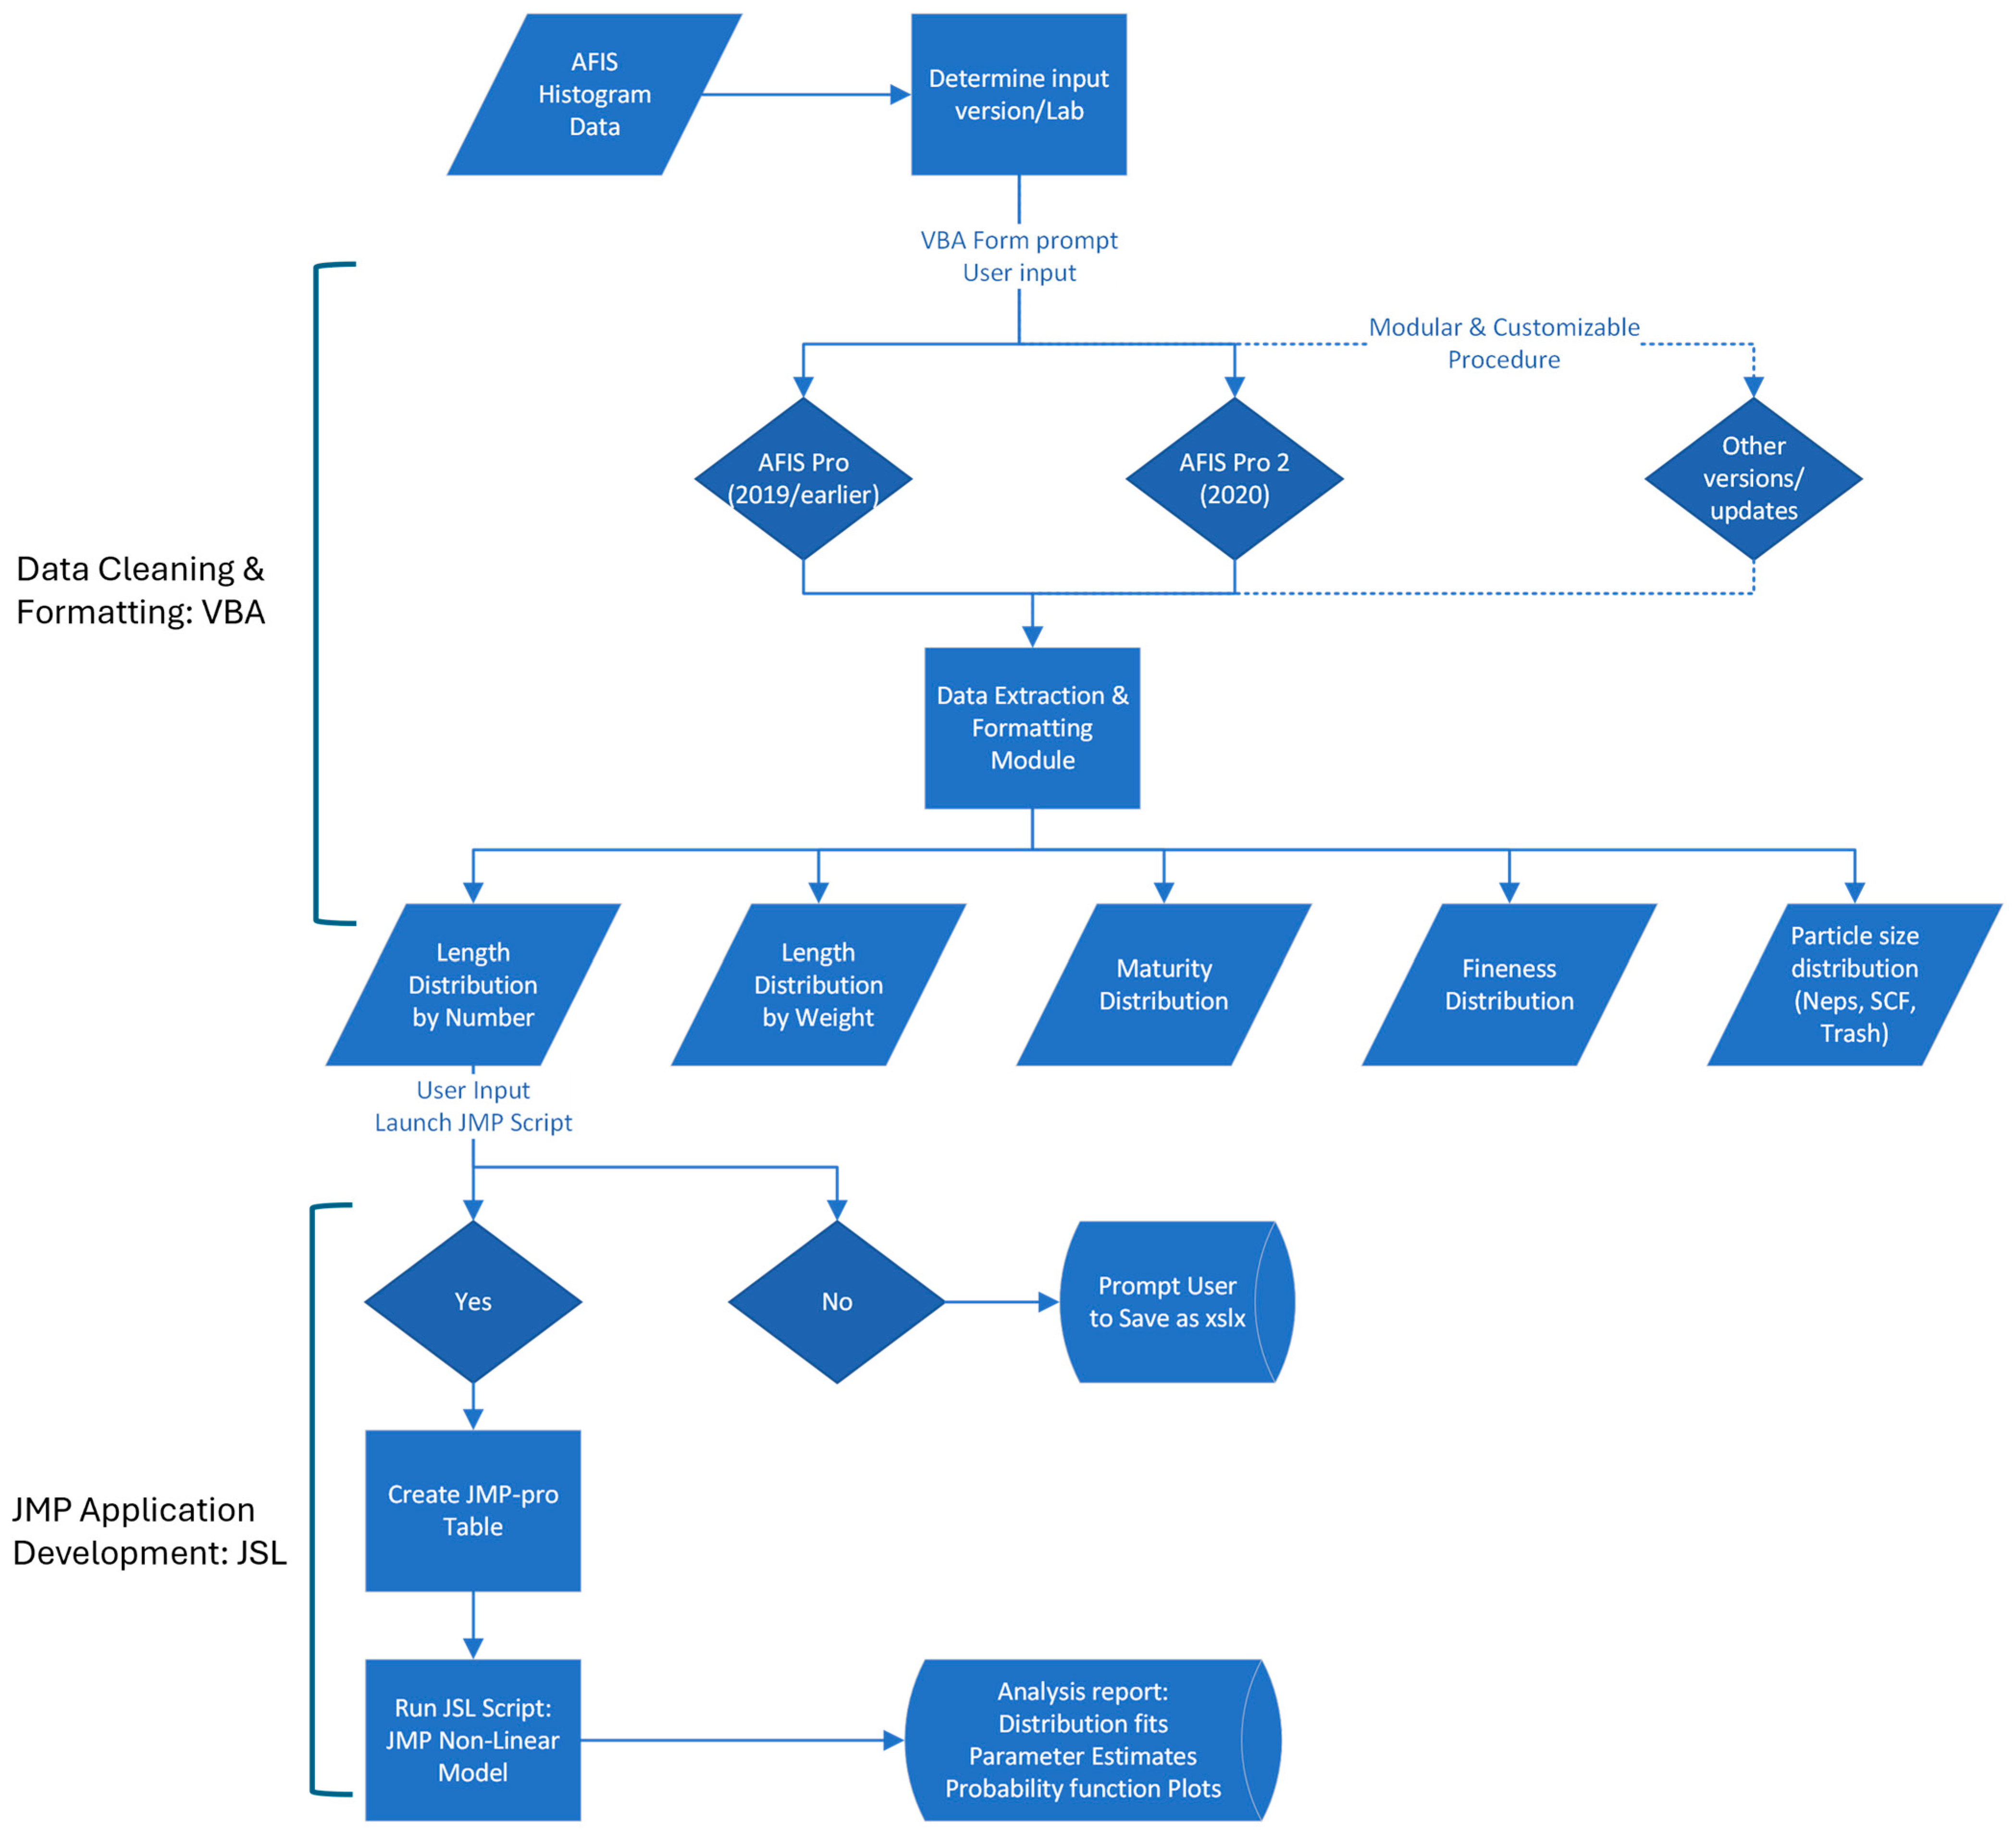
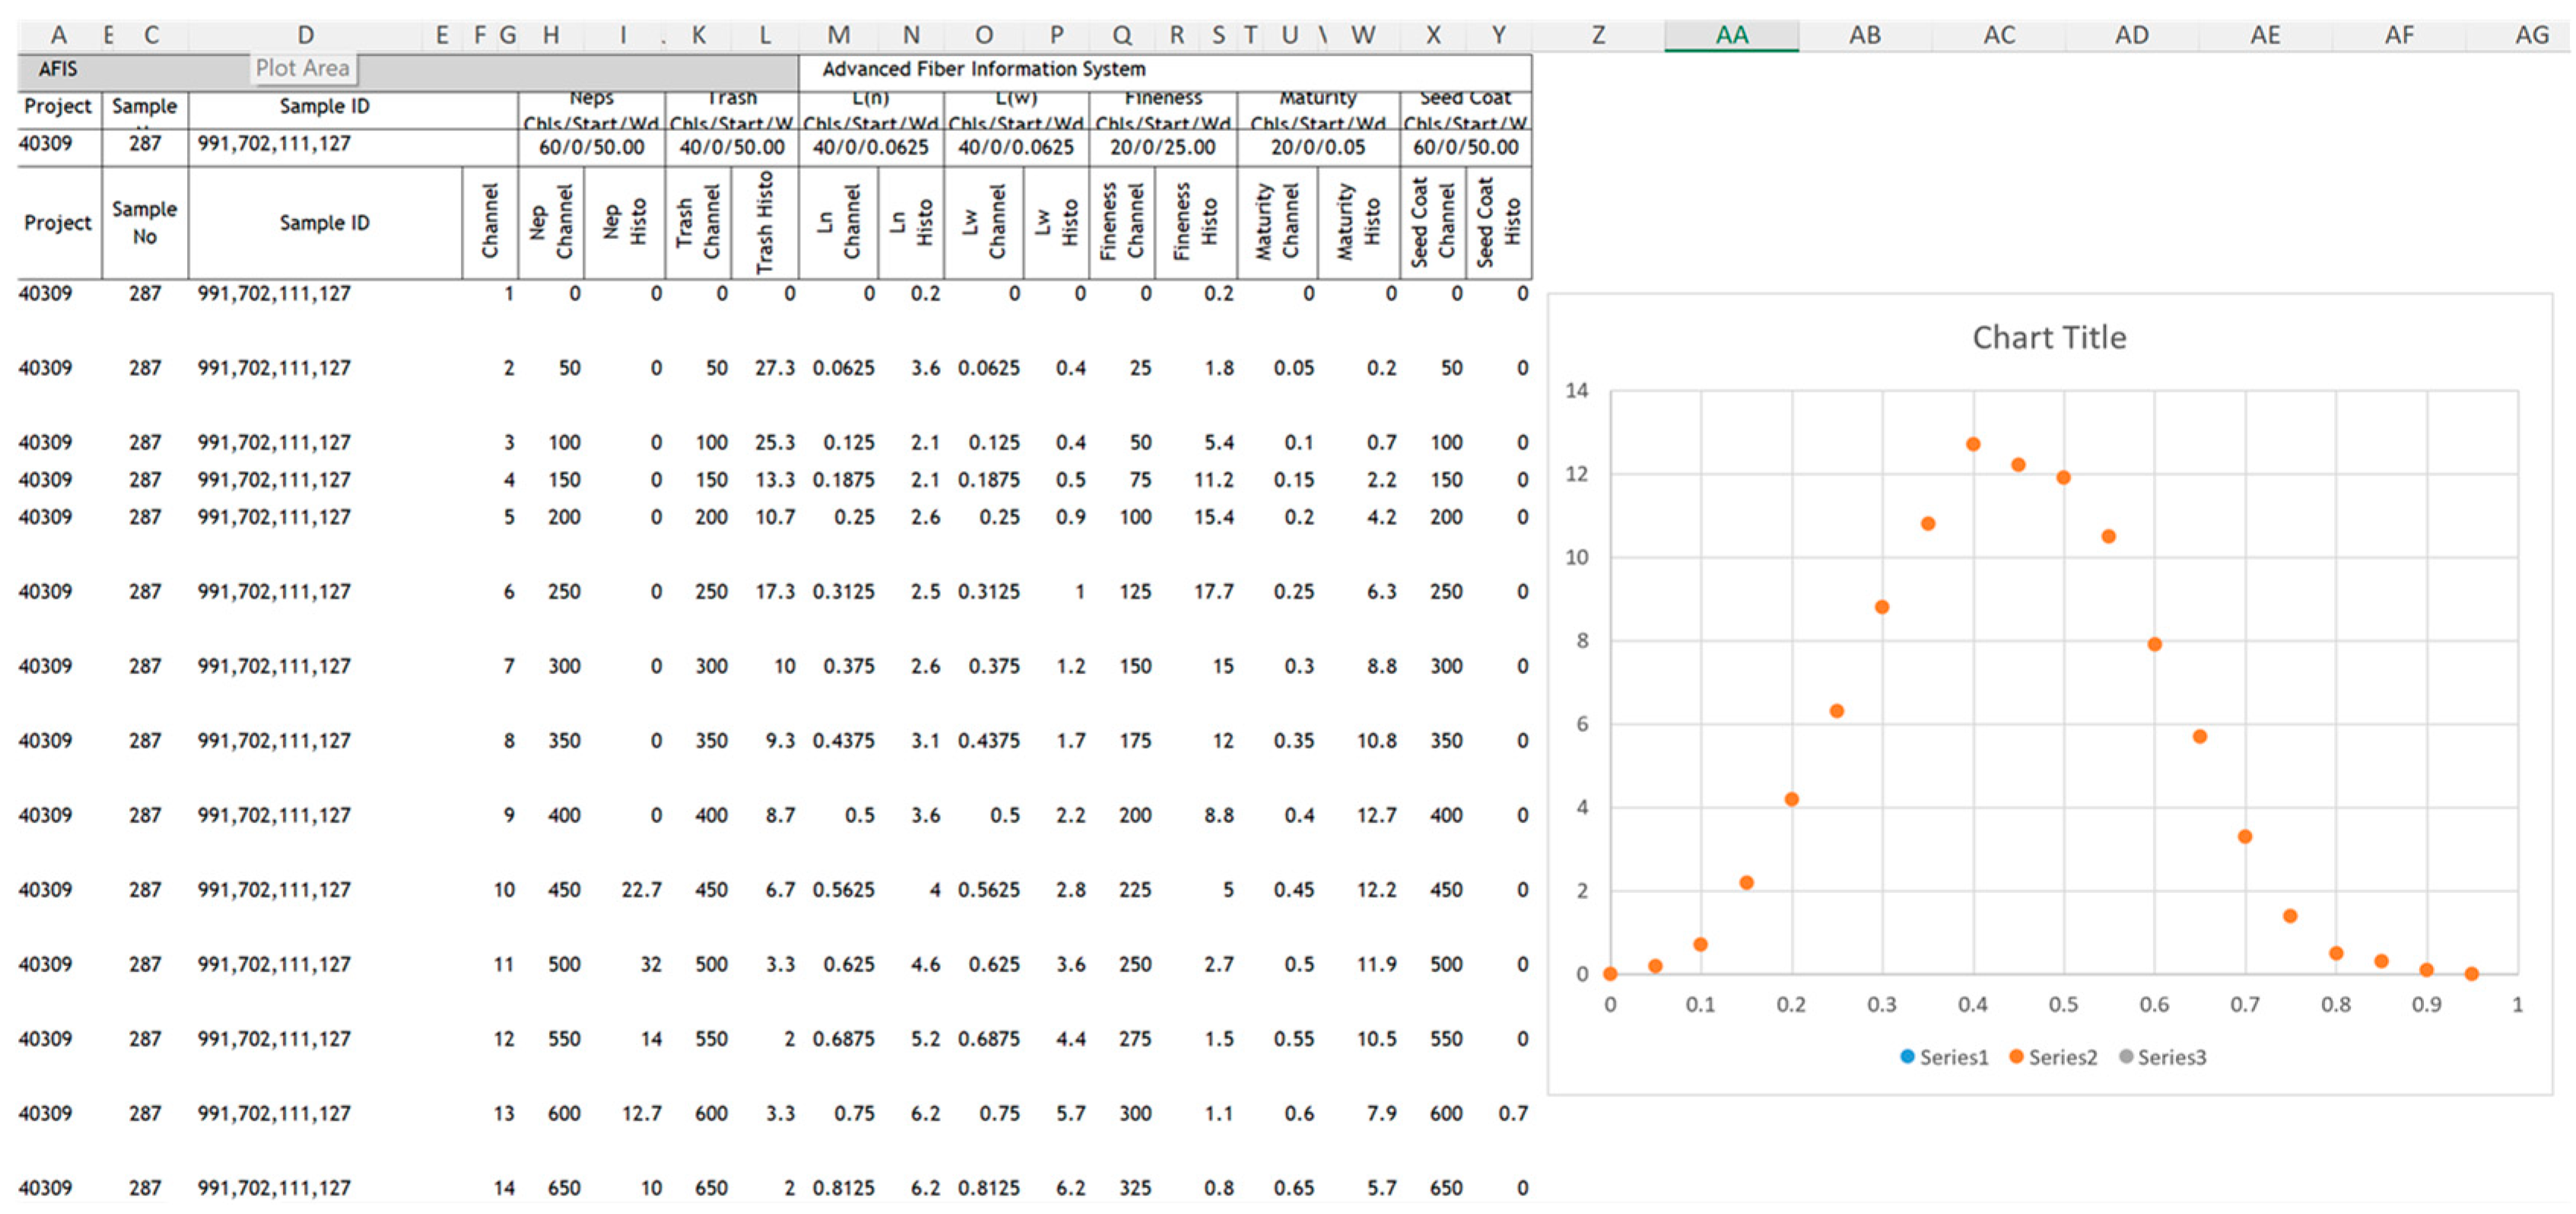
Figure 2 shows a flow chart of the development process and resulting procedure. The initial step in data processing uses Microsoft Excel VBA code, leading to an Excel add-in that cleans and formats the data prior to analysis using JMP. An example of the histogram data report provided by a recent version of AFIS-Pro 2 is shown in Figure 3. To allow modeling and adequate analysis using JMP, the data required substantial cleaning and reformatting, which was achieved using the VBA code.

Figure 2.
Flowchart of the AFIS histogram data analysis procedure.
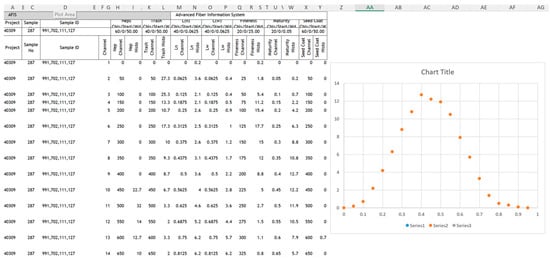
Figure 3.
Example raw data provided by AFIS in the form of a histogram.
3. Results
3.1. AFIS Report Processing
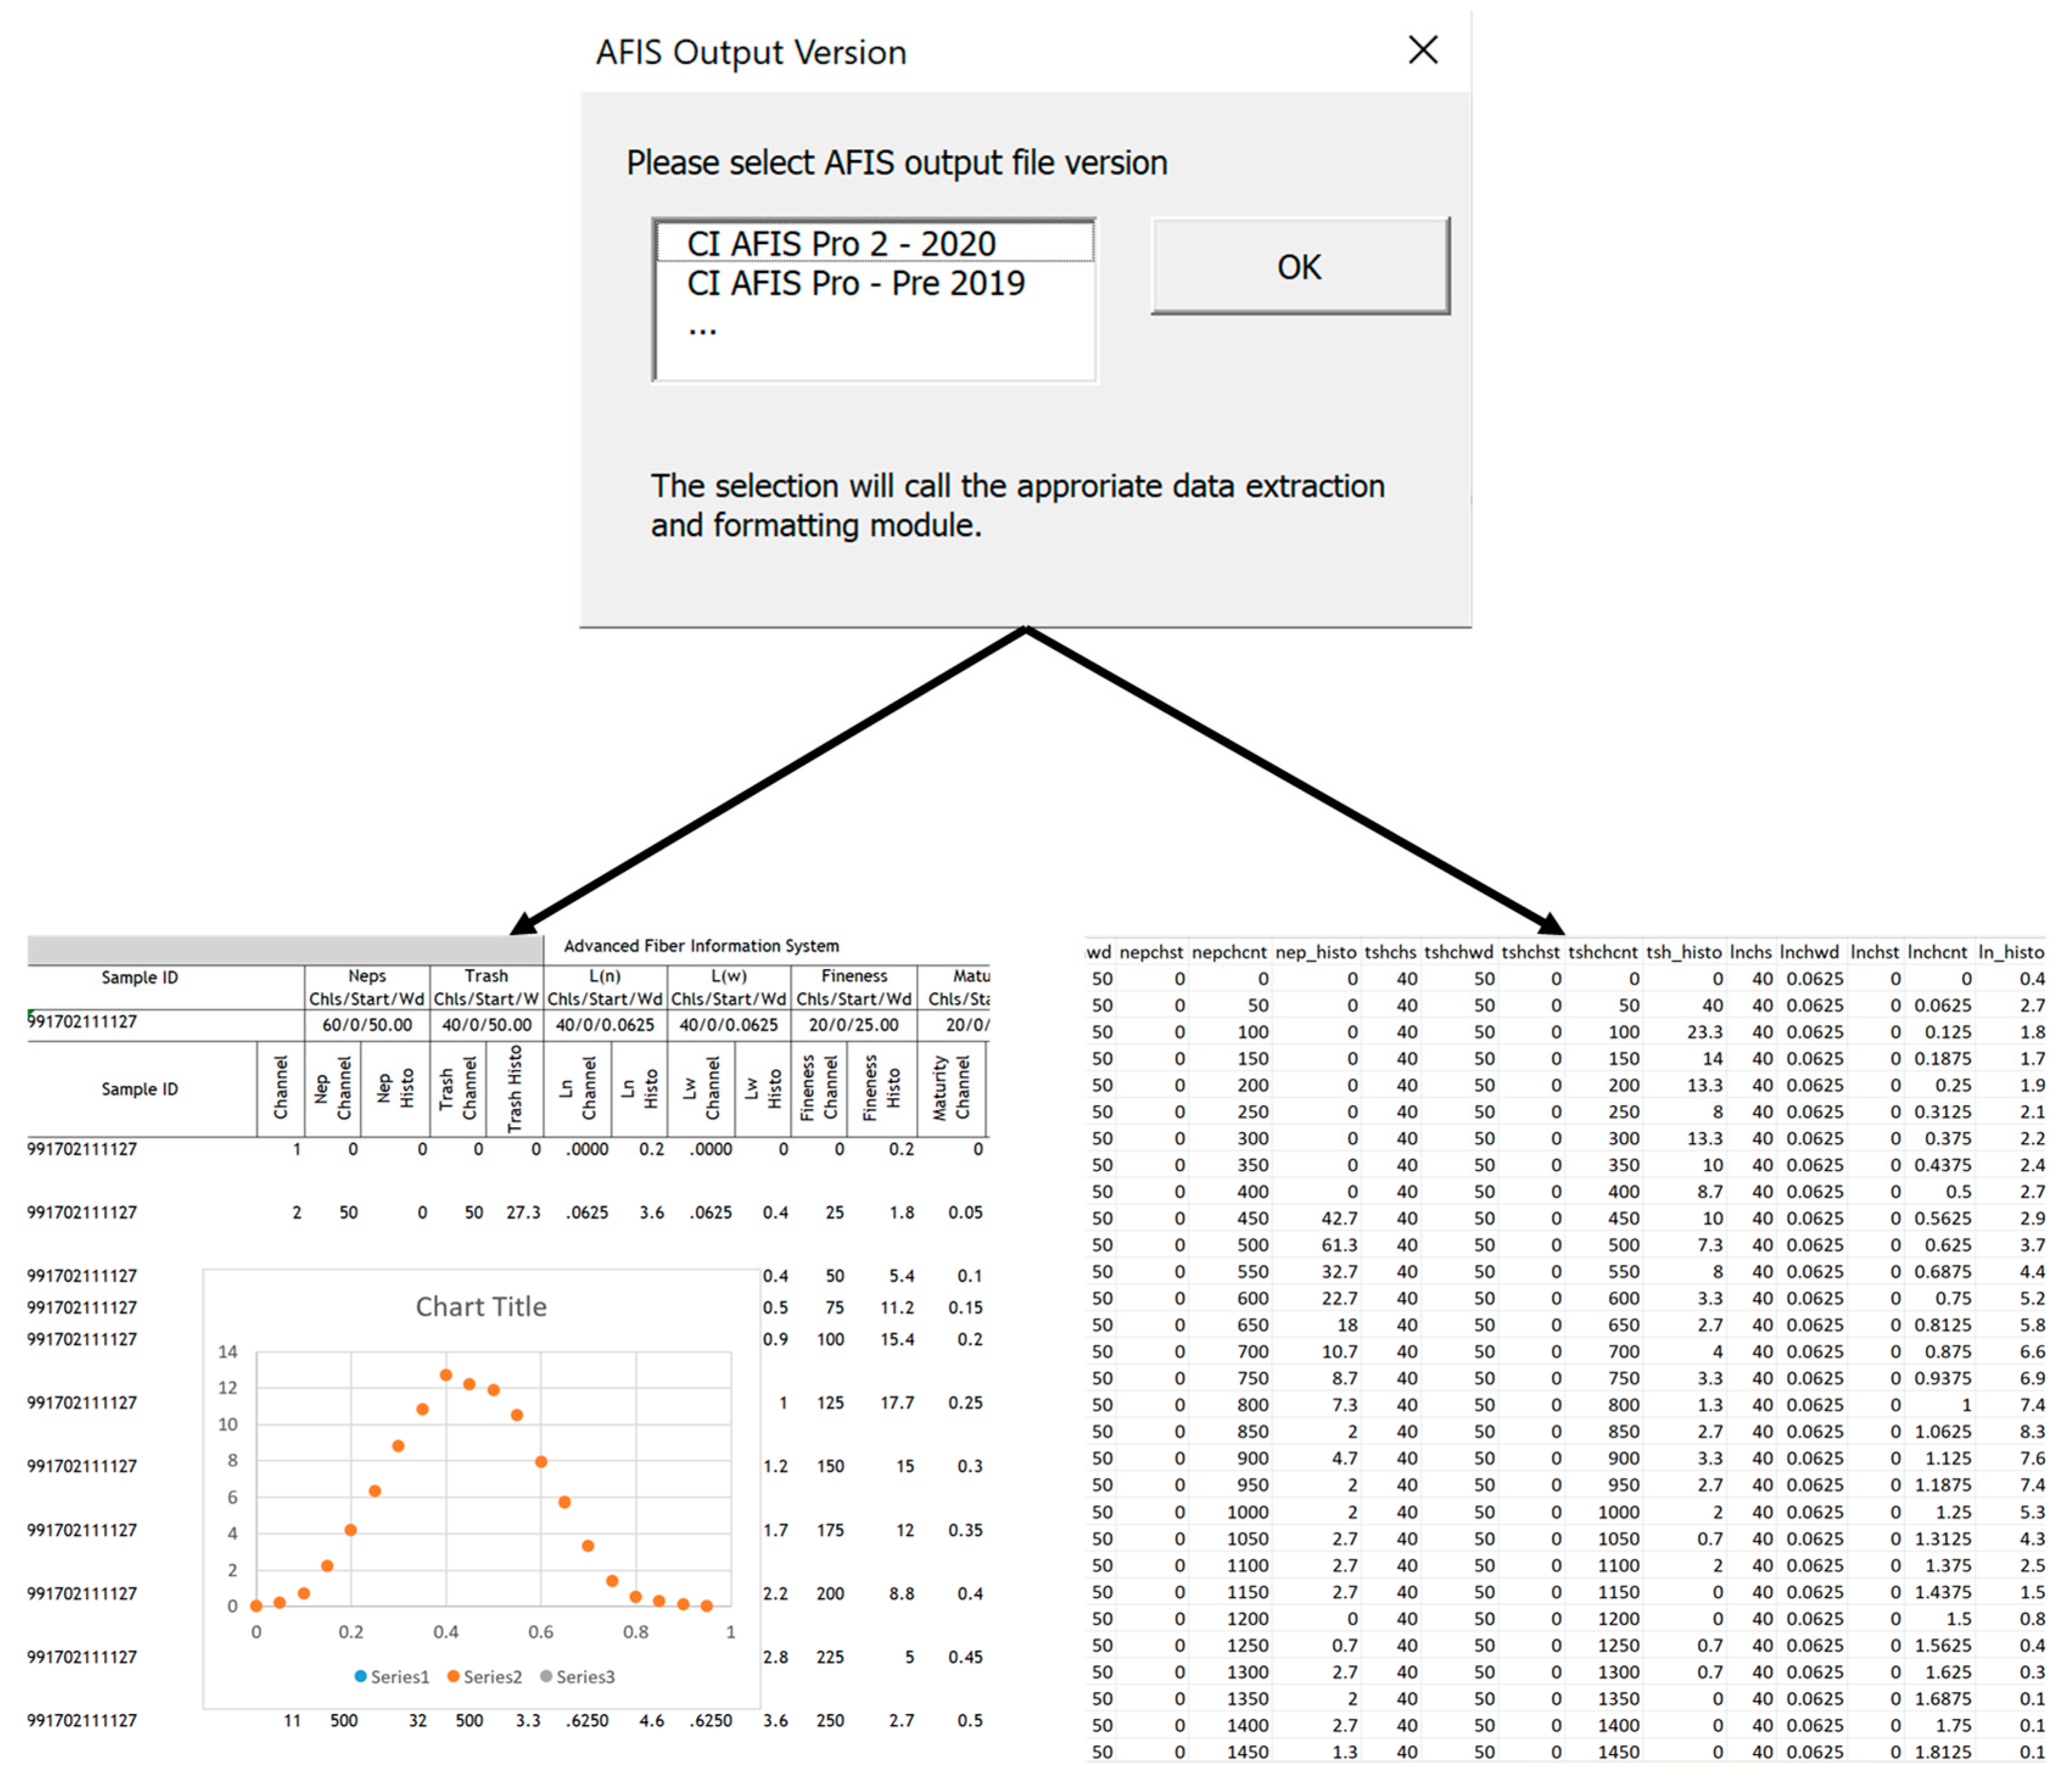
In the developed VBA add-in, the user is first prompted to select the lab and AFIS output version (Figure 4). The procedure was developed for four different versions of AFIS output files. The code is customized for the specific output version. The procedure was written in a modular and customizable structure in order to allow for outputs from other laboratories and potential future AFIS updates. The functions used within the VBA include a customized UserForm dialogue [29,30] to allow the selection of the lab report version. User input then launches a series of VBA subs that add one worksheet for each fiber property (Figure 5) using the “Sheets.Add” function in VBA. In each worksheet, the code uses the “AutoFilter” function [29] to clean the data and format the table based on the rows available for each fiber property.
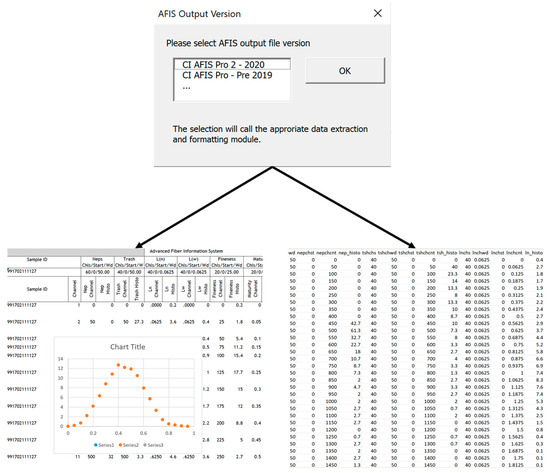
Figure 4.
User prompt for the file version.
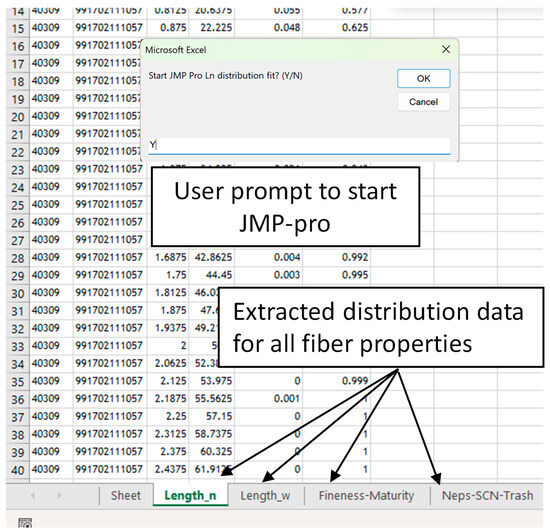
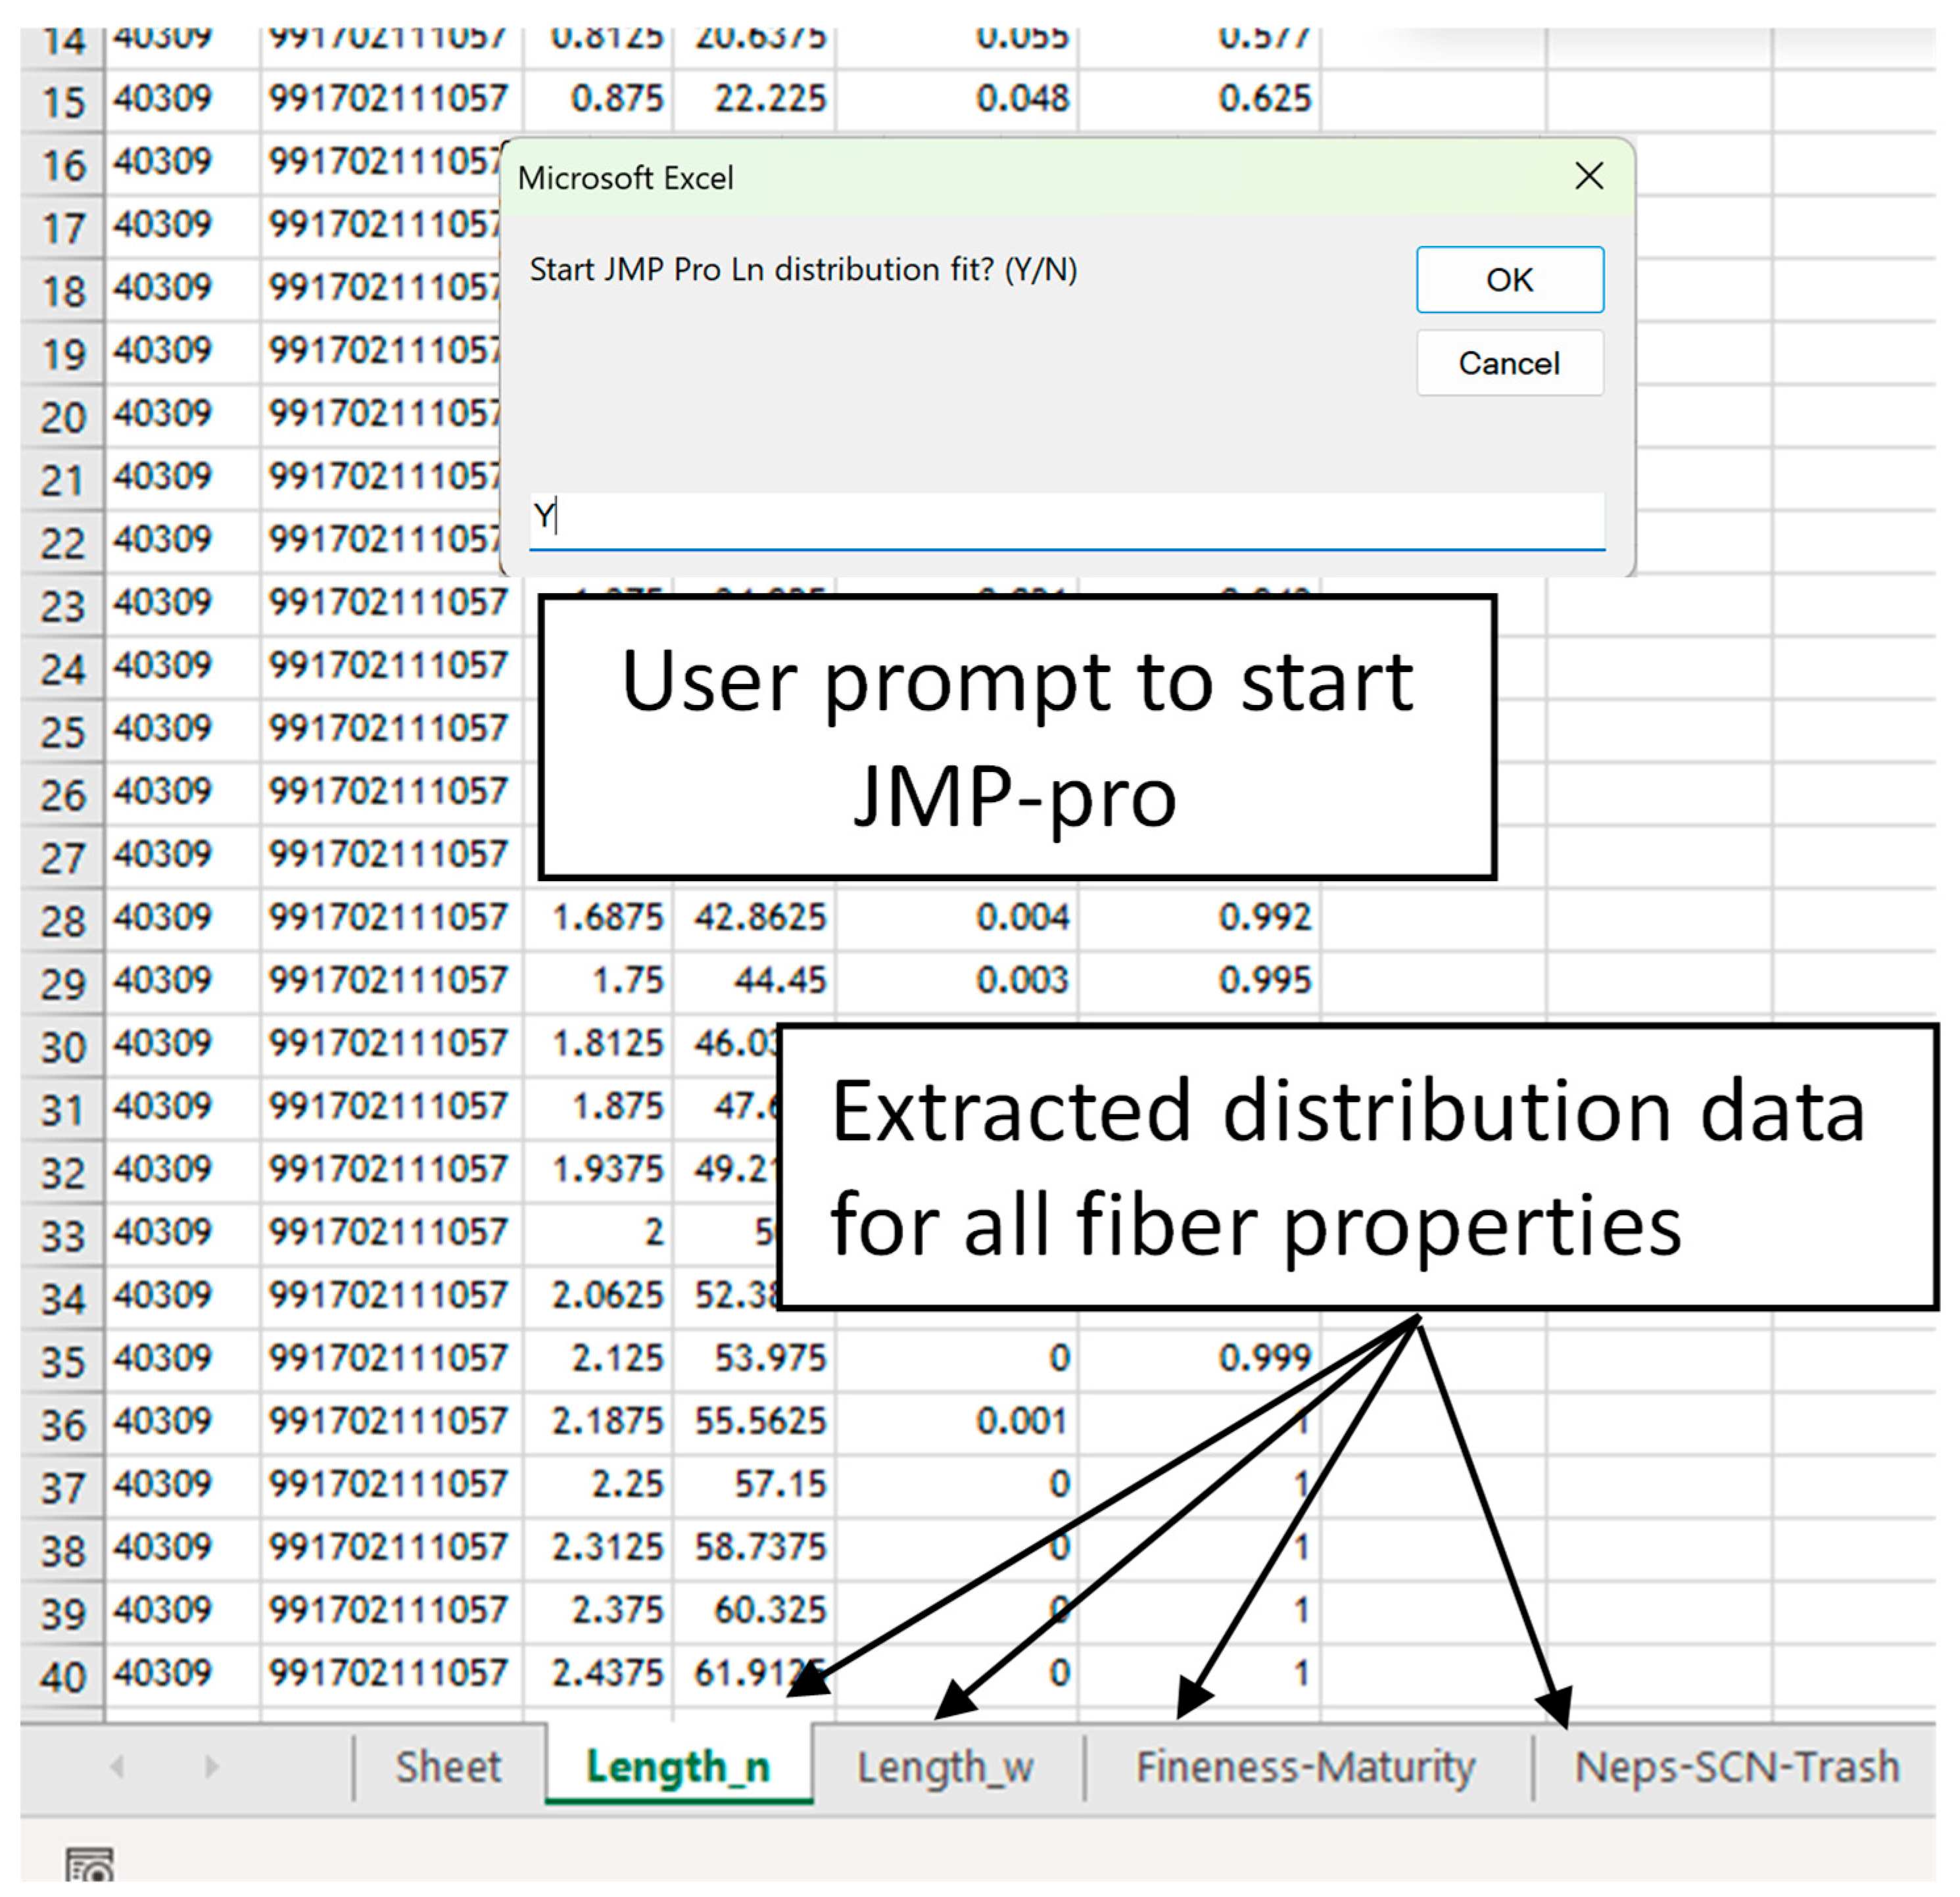
Figure 5.
Extracted distribution data for fiber properties and user prompt to start JMP-pro.
The user input calls the appropriate module for the AFIS output version. The code is then executed to extract and format the distribution data for each fiber property available in the AFIS file, including the length, maturity, fineness, and particle size distributions for neps, seed coat neps, and trash. The data are automatically extracted and organized as a stacked table in a separate spreadsheet for each fiber property (Figure 5). Histogram data is then used to compute the empirical probability density and cumulative distribution (i.e., Ln_Prob and Ln_C for length by number in Figure 5). The customized code is made available in the form of an installable, user-friendly Excel Add-In. This allows the extension of Excel application functionality across multiple platforms.
The steps above allow consistent and quick processing of AFIS outputs from multiple versions of the instrument report to allow statistical analysis of the distribution data. At this point, the computed probability values are in the appropriate format to proceed with the statistical analysis in JMP. The user is prompted to select the next step, i.e., whether to continue with the JSL script in JMP or save the processed Excel file for future analysis.
3.2. JMP Length Distribution Analysis Application Development
The JMP Application Builder toolset [31] was used to develop the user interface and the associated JSL code for the fiber length distribution analysis. The analysis uses the JMP non-linear model feature [32] to fit the customized distribution function, as shown in Equation (1). With the software add-in, the JSL code automatically creates the parameterized equation for the model and extends the set of predefined models available in JMP [32]. Following the distribution function fit through the non-linear modeling platform, the JSL code scripts the Graph Builder [31] feature of JMP to plot the model Probability Density Function against the observed data.
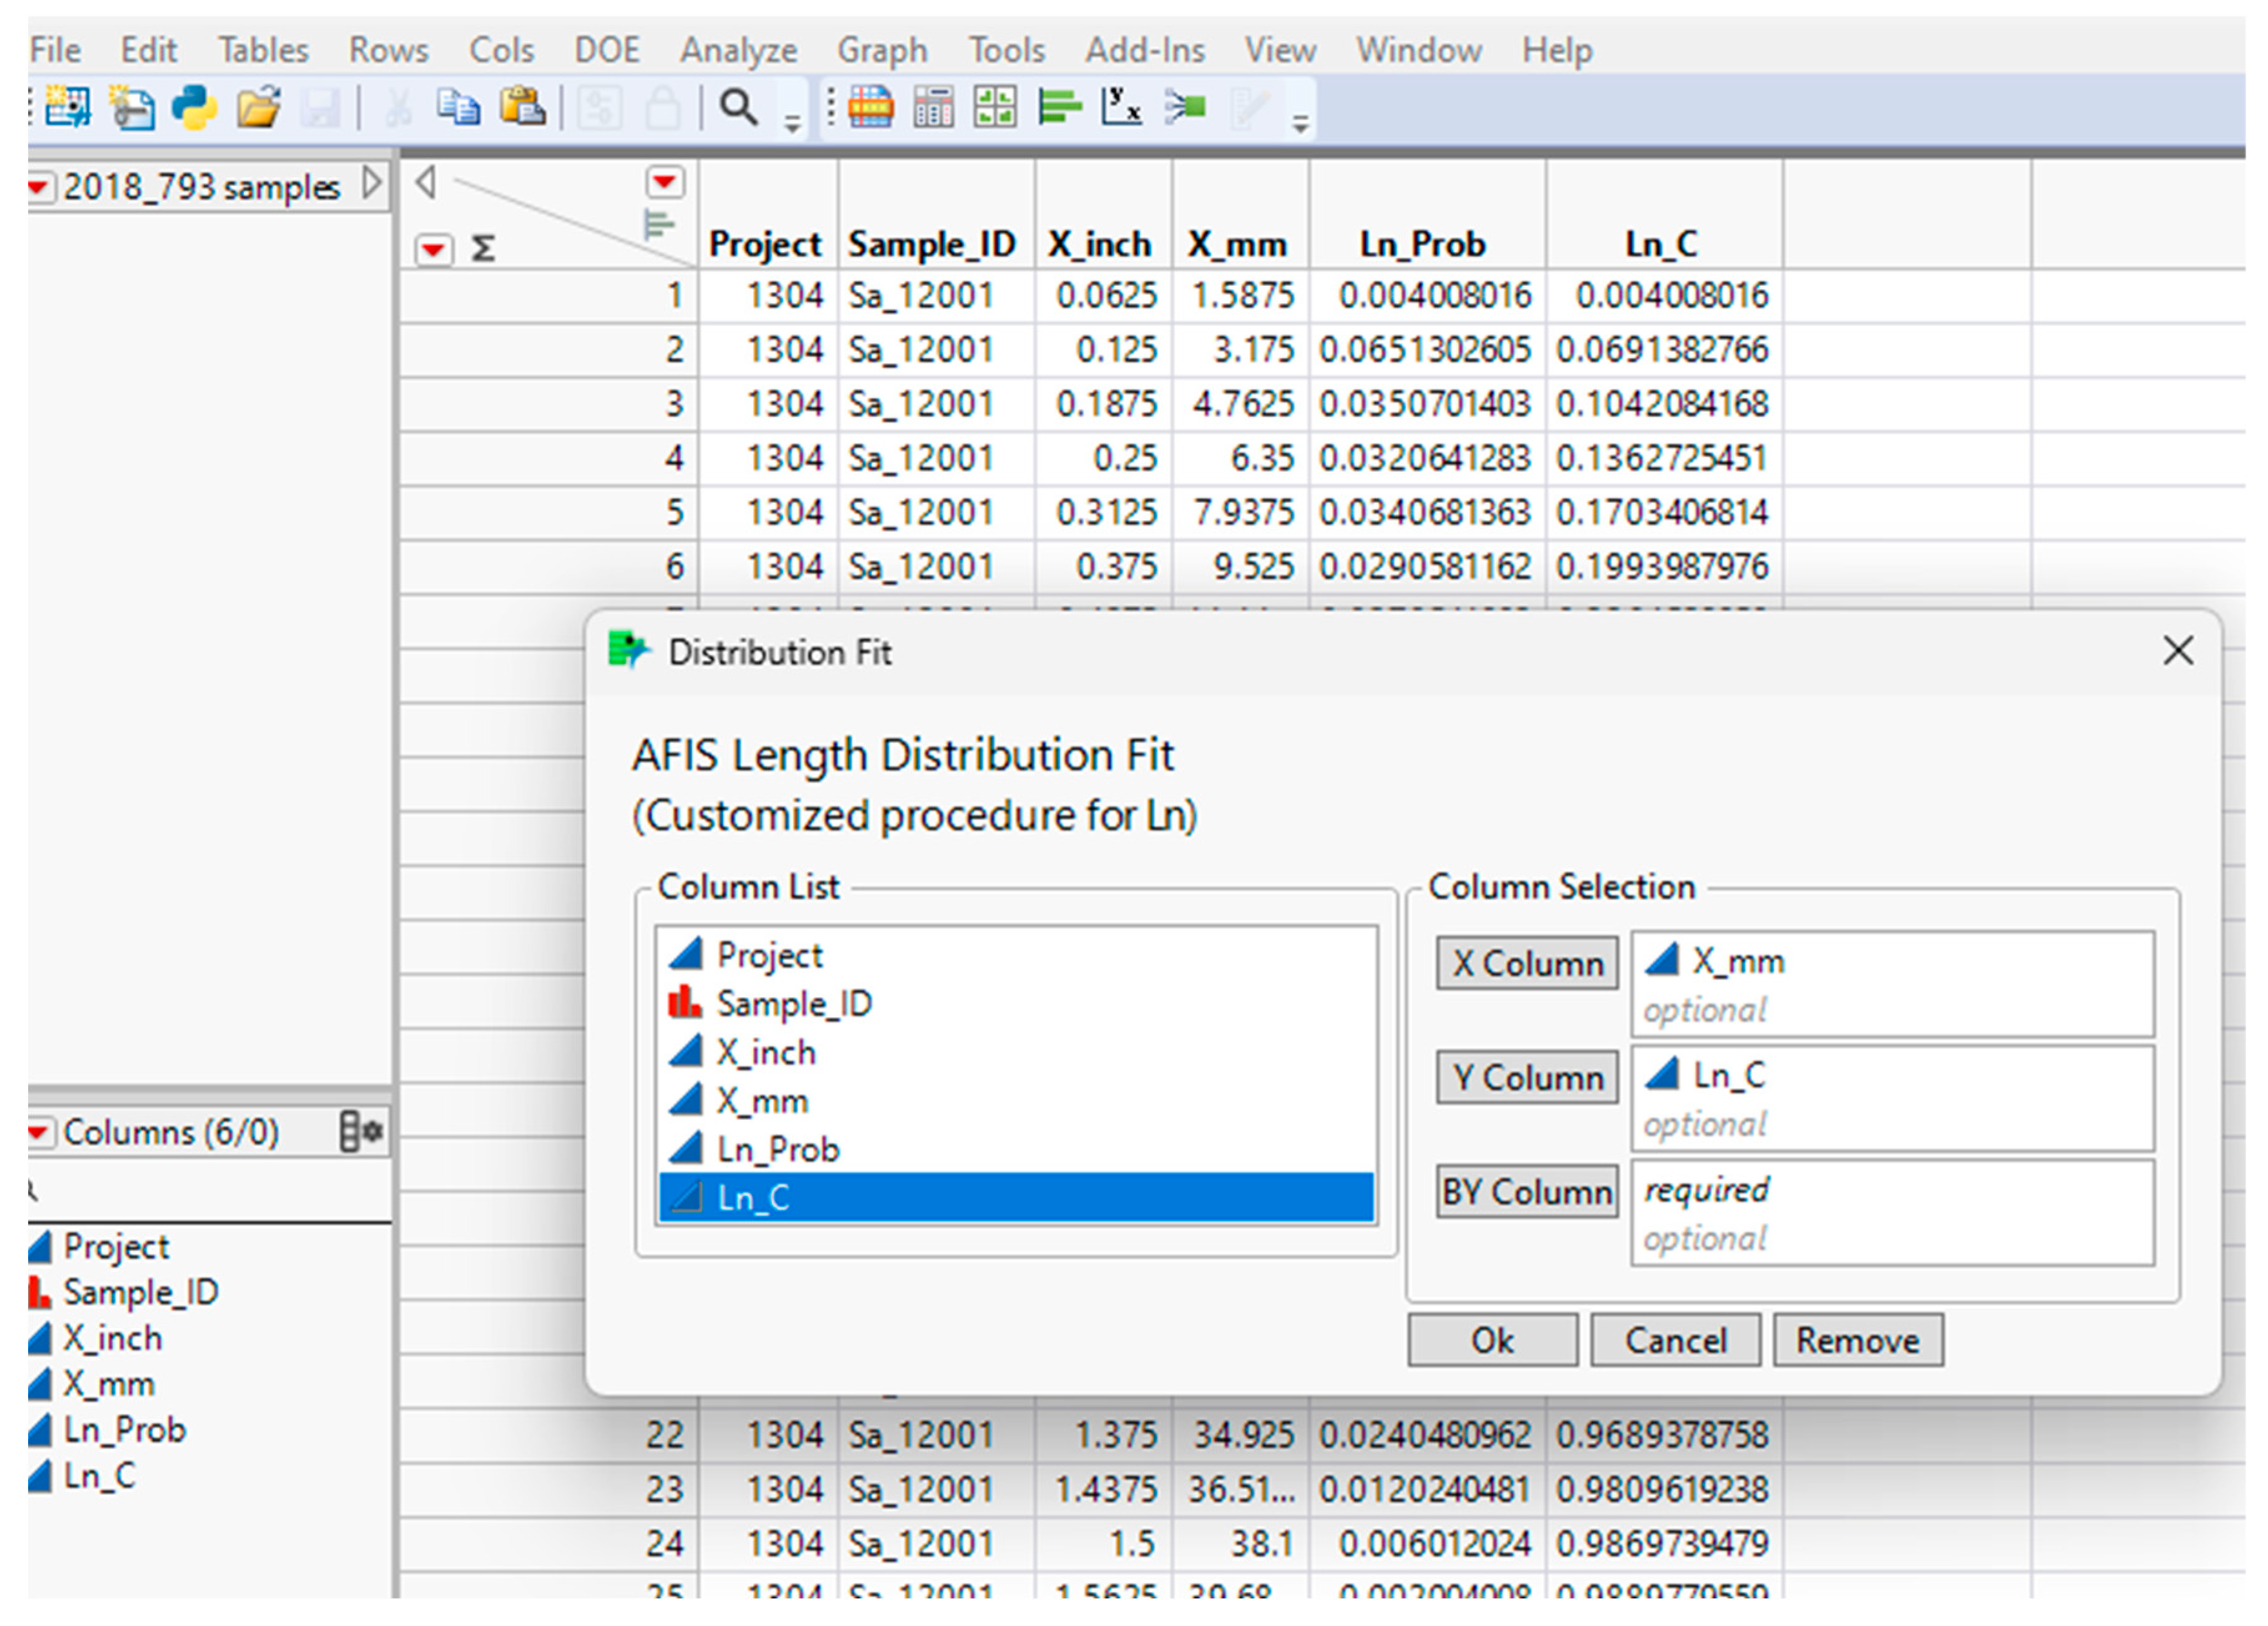
Figure 6 shows a typical length distribution dataset generated through the data processing add-in described in the section above and the JMP user interface (dialogue box) developed with Application Builder. The user interface enables the user to select the appropriate variables to fit the mixed Weibull distribution model to an empirical dataset. The fit provides a parametric probability density function (PDF) to fit the observed length distribution by number.

Figure 6.
JMP-pro table and custom application for length distribution fit.
The input data selected by the user is then analyzed using the non-linear modeling capability of JMP to fit a mixed Weibull model to the empirical distribution functions. Details about the theory underlying the fit and the empirical validation of the mixed Weibull model can be found in [5,6,14,25,26]. The model extracts five parameters that completely describe the length distribution and allows discrimination between samples based on both intrinsic genetic factors and processing influences on length distribution patterns [10,28].
For the current custom application, the model is built into the JSL script, and users are not required to go through the complexity of specifying the modeling function. As shown in Figure 6, this component of the analysis only requires three inputs (which can also be populated by default): the length axis (X or length in mm), the empirical distribution (F(X) or Ln_C), and an optional ‘By Sample ID’ input. The latter allows for independent analyses of large numbers of samples, which is enabled in the custom application.
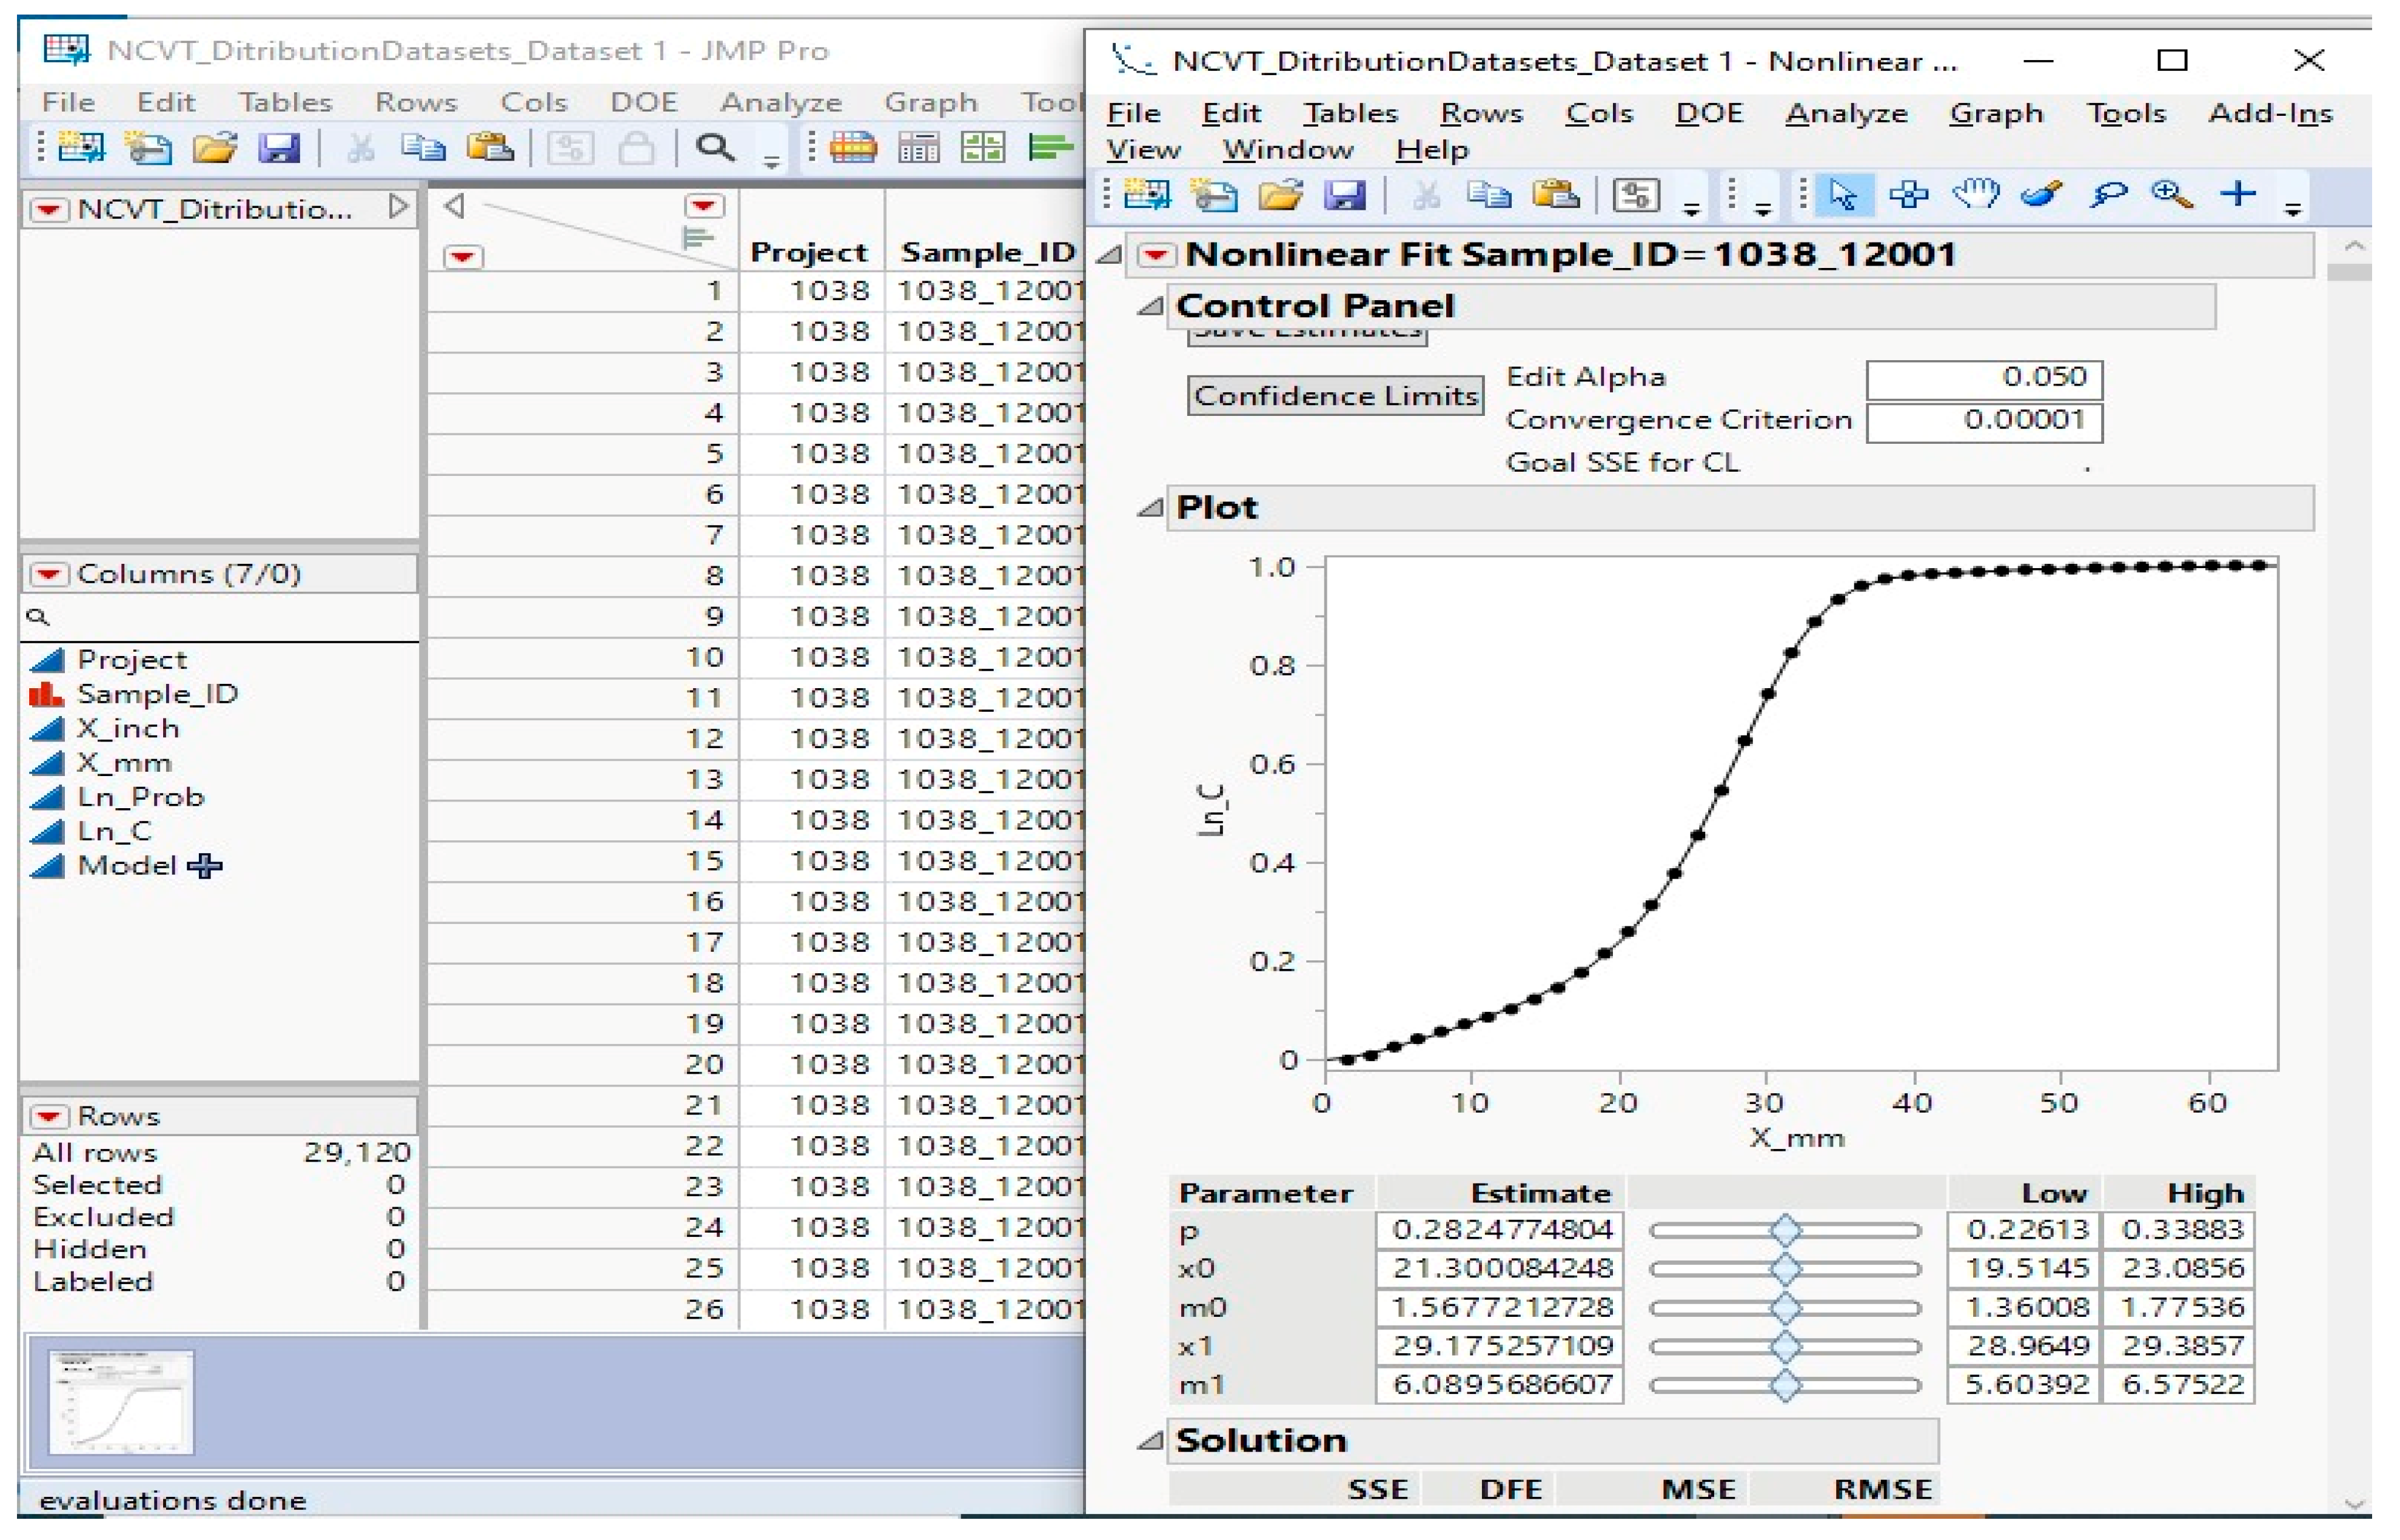
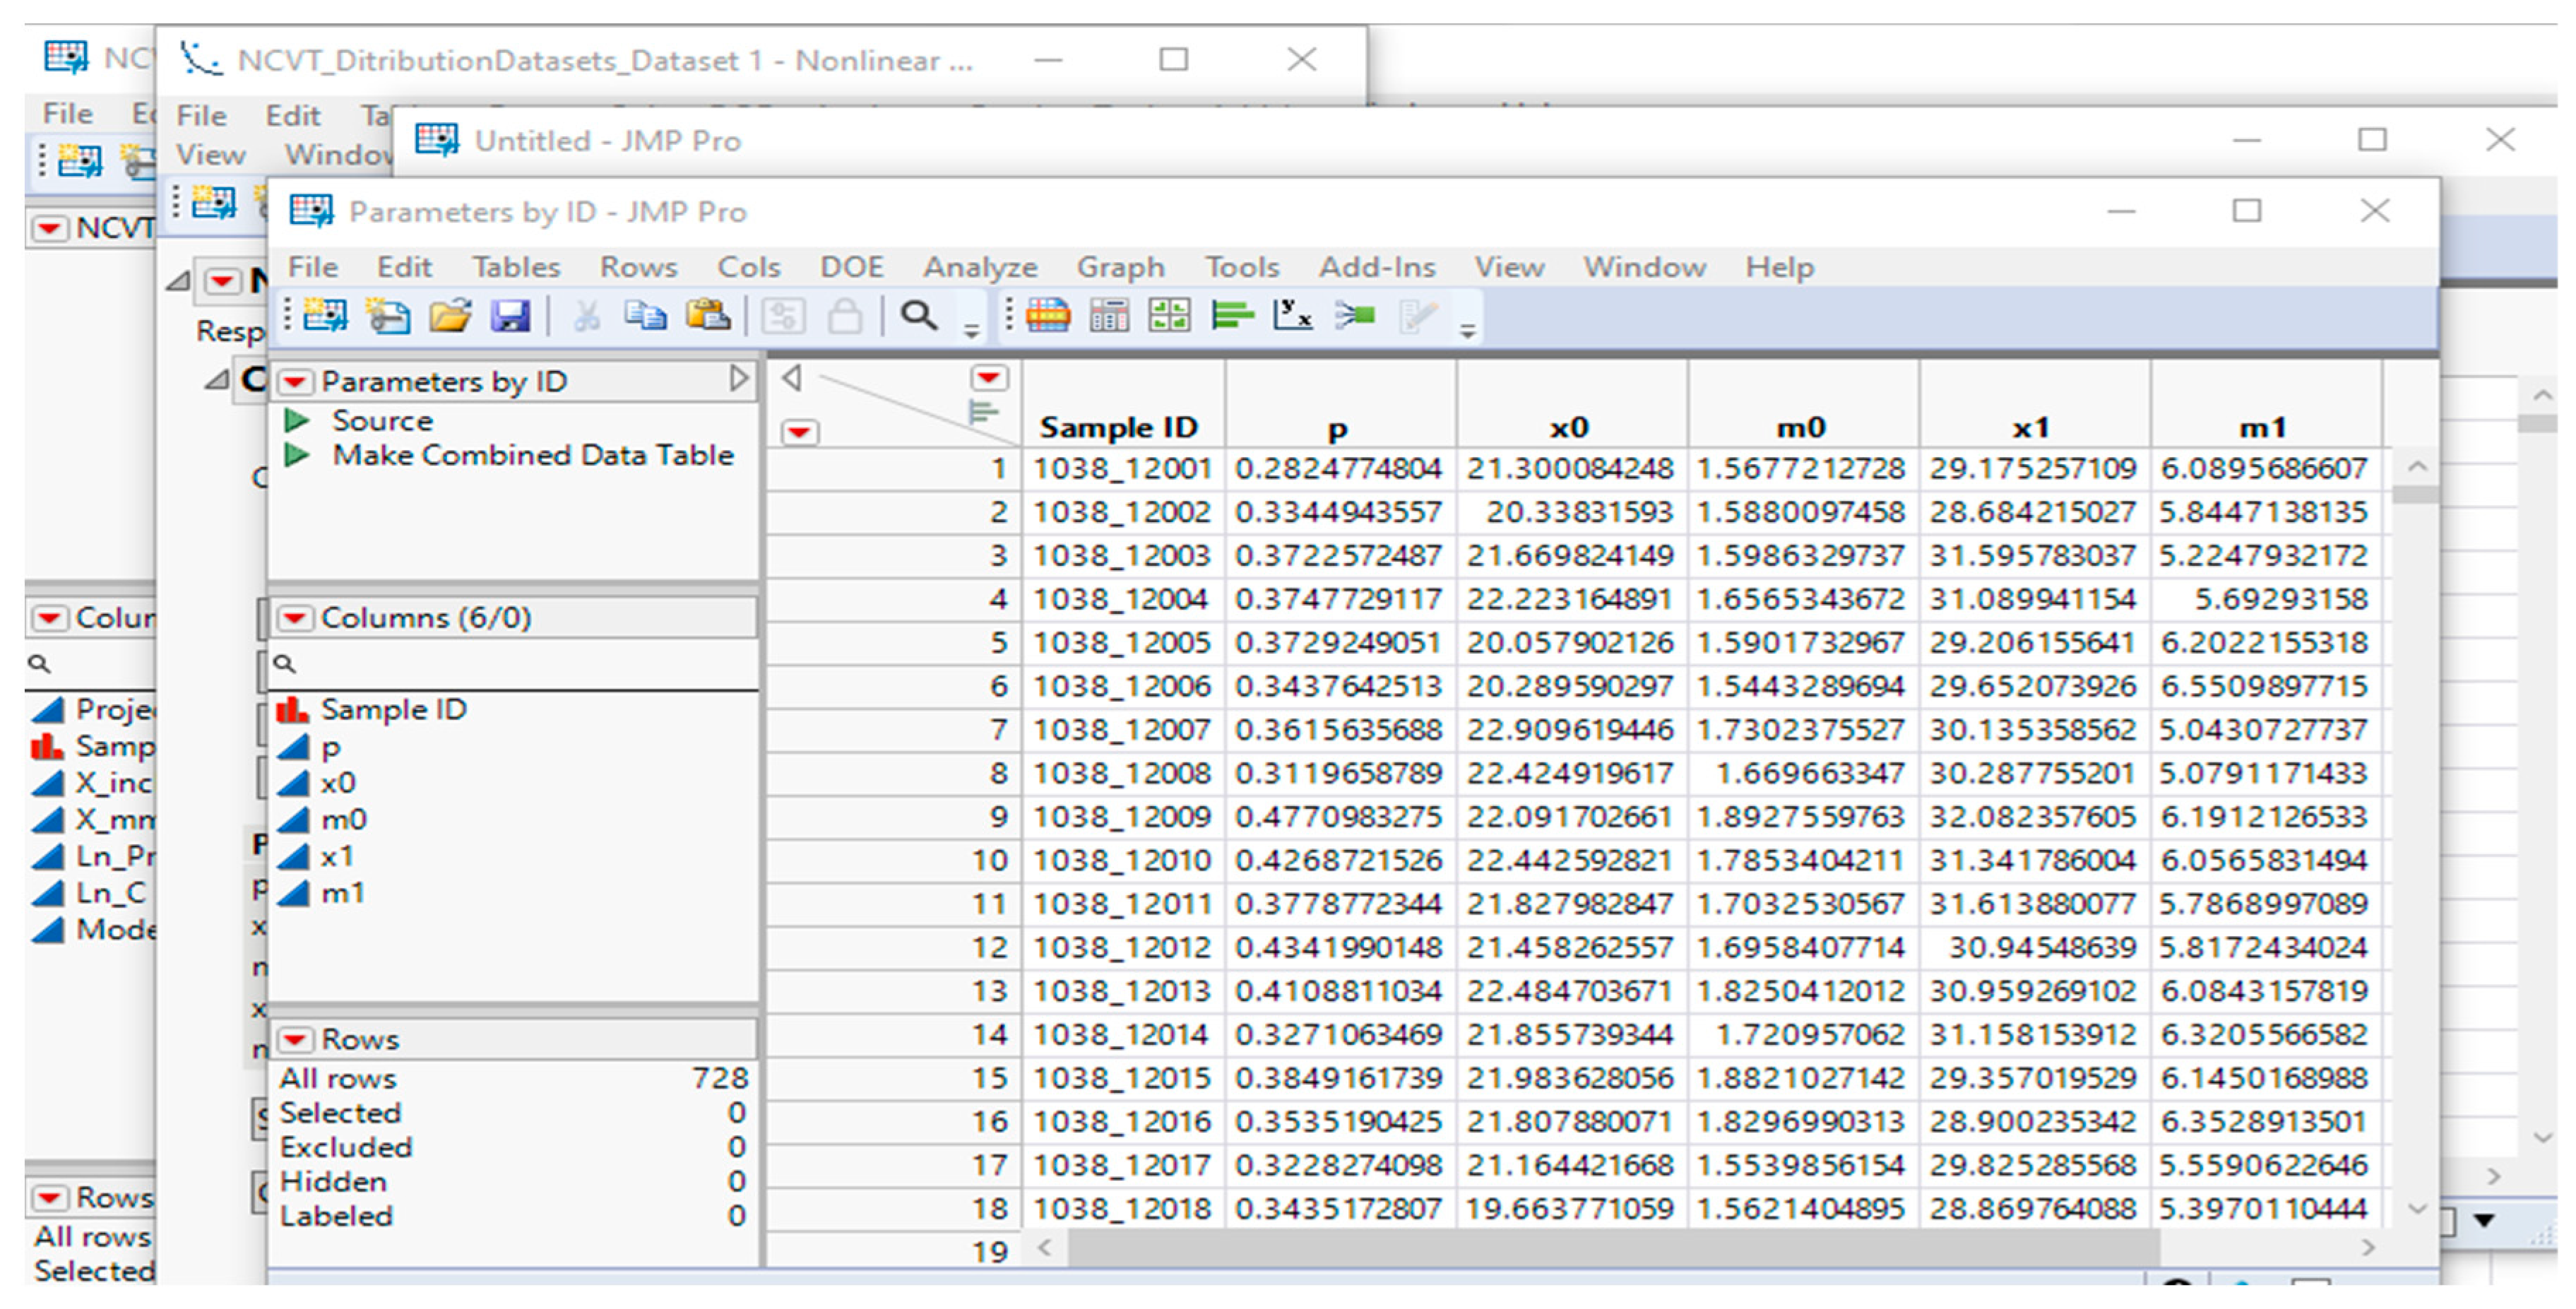
Once the non-linear model is generated, the application extracts the parameter estimates stored in the table box of the default report while generating the non-linear fit, as shown in Figure 7. The five parameters used to produce the graph are extracted as a JMP table that users could use for further processing and analysis. This JMP table reports all five parameters specified for each sample in the batch, as shown in Figure 8.

Figure 7.
Non-linear fit produced for each sample.
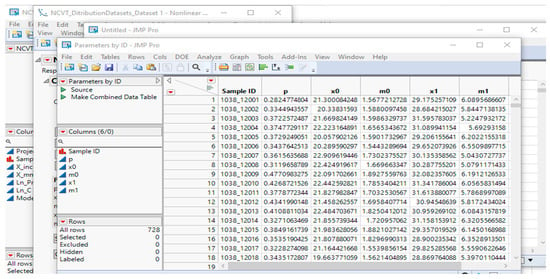
Figure 8.
JMP Data Table displaying all five parameters corresponding to each sample in the batch.
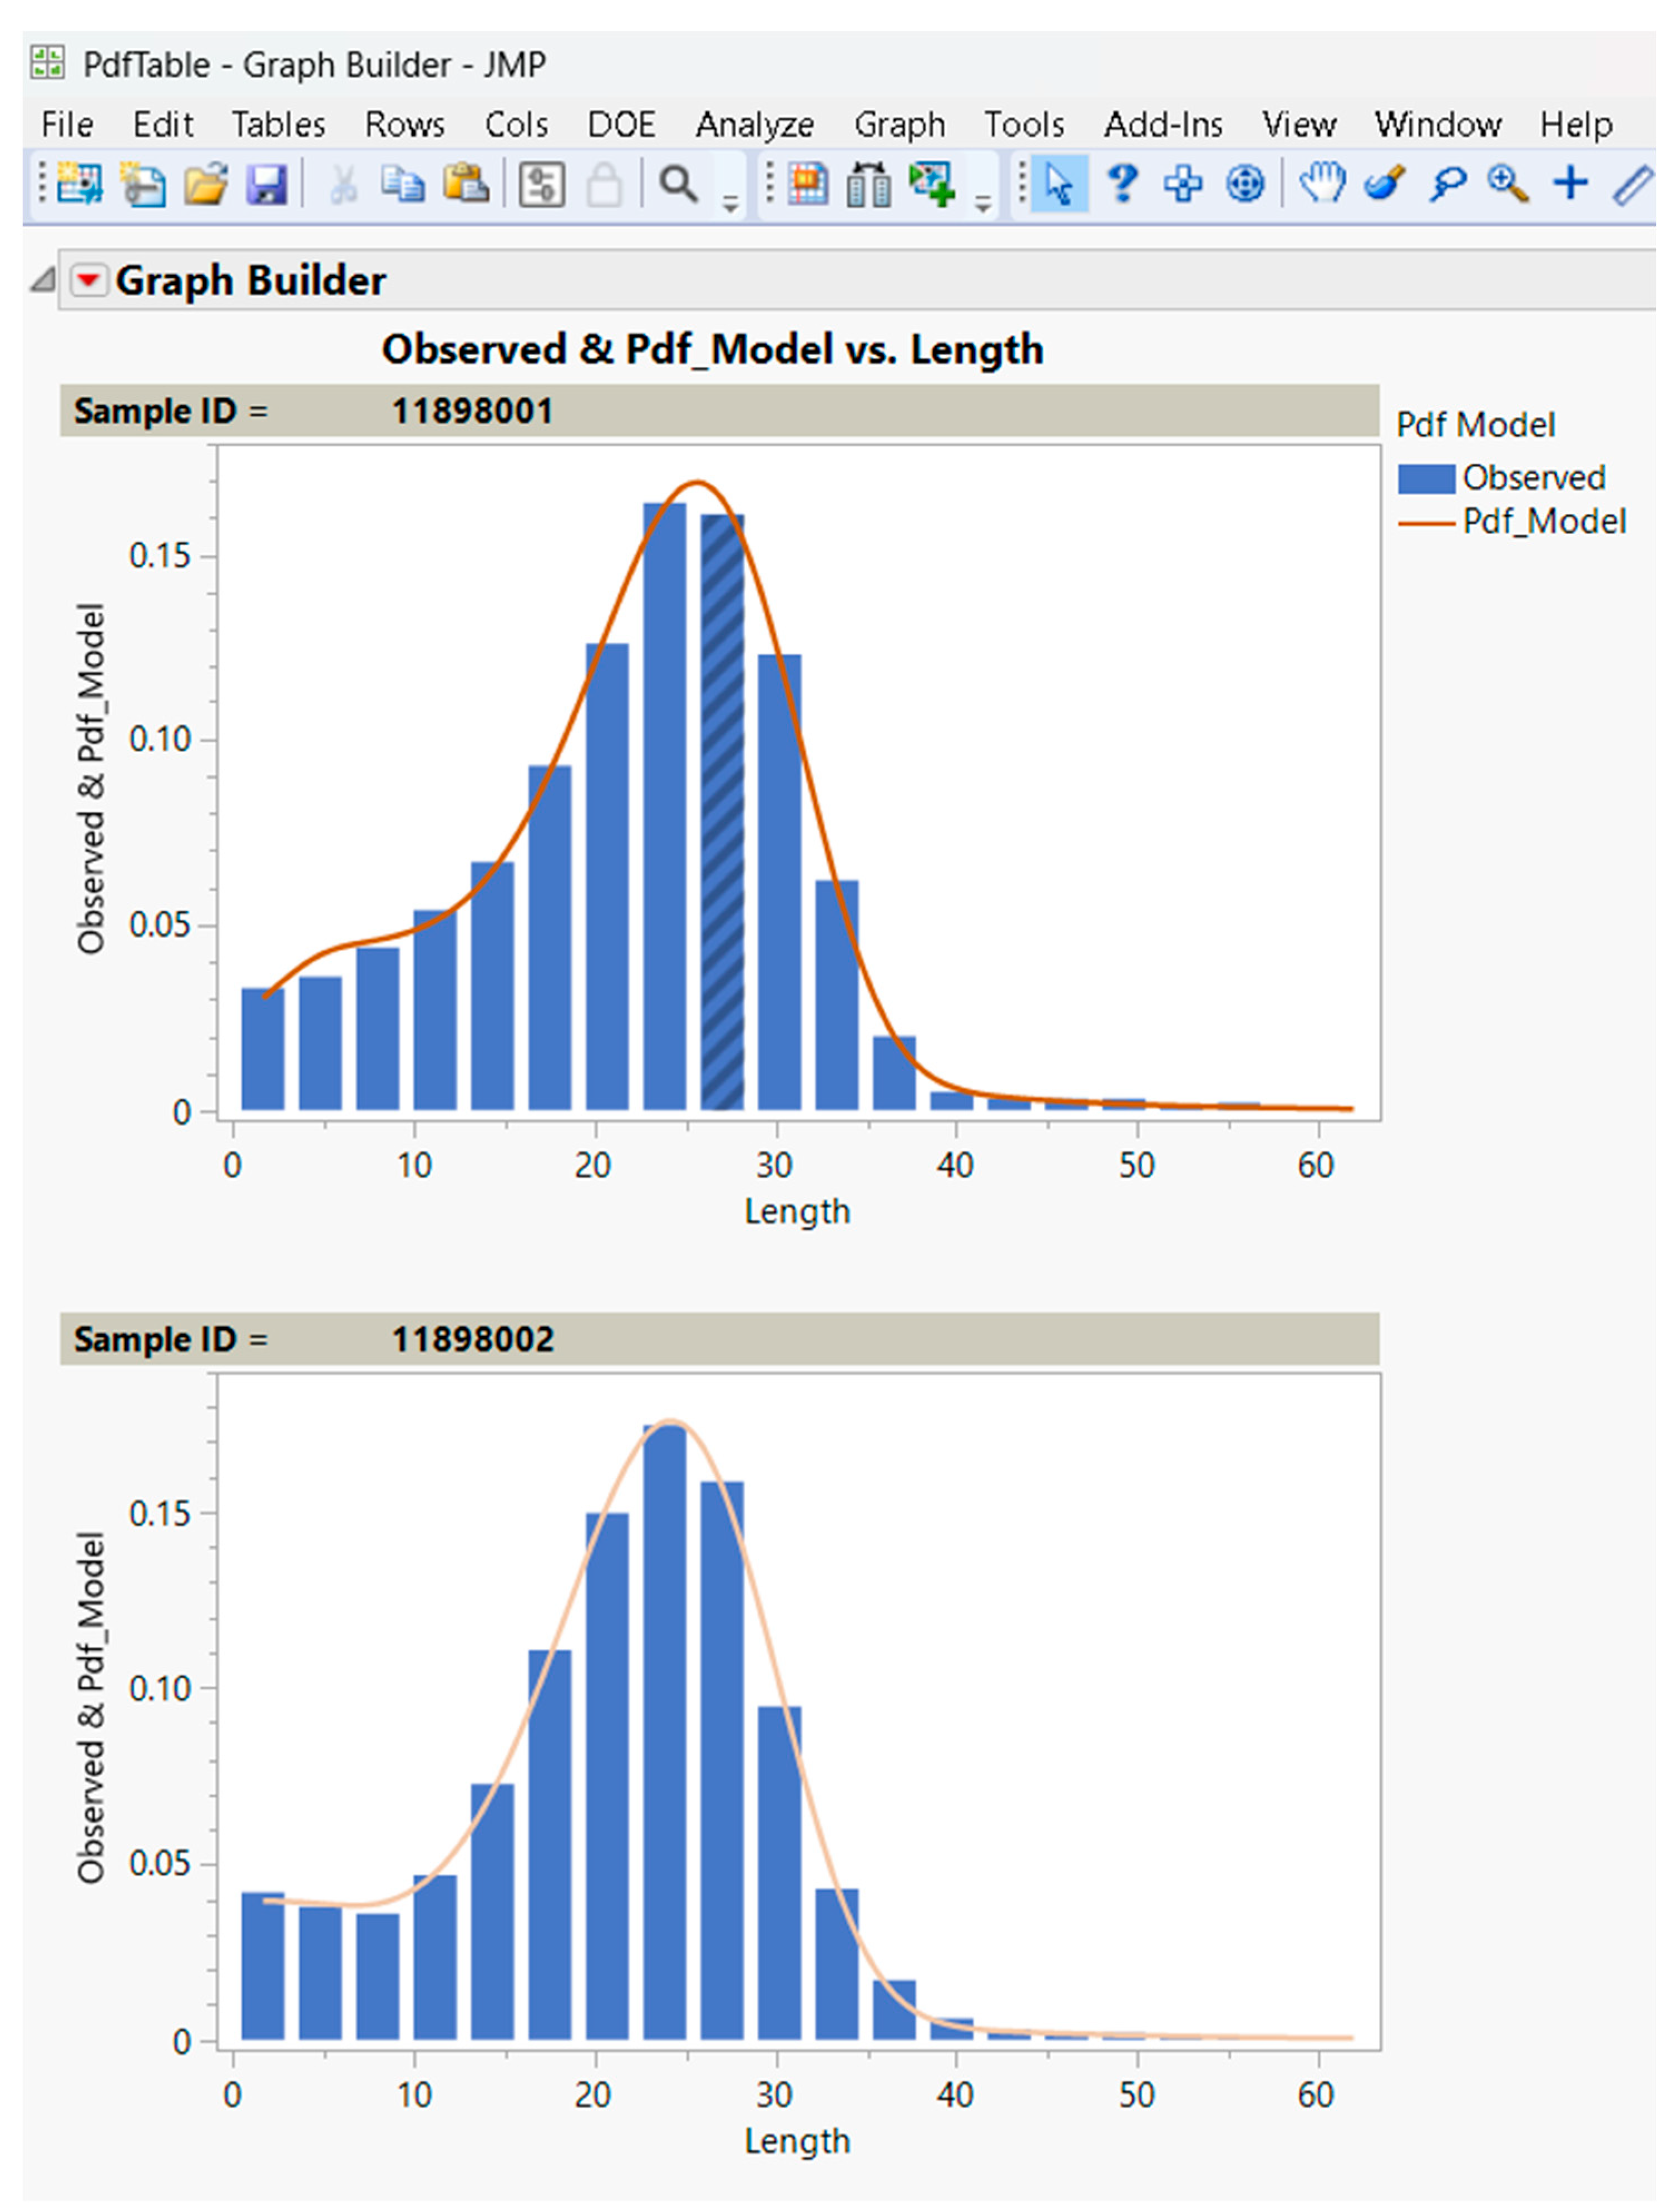
In addition to the parameter estimates, the application extracts all error values from the default JMP report of the non-linear fit. The error calculation table provides information about the Mean Square Error (MSE), sum of squared errors (SSE), and Root Mean Square Error (RMSE). Extracting these tables would enable the analysis of the goodness of fit of the model for all samples when using the capability of batch processing. Another component of the custom application report is the model-generated Probability Density Function (PDF, computed as the derivative of the Cumulative Distribution Function or CDF) table and graphic fit, as shown in Figure 9. The graphic fit, including the observed empirical histograms, provides users with the ability to assess the validity of the results for each sample in a batch.
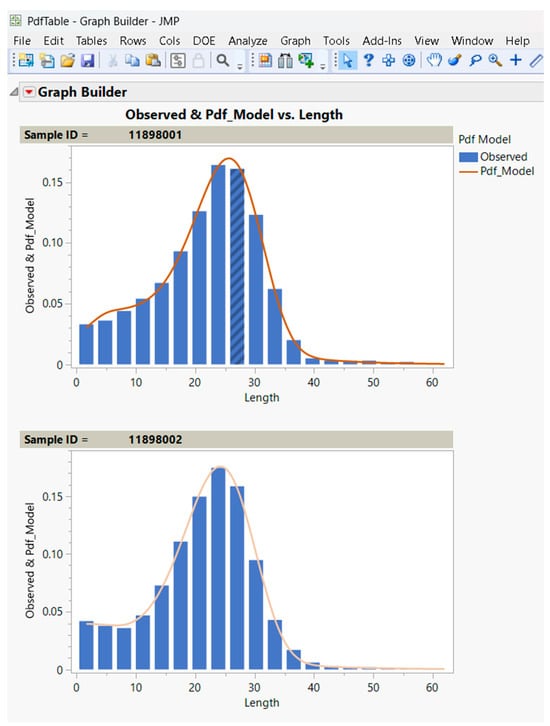
Figure 9.
Use of the Graph Builder capability in the JMP script to plot the observed distribution histograms against the model probability density function (PDF). (x-axis represents the length in mm, and the y-axis represents the probability).
3.3. Validation of Fit Results
In this research, a wide range of samples collected from multiple stages of the cotton process (breeding/variety test, gin, bale, card silver, combed silver, finisher silver) were obtained to test our final application with large datasets and to troubleshoot any errors and improve the accuracy of the fit. The samples included raw cotton from more than 800 different National Cotton Variety Test (NCVT) samples from varied growth regions and multiple seasons. In addition to the NCVT samples, AFIS reports were obtained from three US laboratories with four different versions of the output files. This second batch consisted of more than 2,000 samples, with sample types ranging from commercial bales and processing samples at various stages in the gin to yarn chain, breeder, and laboratory lint, including those processed on tabletop gins. The goal was to submit the analysis add-in to a broad range of distribution patterns, including extreme breakage cases, to ensure consistent performance. The goodness of fit was assessed by analyzing the Root Mean Squared Error (RMSE) estimated by JMP as the standard deviation of the residuals. In addition to the RMSE, the fits were observed graphically to identify and troubleshoot potential convergence issues.
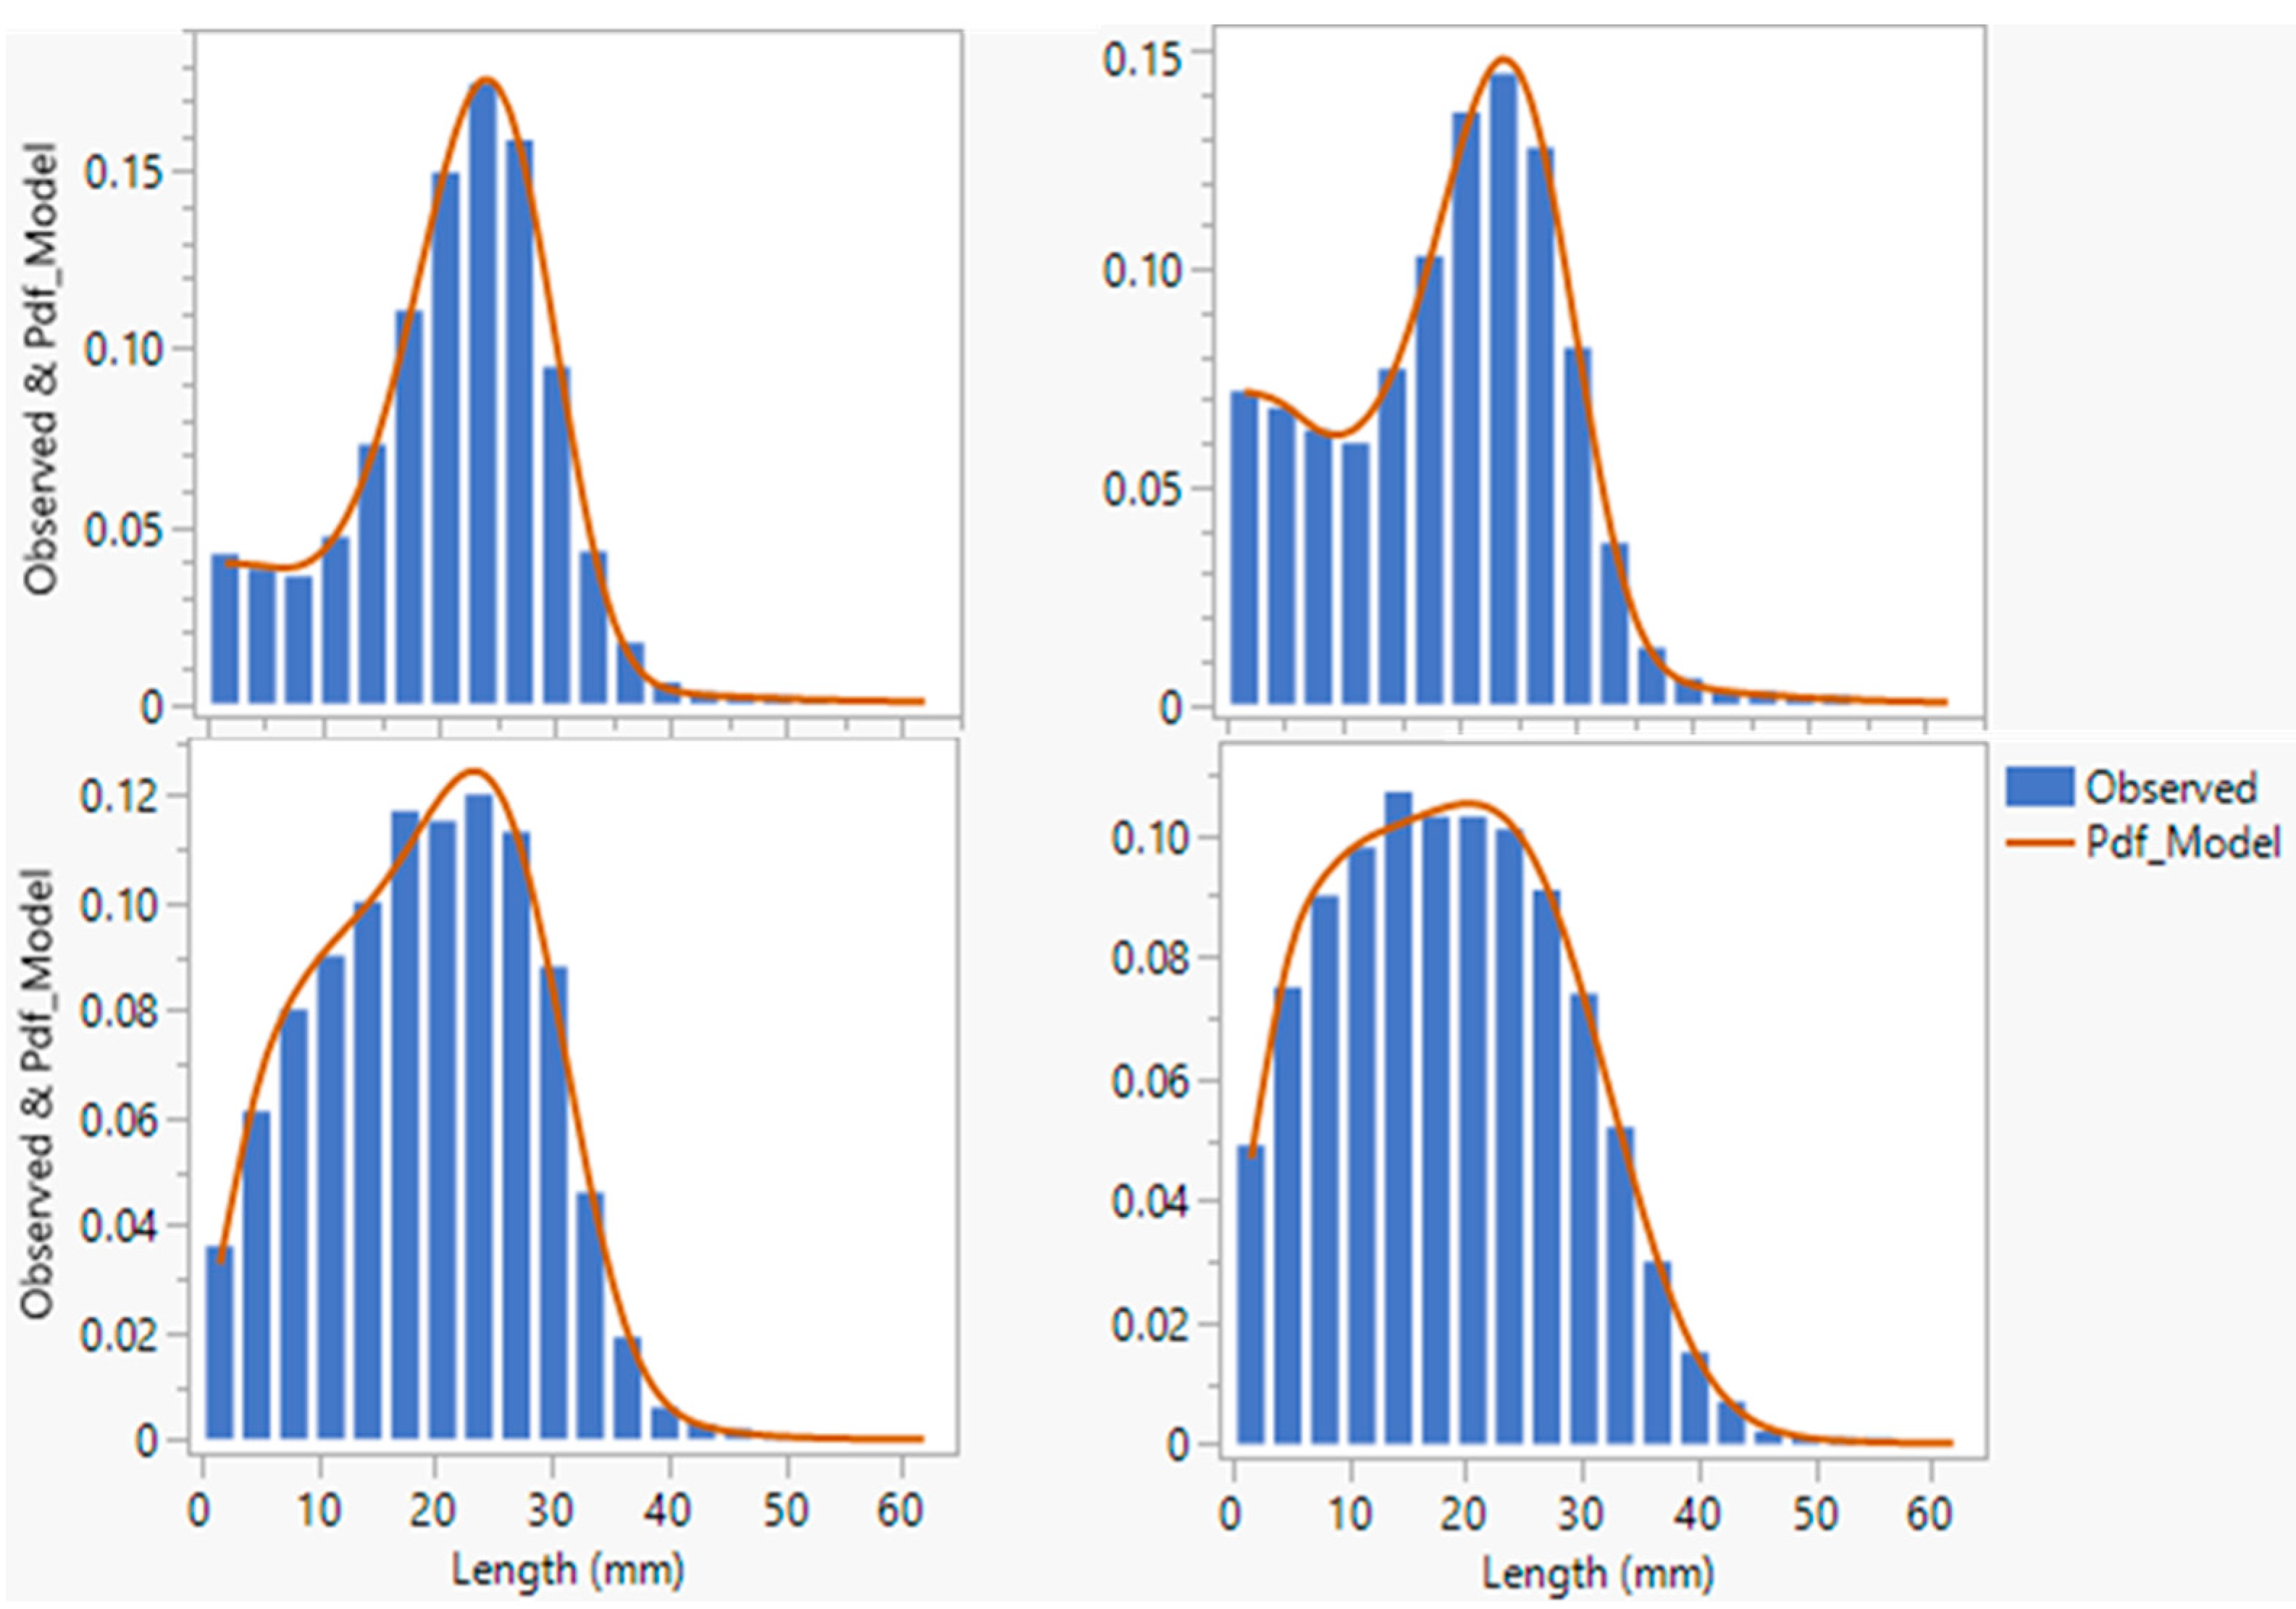
Figure 10 depicts the model fit for the length distributions with varying levels of fiber damage and the resulting differences in modality [5,28]. The JMP add-in adequately fitted the model to various distribution patterns, including those with bimodal shapes and extreme breakage levels.
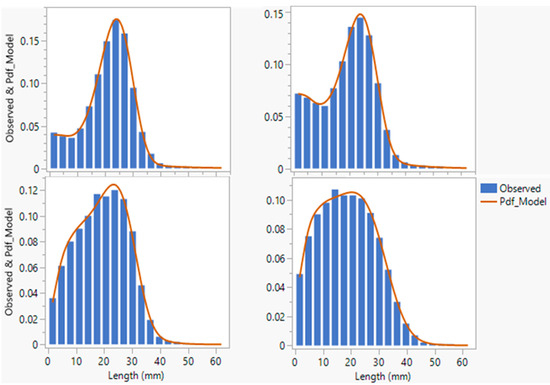
Figure 10.
Example model fits for various distribution patterns. (x-axis represents the length in mm, and the y-axis represents the probability).
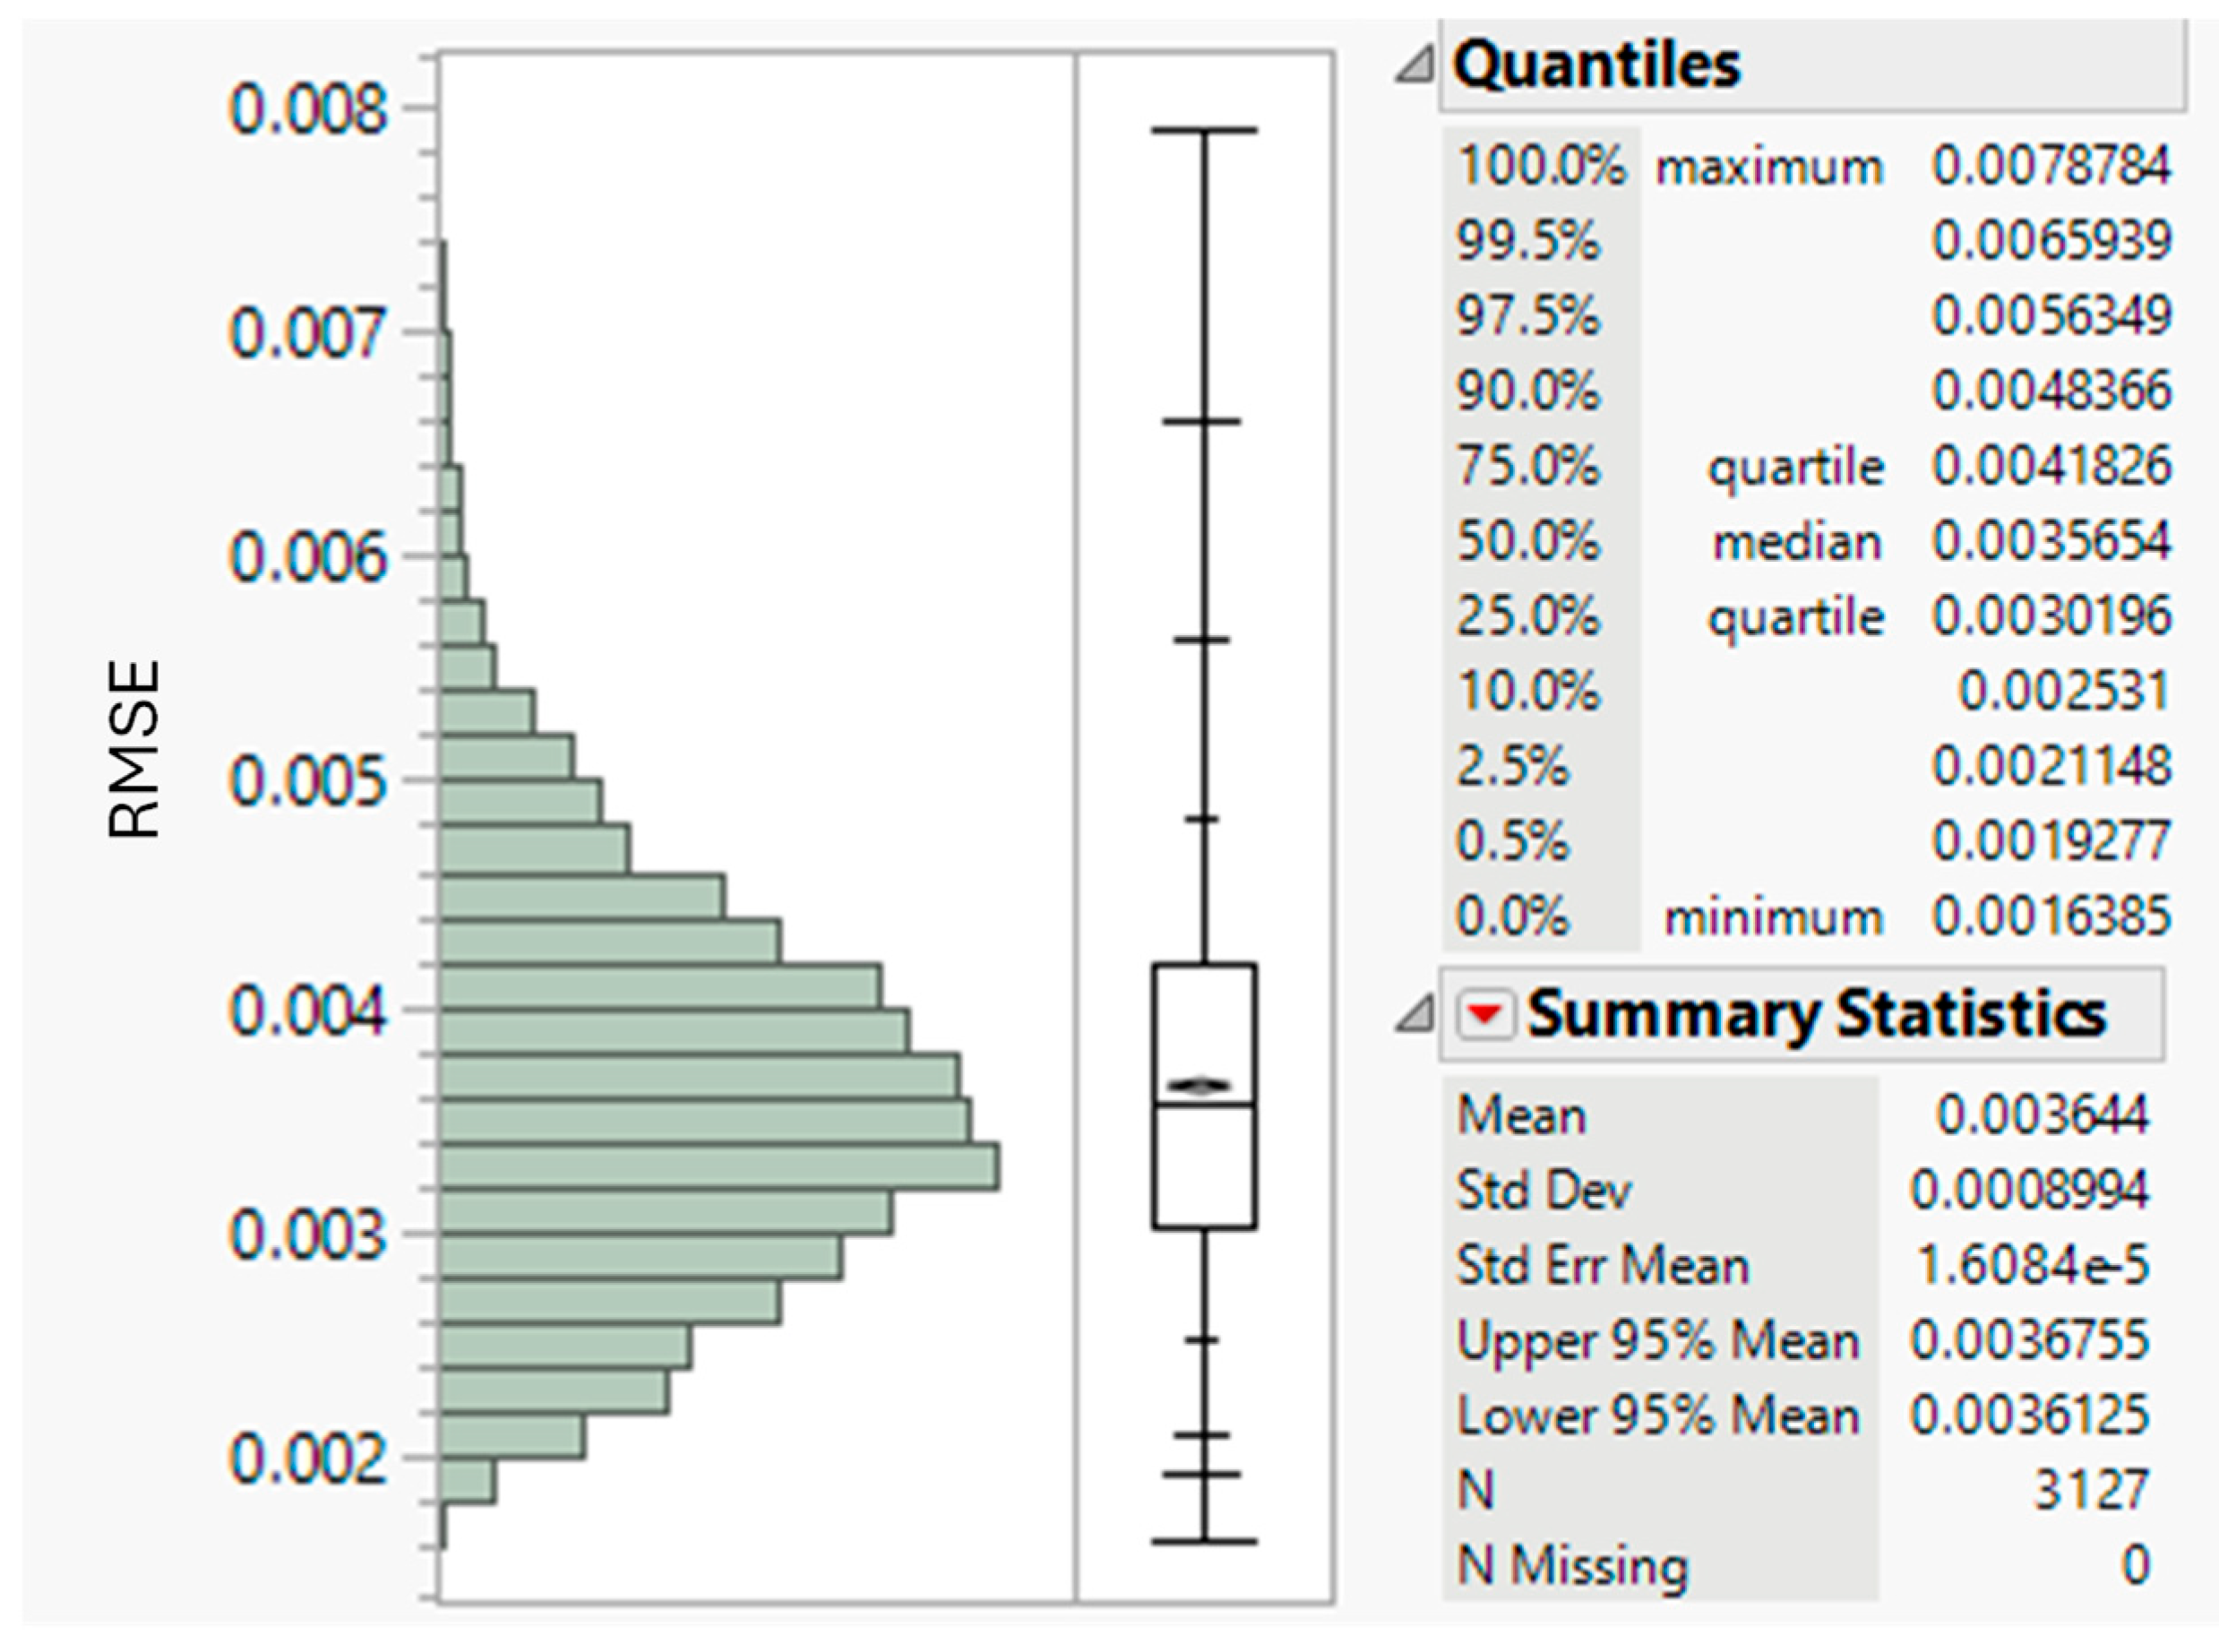
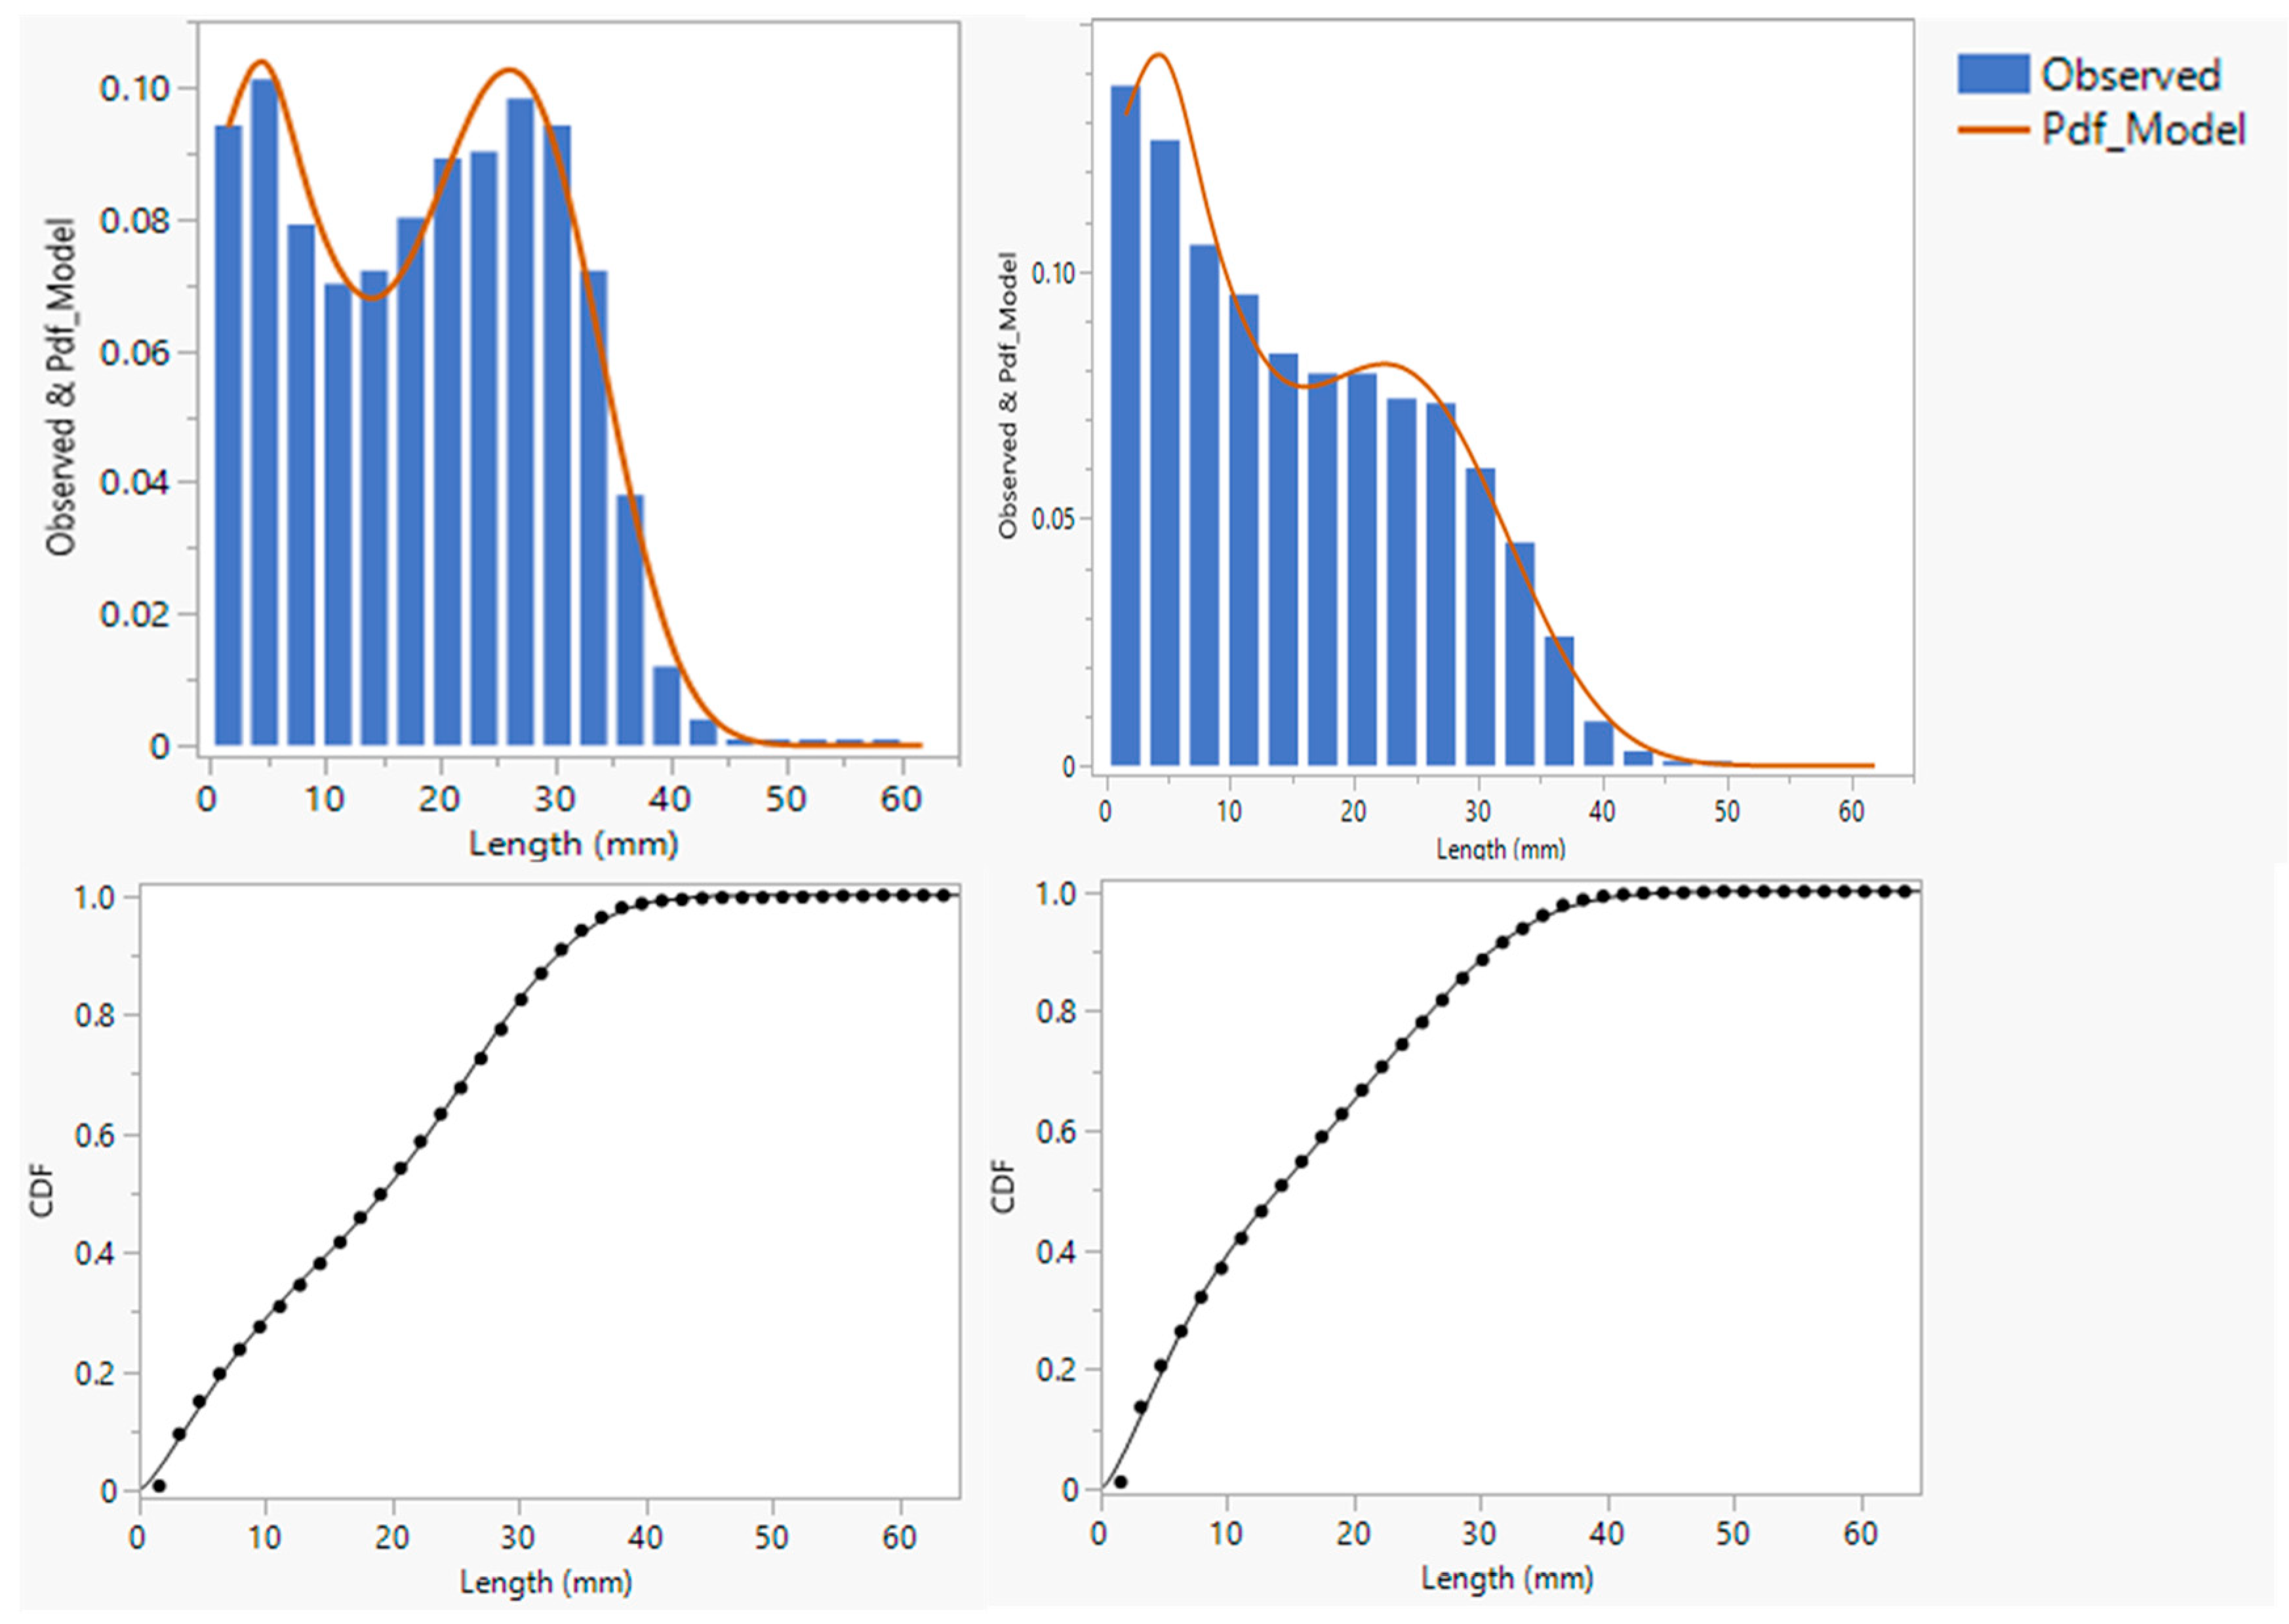
Figure 11 shows the summary statistics, histogram, and quantile plots of the RMSE measure of the goodness of fit in the range of 3127 samples. The RMSE is a metric with the same unit as the response variable, i.e., probability on a scale from 0 to 1 in this case. Overall, the values of RMSE are extremely low on the probability scale and range from 0.00164 to 0.00788 for the 3127 samples. The distribution of RMSE shown in Figure 11 is slightly skewed and shows a limited number of samples with RMSE between 0.0065 and 0.00788. Although these RMSE values are low on the probability scale, the samples were identified and examined individually to ensure an adequate fit (Figure 12). Both the Probability Density Function (PDF) and Cumulative Distribution Function (CDF) fits are shown in Figure 12 for the two individual samples identified with those RMSE values. The samples clearly show extreme distribution patterns with a modality that is indicative of significant fiber damage levels with high peaks in the short fiber range (<10 mm). Despite the extreme patterns, the add-in adequately fitted the distribution model to the observed data. Overall, the results indicate optimal convergence of the non-linear modeling procedure and adequate goodness of fit for the wide range of distribution patterns tested.

Figure 11.
Distribution of RMSE for 3127 length distribution fits.

Figure 12.
Probability Density Function (PDF) and Cumulative Distribution Function (CDF) plots for samples with RMSE = 0.0065 (left) and RMSE = 0.00788 (right). (The x-axis is the length in mm, and the y-axis is the probability).
3.4. JMP Fiber Length Distribution Analysis Add-In Compilation
Upon completion of the Application Builder process and validation of the analysis on a large number of samples, all modules were compiled into a custom analytical interface using the JMP Add-In Builder. The add-in functionality simplifies the deployment and use of complex scripts coded to perform the analyses and extract the reports. In addition to the Excel add-in extension discussed in the previous section, the outcomes of this research include a suite of JSL scripts compiled in a single add-in file that potential users can install and use as an extended capability of JMP. Both add-ins are available for download in the Supplementary Materials of this paper. It should be noted that the JSL code was initially developed on version 14 of JMP-Pro and then updated to accommodate software changes with the upgrade to JMP-Pro 16. In addition, the add-in was validated for the base versions of JMP 16 and 17. Therefore, the use of the add-in with a software version other than 16 or 17 may require some adjustments. The AFIS is the most widely used instrument for generating distribution data in cotton research, from breeding to processing. The tools developed here are specific to AFIS lab reports but can be extended to other potential measurement methods if they become available.
4. Conclusions
Fiber length is generally considered the most critical quality trait in cotton production, marketing, and processing into textiles. Beyond the array of parameters commonly used to characterize fiber length (e.g., mean length, staple length, span length), it is well established that length uniformity, or more fundamentally, the dispersion features of fiber length distribution, are crucial for the industrial performance and use value of cotton in the global market. Despite continuous efforts by cotton breeders and geneticists to improve both the yield and quality of cotton cultivars available to US farmers, improvements in the length uniformity index (LUI) have been lacking or marginal at best. Traditionally, there has been a lack of focus on improving fiber length uniformity for at least two reasons: (1) the absence of analytic tools for fiber trait distributions as provided by single fiber testing instruments and (2) the lack of understanding of the interactions among individual fiber properties and behavior during textile processing.
This research addresses both challenges by achieving the following objectives:
- Develop tools for processing and analysis of length distribution data generated by current instrumentation: AFIS
- Develop statistical modeling tools for fiber trait distributions, as provided by AFIS testing.
This effort used an array of programming languages and statistical packages (including MS VBA and JMP JSL) to provide standalone add-ins for use by cotton breeders/processors. The tools developed in this research were tested and validated on a wide range of samples with multiple versions of AFIS reports from leading US laboratories.
Upon completion of the development and validation of the goodness-of-fit results, both tools were compiled into installable add-ins that extended the capabilities of MS Excel for the processing of AFIS distribution reports and the statistical toolbox of JMP using Application Builder code. The installable add-ins, along with a user manual, are available for download by cotton researchers as part of the Supplementary Materials section.
Completion of the development of the tools above and access to the add-in by interested partners now enable further long-term research, including application of the program to the evaluation of commercial varieties, as well as its implementation in field variety selection conditions. Toolboxes allow statistical discrimination between and within populations of cotton lines based on parameterized length distribution data. In addition to field applications in breeding and biotechnology, one prominent research goal that the new tools will enable is the use of distribution data for bale classification and spinning laydown selection. Therefore, future research should focus on applying these tools in partnership with cotton breeders, biotechnologists, and processors to optimize variety selection and textile processing.
Supplementary Materials
The following supporting information can be downloaded at: https://www.mdpi.com/article/10.3390/fib13070091/s1, S1: (a) Excel add-in for AFIS report processing and formatting for distribution analysis. S2.: Installable JMP add-in for mixed Weibull modeling of length distribution; S3: User manual draft.
Author Contributions
M.K. (Principal Investigator), designed the research, wrote the proposal, developed the VBA code and the first version of the JSL code for the JMP add-in, and wrote the paper; V.G., Graduate Research Assistant, finalized the JSL code and conducted troubleshooting and validation analyses; V.B.M. (Cotton Inc. collaborator) provided guidance in support of the project, edited the paper; N.K. (USDA-ARS), provided guidance in support of the project and provided data. All authors have read and agreed to the published version of the manuscript.
Funding
This research was carried out with financial support from Cotton Incorporated project #20-683.
Data Availability Statement
The add-ins developed in this study are openly available in the Supplementary Materials of this manuscript.
Conflicts of Interest
Author Vikki B. Martin was employed by the company Cotton Incorporated, Division of Fiber Competition. The remaining authors declare that the research was conducted in the absence of any commercial or financial relationships that could be construed as a potential conflict of interest.
Abbreviations
The following abbreviations are used in this manuscript:
| AFIS | Advanced Fiber Information System |
| HVI | High Volume Instrument |
| UHML | Upper Half Mean Length |
| LUI | Length Uniformity Index |
| JSL | JMP Scripting Language |
| VBA | Visual Basic for Applications |
References
- Thibodeaux, D.P. The impact of short fiber content on the quality of cotton ring spun yarn. J. Cotton Sci. 2008, 12, 368–377. [Google Scholar]
- Yang, S.; Gordon, S. Accurate prediction of cotton ring-spun yarn quality from high-volume instrument and mill processing data. Textile Res. J. 2017, 87, 1025–1039. [Google Scholar] [CrossRef]
- USDA. Cotton Classification: Understanding the Data; United States Department of Agriculture—Agricultural Marketing Service, Cotton Program: Memphis, TN, USA, 2018; p. 13. [Google Scholar]
- Bedez Üte, T.; Kadoğlu, H. A Statistical Model for Predicting Yarn Evenness of Cotton Sirospun Yarns. Eur. J. Eng. Nat. Sci. 2016, 1, 57–63. [Google Scholar]
- Krifa, M. Fiber Length Distribution in Cotton Processing: A Finite Mixture Distribution Model. Textile Res. J. 2008, 78, 688–698. [Google Scholar] [CrossRef]
- Cui, X.L.; Rodgers, J.; Cai, Y.Y.; Li, L.X.; Belmasrour, R.; Pang, S.S. Obtaining cotton fiber length distributions from the beard test method. Part 1: Theoretical distributions related to the beard method. J. Cotton Sci. 2009, 13, 265–273. [Google Scholar]
- Kelly, C.M.; Hequet, E.F.; Dever, J.K. Interpretation of AFIS and HVI Fiber Property Measurements in Breeding for Cotton Fiber Quality Improvement. J. Cotton Sci. 2012, 16, 1–16. [Google Scholar]
- Kelly, C.M.; Hequet, E.F.; Dever, J.K. Breeding for improved yarn quality: Modifying fiber length distribution. Ind. Crops Prod. 2013, 42, 386–396. [Google Scholar] [CrossRef]
- Constable, G.; Llewellyn, D.; Walford, S.A.; Clement, J.D. Cotton Breeding for Fiber Quality Improvement. In Industrial Crops: Breeding for BioEnergy and Bioproducts; Cruz, V.M.V., Dierig, D.A., Eds.; Springer: New York, NY, USA, 2015; pp. 191–232. [Google Scholar]
- Krifa, M. Fiber length distribution variability in cotton bale classification: Interactions among length, maturity and fineness. Textile Res. J. 2012, 82, 1244–1254. [Google Scholar] [CrossRef]
- Siddiqui, M.Q.; Wang, H.; Memon, H. Cotton Fiber Testing. In Cotton Science and Processing Technology: Gene, Ginning, Garment and Green Recycling; Wang, H., Memon, H., Eds.; Springer: Singapore, 2020; pp. 99–119. [Google Scholar]
- Armijo, C.B.; Delhom, C.D.; Whitelock, D.P.; Tumuluru, J.S.; Yeater, K.M.; Blake, C.D.; Rowe, C.; Wanjura, J.D.; Sui, R.; Holt, G.A.; et al. Evaluation of Alternative-Design Cotton Gin Lint Cleaning Machines on Fiber Length Uniformity Index. Agriengineering 2023, 5, 2123–2138. [Google Scholar] [CrossRef]
- Liu, Y.-H.; Zhang, M.; Sze, S.-H.; Smith, C.W.; Zhang, H.-B. Analysis of the genes controlling cotton fiber length reveals the molecular basis of plant breeding and the genetic potential of current cultivars for continued improvement. Plant Sci. 2022, 321, 111318. [Google Scholar] [CrossRef]
- Krifa, M. A Mixed Weibull Model for Size Reduction of Particulate and Fibrous Materials. Powder Technol. 2009, 194, 233–238. [Google Scholar] [CrossRef]
- Smith, C.W.; Braden, C.A.; Hequet, E.F. Generation Mean Analysis of Near-Long-Staple Fiber Length in TAM 94L-25 Upland Cotton. Crop Sci. 2009, 49, 1638–1646. [Google Scholar] [CrossRef]
- de Carvalho, L.P.; Farias, F.J.C.; Rodrigues, J.I.d.S. Selection for Increased Fiber Length in Cotton Progenies from Acala and Non-Acala Types. Crop Sci. 2015, 55, 985–991. [Google Scholar] [CrossRef]
- Cotton Incorporated. EFS® USCROP (TM); Cotton Incorporated: Carry, NC, USA, 2022. [Google Scholar]
- Herring, A.D.; Auld, D.L.; Ethridge, M.D.; Hequet, E.F.; Bechere, E.; Green, C.J.; Cantrell, R.G. Inheritance of fiber quality and lint yield in a chemically mutated population of cotton. Euphytica 2004, 136, 333–339. [Google Scholar] [CrossRef]
- Khan, A.; Kong, X.; Najeeb, U.; Zheng, J.; Tan, D.K.Y.; Akhtar, K.; Munsif, F.; Zhou, R. Planting Density Induced Changes in Cotton Biomass Yield, Fiber Quality, and Phosphorus Distribution under Beta Growth Model. Agronomy 2019, 9, 500. [Google Scholar] [CrossRef]
- Hinds, Z.; Kelly, B.R.; Hequet, E.F. Stability, variation, and application of AFIS fiber length distributions. J. Cotton Res. 2020, 3, 10. [Google Scholar] [CrossRef]
- Robert, K.Q.; Blanchard, L.J. Cotton Cleanability. Part I: Modeling Fiber Breakage. Textile Res. J. 1997, 67, 417–427. [Google Scholar] [CrossRef]
- Robert, K.Q.; Price, J.B.; Cui, X. Cotton Cleanability—Part II: Effect of Simple Random Breakage on Fiber Length Distribution. Textile Res. J. 2000, 70, 108–115. [Google Scholar] [CrossRef]
- Lin, Q.; Xing, M.; Oxenham, W.; Yu, C. Generation of cotton fiber length probability density function with length measures. J. Text. Inst. 2012, 103, 225–230. [Google Scholar] [CrossRef]
- Li, M.; Zhou, P.; Liu, Y.; Wang, H. Data-Driven Predictive Probability Density Function Control of Fiber Length Stochastic Distribution Shaping in Refining Process. IEEE Trans. Autom. Sci. Eng. 2020, 17, 633–645. [Google Scholar] [CrossRef]
- Kuang, X.; Hu, Y.; Yang, J.; Yu, C. Application of finite mixture model in cotton fiber length probability distribution. J. Text. Inst. 2014, 106, 146–151. [Google Scholar] [CrossRef]
- Kuang, X.; Yu, C. Generating cotton fiber length probability density function from fiber length parameters by finite mixture model. J. Text. Inst. 2014, 106, 655–662. [Google Scholar] [CrossRef]
- Kuang, X.; Hu, Y.; Yu, C. The theoretical yarn unevenness of cotton considering the joint influence of fiber length distribution and fiber fineness. Textile Res. J. 2015, 86, 138–144. [Google Scholar] [CrossRef]
- Krifa, M. Cotton fiber length distribution modality alteration in ginning and mill processing. J. Text. Inst. 2013, 104, 731–744. [Google Scholar] [CrossRef]
- Saunders, S.; Webb, J. Programming Excel with VBA and .NET; O’Reilly: Sebastopol, CA, USA, 2006. [Google Scholar]
- Walkenbach, J. Excel 2010 Power Programming with VBA; Wiley Pub.: Hoboken, NJ, USA, 2010. [Google Scholar]
- Utlaut, T.L. JSL Companion: Applications of the JMP Scripting Language, 2nd ed.; SAS Institute: Cary, NC, USA, 2018. [Google Scholar]
- McCormack, D., Jr. Making Exploration of Nonlinear Models Fast and Easy Using JMP® 10. In Proceedings of the SAS Global Forum, Orlando, FL, USA, 22–25 April 2012. [Google Scholar]
Disclaimer/Publisher’s Note: The statements, opinions and data contained in all publications are solely those of the individual author(s) and contributor(s) and not of MDPI and/or the editor(s). MDPI and/or the editor(s) disclaim responsibility for any injury to people or property resulting from any ideas, methods, instructions or products referred to in the content. |
© 2025 by the authors. Licensee MDPI, Basel, Switzerland. This article is an open access article distributed under the terms and conditions of the Creative Commons Attribution (CC BY) license (https://creativecommons.org/licenses/by/4.0/).