Highlights
What are the main findings?
- A procedure combining ball milling, liquid suspension, ultrasonication and gravitational settling is introduced that enables to prepare a material sample of polyacrylonitrile-based carbon fibers in order to maximize its concentration of critical WHO-analog fibers for the performance of toxicological tests.
- The number of critical WHO-analog fibers per total sample mass was enhanced from to fibers/mg and is therefore suitable for intraperitoneal testing in rodents according to the applicable guideline EUR 18748 EN and the German Technical Rule for Hazardous Substances No. 905.
What is the implication of the main finding?
- The results of subsequent toxicological studies using our material prepared according to the described procedure are expected to have high regulatory relevance, as they provide scientific data required for the development and implementation of a coherent regulatory framework for critical fibers.
- The use of semi-automated software tools and artificial neural networks developed in house facilitates the detailed and statistically representative morphological characterization of particle- and/or fiber-containing material samples in the future and represents a fundamental progress for the assessment of health risks related to quantified biopersistent respirable fiber fractions in dusts emitted.
Abstract
The aim to reduce health risks of workers related to inhalative exposure to potentially toxic dusts requires the selection of appropriate measures depending on the hazard classification of the dust-composing materials. Due to their biodurability, respirable carbon fibers and their fragments can impose such health risks but are currently lacking hazard classification. Here, a method is presented for fragmenting carbon fiber materials and enriching fibrous fragments to a level that is expected to allow differentiating between fiber and particle overload-related toxic effects. The method was applied to a commercial polyacrylonitrile-based carbon fiber. It was ground in an oscillating ball mill, homogenized in a liquid using ultrasonication and left undisturbed for gravitational settling. This way, a vertical gradient in particle size and shape formed, from which the supernatant was collected. Fragment morphologies were characterized with large ensemble statistics by semi-automated evaluation of scanning electron microscopy images employing an artificial neural network for binary semantic segmentation. The number of fibrous fragments of respirable and thus critical fiber morphology was increased from to WHO-analog fibers per mg. This corresponds to a factor of about 15 compared to the initial ground material. Since the mass percentage of non-fibrous objects was also significantly reduced, the requirements for a subsequently scheduled toxicological study with intraperitoneal application were fulfilled. Intraperitoneal testing is an accepted method for assessing the carcinogenic potential of biopersistent fibers. The developed method allows enriching fibrous fractions of concern at acceptable throughput and enables testing fiber toxicological effects of respirable fragments from disintegrated polyacrylonitrile-based carbon fibers.
1. Introduction
Carbon fibers (CF) are mainly used in composite materials for lightweight high-performance structural components [1]. Compared to other precursors, polyacrylonitrile-based (PAN) CF are the most widely used variant and are produced in high volumes [2]. They are spun from polymer solution with resulting diameters of typically greater than and are thus initially non-respirable by design. However, despite their excellent mechanical properties, structural failure of CF or CF-containing composites can occur during manufacture, handling, use and recycling. Carbon fiber disintegration results in the formation of granular and fibrous fragments that are of concern to human health if respired at critical doses.
In contrast to the widespread use of CF, there are only limited data from epidemiological and toxicological studies on the hazard of CF fragments and only sparse data on exposure to CF-derived dust [3,4,5,6,7,8,9,10,11,12]. Consequently, no CF-specific occupational exposure limits (OELs) have been implemented. However, being carbonized and partially or highly graphitic materials, CF are inorganic materials that must be considered to exhibit high biodurability. Accordingly, respirable fibrous and granular particles contained in CF-derived dusts can persist and accumulate in lung tissue. Granular CF dusts are therefore subject to general occupational hygiene regulations for inert dusts. Such regulations aim at preventing overexposure-related health effects by imposing mass-based exposure limits. Fibrous CF fragments are to be treated as inorganic fiber dusts with, in many countries, mandatory fiber number-based exposure limits. For example, the German “Technical Rules for Hazardous Substances” (TRGS 905) [13] recommend that all inorganic fiber dusts containing respirable fiber-like particles with specific dimensions of concern in terms of width, length and aspect ratio are to be classified as suspected carcinogenic according to category 2 of the European CLP Regulation (“Classification, Labelling and Packaging”) [14], unless sufficient toxicological data indicate non-toxicity. A material classified in category 2 can be declassified with a negative test result at both a dose of and a higher dose of fibers per rat using intraperitoneal testing [13]. To classify a material as presumably carcinogenic according to Category 1B (“Presumed to have carcinogenic potential for humans, classification is largely based on animal evidence.”), the corresponding guideline for toxicological testing [13] requires a positive test result at a dose of fibers.
The specific fiber dimensions of concern include fibers with a length , a width and a length-to-width aspect ratio greater than 3. These limits are also referred to as “WHO dimensions”, as they include those fibers that are to be counted according to the WHO fiber counting convention [15]. However, since the WHO counting convention must also be executable with phase-contrast optical microscopy, it does not count fibers thinner than . The term “WHO-analog” fibers will therefore be used subsequently.
In general, the tendency of a material to form fiber-like fragments depends on both the intrinsic anisotropic structural properties of the material and directional aspects of the disintegration-causing processes. Due to the increasing production, compounding and use of CF, a risk-based material classification seems necessary. In particular, the ongoing upscaling of the recycling of CF-reinforced composites, including technologies such as chemolysis, pyrolysis, shock wave application or Joule heating [16], leads to new release scenarios and potentially higher occupational exposure to CF-derived dusts.
In order to comply with occupational hygiene requirements, both an improved understanding of the toxicology of CF-derived dust particles and the efficacy of measures to control exposure to biodurable respirable fiber dust are necessary. While occupational risk assessment considers both the respired dose resulting from the release and exposure to fiber dusts, as well as fiber dust-specific hazards, hazard assessment alone is not concerned with the likelihood of fiber fragments formation but whether it can occur at all.
In intraperitoneal (i.p.) testing, a fiber suspension is injected into the peritoneum of rodents. The animals are subsequently observed for two years and investigated histopathologically for the occurrence of mesotheliomas. According to Ref. [17], all asbestos fiber types that caused mesotheliomas in humans, as well as all asbestos and manmade mineral fiber types that caused mesotheliomas in experimental animals after inhalation exposure, also caused mesotheliomas after i.p. injection in rats [18,19,20,21,22,23,24]. Despite the long history of fiber toxicological testing, the selection of appropriate tests is subject of ongoing discussion [25,26]. Some authors have reported a lower sensitivity of rats towards asbestos in inhalative compared to intraperitoneal application (see Figure 3 in Ref. [27]).
Although the systemic administration of fibers and particles bypasses physiological exposure pathways, it is widely accepted that direct intravenous or intraperitoneal injection of particles serves as a reproducible, valid and convenient method for investigating translocation mechanisms and biological responses [28].
Intraperitoneal tests in rats are considered specific for the carcinogenicity of biopersistent fibers and are accepted by EU regulatory authorities to investigate whether a fiber material can induce pleural or peritoneal tumors [29]. In contrast to fibers, biopersistent granular dusts were not able to induce mesotheliomas in this test, even when applied at very high doses of 4 × 20 mg per rat [30].
Test materials to be used for in vivo or in vitro toxicological studies that aim at identifying the hazards of a specific material must meet very high standards with respect to chemical and morphological characterization, endotoxin contamination, etc., especially when selected for inhalative, instillative or intraperitoneal application in rodents, also for ethical reasons. Even more challenging are the requirements for materials that allow differentiation between fiber and particle overload-related toxic effects in in vivo application, as the dose ratio of fibers to granular particles must be carefully controlled. This requires the laborious compilation of statistically representative morphological distributions of fragment length and width by means of microscopic analysis. In addition, the guideline for i.p. testing limits the total injected mass to a maximum of per animal [29]. A test material must therefore provide a dose of at least fibers of WHO-analog dimensions per sample material for the lower test dose of fibers per animal. Since i.p. studies are usually performed with at least 50 animals per dose level, this can result in a demand for the test material on a multigram scale. This excludes small-scale separation techniques and requires a moderate-to-high separation yield, along with a reasonable throughput per separation run.
Various techniques have been developed to generate fibrous test material from particulate matter (PM) for use in toxicological testing, including the use of sophisticated electrostatic precipitators as PM collectors [31,32] and of differences in gravitational settling, as were reported for airborne microplastic fibers [33]. Ball milling was found to be a less sophisticated but still effective source of fibrous CF debris when applied to various CF materials [34]. Both PAN-based and mesophase pitch-based CF disintegrated into fibrous fragments. Ball milling of a highly graphitic pitch-based CF produced a material with such a high content of WHO-analog fibrous fragments that it was directly subjectable to a fiber toxicological i.p. study in rodents. A publication on the results of this study is currently in preparation [17]. PAN-based CF showed a smaller but still significant tendency to form WHO-analog fragments compared to pitch-based CF [34].
The present work reports the results of a systematic study to enrich the fraction of WHO-analog fibrous fragments in ball-milled PAN-based CF samples to a level that allows to supply test material for toxicological i.p. studies that aim at the differentiation of fiber- and particle-related toxic effects. The range of process parameters that could be investigated in the present work for process optimization was comparatively large, as the laborious compilation of morphological distributions was supported by automated microscopic image acquisition and semi-automated fragment analysis.
2. Materials and Methods
2.1. Materials
Commercially available rovings of a PAN-based CF of type Tenax-E HTS40 F13 K12 with a density of 3 and a monofilament diameter of were provided free of charge by Teijin Carbon Europe GmbH (Heinsberg, Germany). This type of PAN-based CF was chosen because of its high applicational relevance and its tendency to produce more fragments of concern than other previously tested PAN-based CFs [34].
2.2. Methods
Manually pre-cut carbon fiber chops were disintegrated using an oscillating ball mill. The ground samples were suspended in a liquid and homogenized using ultrasonification with a sonotrode. The mixture was then left undisturbed to settle by gravity. After a definite time, the supernatant of the suspension was collected. The contained solid was collected by filtration using polycarbonate membrane filters clamped to a vacuum filter holder. Samples for scanning electron microscopy (SEM) analysis were filtrated on gold-coated membrane filters. Details are provided in the following sections.
2.2.1. Structural Disintegration by Milling
An oscillating ball mill of type MM200 (Retsch GmbH, Haan, Germany) with zirconia grinding jars and two zirconia grinding balls of in diameter (Retsch GmbH, Haan, Germany) per jar were used to grind the PAN-based CF material for at a vibration frequency of . Each jar was filled with a total of of the PAN-based CF roving cut into approximately pieces. Between two grinding runs, the jars and balls were cleaned with dry, low-linting tissue paper.
As reported earlier, the milling of carbon fiber roving cuts with a total length of only for about and with a frequency of provided a very finely ground material and a first estimation of the maximum proportion of WHO-analog fibers (WHOFO) of with respect to the total number of fragments [34]. As a first measure, the frequency was therefore reduced to . This made it necessary to also prolong the milling duration to to obtain a pourable ground material. By this, the proportion of WHOFO could be increased to about . In order to minimize the number of required milling processes to provide the required amount of test material, the CF quantity milled was tripled. Since this again reduced the milling energy transfer per CF mass, the length and diameter distribution of the resulting ground material changed, and the milling duration was adjusted accordingly. A milling duration of resulted in only WHOFO per all fragments. By further increasing the milling duration a maximum of up to , WHO-analog fibers could be identified after of milling. Another important criterion for evaluating the grinding process was a good pourability of the resulting dry material, which was required for its handling, weighing and dispersing in liquids. Short milling times yielded a strongly tangled product that could not easily be handled. Longer milling times yielded a fine-grained product and gradually decreased the resulting fragment size. Milling of for produced the material with the highest observed proportion of WHOFO with respect to the total number of fragments. It was used for the subsequent investigations.
Alternatives to the milling process were likewise investigated, including a modified apparatus for sandblasting and, for wind sifting, a vibro-fluidization device [35]. The former suffered from orifice blocking and low disintegration efficiency, and the latter yielded no significant WHO-analog fiber enrichment, probably due to insufficient fluidization in the rather short wind sifting column. In addition, as aerosol processing is more critical from an occupational safety point of view than for gravitational settling in liquids, it was depreciated.
2.2.2. Suspension and Sampling of Milled PAN-Based CFs for Morphological Analysis
A suspension of at least of the ground PAN-based CF was prepared with 2-propanol (Rotipuran grade, Carl Roth, Karlsruhe, Germany). To the experience of the authors, 2-propanol of Rotipuran grade is well suited as a suspension medium for CF fragments. In addition, 2-propanol of the selected grade evaporated without residues, which is important for the subsequent i.p. testing.
An aliquot of of the prepared suspension, containing a minimum of approximately ground CFs, was taken with a pipette from the center of the freshly shaken vial under magnetic rod stirring before any visible sedimentation of larger fragments occurred. That aliquot was then added dropwise into the funnel of a clamped vacuum filter holder (Merck Millipore, Darmstadt, Germany), which had previously been filled with about of 2-propanol. After rinsing the pipette tip, the resulting suspension in the funnel was stirred and vacuum-filtrated on gold-coated track-etched membrane filters of in diameter and a pore size (APC GmbH, Eschborn, Germany) using two support filters (deconta GmbH, Isselburg, Germany). No metal frit was used as filter support, as such frits were observed to lead to an inhomogeneous deposition. Up to of 2-propanol was used for rinsing the funnel. Loaded filters were subsequently imaged by SEM as outlined in Section 2.2.5.
2.2.3. Homogenization, Subsequent Gravitational Settling and Collection of Supernatants
A volume of of 2-propanol of Rotipuran grade was placed in a glass beaker of in volume and an inner diameter of . An ultrasonic tip (Microtip CL134) was positioned approximately at the mark. After dispersing a mass of of milled PAN-based CFs with a magnetic rod coated with PTFE in the 2-propanol, the ultrasonic probe (model FB705, Fisher Scientific, Pittsburgh, PA, USA) was operated for at an amplitude of “100”, resulting in a total output of about . Detailed information on how the ultrasonication duration affected the particle size distributions and the yield of WHO-analog fragments is described in Section 3 and discussed in Section 4.
The resulting suspension was left standing for . Without further delay, the supernatant liquid of in volume was gently collected by suction through a chemically resistant tube. The remaining lower volume was discarded. The collected supernatant was dispersed by manual vigorous shaking prior to taking an aliquot of in volume for an optional SEM analysis of the batch. The remaining suspension was vacuum-filtrated using a clamped vacuum filter holder (Sartorius Lab Instruments GmbH & Co. KG, Göttingen, Germany) on a polycarbonate membrane filter ( pore size, Whatman Nucleopore Cytiva). This yielded a filter cake, which was vacuum-dried at a reduced pressure of at room temperature overnight. On average, about sedimentation-refined material was obtained from the supernatant.
In total, 147 repetitions of this procedure were necessary to provide the requested amount plus reserve material for the planned subsequent toxicological study with i.p. application. To reduce the consumption of 2-propanol, the solvent obtained from filtering the supernatant was additionally filtrated through a track-etched polycarbonate membrane filter of in diameter and in pore size (Carl Roth, Karlsruhe, Germany) and reused in the subsequent run. Samples from reused 2-propanol were rinsed with fresh 2-propanol after filtration and before drying. Prior to shipping the test material to partners performing i.p. tests, all filtered and rinsed materials were dried at room temperature to remove any remaining 2-propanol.
During the settling of a particle suspension in the 2-propanol fluid of a density and a dynamic viscosity , a separation of different particle sizes occurs over time. Each particle settles with a velocity depending on its density , shape and orientation, which determine its equivalent-dynamic diameter.
For an elongated particle of length and width with , which settles being vertically oriented, i.e., parallel (), perpendicular (⊥) or random to the settling direction, the corresponding equivalent sphere diameters are [36,37]
The orientation of larger cylindrical particles of very regular geometry has been observed to occur perpendicular to the settling direction [38]. Due to the irregular, often wedge-like shape of our fragments, however, an orientation parallel to the settling direction is assumed. According to Stokes’ law, for a laminar flow regime and a specific height , the resulting gravitational settling of a spherical particle of diameter in a fluid would require a time of about
with being the acceleration of gravity of about 9.807 m/s². Consequently, smaller particles sediment slower than larger ones, and, unless all particles have settled, a particle size gradient results.
After gravitational settling of the suspension for , the supernatant of a height of was skimmed off, filtered and the filtrate was collected as described above. For this sedimentation duration and height, assuming and for 2-propanol, spherical fragments inside the suspension with a diameter larger than about can escape the supernatant and reach the residue. When extending the gravitational settling to , an even higher concentration of WHO-analog fibers was collected (see Table 1). Settling for and collecting corresponded to a supernatant height of and resulted in a lower escape diameter of spherical particles of .

Table 1.
Results of WHO-analog fiber enrichment experiments performing milling and suspending (i), followed by of ultrasonication (ii) plus (iii) or (iv) of gravitational settling for 3 replicate milling batches.
2.2.4. Preparation of Samples Obtained After Ultrasonication and Gravitational Settling for Morphological Analysis
To the aliquot taken from the shaken supernatant, as described in Section 2.2.3, a volume of 2-propanol of Rotipuran grade was added and the resulting mixture given into the funnel of a clamped vacuum filter holder (Merck Millipore, Darmstadt, Germany). After rinsing the pipette tip, the resulting diluted suspension was stirred and vacuum-filtrated on clamped gold-coated track-etched membrane filters of in diameter with in pore size (APC GmbH, Eschborn, Germany) supported through a support filter (deconta GmbH, Isselburg, Germany). The filter area exposed by clamping had a diameter of . After rinsing with 2-propanol and drying, this loaded filter was subsequently imaged by SEM as outlined in Section 2.2.5.
2.2.5. SEM Analysis and Morphological Characterization
Scanning electron microscopic (SEM) analysis of fragments on membrane filters was performed using a Hitachi SU8230 microscope (Hitachi High-Technologies Europe GmbH, Krefeld, Germany). A total of 50 randomly distributed filter locations were imaged with a size of pixels and a magnification of , corresponding to a pixel resolution of at an electron beam energy of and a working distance of about using in-house developed software for automated stage control and image acquisition. The evaluation of SEM images was done visually by trained personnel, supported by an in-house developed, semi-automated object morphology analysis software (version 1.4.42) [39].
On each acquired image, all visible fibers and particles were marked and counted according to a set of specific counting rules, as described in detail in the Supplementary Information. Briefly, all objects were counted, and the two lateral extensions of their two-dimensional SEM projection image were measured algorithmically, see below, to determine length and width , with . These morphological data on length and mean width were used to categorize each object either as a high aspect ratio fiber object (HARFO) with or as a low aspect ratio particle object (LARPO) with . For LARPO, the equivalent disc diameter was calculated. The HARFO class was distinguished further into three disjunct morphological classes: (1) HARFO fragments exhibiting WHO-analog dimensions (WHOFO), (2) HARFO fragments thicker than (thick non-WHO-HARFO) and (3) HARFO fragments shorter than (short non-WHO-HARFO).
Figure 1 shows a sample SEM image of CF fragments collected after milling, ultrasonication and gravitational settling. Such images of pixel resolution and pixels in size were used for fragment morphology measurement, classification and counting. Typically, the HARFO fragments were of an irregular, often wedge-like shape.
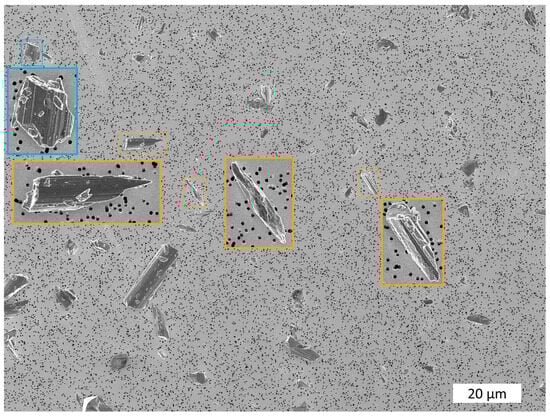
Figure 1.
SEM image of carbon fiber fragments after milling, ultrasonication and gravitational settling. The blue and orange dashed frames mark examples of one low aspect ratio particle object (LARPO) and three high aspect ratio fiber objects (HARFO), respectively, which are also shown as solid-line framed insets with a relative magnification factor of 3.
Software-assisted localization and binary semantic segmentation of CF fragments in SEM images were either performed manually, by marking all pixels showing CF fragments using the morphology analysis software, or semi-automatically, by using an artificial neural network (ANN) plug-in to this software (see Section 2.2.6).
The dimensions of all marked fragments were computed algorithmically: the length being the length of longest straight fiber backbone fully inside a fragment’s image, and the mean width being the average of measurements of the fragment image’s extensions orthogonal to this backbone. Usually, a minimum of 500 objects is evaluated on as many SEM images as necessary to reach this number. Each image was evaluated in its entirety.
For the analysis of CF fragments, an average suspended mass of to of ground CF was vacuum-filtered on a membrane filter of 25 mm in diameter, of which only an area with a diameter of approximately was left open by clamping. This resulted in a mass area density of about . At the selected pixel resolution of , one evaluated SEM image of pixels corresponded to a filter area of and represented a mass per image of approximately . Depending on the actual loading of the filter, in general, a filter area of to was evaluated, corresponding to about 5–15 images.
2.2.6. Semi-Automated Evaluation of SEM Images Using Artificial Neural Networks
In order to reduce the workload, SEM images were pre-evaluated using binary semantic segmentation masks predicted by a U-Net model to identify objects. This convolutional autoencoder model was trained on a large dataset of about 1000 manually annotated SEM images of in pixel size that showed carbon fibers, as well as carbon nanotubes, on track-etched membrane filters. The dataset was divided into two subsets, one for training and one validation using a ratio of 7:1. For data augmentation purposes, we randomly adjusted the image properties of brightness and contrast and rotated and flipped them. The training was stopped when no further improvement in the segmentation quality was achieved for the validation set within a period of 40 epochs. The model’s training process is described in detail in Ref. [39].
Although the predicted segmentation was generally very accurate, this automatic segmentation step was always followed by human visual inspection, and manual corrections of individual fragment masks were applied when necessary. Especially, fragments deposited on top of or in contact with one another were separated manually according to the rules described in the Supplementary Information.
Using this advanced image processing tool, in the scope of our process optimization, 93 samples were analyzed, and the length and width of 81,700 segments were determined.
2.2.7. Criteria to Assess the Material Refinement Progress
Since the toxicological regulations of i.p. testing constrain the total injected mass to a maximum of per animal, a dose of at least fibers of WHO-analog dimensions per sample material must be provided to reach the lower test dose of fibers per animal, as described in the Introduction. The number of WHOFO per mass is therefore the central criterion to decide whether a fiber sample is suited for i.p. testing. In addition, a sample should not contain particles that are too large to be respirable. For this reason, there is a recommendation for the 95th percentile of particle diameters of . Here, the equivalent disc diameter derived from the two-dimensional SEM image was used as a proxy for the particle diameter.
The following measurands were included in the assessment of morphological properties of the milled material and refined material samples:
- percentage of WHO-analog fibers to the total amount of fragments
- distribution of lengths and widths of LARPO, HARFO and WHOFO, respectively
- geometric mean of lengths and widths of HARFO
- geometric mean of lengths of WHO-analog fibers
- geometric mean of equivalent disc diameters of LARPO
- 95th percentile of equivalent disc diameters of LARPO .
3. Results
The milling and separation procedures were optimized to maximize the number concentration of WHO-analog fibers per sample mass while, at the same time, keeping the amount of work for the preparation of the amount of material needed for the in vivo study manageable.
WHOFO enrichment experiments were conducted with differently milled specimens, varied sedimentation durations and varied cut-off volumes, as well as with and without ultrasonic homogenization. The results of sequences of up to five replications of experiments varying the ultrasonication and gravitational settling duration are reported in Table 1 and visualized in Figure 2. Replications were conducted to study the reproducibility of the applied sampling and morphological characterization procedures. Upon milling pre-cut PAN-based CF, dispersing them in 2-propanol by shaking and sampling on filters, as described in Section 2.2.2, it was observed that the ground material tended to form agglomerates and covered the filters for SEM analysis inhomogeneously. Representative sampling on filters for SEM analysis proved difficult. Filter sampling and evaluation resulted in large variations of the number of WHOFO per mg sample (cf. the results of group i in Table 1).
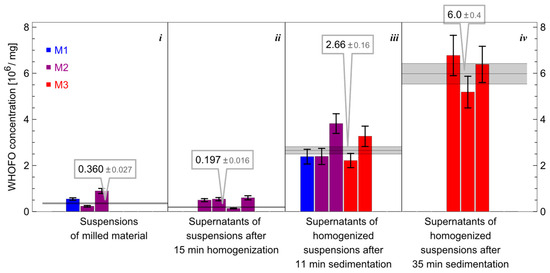
Figure 2.
Comparison of up to 5 replications of the process sequence of milling and suspending (i), followed by ultrasonication (ii) and (iii) or (iv) of gravitational settling using 3 replicate milling batches: M1, M2 and M3. The callouts and the gray horizontal bar give the error-weighted group averages of the WHOFO concentrations. The legend specifies the initial milling samples used for the replication.
Ultrasonication of the liquid suspension prior to the gravitational settling process improved both the sampling repeatability and the dispersion state. Treatment durations between 0 and 30 min were studied. Long treatment durations of caused considerable additional fragmentation, as they reduced the average mass of all fragments, especially that of WHOFO. The results for the object percentages and the arithmetic mass of the studied morphological classes are shown in Figure 3. It was found that the maximum number concentration of WHOFO per mass was obtained after 15 min of ultrasonication. The scatter plots and their histograms of results of different ultrasonication durations are shown in Figure S5 in the Supplementary Information. They show a shift to shorter lengths and thinner widths with increasing ultrasonication time that is represented in the calculated geometric mean values. This duration was used in subsequent sedimentation duration variation experiments.
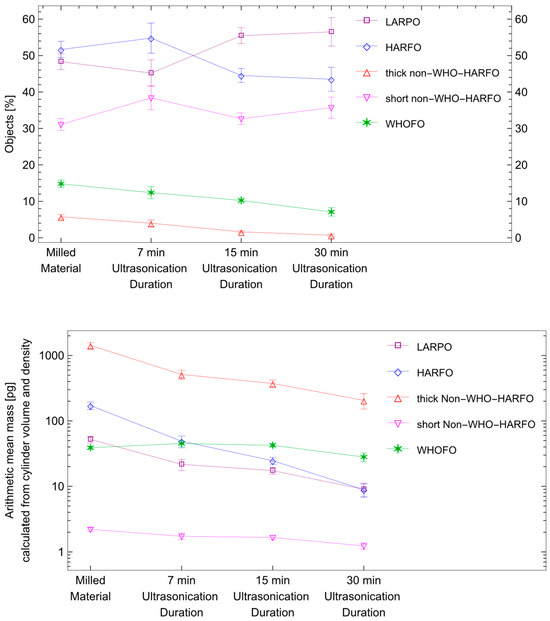
Figure 3.
Results from ultrasonication experiments with subsequent sedimentation for . Top: Relative percentage of morphologically classified fragments with respect to the sum of LARPO and HARFO. Bottom: Arithmetic mean of the masses of all morphologically classified fragments with measured length and width by assuming they exhibit a cylindrical volume and a specific density of . WHOFO, thick and short non-WHO-HARFO are disjunct sets that make up the HARFO class. The connecting lines are a guide for the eyes only.
Suspension homogenization with an ultrasonic treatment of improved the reproducibility of the determination of the WHOFO number concentration per mass in Figure 2 and Table 1 and enabled significant increases for prolonged gravitational settling duration. The WHO-analog fibers per mg material that are required for i.p. testing were achieved after a settling duration of 35 min (group iv).
The number of WHO-analog fibers per mg sample can increase with the settling duration if the total mass of all other objects, i.e., LARPO and non-WHO-HARFO, decreases faster than that of the WHOFO and, at the same time, the number of WHOFO does not decrease significantly faster than that of the other objects. The former is generally expected, as settling is faster for larger objects.
In order to better understand the increase in the number of WHOFO per mg sample during settling, the number of objects per filter area and the process yield in mass per filter area were calculated (cf. Figure 4). As these data sensitively depend on the correctness of the total mass on the filter, the more robust relative measurands object percentage and arithmetic mean of object mass were also calculated and plotted in Figure 5.
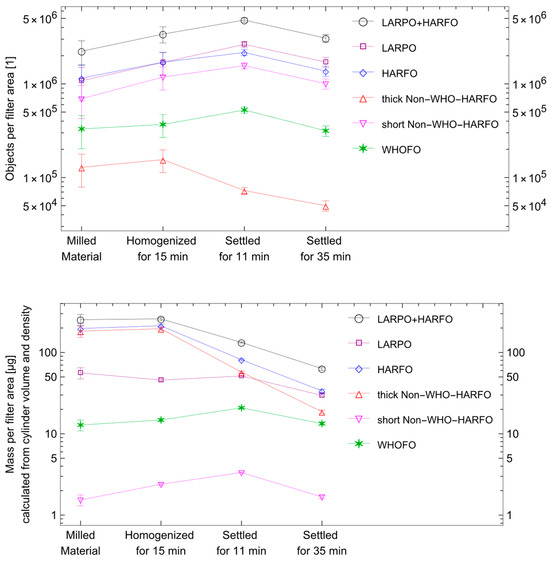
Figure 4.
Results from milling, homogenization and settling experiments. Top: Total number of morphologically classified fragments per filter and object class. Bottom: Total mass per filter and fragments class estimated from the mass of all morphologically classified fragments with measured length and width by assuming they exhibit a cylindrical volume and a specific density of . WHOFO, thick and short non-WHO-HARFO are disjunct sets that make up the HARFO class. The connecting lines are a guide for the eyes only.
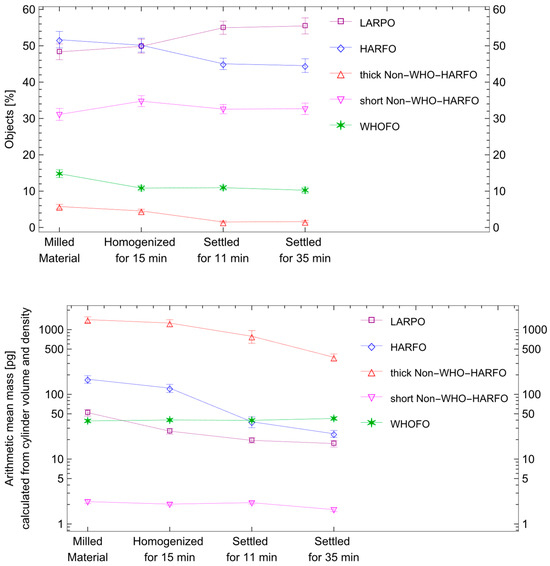
Figure 5.
Results from milling, homogenization and settling experiments. Top: Relative percentage of morphologically classified fragments with respect to the sum of LARPO and HARFO. Bottom: Arithmetic mean of the masses of all morphologically classified fragments with measured length and width by assuming they exhibit a cylindrical volume and a specific density of . WHOFO, thick and short Non-WHO-HARFO are disjunct sets that make up the HARFO class. The connecting lines are a guide for the eyes only.
The individual object mass was estimated from assuming a simplified cylindrical fragment geometry of length and diameter together with a specific CF density of . Please note that this calculation tended to overrate the true mass in Figure 4, as the maximum mass per filter was (cf. Section 2.2.5). This can be understood by Figure 1, which shows that the majority of fragments exhibited rather an irregular or wedge-like shape than a cylindrical shape.
After homogenization by ultrasonication, the total number of objects per filter area increased as a consequence of the effective separation of agglomerated fragments (Figure 4 top). For a settling duration of 11 min, the number of the largest objects, i.e., the thick non-WHO-HARFO objects, was promptly and significantly reduced. Prolonging the settling time to 35 min also yielded a reduction in the number of all other object classes, including the next-largest particles, the WHOFO.
When analyzing the overall yield of the process as mass per filter (cf. Figure 4 bottom), it becomes evident that the settling procedure reduces the mass yield, and this effect becomes more pronounced with a longer settling duration. It is driven mostly by a reduction in thick non-WHO-HARFO fragments. The necessity of producing an amount of multiple grams in total for the in vivo experiments therefore forced us to limit the settling duration to as any prolongation would further reduce the yield of WHO-analog fibers per experiment. This would have increased the number necessary of production runs to a no longer manageable quantity. About of refined material were filtered from of supernatant for a single run of the procedure at a settling duration of . Typically, a minimum of 50 animals per dose level ( WHO analog fibers) is required for performing i.p. studies, which results in 147 runs to produce the necessary amount plus reserve material.
Figure 5 shows the influence of the process on the relative percentage of morphologically classified fragments (top) and on the arithmetic mean of the masses of all morphologically classified fragments in the cylinder approximation explained above (bottom).
The sum of HARFO and LARPO yields 100%, so any changes in one of the classes are mirrored by the other. It is more instructive to analyze the percentage of the three HARFO subclasses introduced above: The short non-WHO-HARFO make up about 30% of all objects, the WHOFO about 10–15% and the thick non-WHO-HARFO about 1–6%.
In the top of Figure 5, the arithmetic mean masses of the morphological classes are shown. While the arithmetic mean mass for most classes is reduced when introducing and prolonging gravitational settling, this is not the case for the WHOFO. Their arithmetic mean mass remains constant, which is a consequence of the length and width limits that define the WHOFO and smaller masses of these fragments compared to thick non-WHO-HARFO.
Figure 2 shows the effect of the preparation procedure on the number of WHOFO per sample mass. With the data in Figure 4 and Figure 5, these results can be understood in more detail. The number of WHOFO per sample mass can be calculated from the number of WHOFO objects per filter area (cf. Figure 4, top) divided by the mass of LARPO and HARFO per filter area (cf. Figure 4, bottom). While the number of WHOFO remained constant, the masses attributed to LARPO and HARFO decreased. Thus, there was an increase in the number of WHOFO per sample mass.
During milling, the pre-cut carbon fiber rovings can disintegrate into smaller fragments each time a milling ball hits a fragment. The probability of a fragment being hit and split by a ball is smaller with decreasing fragment size. This results in the observed log-normal distributions for the lengths and widths of HARFO and LARPO [40]. They are shown in Figure 6 and Figure 7 together with a scatter plot of width versus length of all LARPO (purple), HARFO (blue) and WHOFO (gray) from the replicate samples of Table 1. Figure 6 shows the results for group i after milling and suspending but without the sedimentation step, and Figure 7 contains the data from group iv after a settling time of .
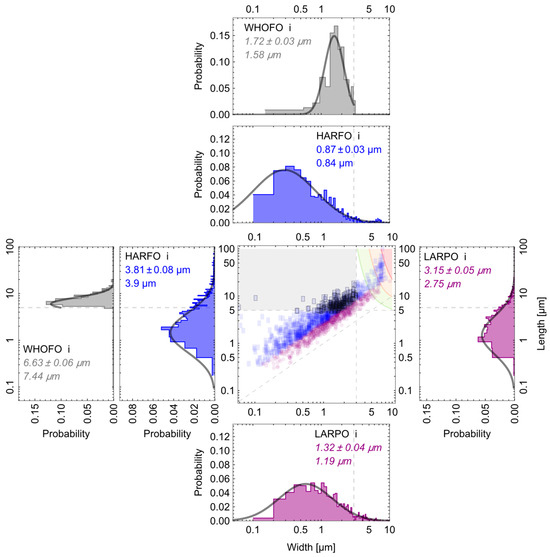
Figure 6.
Width vs. length scatter plot and associated probability distribution histograms of LARPO (purple), HARFO (blue) and WHOFO (gray), resulting from projections of the length vs. width scatter plot data, show the replicate samples of Table 1 after milling and suspending (group i). Log-normal distributions were fitted to the data to derive the derived geometric mean values. For WHOFO, log-normal distributions truncated to a length range of and a width range of were fitted. The results are specified in the histograms with error, whereas the calculated mean values are specified without error. Fitted geometric means that deviate more than three standard deviations from the calculated geometric mean are shown in italics. The green, orange and red contour lines correspond to escape diameters of , and for volume levels of , and above the residue volume level, respectively. The overlaid gray cast and dashed horizontal and vertical lines denote the WHOFO area.
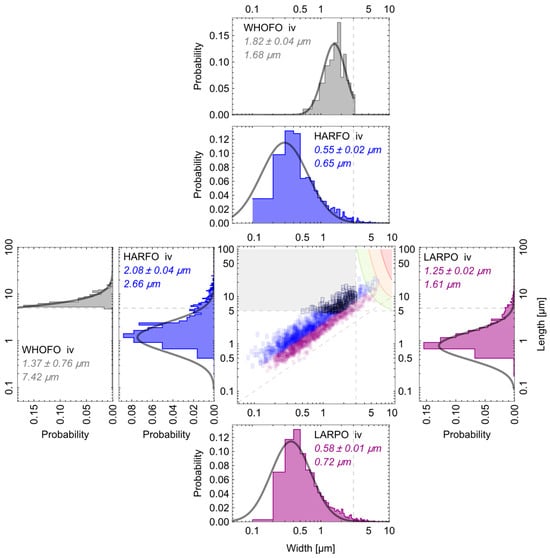
Figure 7.
Width vs. length scatter plot and associated probability distribution histograms of LARPO (purple), HARFO (blue) and WHOFO (gray), resulting from projections of the length vs. width scatter plot data, show the replicate samples of Table 1 after of gravitational settling (group iv). Log-normal distributions were fitted to the data to derive the geometric mean values. For WHOFO, log-normal distributions truncated to a length range of and a width range of were fitted. The results are specified in the histograms with error, whereas the calculated mean values are specified without error. Fitted geometric means that deviate more than three standard deviations from the calculated geometric mean are shown in italics. The green, orange and red contour lines correspond to escape diameters of , and for volume levels of , and above the residue volume level, respectively. The overlaid gray cast and dashed horizontal and vertical lines denote the WHOFO area.
To allow for better orientation, a gray cast and dashed horizontal and vertical lines were overlayed in these figures to denote the WHOFO area. This area is limited by two dashed lines, one at a width of and the other at a length of . All HARFO to the right of the line at make up the fraction of thick non-WHO-HARFO, and all HARFO below the line at make up that of the short non-WHO-HARFO. The effect of different settling durations is visualized by the green, orange and red contour lines in the upper right corner. They correspond to escape diameters of , and for volume levels of , and above the residue volume level, respectively. For example, a fragment with an equivalent diameter greater than and an initial position above the bottom of the vessel can escape into the residue during a settling duration of 35 min. If its initial position lies more than above the bottom, it will stay in the supernatant. Thus, the effect of fragment size selection varies along the suspension column height.
The dashed diagonal line denotes . As the length is defined as being larger than the width (cf. Section 2.2.5), no objects are found below this line. In both Figure 6 and Figure 7, the separation between LARPO and HARFO along the line corresponds to the definition of HARFO and LARPO (cf. Section 2.2.5).
The histograms of the length and width distributions correspond to projections of the respective fractions of the scatter plot and were added at the sides. Log-normal distributions were fitted to the data to derive the geometric mean values. Due to the length and width limits that define the WHOFO, their distributions deviate from log-normality. Therefore, log-normal distributions truncated to a length range of and a width range of were fitted. In the histogram plots, below the fit results with their error specified, also the calculated geometric mean values (without error) are given. Fitted geometric means that deviated more than three standard deviations from the calculated geometric mean are shown in italics.
Figure 6 shows the size distributions that result directly from the milling process after ultrasonication. It is noteworthy that this process resulted in fragments with a narrow distribution of aspect ratios, i.e., the number of fragments exhibiting an aspect ratio is small. Fractions of thick non-WHO-HARFO and thick LARPO are found in the upper right corner of the central plot, as no gravitational settling was performed. Here a number of fragments is found that exhibit a width of about , which corresponds to the width of the carbon fibers prior to milling. Thus, during the milling process, a small number of carbon fibers fragmented but remained intact with respect to the diameter. Such fibers are no longer present in Figure 7, as they were efficiently removed by the settling process, together with the majority of the other thick non-WHO-HARFO and thick LARPO.
Comparing Figure 6 and Figure 7, another effect becomes obvious: the center of gravity of the length and width histograms for HARFO and LARPO shifted to smaller values. At the same time, the geometric mean values in Figure 6 and Figure 7, which are derived either from calculation or from a log-normal fit to the histogram data, start to differ for a settling duration of in Figure 7. This indicates deviations of the size distributions from a theoretical log-normal shape, which are due to a non-log-normal selection process that removes larger particles more efficiently from the suspension than smaller ones and thus affects the log-normality of the distributions.
In contrast, comparing the WHOFO objects in Figure 6 and Figure 7, the width and length distribution, constrained by the WHOFO size limits, remain almost unchanged when adding the sedimentation process to the preparation procedure.
It should be noted that the fitting of a truncated lognormal distribution to the tail of the distribution leads to a high uncertainty of the fitting parameters, which is seen, e.g., in the fit of the length distribution of WHOFO in Figure 7. The results from the fitted mean geometric WHOFO length fit were therefore excluded from the data displayed in Figure 8, whereas Figure 9 includes the corresponding calculated geometric mean.
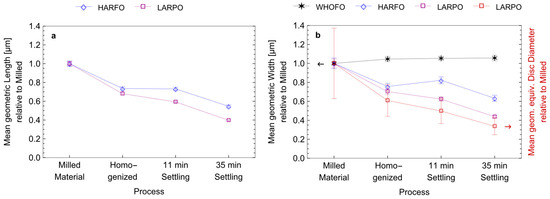
Figure 8.
Development of the fitted geometric mean of the lengths (a) and widths (b) normalized to that of the milled and suspended samples for the replicates of the homogenization and sedimentation procedures. The fitted geometric mean values used for normalization to the milled samples were determined as , , , , and . The data of the geometric mean WHOFO length are omitted, as they suffer from huge fitting error bars (see Figure 6). A separate y-axis is used for the equivalent disc diameter of LARPO shown in red. The red and black arrows indicate to use the right y-axis for the LARPO data and the left for all other data points, respectively. The connecting lines are a guide for the eyes only.
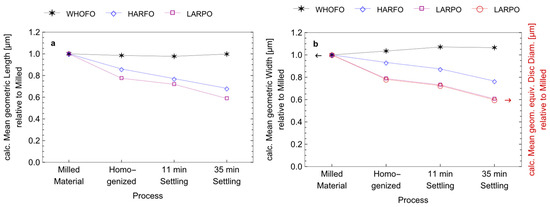
Figure 9.
Development of the calculated geometric mean of the lengths (a) and widths (b) normalized to that of the milled and suspended samples for the replicates of the homogenization and sedimentation procedures. The geometric mean values used for normalization of the milled samples were calculated as , , , , , and . A separate y-axis is used for the equivalent disc diameter of LARPO shown in red. The red and black arrows indicate to use the right y-axis for the LARPO data and the left for all other data points, respectively. The connecting lines are a guide for the eyes only.
All these effects are the consequence of the settling process, which systematically reduced the amount of larger, heavier particles while retaining the smaller particles. As the WHOFO belong to the larger and heavier objects after the settling process, their relative contribution to the sample increases as the number of WHOFO per mass increases, and this is the central quality criterion we were aiming to optimize.
The evolution of the fitted mean geometric length and width for HARFO, LARPO and WHOFO over the different processing steps is shown in Figure 8. The corresponding plots for the calculated geometric mean are shown in Figure 9. The data were normalized to the values obtained after milling the sample. A decrease in the mean geometric length and width is observed after homogenization, followed by a further decrease down to 40–60% of the initial value for 35 min of settling duration for the length and width of HARFO and LARPO. This trend and the nearly constant mean geometric width of WHOFO comply with the data trends on mass in Figure 3 and Figure 4. As an object’s length and width correspond to its mass, this complies with the rule that heavier particles are more likely to sediment into the residue, whereas smaller particles tended to remain in the supernatant part of the suspension.
The fact that the mean geometric widths of the WHOFO remained almost constant is a consequence of the fact that WHOFO are, by definition, confined to widths below . This size range was little affected by the selective removal of larger fragments, as the gray-shaded WHOFO area does not overlap with the region marked for three different escape diameters in Figure 7.
As settling affects larger fragments stronger than smaller ones, the separation effect can be visualized determining the 95th percentiles of the width and length distributions for the three types of fragments in Figure 10. For the milled material, the 95th percentile of the length distribution of HARFO was about . Additional homogenization and settling steps reduced it to about . A similar but less pronounced trend was found for the equivalent disc diameter of LARPO, whereas the 95th percentile of WHOFO width distribution remained constant. Although decreasing with the settling duration, Figure 10 shows that, even after , the 95th percentile of the LARPO equivalent disc diameter distribution is still a bit above the value of that is recommended for i.p. testing in rodents.
Figure 10.
Development of the 95th percentile of the lengths (a) and widths (b) for the replicates of the milling, homogenization and sedimentation procedures. For LARPO, an equivalent disc diameter was determined. The gray cast marks the targeted length and width ranges that are characteristic for WHOFO. A separate y-axis is used for the equivalent disc diameter of LARPO shown in red. The arrows indicate to use the right y-axis for the LARPO data and the left for all other data points, respectively. The connecting lines are a guide for the eyes only.
4. Discussion
Details of the milling process are crucial for the resulting disintegration of the studied CF material. In general, brittle materials can disintegrate into respirable fragments due to unidirectional or fiber axis-directed impaction or shear energy transfer. Likewise, intrinsically anisotropic materials were found to disintegrate into fibrous constituents or fragments during, e.g., planetary ball milling of CF [11] or ball milling of bamboo or jute fibers for the preparation of nanocellulose [41,42]. Other milling techniques used in cutting or rotor mills were not considered suitable for our purpose of toxicological testing, as they focus on length cutting. Since ball milling causes different mechanical failure modes in a material by both direct and indirect, as well as unordered multidirectional impaction and abrasion, it can reveal the general propensity of a material to form fibrous fragments [34]. For fibers of initial diameters exceeding the minimum WHO length requirement of , as is standard for CF, transversal fragmentation can, in principle, result in fragments of critical geometry, whereas directional disintegration can originate from or be promoted by intrinsic anisotropic microstructural characteristics of the carbon material. As repeated impaction and sequential splitting of larger fragments into smaller ones tend to form the observed log-normal-like size distributions, it takes continuously increasing milling durations to shift the geometric mean sizes of a milled batch to smaller values [43]. Compared to a granular fragment of the same diameter, a fiber-shaped fragment being milled requires several impacts to form granular fragments. It is therefore principally possible for fibers to survive a milling process for some time, provided the geometric mean size of the milled batch is not excessively reduced to a level that no longer contains the WHO-analog fiber fragments of interest. Indeed, ball milling of PAN-based CF was observed here to form fibrous fragments that exhibited such WHO-analog dimensions.
After an initial de-agglomeration step using ultrasonication, gravitational settling in liquid suspension was studied in order to enrich the number of WHO-analog fibers with respect to the total fragment mass. Discussions on the selection of form factors to properly describe the settling of spherical, elongated or irregularly shaped particles have recently gained new momentum from the microplastics research community [33,38,44,45]. The authors of Ref. [44], for instance, predicted only weak effects of shape on the settling velocity of carbonaceous particles with equivalent diameters below in 2-propanol, which is not compatible with the observations in Ref. [38]. Similarly, the authors of Ref. [33] observed perpendicular settling and predicted the long-range transport of microscale fibers. However, the irregular or wedge-like HARFO shapes of our carbon fiber fragments suggest that they could tend to orientate randomly (tumble) or vertically (parallel) to the settling direction and thus exhibit a larger effective equivalent diameter than a LARPO of the same mass. Stabilized perpendicular settling, as was observed in Refs. [33,38] for microscale fibers of close-to-perfect cylindrical shape, is considered less likely for our fragments.
Experimentally, the gravitational settling of our HARFO fragments was observed to proceed faster in general than that of the LARPO fraction and is therefore, in principle, not in favor of enriching fibers. However, with respect to all fragments, the fraction of WHO-analog fiber objects was nonetheless enriched both in absolute number and in number per mass. This results from the fact that WHOFO are, by definition, confined to widths below . That size range was little affected by the selective removal of larger fragments, as the gray-shaded WHOFO area in Figure 7 does not overlap with the region marked for the three different escape diameters . Therefore, the depletion of HARFO and LARPO fragments exceeding this width limit of 3 µm occurred faster than that of WHOFO.
By combined optimization of the milling and gravitational suspension settling conditions, it was thus possible to provide a material that showed a 15-fold increase from to WHO-analog fibers per sample mass compared to the milled CF material and complied with the regulations for i.p. application, which restricted the total injected test material mass (see Table 1).
The observed trends in the geometric means of length, width or equivalent disc diameter resulting from the process parameter variations are considered statistically significant, especially the relative enrichment factor of about 15. Statistical ensemble errors and error propagation effects were calculated and considered during error-weighted data fitting. The question of the validity of the assumption of a log-normal shape of the length and width distributions was addressed by comparing the calculated and fitted geometric means of the distributions. The fitting of the truncated distributions of the WHOFO lengths was of limited prediction reliability, however, for the geometric mean of the untruncated HARFO distribution, since its mean was close to or below the WHOFO length limit of and therefore not covered with populated bins. Likewise, the calculated geometric mean of a truncated log-normal distribution can never predict or represent the geometric mean of the untruncated distribution.
From an occupational safety perspective, it is beneficial to separate CF fragments in a liquid but not by aerosolization methods. The latter can be a source of respirable hazardous particles and thus be harmful to the operator [31,32,46]. Aerosolization sources are, however, appropriate for toxicological studies on inhalative applications in closed aerosolization and exposure set-ups.
2-propanol was chosen as a suspension liquid of manageable hazard properties with respect to flammability, irritability and environmental concern by disposal. Compared to water, 2-propanol exhibits a lower density and a higher viscosity, resulting in about 1.8 slower sedimentation. Water, a less toxic liquid, even of ultra-filtrated quality, tends to contain many micro- and nanoscale particles, whereas the 2-propanol quality used for this work dried without residue. To obtain ultrapure water, free of micro- and nanoscale particles, it is, however, recommended to prepare freshly double-distilled water [47]. It is also important to consider that more polar solvents like water can promote fragment agglomeration of non-polar materials like carbon or polymers [48]. However, as an organic solvent, 2-propanol could dissolve carbon fiber sizings and recoat the fragment surface upon drying. High-resolution SEM images, however, showed no indications of such a coating.
The parameter range studied here for optimizing the WHO-analog fiber yield and concentration was limited by the time required to obtain statistically representative particle size distributions for each experiment, as it requires the tedious and time-consuming morphological evaluation of many collected fragments on numerous SEM images.
With the help of our semi-automated image evaluation workflow, it was possible to identify a process chain that led to one order of magnitude of relative enrichment. This enabled us to provide sufficient amounts of a test material that conforms with the requirements of toxicological i.p. animal testing with a still manageable material preparation effort. The main deficit of the binary semantic segmentation used for semi-automated image evaluation was that overlapping fragments were not separated automatically, i.e., recognized as separate particle instances. Therefore, all images had to be visually checked for correctness and completeness, and the segmentation was amended whenever necessary. Despite this additional workload, the image segmentation was extremely accelerated, and optimum quality, i.e., on par with human instance segmentation, was obtained. Fully automated evaluation using advanced artificial neural networks is expected to enable investigating a significantly larger parameter range within a comparable amount of time and workload in the future.
5. Conclusions
Earlier statements [49,50,51,52] that carbon fibers do not form respirable fiber dusts and are therefore intrinsically safe per se were not confirmed by recent studies [34,53,54]. This raised occupational health concerns with regards to inhalation exposure to carbon fiber dusts and motivated fiber toxicological studies on carbon fiber fragments [17].
In order to avoid so-called overload effects caused by low-soluble, low-toxicity dust particles for fiber toxicological assessment by intraperitoneal tests of fragments formed from solid materials, the disintegrated material must be applied with a sufficiently high proportion of fragments of concern. To satisfy this constraint, the present study enriched the WHO-analog fiber-shaped fragments in samples of ground PAN-based CF with respect to other fragments.
This was accomplished by the systematic optimization of the conditions for milling, suspension homogenization, liquid-phase gravitational settling and collection of the resulting supernatant. The procedure described here combined ball milling, liquid suspension, ultrasonication and gravitational settling in a process that removed large fragments more effectively from the supernatant than WHO-analog fibers. By careful morphological characterization of the obtained test material, the process was shown to be capable of increasing the concentration of WHO-analog fibers per mass of ground polyacrylonitrile-based carbon fibers by a factor of about 15.
It was shown that the fiber concentration of the enriched material reached a level that is suited for intraperitoneal testing in rodents. The present work therefore enabled us to schedule a toxicological study with intraperitoneal syringe application of the obtained material. This will require drying and re-dispersion of the fiber-enriched material in a suited injection medium [55].
Intraperitoneal testing in rats is accepted by EU regulatory authorities as a way to investigate the carcinogenic potential of biopersistent fibers. Therefore, the results of subsequent toxicological studies using our enrichment approach are expected to have high regulatory relevance, as they provide scientific data required for the development and implementation of a coherent regulatory framework for critical fibers.
Time- and cost-efficient but a nonetheless detailed and statistically representative morphological characterization of particle- and/or fiber-containing material samples is of central importance not only for material enrichment process development but also for toxicological studies and occupational fiber exposure compliance testing [56]. The latter two aim at assessing health risks related to quantified biopersistent respirable fiber fractions in dusts emitted, e.g., during the production, use and recycling of advanced materials like carbon nanotubes, carbon nanofibers, carbon fibers and carbon–carbon composites.
To reliably assess the material quality, traditionally, a tedious and time-consuming morphological characterization of the fragments formed is mandatory. This task was facilitated and greatly accelerated by the use of semi-automated software tools and artificial neural networks developed in-house. Further progress in reliable automated characterization of sampled particle ensembles appears desirable nonetheless.
Artificial neural networks capable of so-called instance segmentation, i.e., recognizing adjacent or overlapping particles as individual objects, are expected to further improve the morphological quality in the future. The SEM images that were instance-annotated by computer-assisted humans in this work could provide the so-called ground truth data required for training such networks.
Supplementary Materials
The following supporting information can be downloaded at https://www.mdpi.com/article/10.3390/fib13060069/s1: Figure S1: Application of the counting rules: (a) An object with evenly cut end protruding outside the image frame is taken into account. (b) Particle cluster consisting of distinguishable individual fragments are counted separately, here 3 objects in black, grey and green. (c) Objects which are in contact with or even align to a larger object. The blue object is not taken into account when counting objects according to the counting rules, whereas the purple, red and green objects are to be counted as well as the black object.; Figure S2. Ultrasonication of the suspension of milled CF and 2-propanol.; Figure S3. Different stages of the evaluation of SEM images: (a) SEM-Image as acquired. A purple frame marks the zoomed-in-area used for (b); (b) selected object(s) zoomed-in prior to annotation; (c) semantic binary segmentation mask after ANN processing: recognized objects appear in dark blue. A red frame marks the zoomed-in-area used for (d); (d) annotated objects labelled A, B and C after use of ANN for annotation appearing in blue; (e) segmentation mask after manual reprocessing: objects after manual modification appear in green or purple for objects that protude out of the image. A yellow frame marks the zoomed-in-area used for (f); (f) several objects in green after manual reprocessing following the counting rules and added labelling for the distinguished segments 1–4. The blue object B remains unchanged from the ANN annotation since no changes were necessary. Impurity segment C (as visible in image (d)) was deleted.; Figure S4. Width and length probability distributions histograms of LARPO (purple), HARFO (blue) and WHOFO (gray), being the projections of the length vs. width scatter plot data, show the replicate samples of Table 1 after of ultrasonic treatment (group ii) and after additional of gravitational settling (group iii). For WHOFO, log-normal distributions truncated to a length range of and a width range of were fitted. Fitted geometric means that deviate more than three standard deviations from the calculated geometric mean are shown in italics. The green, orange and red contour lines correspond to escape diameters of , and for volume levels of , and above the residue volume level, respectively. The overlaid gray cast and dashed horizontal and vertical lines denote the WHOFO area.; Figure S5. Width and length probability distributions histograms of LARPO (purple), HARFO (blue) and WHOFO (gray), being the projections of the length vs. width scatter plot data, show the replicate samples after (a), (b) and 30 (c) of ultrasonic treatment and of gravitational settling. For WHOFO, log-normal distributions truncated to a length range of and a width range of were fitted. Fitted geometric means that deviate more than three standard deviations from the calculated geometric mean are shown in italics. The green, orange and red contour lines correspond to escape diameters of , and for volume levels of , and above the residue volume level, respectively. The overlaid gray cast and dashed horizontal and vertical lines denote the WHOFO area.; Figure S6. Probability distributions of the volumes of assumed cylindrical fragments of the measured length and width of LARPO (a), HARFO (b) and WHOFO (c) for the replicate samples of Table 1 after milling and suspending (i), followed by ultrasonication (ii) and after (iii) or (iv) gravitational settling. The WHOFO distribution was fitted with the PDF of a log-normal distribution. The corresponding mass can be estimated by multiplying the volume with the CF density of .; Figure S7. Aspect ratio () probability distributions of LARPO (a), HARFO (b) and WHOFO (c) for the replicate samples of Table 1 after milling and suspending (i), followed by ultrasonication (ii) and after (iii) or (iv) gravitational settling. The ratio of the PDFs of the log-normal distributions for length and width, truncated to the according aspect ratio ranges, were fitted to predict the difference of the geometric means of the length and the width distributions.
Author Contributions
Conceptualization, D.B.; methodology, N.R.y.F. and D.B.; software, T.P.; validation, N.R.y.F. and D.B.; formal analysis, N.R.y.F., D.B. and K.K.; investigation, N.R.y.F., D.B. and A.M.-P.; resources, D.W.; data curation, N.R.y.F., D.B., T.P., D.W., N.D., C.T. and A.M.-P.; writing—original draft preparation, N.R.y.F.; writing—review and editing, K.K., D.B. and A.M.-P.; visualization, N.R.y.F. and A.M.-P.; supervision, K.K.; project administration, N.R.y.F.; funding acquisition, D.B. All authors have read and agreed to the published version of the manuscript.
Funding
This research was funded under the grant No. 2022-004-N-P by the German BGHM (Berufsgenossenschaft für Holz und Metall). The authors thank the funder very much for their support.
Data Availability Statement
Numerical data on the fragment morphology of the ultrasonication and the settling series used for this work are provided in JSON format online. Other data are available from the corresponding author upon request.
Acknowledgments
The authors thank T. Alhajali for the excellent technical assistance, S. Plitzko for funding acquisition and supervision, and M. Mattenklott for scientific advice. The carbon fiber used in this study was provided free of charge by the manufacturer.
Conflicts of Interest
The authors declare no conflicts of interest. The funder approved an initial draft original prior to the submission to the publisher.
References
- Witten, E. Composites Market Report 2018; AVK: Adelaide, SA, Australia, 2018. [Google Scholar]
- Industry Experts, Inc. Carbon Fibers & Carbon Fiber Reinforced Plastics (CFRP): A Global Market Overview; CP015; Industry Experts, Inc.: San Dimas, CA, USA, 2018. [Google Scholar]
- Holt, P.F.; Horne, M. Dust from carbon fibre. Environ. Res. 1978, 17, 276–283. [Google Scholar] [CrossRef]
- Martin, T.R.; Meyer, S.W.; Luchtel, D.R. An evaluation of the toxicity of carbon fiber composites for lung cells in vitro and in vivo. Environ. Res. 1989, 49, 246–261. [Google Scholar] [CrossRef]
- Warheit, D.B.; Hansen, J.F.; Carakostas, M.C.; Hartsky, M.A. Acute Inhalation Toxicity Studies in Rats with a Respirable-Sized Experimental Carbon Fibre: Pulmonary Biochemical and Cellular Effects. Ann. Occup. Hyg. 1994, 38, 769–776. [Google Scholar] [CrossRef]
- Waritz, R.S.; Ballantyne, B.; Clary, J.J. Subchronic inhalation toxicity of 3.5-μm diameter carbon fibers in rats. J. Appl. Toxicol. 1998, 18, 215–223. [Google Scholar] [CrossRef]
- Warheit, D.B.; Hart, G.A.; Hesterberg, T.W.; Collins, J.J.; Dyer, W.M.; Swaen, G.M.H.; Castranova, V.; Soiefer, A.I.; Kennedy, G.L. Potential Pulmonary Effects of Man-Made Organic Fiber (MMOF) Dusts. Crit. Rev. Toxicol. 2001, 31, 697–736. [Google Scholar] [CrossRef]
- Zhang, Z.; Wang, X.; Lin, L.; Xing, S.; Wu, Y.; Li, Y.; Wu, L.; Gang, B. The Effects of Carbon Fibre and Carbon Fibre Composite Dusts on Bronchoalveolar Lavage Component of Rats. Sangyo Igaku 2001, 43, 75–79. [Google Scholar] [CrossRef]
- Wang, J.; Schlagenhauf, L.; Setyan, A. Transformation of the released asbestos, carbon fibers and carbon nanotubes from composite materials and the changes of their potential health impacts. J. Nanobiotechnol. 2017, 15, 15. [Google Scholar] [CrossRef]
- Tölle, L.; Monsé, C.; Rosenkranz, N.; Haibel, N.; Walter, D.; Bünger, J.; Hopp, M.; Westphal, G.A. Characterization of Fiber Dust Resulting from Recycling of Carbon Fiber-Reinforced Thermoplastics (CFRP) and their Cell Toxicity. J. Mater. Sci. Chem. Eng. 2022, 10, 1–16. [Google Scholar] [CrossRef]
- Friesen, A.; Fritsch-Decker, S.; Mülhopt, S.; Quarz, C.; Mahl, J.; Baumann, W.; Hauser, M.; Wexler, M.; Schlager, C.; Gutmann, B.; et al. Comparing the Toxicological Responses of Pulmonary Air–Liquid Interface Models upon Exposure to Differentially Treated Carbon Fibers. Int. J. Mol. Sci. 2023, 24, 1927. [Google Scholar] [CrossRef]
- Gandhi, S.; Lyon, R.; Speitel, L. Potential Health Hazards from Burning Aircraft Composites. J. Fire Sci. 1999, 17, 20–41. [Google Scholar] [CrossRef]
- Bundesministerium für Arbeit und Soziales. TRGS 905: Verzeichnis krebserzeugender, keimzellmutagener oder reproduktionstoxischer Stoffe. Gemeinsames Minist. 2016, 19, 378–390. [Google Scholar]
- European Union. Regulation (EU) 2024/2564 of 19 June 2024 amending Regulation (EC) No 1272/2008 of the European Parliament and of the Council as Regards the Harmonised Classification and Labelling of Certain Substances; European Union: Brussels, Belgium, 2024; Available online: http://data.europa.eu/eli/reg_del/2024/2564/oj (accessed on 16 April 2025).
- World Health Organization. Determination of Airborne Fibre Number Concentrations: A Recommended Method, by Phase-Contrast Optical Microscopy (Membrane Filter Method); World Health Organization (WHO): Geneva, Switzerland, 1997. [Google Scholar]
- Tian, Y.; Li, S.; Fu, Y.; Li, M.; Zhu, W.; Yan, K.; Ke, Y. High-quality electrostatic recycling of waste carbon fiber via spark-driven shock waves and Joule heating. Compos. Part B Eng. 2023, 263, 110880. [Google Scholar] [CrossRef]
- Wagner, A.; Schulz, F.; Meyer-Plath, A.; Dahlmann, F.; Rittinghausen, S.; Schaudien, D. Impact of carbon-based fibers morphologies on their carcinogenic potential. In preparation.
- Muhle, H.; Pott, F.; Bellmann, B.; Takenaka, S.; Ziem, U. Inhalation and injection experiments in rats to test the carcinogenicity of MMMF. Ann. Occup. Hyg. 1987, 31, 755–764. [Google Scholar] [CrossRef]
- Cullen, R.T.; Miller, B.G.; Jones, A.D.; Davies, J.M.G. Toxicity of Cellulose Fibres. Ann. Occup. Hyg. 2002, 46, 81–84. [Google Scholar] [CrossRef]
- Davis, J.M.; Bolton, R.E.; Miller, B.G.; Niven, K. Mesothelioma dose response following intraperitoneal injection of mineral fibres. Int. J. Exp. Pathol. 1991, 72, 263–274. [Google Scholar]
- Kamstrup, O.; Ellehauge, A.; Collier, C.G.; Davis, J.M.G. Carcinogenicity Studies after Intraperitoneal Injection of Two Types of Stone Wool Fibres in Rats. Ann. Occup. Hyg. 2002, 46, 135–142. [Google Scholar] [CrossRef][Green Version]
- Pott, F. Detection of mineral fibre carcinogenicity with the intraperitoneal test--recent results and their validity. Ann. Occup. Hyg. 1995, 39, 771–779. [Google Scholar] [CrossRef]
- Roller, M.; Pott, F.; Kamino, K.; Althoff, G.H.; Bellmann, B. Results of current intraperitoneal carcinogenicity studies with mineral and vitreous fibres. Exp. Toxicol. Pathol. 1996, 48, 3–12. [Google Scholar] [CrossRef]
- Scientific Committee on Occupational Exposure Limits. SCOEL: Recommendation for man-made mineral fibres (MMMF) with no indication for carcinogenicity and not specified elsewhere. SCOEL/SUM 2012, 88, 1–17. [Google Scholar]
- Harrison, P.; Holmes, P.; Bevan, R.; Kamps, K.; Levy, L.; Greim, H. Regulatory risk assessment approaches for synthetic mineral fibres. Regul. Toxicol. Pharmacol. 2015, 73, 425–441. [Google Scholar] [CrossRef]
- Hesterberg, T.W.; Hart, G.A. Synthetic vitreous fibers: A review of toxicology research and its impact on hazard classification. Crit. Rev. Toxicol. 2001, 31, 1–53. [Google Scholar] [CrossRef]
- Pott, F. Asbestos use and carcinogenicity in Germany and a comparison with animal studies. Ann. Occup. Hyg. 1994, 38, 589–600, 420. [Google Scholar] [CrossRef]
- Boyles, M.S.P.; Stoehr, L.C.; Schlinkert, P.; Himly, M.; Duschl, A. The Significance and Insignificance of Carbon Nanotube-Induced Inflammation. Fibers 2014, 2, 45–74. [Google Scholar] [CrossRef]
- Bernstein, D.M.; Riego Sintes, J.M. Methods for the Determination of the Hazardous Properties for Human Health of Man Made Mineral Fibres (MMMF). EUR 18748 EN. 1999. Available online: https://publications.jrc.ec.europa.eu/repository/handle/JRC18422 (accessed on 13 August 2024).
- Pott, F.; Roller, M.; Rippe, R.M.; Germann, P.-G.; Bellmann, B. Tumours by the Intraperitoneal and Intrapleural Routes and their Significance for the Classification of Mineral Fibres. In Mechanisms in Fibre Carcinogenesis; Springer: New York, NY, USA, 1991; pp. 547–565. ISBN 978-1-4684-1363-2. [Google Scholar]
- Pirhadi, M.; Mousavi, A.; Sioutas, C. Evaluation of a high flow rate electrostatic precipitator (ESP) as a particulate matter (PM) collector for toxicity studies. Sci. Total Environ. 2020, 739, 140060. [Google Scholar] [CrossRef]
- Badami, M.M.; Tohidi, R.; Aldekheel, M.; Farahani, V.J.; Verma, V.; Sioutas, C. Design, optimization, and evaluation of a wet electrostatic precipitator (ESP) for aerosol collection. Atmos. Environ. 2023, 308, 119858. [Google Scholar] [CrossRef]
- Tatsii, D.; Bucci, S.; Bhowmick, T.; Guettler, J.; Bakels, L.; Bagheri, G.; Stohl, A. Shape Matters: Long-Range Transport of Microplastic Fibers in the Atmosphere. Environ. Sci. Technol. 2024, 58, 671–682. [Google Scholar] [CrossRef]
- Meyer-Plath, A.; Kehren, D.; Große, A.; Naumann, R.; Hofmann, M.; Schneck, T.; Ota, A.; Hermanutz, F.; Dziurowitz, N.; Thim, C.; et al. Investigation of the Tendency of Carbon Fibers to Disintegrate into Respirable Fiber-Shaped Fragments. Fibers 2023, 11, 50. [Google Scholar] [CrossRef]
- Broßell, D.; Heunisch, E.; Meyer-Plath, A.; Bäger, D.; Bachmann, V.; Kämpf, K.; Dziurowitz, N.; Thim, C.; Wenzlaff, D.; Schumann, J.; et al. Assessment of nanofibre dustiness by means of vibro-fluidization. Powder Technol. 2019, 342, 491–508. [Google Scholar] [CrossRef]
- Lee, T.; Ku, B.K.; Walker, R.; Kulkarni, P.; Barone, T.; Mischler, S. Aerodynamic size separation of glass fiber aerosols. J. Occup. Environ. Hyg. 2020, 17, 301–311. [Google Scholar] [CrossRef]
- Cox, R.G. The motion of long slender bodies in a viscous fluid Part 1. General theory. J. Fluid Mech. 1970, 44, 791–810. [Google Scholar] [CrossRef]
- Dittmar, S.; Ruhl, A.S.; Altmann, K.; Jekel, M. Settling Velocities of Small Microplastic Fragments and Fibers. Environ. Sci. Technol. 2024, 58, 6359–6369. [Google Scholar] [CrossRef]
- Peters, T.; Schumann, J.; Kämpf, K.; Meyer-Plath, A. AI-assisted Recognition of Fibre Instances in Scanning Electron Microscope Images for Aerosol Characterization and Exposure Assessment. In preparation.
- Iliev, P.S.; Wittel, F.K.; Herrmann, H.J. Evolution of fragment size distributions from the crushing of granular materials. Phys. Rev. E 2019, 99, 12904. [Google Scholar] [CrossRef]
- Verma, Y.K.; Singh, A.K.; Paswan, M.K.; Gurmaita, P.K. Preparation and characterization of bamboo based nanocellulose by ball milling and used as a filler for preparation of nanocomposite. Polymer 2024, 308, 127396. [Google Scholar] [CrossRef]
- Baheti, V.; Abbasi, R.; Militky, J. Ball milling of jute fibre wastes to prepare nanocellulose. World J. Eng. 2012, 9, 45–50. [Google Scholar] [CrossRef]
- Sinkhonde, D. Particle size distribution-based models for predicting particle sizes of ground clay bricks: Theories that account for changes in milling times. Clean. Waste Syst. 2023, 5, 100099. [Google Scholar] [CrossRef]
- Qian, S.; Qiao, X.; Zhang, W.; Yu, Z.; Dong, S.; Feng, J. Machine learning-based prediction for settling velocity of microplastics with various shapes. Water Res. 2024, 249, 121001. [Google Scholar] [CrossRef]
- Zhang, J.; Choi, C.E. Improved Settling Velocity for Microplastic Fibers: A New Shape-Dependent Drag Model. Environ. Sci. Technol. 2022, 56, 962–973. [Google Scholar] [CrossRef]
- Fu, Y.; Tian, Y.; Li, M.; Ma, J.; Li, S.; Zhu, W.; Yan, K.; Ke, Y. Electrostatic manipulation for saturated charging and orientating of recycled short-chopped carbon fibers based on dielectric polarization. J. Clean. Prod. 2022, 380, 134912. [Google Scholar] [CrossRef]
- OECD. Test No. 125: Nanomaterial Particle Size and Size Distribution of Nanomaterials. In OECD Guidelines for the Testing of Chemicals; OECD: Paris, France, 2023. [Google Scholar]
- Fang, Z.; Sallach, J.B.; Hodson, M.E. Ethanol, not water, should be used as the dispersant when measuring microplastic particle size distribution by laser diffraction. Sci. Total Environ. 2023, 902, 166129. [Google Scholar] [CrossRef]
- Mazumder, M.K.; Chang, R.J.; Bond, R.L. Aerodynamic and Morphological Properties of Carbon-Fiber Aerosols. Aerosol Sci. Technol. 1982, 1, 427–440. [Google Scholar] [CrossRef]
- Boatman, E.S.; Covert, D.; Kalman, D.; Luchtel, D.; Omenn, G.S. Physical, morphological, and chemical studies of dusts derived from the machining of composite-epoxy materials. Environ. Res. 1988, 45, 242–255. [Google Scholar] [CrossRef] [PubMed]
- Seibert, J.F. Composite Fiber Hazards; AFOEHL REPORT 90-226EI00178MGA; Brooks Air Force Base: San Antonio, TX, USA, 1990. [Google Scholar]
- Schlagenhauf, L.; Kuo, Y.-Y.; Michel, S.; Terrasi, G.; Wang, J. Exposure Assessment of a High-energy Tensile Test With Large Carbon Fiber Reinforced Polymer Cables. J. Occup. Environ. Hyg. 2015, 12, D178–D183. [Google Scholar] [CrossRef] [PubMed]
- Kehren, D.; Simonow, B.; Bäger, D.; Dziurowitz, N.; Wenzlaff, D.; Thim, C.; Neuhoff, J.; Meyer-Plath, A.; Plitzko, S. Release of Respirable Fibrous Dust from Carbon Fibers Due to Splitting along the Fiber Axis. Aerosol Air Qual. Res. 2019, 19, 2185–2195. [Google Scholar] [CrossRef]
- Mattenklott, M. Bewertung von Faserexpositionen in Arbeitsbereichen. Gefahrstoffe—Reinhalt. Der Luft. 2022, 82, 123–131. [Google Scholar] [CrossRef]
- Porter, D.; Sriram, K.; Wolfarth, M.; Jefferson, A.; Schwegler-Berry, D.; Andrew, M.E.; Castranova, V. A biocompatible medium for nanoparticle dispersion. Nanotoxicology 2008, 2, 144–154. [Google Scholar] [CrossRef]
- Meyer-Plath, A.; Bäger, D.; Dziurowitz, N.; Perseke, D.; Simonow, B.K.; Thim, C.; Wenzlaff, D.; Plitzko, S. A Practicable Measurement Strategy for Compliance Checking Number Concentrations of Airborne Nano- and Microscale Fibers. Atmosphere 2020, 11, 1254. [Google Scholar] [CrossRef]


Disclaimer/Publisher’s Note: The statements, opinions and data contained in all publications are solely those of the individual author(s) and contributor(s) and not of MDPI and/or the editor(s). MDPI and/or the editor(s) disclaim responsibility for any injury to people or property resulting from any ideas, methods, instructions or products referred to in the content. |
© 2025 by the authors. Licensee MDPI, Basel, Switzerland. This article is an open access article distributed under the terms and conditions of the Creative Commons Attribution (CC BY) license (https://creativecommons.org/licenses/by/4.0/).