Highlights
What are the main findings?
- The bast fibers extracted from the second generation of energy crop Sida hermaphrodita L. biomass have consistent yield and stable productivity across different seasons;
- The results revealed a favorable moisture content, strength, and toughness, suitable for storage and processing.
What are the implications of the main findings?
- Sida hermaphrodita fibers are suitable for use in a wide range of industrial applications, where a combination of lightness, strength, and toughness is required;
- According to the circular economy principles, a high percentage of side streams after fiber isolation are successfully applied for biofuel production.
Abstract
Virginia mallow or Sida hermaphrodita (L.) Rusby (SH) is a perennial plant from the Malvaceae family (mallows) that is used for medicinal purposes, reducing soil erosion, cleaning soil, and most recently for energy production. The potential of sustainable lignocellulosic agro-waste is immense as it represents Earth’s most abundant organic compound. This paper explores fibers isolated from SH stems, a plant with significant industrial application potential, including technical textiles and biocomposites. The fibers were harvested in January, March, and November of 2020 and in January and March of 2021, and their yield, mechanical properties, moisture content, and density were thoroughly analyzed. The fiber yield showed slight variations depending on the harvest time, with consistent results observed across different years, suggesting stable productivity. The SH fibers demonstrated a favorable moisture content, making them suitable for storage and processing, and their density ranged between 1.52 and 1.58 g/cm3, comparable to that of other natural fibers. According to this research, the best mechanical properties were observed in the winter harvest. Furthermore, the high percentage of solid residue left after fiber extraction shows promise for sustainable utilization, primarily for biofuel production. This study underscores the versatility and sustainability of SH fibers, positioning them as a valuable resource for a wide range of industrial applications.
1. Introduction
The amount of plastic waste in oceans is increasing at an alarming rate, with global production projected to reach 500–600 million metric tons by 2025 [1]. Improper disposal worsens environmental concerns, as plastics degrade into micro- (<5 mm) and nano-plastics (<0.1 µm), posing risks to ecosystems and human health [2,3,4,5,6]. In humans, the toxicity assessments of micro- and nano-plastics primarily focus on gastrointestinal and pulmonary effects, including oxidative stress, inflammation, and metabolic disorders [7]. With growing ecological awareness, innovative and sustainable solutions for plastic- and oil-based products are more valuable than ever. In the area of textiles, the “nylon era” is ending as the global attention shifts toward natural fibers.
Declared by the UN in 2009, the International Year of Natural Fibres sparked global initiatives. By the mid-21st century, natural fiber production is expected to reach 40 million tons annually, growing at 3% per year [8]. Natural fibers have been used for more than 7000 years and are valued for their renewability, biodegradability, and versatility. The most well-known sources of natural fibers are plants, particularly their parts, such as seeds, bast, leaves, grass, and bark, as well as protein-based fibers and minerals. With excellent properties, such as hygroscopicity, air permeability, and environmental safety, they offer a sustainable alternative to synthetics [8]. These fibers will be key in reducing pollution caused by synthetic polymers and waste generated by unutilized natural fiber sources.
Lignocellulosic biomass (LC) has gained prominence as a crucial raw material for sustainable applications. To address the increasing demand for cellulose, while safeguarding arable land for food production, the future cultivation of energy crops should prioritize marginal and low-quality soils. Sida hermaphrodita demonstrates strong adaptability to such conditions, thriving in poor soils and enabling biofuel production, with an exploitation period of up to 20 years [9]. Its potential was first recognized in Poland [10]. Introduced to the former USSR in the 1930s, Sida hermaphrodita was initially valued for its use as a fodder crop, a nectar source for beekeeping, and a fiber plant for the textile industry. In Poland, it was cultivated for fodder and fiber production between the 1950s and the 1980s [11]. Over time, its remarkable energy properties have been acknowledged, and it is now predominantly utilized as a raw material for biofuel production [12].
1.1. Sida hermaphrodite’s Morphology
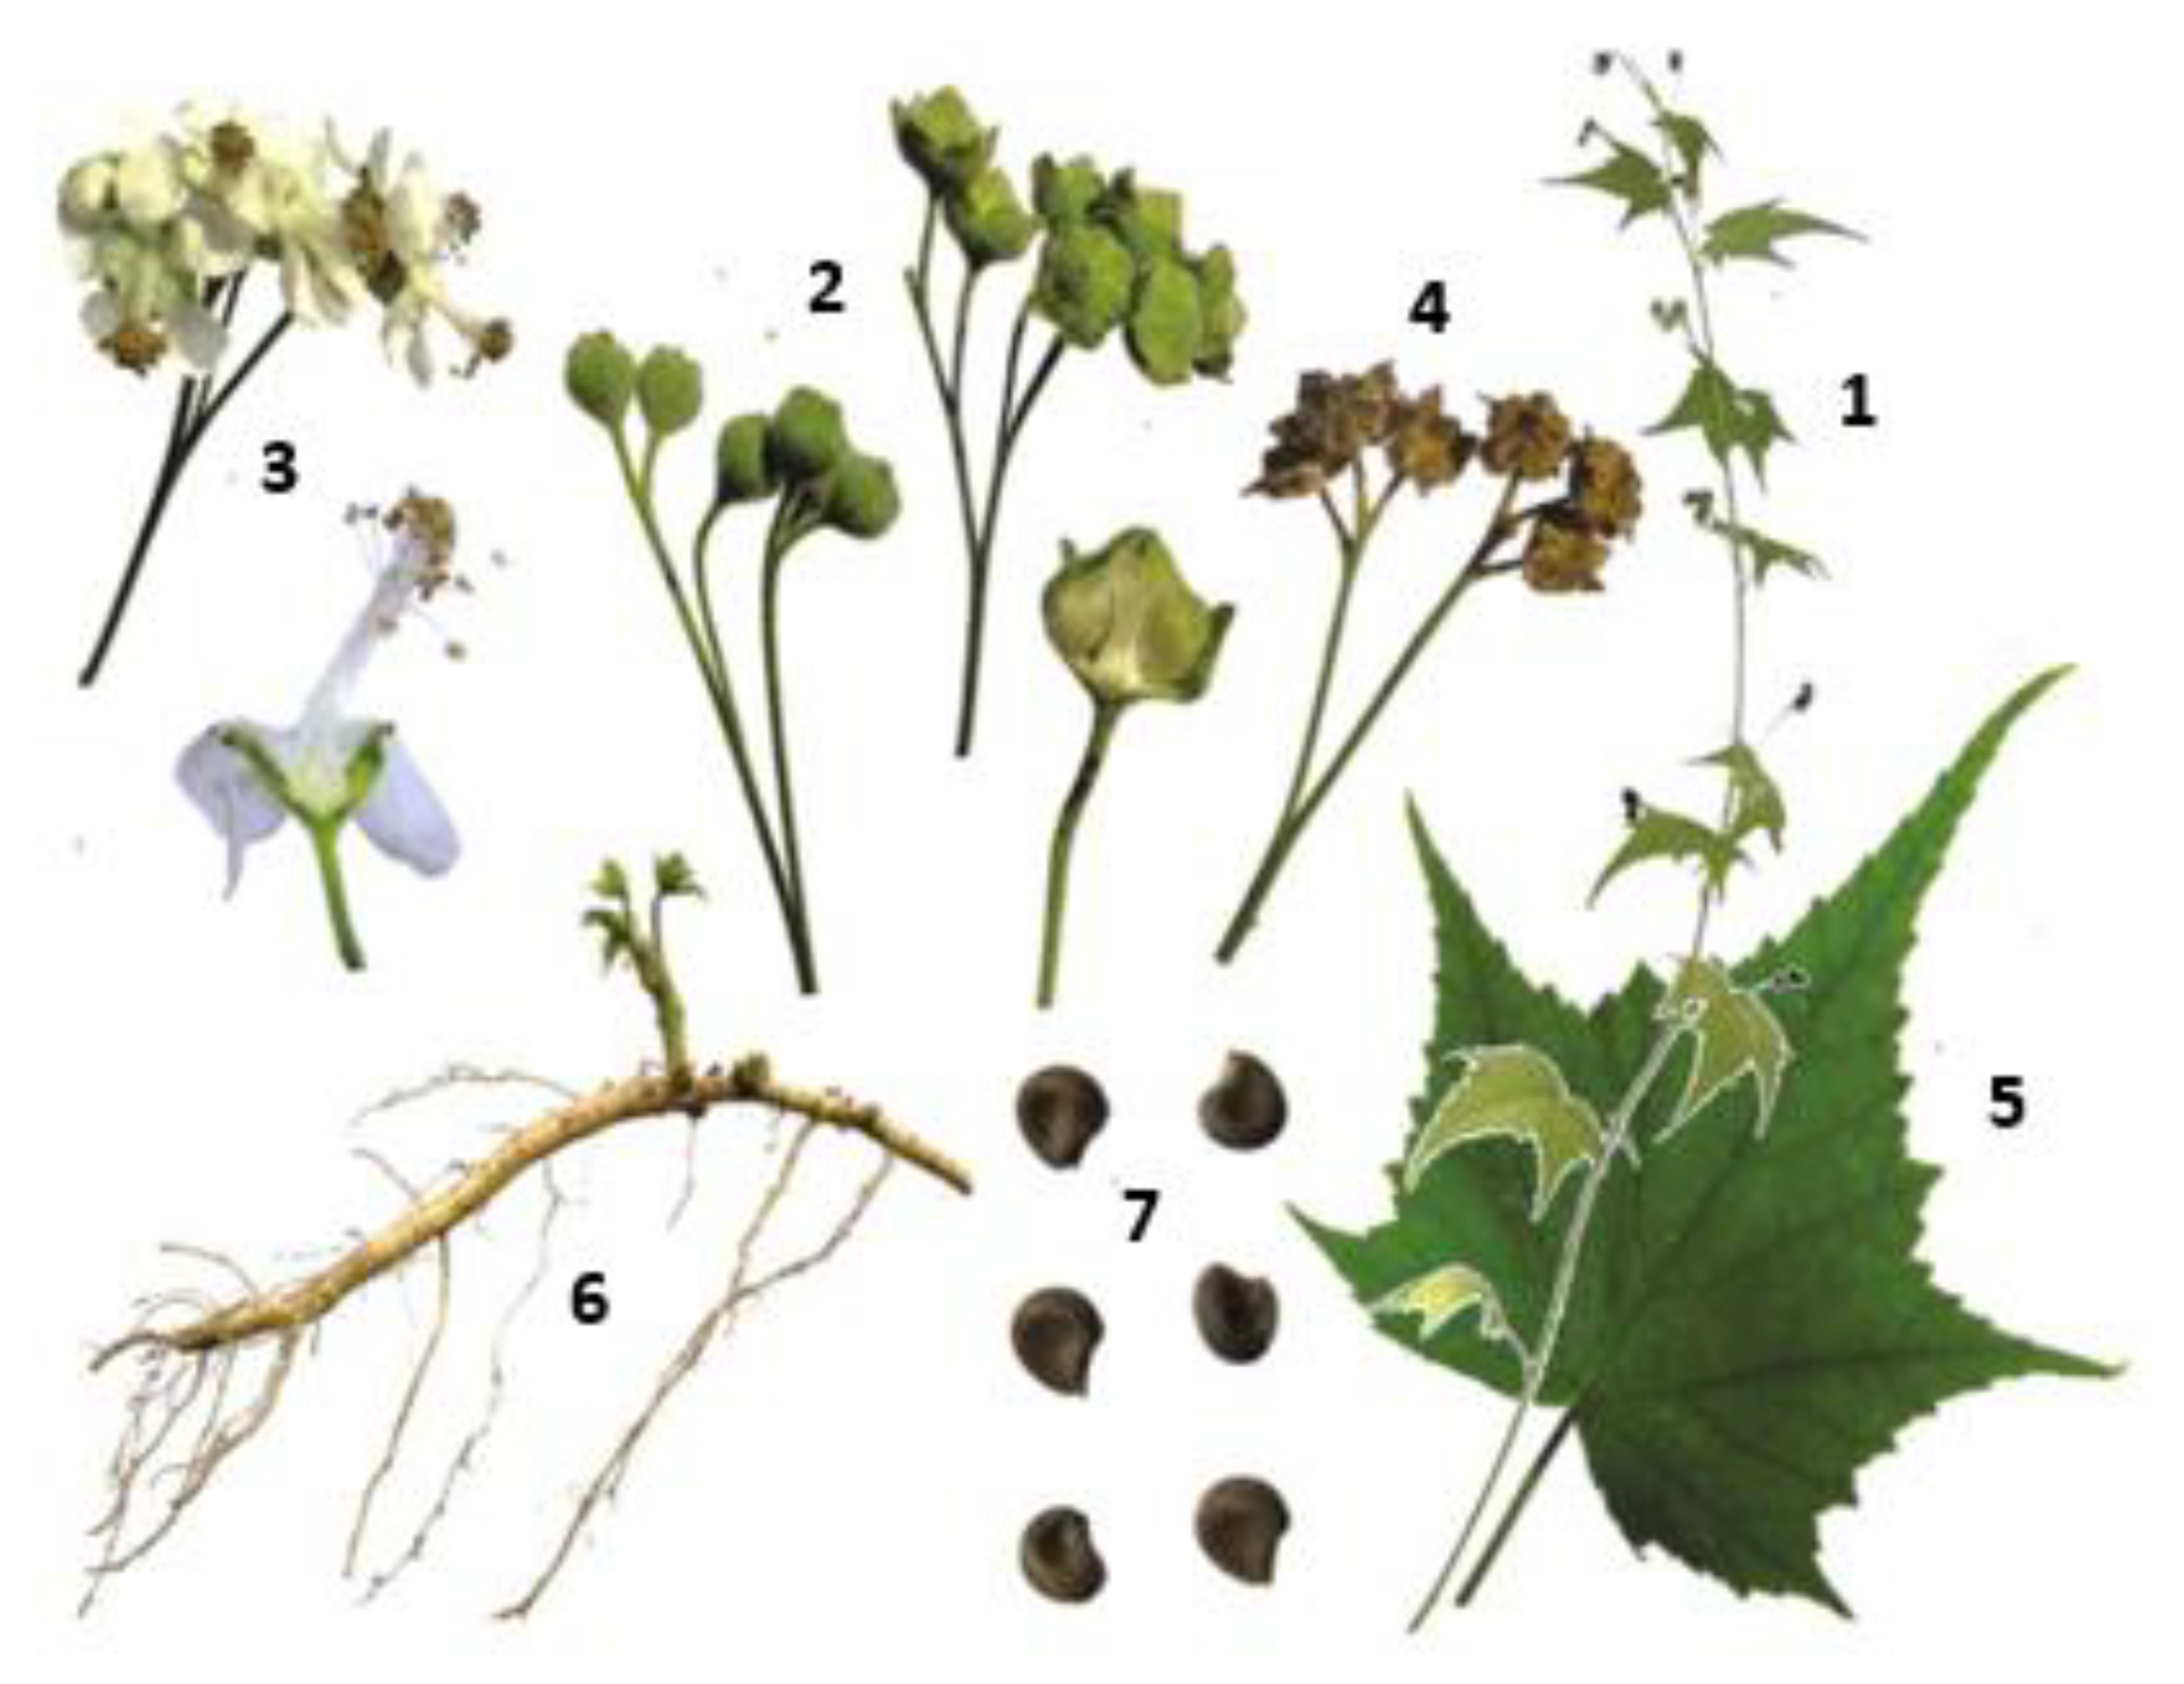
Sida hermaphrodita is a perennial plant reaching 1–4.5 m in height, typically around 3 m. Its pointed, maple-like leaves grow alternately along the stem, usually with 3–7 irregularly serrated lobes, the central one being the longest (Figure 1). Young stems are hairy, but become smooth with maturity. The plant produces clusters of white flowers, with flowers growing in early August, and continuing until the first heavy snowfall in October. Each flower has five petals about 8 mm long [9]. Seeds disperse during winter and germinate in early spring, with a single mature plant capable of producing several thousand viable seeds [13].
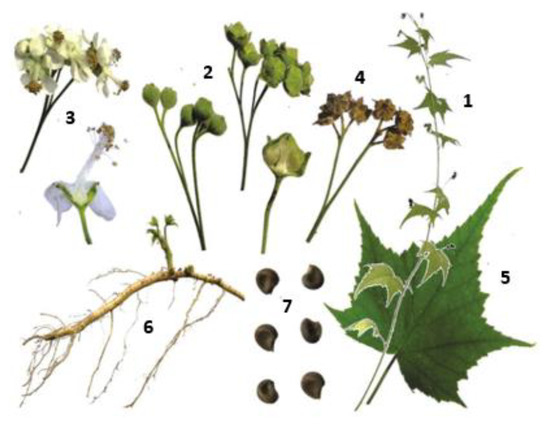
Figure 1.
Sida hermaphrodita L. Rusby: 1—generative sprout; 2—flower bud; 3—flowers; 4—fructification; 5—leaf; 6—root seedling; 7—seeds [14].
Shoots emerge from rhizomes from late April to early May, and the cultivated plant has a lifespan of 15–20 years. In the first year, a single shoot is typical, while by the fourth year, 20–30 shoots will have developed, creating a dense stand. The first harvest yields low biomass, with the highest yields observed in the third and fourth years of cultivation [9]. According to [15], yield depends on the soil and weather conditions, fertilization, and weed control.
1.2. Sida hermaphrodite’s Harvest and Usage
Sida hermaphrodita has been cultivated in various European countries, with Poland leading in research and plantation size, managing over 300 ha. In Germany, it covers around 100–150 hectares, primarily for experimental and seed production. Smaller plantations exist in Austria, Hungary, and Lithuania. As a perennial, it reduces the farming workload, ensures continuous ground cover, and can be harvested and stored using conventional techniques [16,17]. Biomass harvesting, depending on the region, takes place in February, March, and April or during the first frost in November and December, but always before the start of the new growing season [9].
The cellulose content, according to various researchers, ranges from 39.03% to 42.65% [18,19,20]. Notably, Jurišić et al. [20] observed that the lignocellulosic composition of Sida hermaphrodita is influenced by climatic conditions and the harvest time. It can be concluded that the harvesting yield in February and March results in a higher cellulose content (up to 45%) in the plant. Considering the high cellulose content, Sida hermaphrodita stands out as a promising cellulose source for various applications (Table 1).

Table 1.
Literature review based on Sida hermaphrodita usage.
According to research by Kurucz et al. [36] using nurse-in-tray technology (NIT), the cost of a single healthy SH plantlet ranges from just EUR 38.4 to 60.6, which is significantly lower than the market prices, and this process is more reliable than sowing. With production costs between 36 and 60 EUR/t, SH remains highly economical, especially for farmers utilizing local organic manure. Its profitability is further enhanced in marginal conditions, making it a cost-effective option for those seeking sustainable biomass production.
The European Union remains a key player in the bast fiber market, with significant exports of flax and other bast fibers. In 2023, Belgium ranked as the second-largest exporter, accounting for 16.6% of the total exports, while Czechia, France, the Netherlands, Poland, and Germany collectively imported 22.56% of these fibers [37]. Unlike the conventional bast fiber crops cultivated in Europe, Sida hermaphrodita, as a source of bast fiber, exhibits greater resilience to climatic fluctuations, reducing its susceptibility to environmental impacts. While climate change, COVID-19, and inconsistent harvests have influenced bast fiber prices, recent production recovery has contributed to market stabilization [38,39].
Utilizing locally sourced fibers would improve the sustainability of composites [34]. Virginia mallow, characterized by its high strength, represents a valuable raw material for bioproducts and paper production [40,41]. Incorporating natural fibers into bioproducts supports the development of sustainable materials with better mechanical properties and a smaller environmental impact.
Given the limited published research on the fiber production and properties of Sida hermaphrodita, the objective of this study was to investigate its potential as a source of natural fibers, which could be used for technical textile applications. This included the examination of its physical characteristics, such as moisture content, regain, and density, as well as morphology and structural and mechanical properties. This study also aimed to identify the optimal harvest time for fiber production. Additionally, this research highlights the feasibility of adhering to the zero-waste principle, demonstrating that a substantial portion of the solid waste remaining after fiber extraction can be utilized for biofuel production, thus contributing to a circular economy.
2. Materials and Methods
2.1. Materials
SH fibers were isolated from Sida hermaphrodita (L.) Rusby plants, which were manually transplanted as seedlings at the experimental field of the Faculty of Agriculture in Maksimir, Zagreb, Croatia. The biomass yield of the SH plants ranged between 15 and 20 t/ha on agriculturally suitable soils, with a dry matter content varying from 50 to 90%, depending on the harvest time. The average plant height at harvest was 2.93 m, with an average of 16.75 shoots per square meter [42]. In this study, the chemicals used included sodium hydroxide pellets (NaOH) (purity ≥ 97%), Sigma-Aldrich Inc., Gillingham, Dorset, UK. Concentrated acetic acid (C2H4O2) (min. 80%), T.T.T. d.o.o., Sveta Nedelja, Croatia was used to neutralize the alkali-pretreated SH plants.
2.2. Methods
2.2.1. Fiber Isolation
Dried Sida hermaphrodita (SH) biomass samples underwent alkaline pretreatment using a Tristar MW-2896 microwave oven. Dry SH stems were cut to fit within a 16.5 cm ∅ Teflon (PTFE) container and immersed in 5% (w/v) NaOH solution, maintaining a solid-to-liquid ratio of 1:6. Chemical maceration assisted by microwave radiation was conducted for 21 min at 900 W and 2.45 GHz; this power setting was selected to ensure effective processing, while minimizing the volumetric loss of the liquid phase.
Following the treatment illustrated in Figure 2, the samples were rinsed with hot water to facilitate fiber separation through mechanical friction between the stems. The extracted SH fibers were subsequently washed three times with hot water (until pH 8), four times with cold water (until pH 7), neutralized using 1.5% acetic acid, and finally rinsed three times with cold distilled water until a neutral pH (pH 7) was achieved [42].
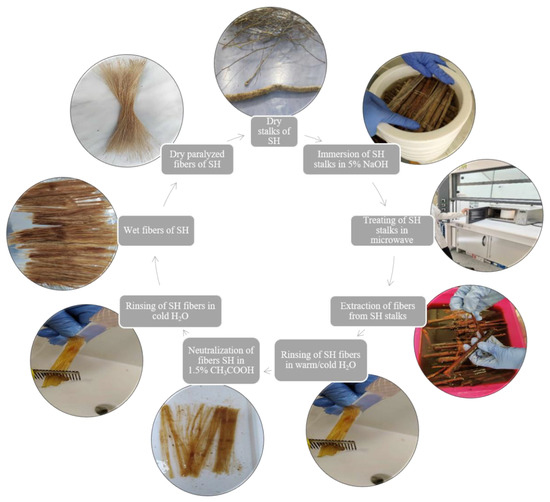
Figure 2.
Schematic diagram of process of chemical isolation of Virginia mallow fibers under influence of microwave energy [42].
This study encompassed the comprehensive evaluation of Sida hermaphrodita fibers, including fiber yield; measurements after the isolation process; and the testing of tensile properties, moisture content, regained moisture, and density. In addition, the morphology and surface chemistry of the isolated fibers were analyzed to gain a deeper insight into their structural characteristics. The Sida hermaphrodita plants were planted in April 2017. All the tests were conducted on fibers obtained from the plants harvested in January, March, and November 2020, as well as in January and March 2021. All the test results underwent statistical analysis using TIBCO Statistica 14.0.0 (Cloud Software Group, 2020). One-way ANOVA, followed by the post-hoc Duncan test and the test of normality were applied for data analysis and mean separation. The variability of measurements is expressed as mean ± SE (standard error of mean).
2.2.2. Fibers Moisture Content and Moisture Regain
The moisture regain (R) of the SH fiber sample was determined according to ASTM D2495-07 [43] using the drying method. The fiber samples were conditioned under standard atmospheric conditions (20 ± 2 °C and 65 ± 4% relative humidity) for 24 h. The conditioned samples were weighed on an analytical balance, and then dried in an oven at 105 ± 2 °C for 24 h. After drying, they were placed in a desiccator for 20 min, removed, and reweighed. The difference between the absolute dry sample and the conditioned sample was calculated using Equation (1):
- with the following symbols:
R—moisture regain (%);
mc—mass of the conditioned sample (g);
mab—mass of the absolute dry sample (g).
Another way to express the amount of moisture in fiber is the moisture content (C, %), representing the percentage of moisture in the air-dried fiber, calculated using Equation (2):
- with the following symbols:
C—moisture content (%);
ma—mass of the air-dried sample (g);
mab— mass of the absolute dry sample (g).
2.2.3. Fiber Density
The fiber density of Sida hermaphrodita (SH) was determined under atmospheric conditions following ASTM D2495-07 [44] using an Ultrapyc 1200e gas pycnometer (Quantachrome Instruments, Boynton Beach, FL, USA). To ensure maximum measurement precision and penetration into the finest pores, high-purity nitrogen (N2) gas was used as the displacement medium. Measurements were conducted in triplicate to ensure precision. A more detailed description of the density measurement procedure is provided in the referenced manual.
2.2.4. Fibers Mechanical Properties
The mechanical properties of Sida hermaphrodita (SH) fibers were evaluated by Vibroskop and Vibrodyn 500 (Lenzing Instruments, Gampern, Austria). The testing parameters included a 1500 mg preload weight, a testing speed of 3 mm/min, and a gauge length of 5 mm. Prior to testing, the fiber samples were conditioned under standard atmospheric conditions (20 ± 2 °C, 65 ± 4% RH). An average of 1000 measurements were conducted on the fibers harvested in January 2020, while 100 measurements were performed for the fibers harvested in March and November 2020, as well as January and March 2021.
2.2.5. Fiber Morphology
The morphological characteristics of the Sida hermaphrodita (SH) fibers were examined using a scanning electron microscope FE-SEM (Mira, Tescan, Brno, Czech Republic). A cross-section of samples was prepared using the cryo method by immersing the samples into Deware filled with liquid nitrogen. Afterwards, they were cut, and analysis was conducted at a voltage of 20 kV and various magnification levels (187×, 2000×, and 16,067×) to obtain high-quality micrographs. Since textile materials are poor conductors of electric charge, the samples were coated with a thin layer of metal (Cr) to enhance their electrical conductivity prior to SEM analysis. The coating was applied using a specialized evaporator with an inert gas. During the scanning of the sample surface, an electron beam emitted electrons from the atoms within the sample, which were subsequently detected by an SE detector.
2.2.6. Fourier-Transform Infrared Spectroscopy (FTIR)
The investigation of the surface chemistry of the SH fibers from different the harvests was performed using a Spectrum 100 FTIR spectrometer, provided by Perkin Elmer, by using the attenuated total reflection (ATR) method. All spectra were recorded within the range from 4000 cm−1 to 380 cm−1, maintaining a resolution of 4 cm−1 over four scans. The mean value of five individual measurements was applied. The normalization of spectra was performed at 1159 cm−1, which is the area of C-O-C asymmetrical stretching.
The three standard crystallinity indexes, the total crystallinity index (TCI), the lateral order index (LOI), and the hydrogen bond intensity (HBI) [45], were determined by the following methods.
The total crystallinity index (TCI) was determined by the absorbance ratio from the 1365–1370 cm−1 (A1367) to 2900–2930 cm−1 (A2920) bands according (3) [46,47]:
TCI = A1367/A2920
The lateral order index (LOI) was determined by the absorbance ratio from the 1420–1430 cm−1 (A1424) to 897 cm−1 (A897) bands as follows (4):
LOI = A1424/A897
The hydrogen bond intensity (HBI) was determined by the absorbance ratio from the 3200–3500 cm−1 (A3337) to 1315–1320 cm−1 (A1317) bands as follows (5):
HBI = A3337/A1317
3. Results
3.1. Fiber Yield
The results presented in Table 2 show that the SH variety exhibits a variable fiber yield depending on the harvest time and year.
Table 2.
Fiber yield of Sida hermaphrodita plant according to different harvest times.
In 2020, the fiber yield for SH was 10.29% in January, 11.12% in March, and 9.82% in November. In 2021, the fiber yield increased slightly to 10.85% in January and 11.27% in March.
The properties of natural fibers, including the fiber content in the stem, can vary depending on biological diversity, the growth conditions, irrigation, the harvesting methods, and plant age [48,49,50,51]. The properties and purity of SH fibers in the stem can depend on plant maturity, the year and time of harvest, and the part of the stem from which the fiber was isolated. The mechanical properties of fibers vary depending on their location within the stem. As for example, bottom fibers possess the poorest mechanical properties, while middle fibers exhibit the best [52,53]. The assumption that a more mature stem has thicker branches leads to the conclusion that the stems harvested in March 2020 and 2021 have a higher fiber content due to the plant’s maturity.
These findings suggest that climatic conditions and harvest timing have a limited impact on the fiber yield of SH. Despite the observed variations, the overall yield remained relatively consistent, suggesting that SH has stable productivity across the different seasons and years. This stability makes SH a promising candidate for industrial applications, particularly in the production of technical textiles.
Statistical analysis revealed a significant difference in the mean fiber yield values for the SH plants from the different harvests (Fcritical < Fstatistical = 3.141 and p-value = 0.037107 < 0.05). Duncan’s post hoc test confirmed insignificant differences in the fiber yield values between most harvest groups (p > 0.05), except between SH-N-2020 and SH-M-2020 (p = 0.021449) and between SH-N-2020 and SH-M-2021 (p = 0.012476). This indicates that the fiber yield of the SH plant varies insignificantly depending on the harvest, with some exceptions.
Figure 3 presents the amount of precipitation spanning over four years (2017–2021) based on data published by the Croatian Meteorological and Hydrological Service from the Zagreb Maksimir region [54].
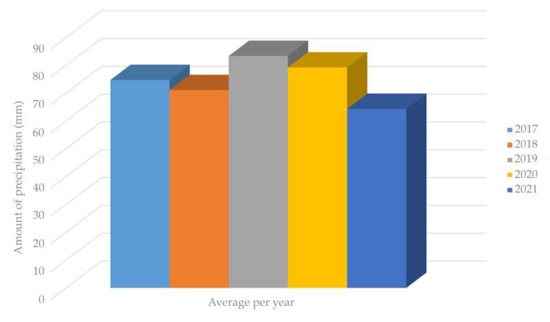
Figure 3.
Amount of precipitation spanning over four years (2017–2021) in Maksimir region.
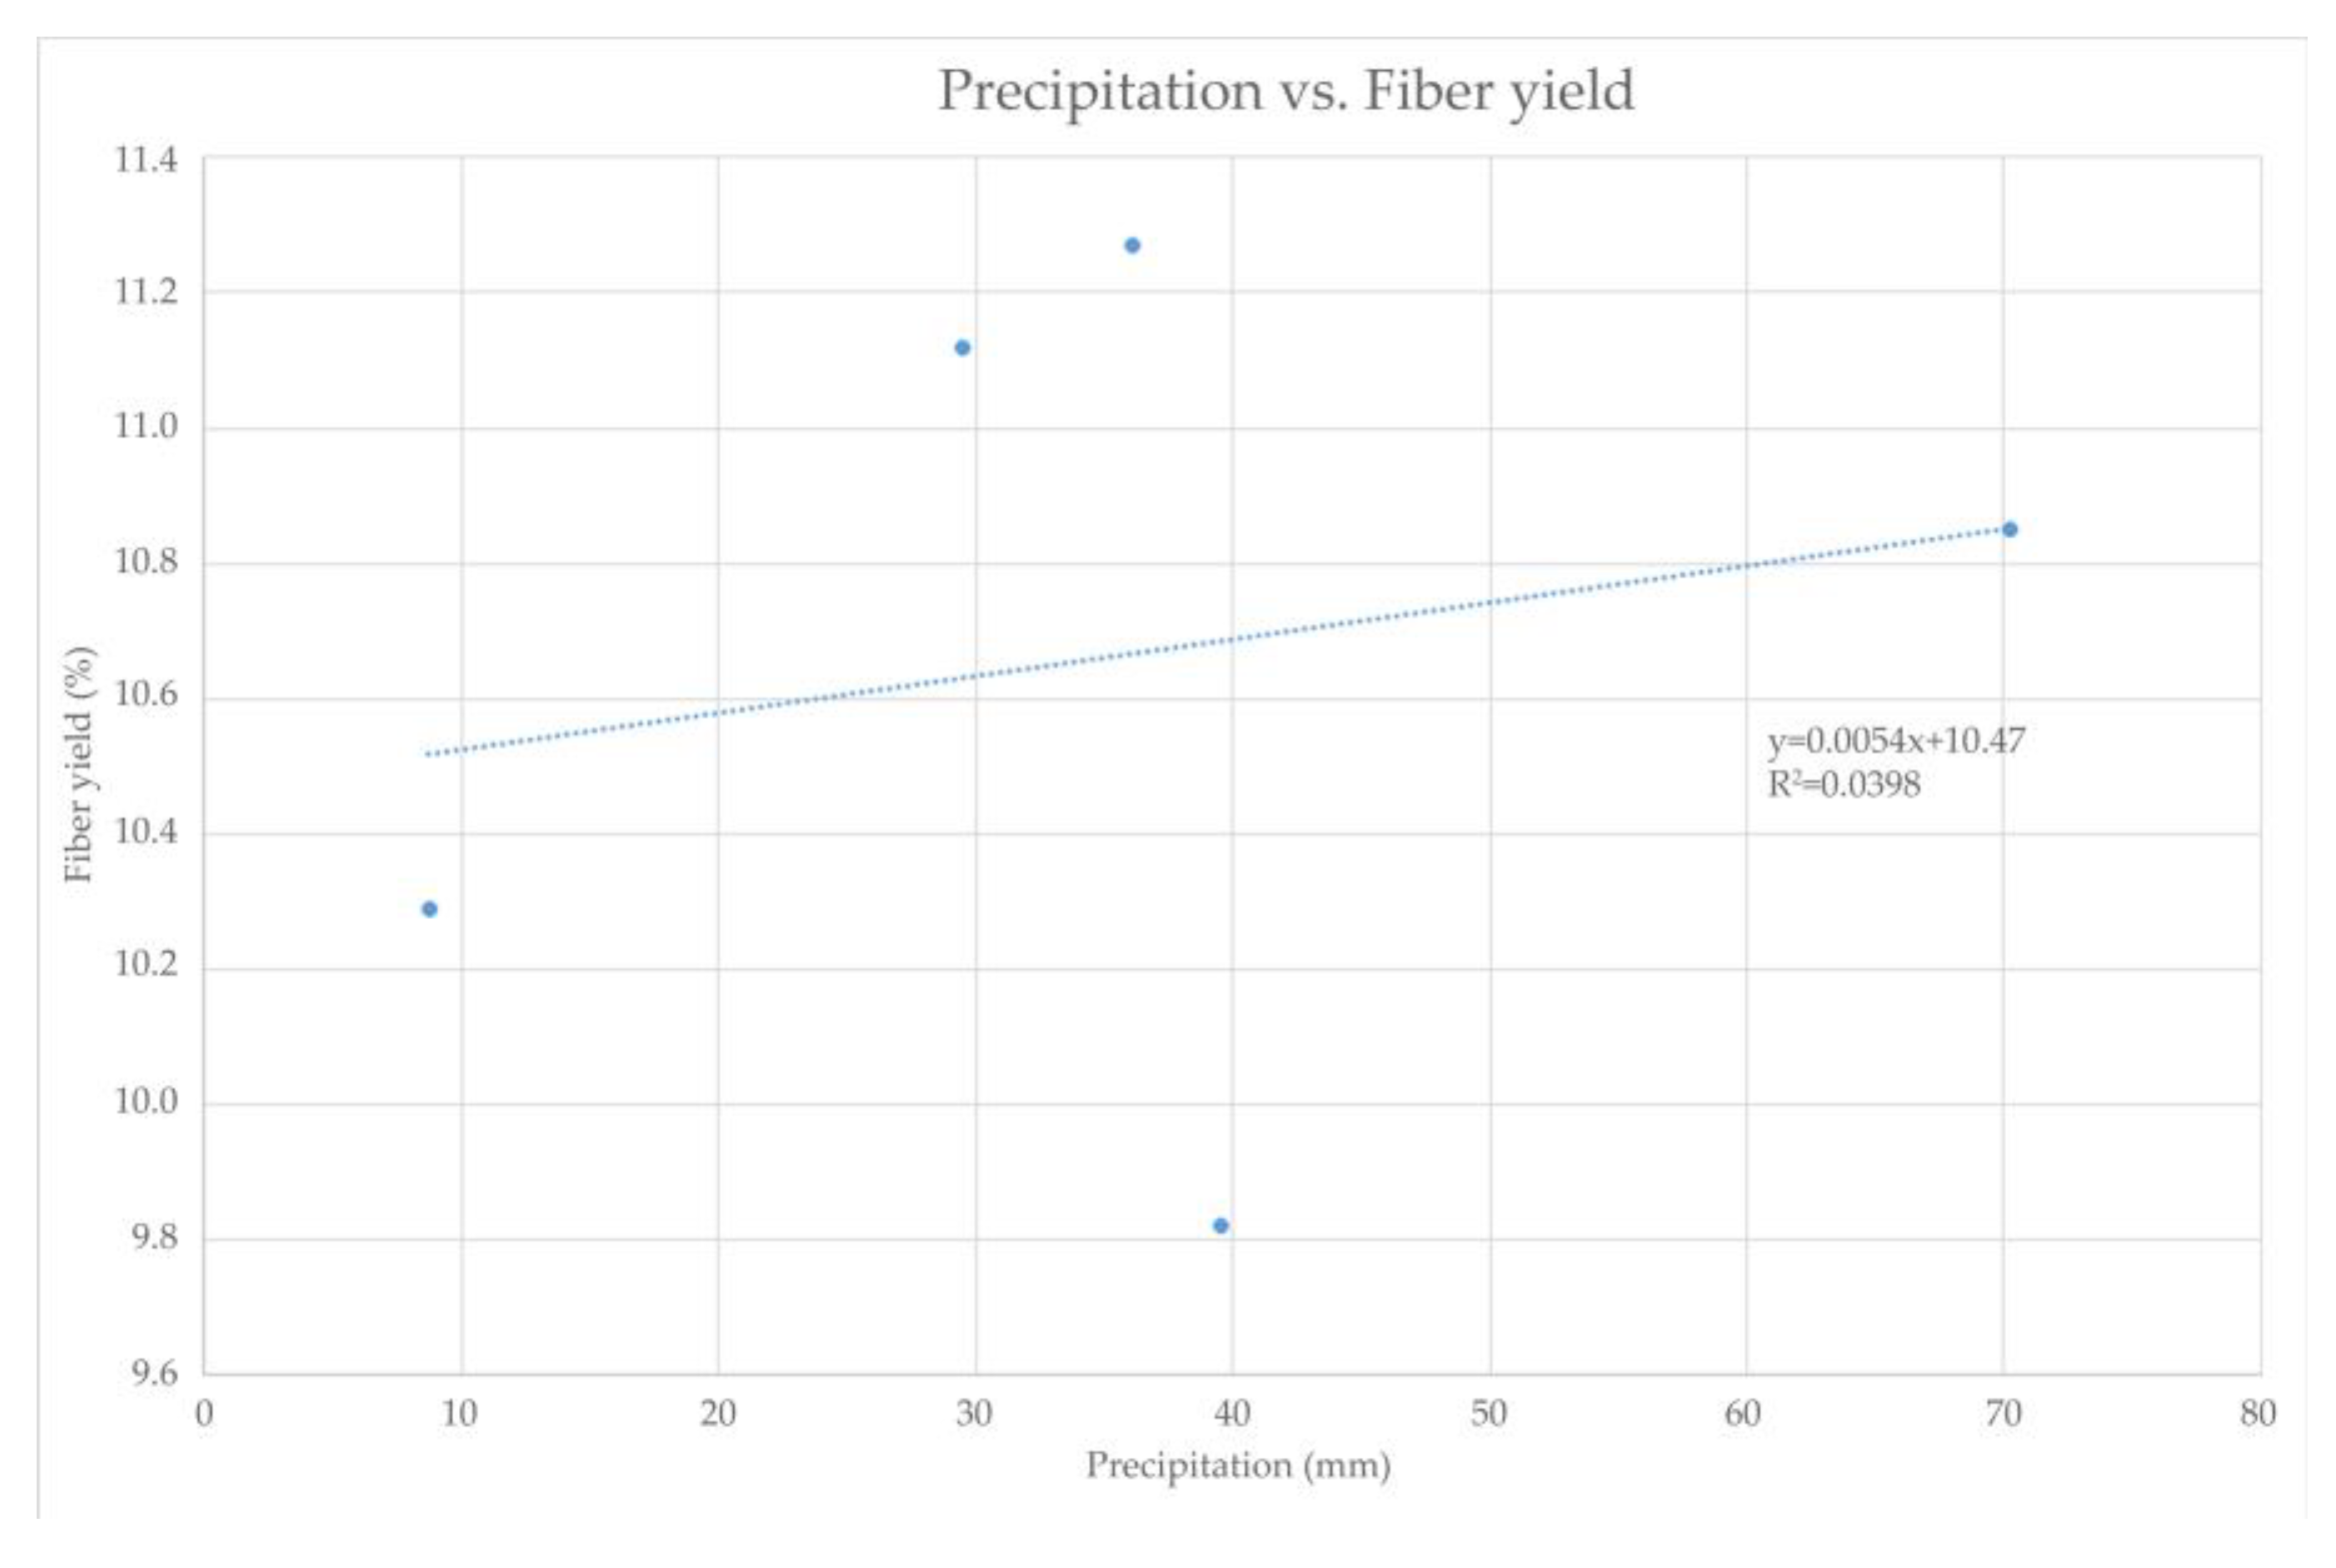
As shown in Figure 3, despite the lower precipitation levels in 2021, the SH plant, which is capable of tolerating extreme continental climate conditions, including harsh winter and dry summer conditions with a minimum annual precipitation of 400–500 mm, retained its fiber yield in the stem [15]. This statement is confirmed by Figure 4, where the relationship between fiber yield and precipitation can be observed. It can be seen that there is no significant impact of the precipitation on the fiber yield. Regression analysis shows a negligible relationship of these two parameters, which is indicated by an R-squared value of 0.0398, implying that 96% of the variation in SH fiber yield depends on factors (fertilizers, etc.) other than precipitation [55,56].
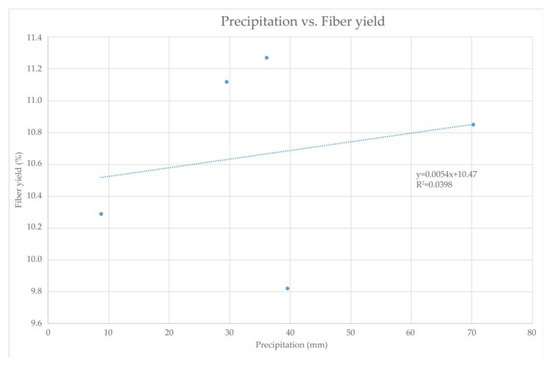
Figure 4.
Relationship between precipitation and SH fiber yield within harvest period from January 2020 till March 2021.
The fiber yield of flax fiber (the most common representative of bast fibers) is within the range 20–25% [57], while the yield of SH fiber from the current research is half the size. Nevertheless, the biomass dry stem yields of flax and SH are 5–10 t/ha and 10–20 t/ha, respectively, which indicate similar fiber yields from the stems [9,58].
Furthermore, the high percentage of solid residue remaining after SH fiber isolation (60–75%) presents an opportunity for sustainable resource utilization, such as biofuel production, supporting the circular economy model [59]. Lignocellulosic biomass such as SH solid residues after fiber isolation should be used for the production of solid biofuels; i.e., wood chips, pellets, and briquettes; liquid biofuels, i.e., ethanol and diesel; and gaseous biofuels, i.e., biogas. The calorific value of SH fuel can be expressed as a lower heating value (LHV), which presents the energy available for upcoming usage. Bilandžija, N. et al. [19] investigated the dependence of SH biomass LHV values over the harvest period and found out that the average LHV value of 17.85 MJ/kg indicates this crop as a valuable energy raw material for the direct combustion process. Biogas and (bio)methane production present significant economic potential in the transition from fossil fuels to renewable energy, while also contributing to the achievement of the sustainable development goals. According to the Final Report of the KK.01.1.1.04.0091 Biocomposites project [60], the cumulative biogas and (bio)methane yields (NL/kg VS) from SH residue after fiber isolation increased by 52.57% and 22.23%, respectively, compared to the cumulative biogas and (bio)methane yields from SH biomass before the fiber isolation process over a 24-day period. By maximizing fiber use and minimizing waste, the SH variety demonstrates significant potential for contributing to zero-waste manufacturing practices.
3.2. Tensile Properties
Natural fibers exhibit anisotropic properties due to their anisotropic structure [61]. The mechanical properties of bast fibers are mainly influenced by their biochemical composition, microfibril angle, cell geometry, secondary cell wall, cross-sectional area, and lumen size [62,63,64]. A higher cellulose content increases a material’s breaking tenacity and Young’s modulus, while a higher hemicellulose content reduces a fiber’s strength due to its amorphous nature. Fiber strength is inversely proportional to elongation, with stronger fibers showing lower elongation [65,66].
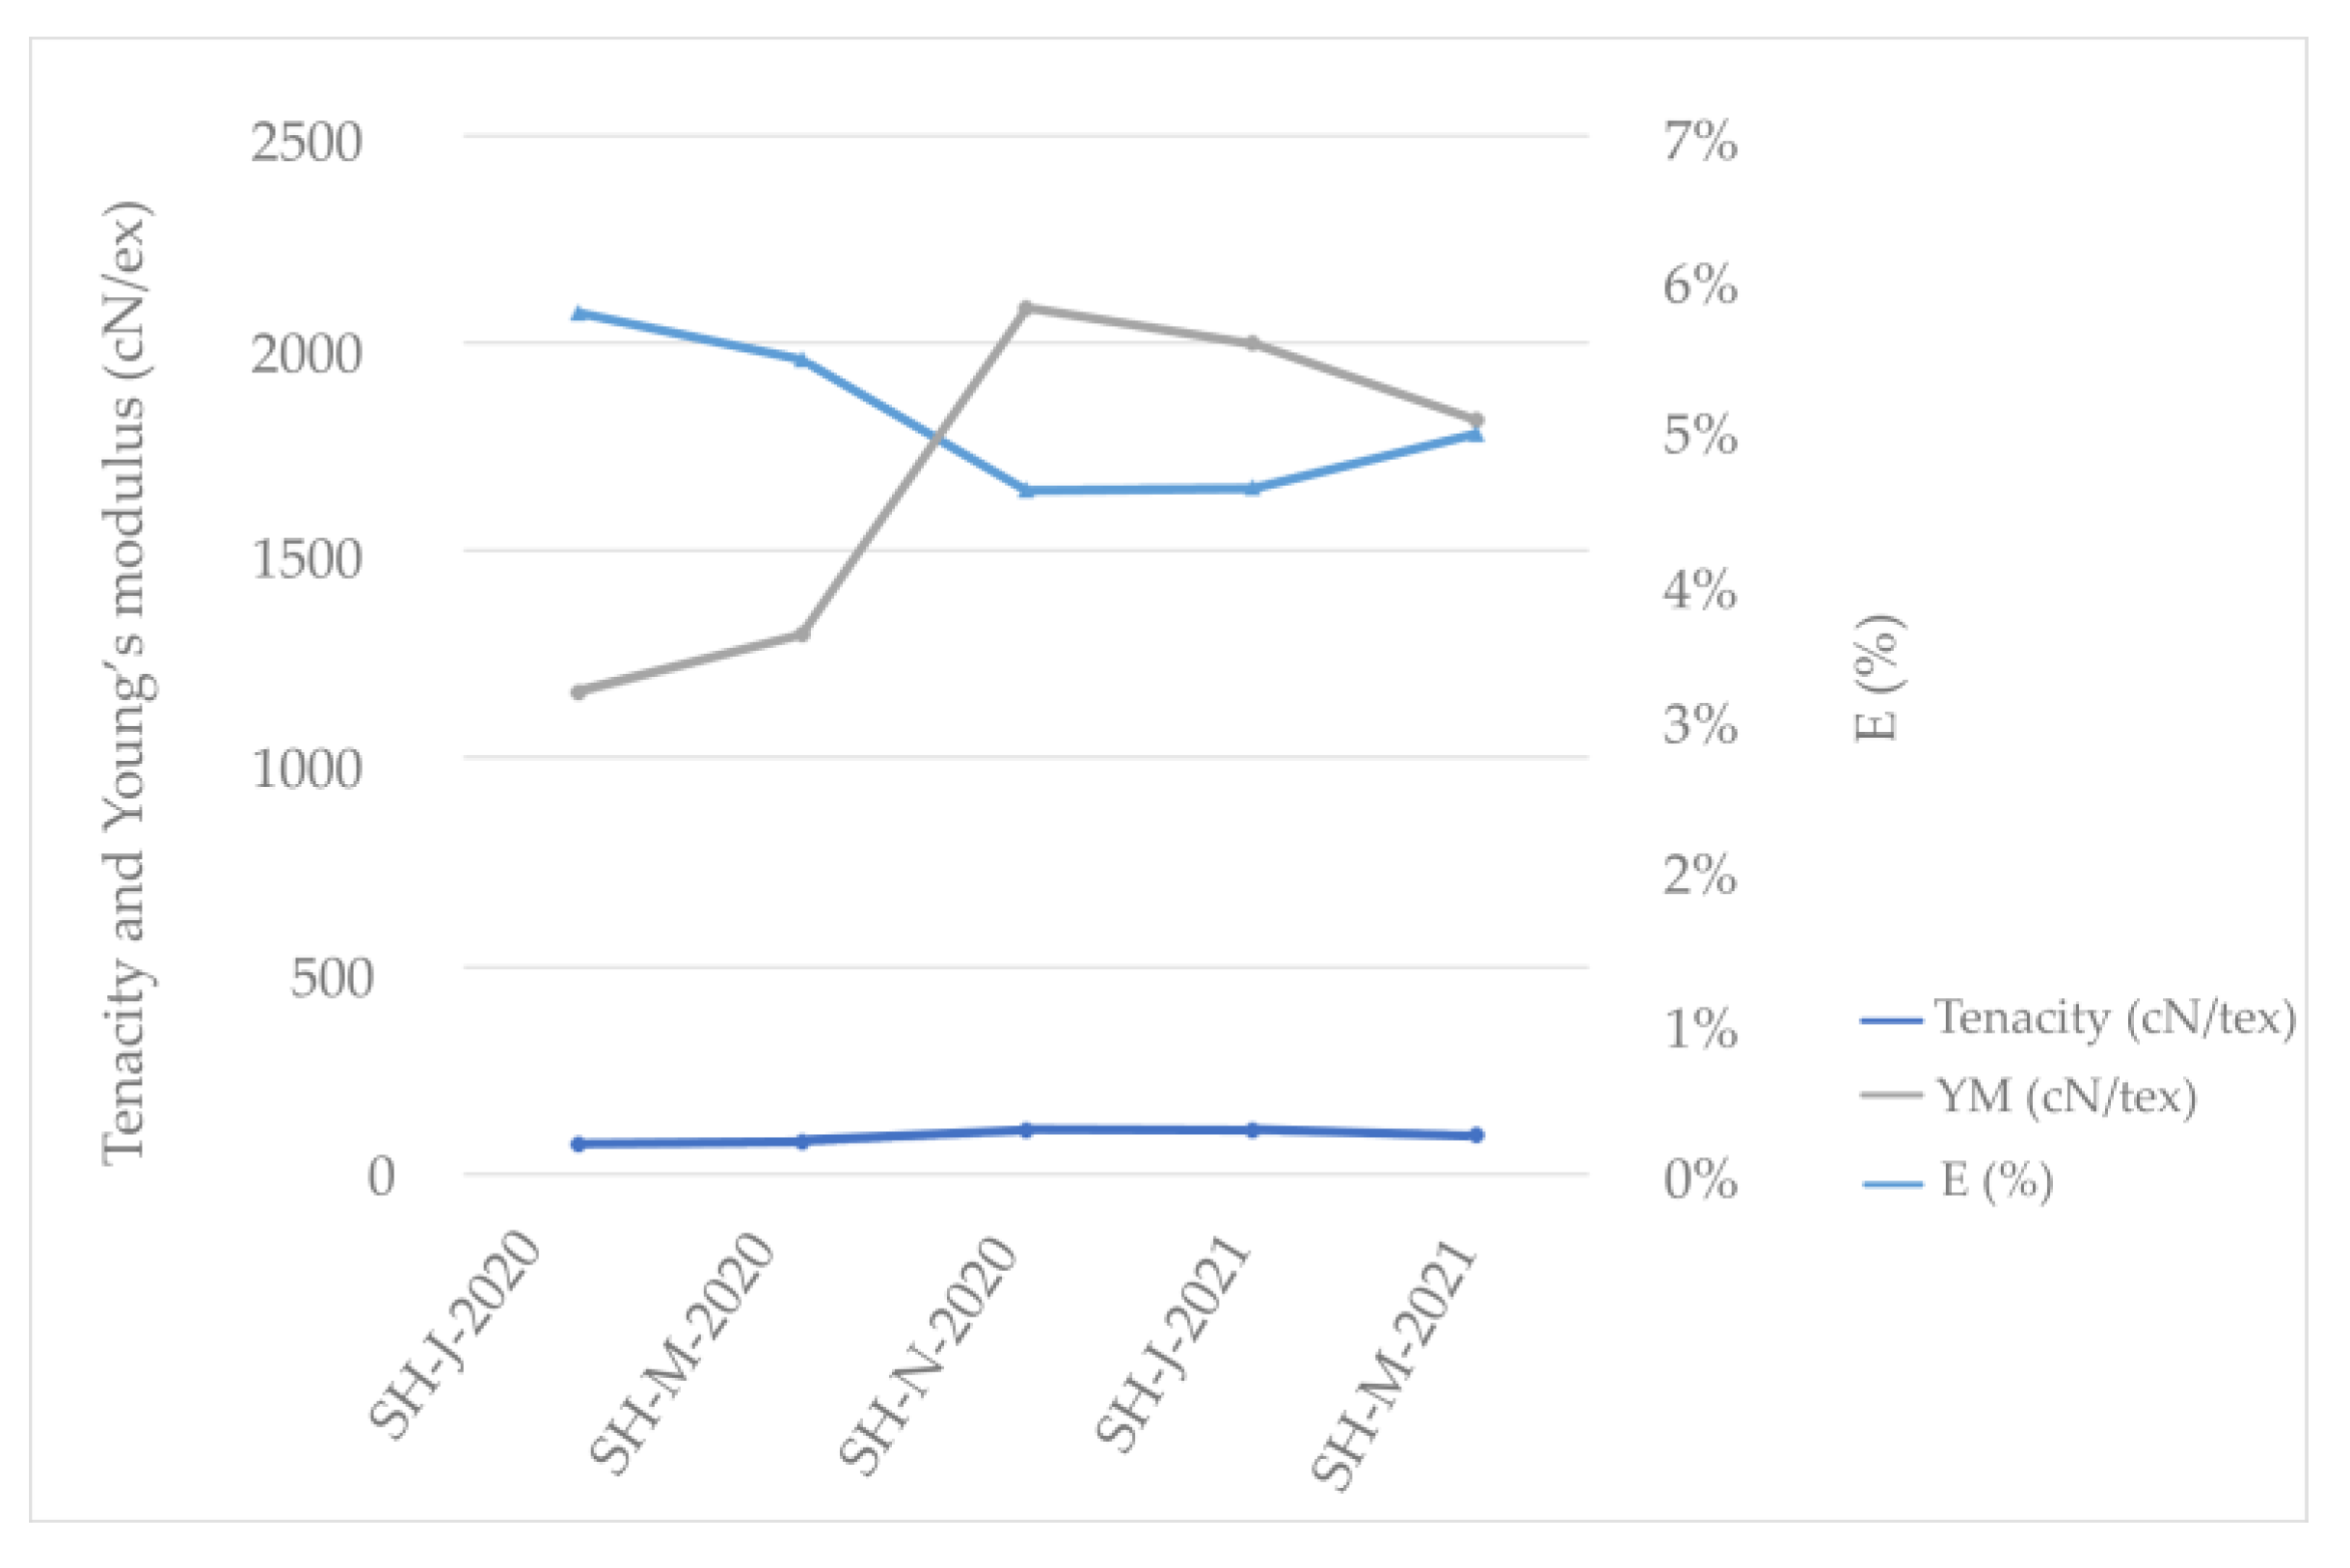
According to this research (refer to Table 3), the SH fibers isolated from stem harvested in November 2020 exhibited the highest fiber-breaking tenacity compared to those of the other fibers from the different harvests, with a fiber tenacity of 106.37 cN/tex. Consequently, the higher fiber tenacity of the above-mentioned fiber led to an increase in its Young’s modulus to 208.62 cN/dtex and a decrease in elongation to 4.61% compared to those of the other tested fibers; therefore, this fiber shows higher flexibility (Figure 5). A lower modulus means softer (more ductile) fiber, which can be observed in the SH fibers harvested in January and March of 2020. The same fibers show higher strain (percentage elongation) that indicates these fibers will promote more ductile failure, which is preferable over brittle failure [67].
Table 3.
Mechanical properties of Sida hermaphrodita fibers according to different harvest times.
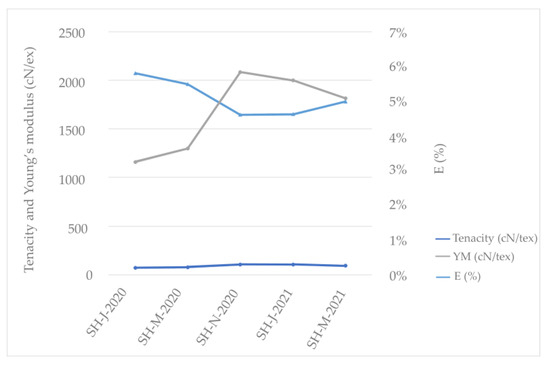
Figure 5.
Mechanical characteristics of Sida hermaphrodita fibers according to different harvest times.
Statistical analysis revealed a significant difference in the tensile strength values for the fibers from the different harvests (Fcritical < Fstatistical = 25.61 and p-value = 0.00000 < 0.05). Duncan’s post hoc test confirmed significant differences in the tensile strength values between most harvest groups (p < 0.05), except between SH-J-2020 and SH-M-2020 (p = 0.7899), SH-N-2020 and SH-J-2021 (p = 0.9086), SH-N-2020 and SH-M-2021 (p = 0.2614), and between SH-M-2021 and SH-J-2021 (p= 0.2789). This indicates that the tensile strength of fibers varies significantly depending on the harvest, with some exceptions. In this case, the winter harvest of 2020 significantly differs from the winter harvest of 2021.
Generally, the variations in the analysis results arise from the differences in the fiber chemical content, the fibers isolation methods, the plant-growing conditions, harvesting, the testing techniques, and the analyst’s expertise [68]. Consequently, as shown in Table 3, this result indicates high variability, which is expected for any natural fiber characterization. However, calculating the 95% confidence interval suggests that the standard error is sufficiently small, especially in sample SH-J-2020, which was tested by 1000 individual measurements, demonstrating a reasonably precise estimate.
The mechanical properties of representative bast fibers are presented and compared with the average mechanical properties of SH fiber in Table 4. The tensile strength of SH fiber (1000–1800 MPa) is comparable to those of Flax and Spanish Broom, which can be attributed to its higher cellulose content [40]. According to some studies [69], strength improves with a higher cellulose content. The Young’s modulus and elongation values are similar to those of Spanish Broom. Fineness depends on the secondary cell wall structure, mainly composed of cellulose and lignin. A higher lignin content increases the fineness values; therefore, the SH fibers isolated from the plants harvested in November 2020 are finer for 28.77% than the fibers from the January 2020 harvest, suggesting a possible lower lignin content in the secondary cell wall of such fibers. Agronomic measures, such as planting density, fertilization levels, climate conditions, and hormone application, also affect fineness [70].
Table 4.
Mechanical properties of some of most-used bast fibers.
We can conclude that the SH fibers isolated from the stems from any harvest are sufficiently tough and strong and compatible with other bast fibers, making them suitable for use in a wide range of industrial applications where a combination of lightness, strength, and toughness is required.
3.3. Moisture Regain and Moisture Content
The amount of moisture in a textile material is determined by the humidity of air and the type of fiber (structure, morphology, geometry, and finishing), while its sorption properties provide the fiber with functional properties and enable the conduction of physicochemical processes (dyeing and finishing) [61]. The hygroscopic properties of natural fibers are influenced by their chemical composition, such as the –OH groups in cellulose and the –OH and acetyl groups in hemicellulose [72,73]. Lignin has little effect on hygroscopic behavior, while according to research [74], pectin is water-soluble, causing fiber bundles to absorb more moisture than single fibers.
Table 5 presents the moisture content of the isolated SH fibers, showing consistent percentages across all the harvests. Notably, the lowest moisture content of 7.91% was observed in the fibers harvested in March 2021.
Table 5.
Moisture content of isolated Sida hermaphrodita fibers according to different harvest times.
Statistical analysis revealed a significant difference in the mean moisture content values for the fibers from the different harvests (Fcritical < Fstatistical = 38.1 and p-value = 0.000005 < 0.05). Duncan’s post hoc test confirmed significant differences in moisture content between most harvest groups (p < 0.05), except between SH-J-2020 and SH-M-2020 (p = 0.0665) and between SH-N-2020 and SH-J-2021 (p = 0.9191). This indicates that the moisture content of fibers varies significantly depending on the harvest, with some exceptions.
According to AL-Oqla et al. and Zuhudi et al. [75,76], a moisture content below 10% is considered favorable, as it reduces the energy requirements for drying and facilitates easier storage maintenance. According to Kovačević [65], fibers treated with AMW have a higher moisture content due to the successful removal of pectin, lignin, and waxes. By removing lignin, which hinders moisture penetration into the cellulose cell wall, moisture absorption is increased. Consequently, the treatment of the SH AMW fibers altered their chemical composition, crystallinity, and structure, resulting in better fiber absorbency.
Table 5 presents the standard moisture regain of the isolated SH fibers, showing consistent percentages across all the harvests, with the lowest value of 10.11% recorded in March 2021. These results align with the typical moisture regain properties of natural fibers. The moisture regain of SH fibers is comparable to those of barley and sisal fibers given in Table 6, which are classified as straw/bast and leaf fibers. This similarity suggests that SH fibers may have desirable properties for use as reinforcement in composite materials. Although moisture absorption can increase the breaking tenacity of stem (bast) fibers, it may not be beneficial for biocomposite applications. Due to the natural tendency of plant fibers to swell when absorbing moisture, micro-cracks or voids can form at the fiber–matrix interface, leading to poor mechanical properties and the reduced dimensional stability of the composite [77].
Table 6.
Comparison of moisture regain of most commonly used natural fibers with Virginia mallow (Sida hermaphrodita) fibers.
Natural bast fibers have recently been applied to natural geotextiles, where they can offer several benefits for agricultural use, such as preserving soil moisture, regulating temperature fluctuations, enhancing seed germination, improving filtration, reducing raindrop impact, and boosting soil fertility. They are also effective in post-wildfire soil protection, especially in areas like California, where fiber rolls are used to control erosion and sediment deposition on slopes [81].
3.4. Density of Fibers
One of the most appealing properties of bast fibers is their low density. Fiber density significantly influences the application of textile fibers. In composite materials, particularly in the automotive industry, decreasing the weight of car parts is essential, as it helps to reduce fuel consumption and costs [78].
As showed in Table 7, the density of the tested SH fibers ranged from 1.52 g/cm3 (SH-N-2020) to 1.58 g/cm3 (SH-J-2020), which is within the typical range for natural fibers (1.2–1.6 g/cm3) [82]. Statistical analysis revealed a significant difference in the mean density values for the SH fibers from the different harvests (Fcritical < Fstatistical = 33.8 and p-value = 0.00 < 0.05). Duncan’s post hoc test confirmed significant differences in the density values between most harvest groups (p < 0.05), except between SH-J-2020 and SH-M-2021 (p = 0.6526) and between SH-M-2020 and SH-J-2021 (p = 0.4072). This indicates that the density of fibers varies significantly depending on the harvest, with some exceptions.
Table 7.
Density of Sida hermaphrodita fibers according to different harvest times.
The obtained density values are influenced not only by the cellulose content, which has a density of about 1.5 g/cm3, but also by other components like lignin and hemicellulose. Pectin is believed to have a similar density to cellulose (1.5–1.6 g/cm3), so its presence does not significantly affect the overall density. The morphology of bast fibers, such as the size of the central lumen, also impacts density. For example, kapok fibers have a lower density (1.16 g/cm3) than jute fibers (1.45–1.5 g/cm3) due to a larger lumen. The other factors influencing density include residual moisture, the fiber extraction methods, geometry, porosity, and post-processing treatments [83].
Most of the data on the density of natural plant fibers in the literature are presented after the immersion method has been used for the experimental determination of density. Le Gall et al. [83] noted that density determination using a gas pycnometer shows 12% higher density values; therefore, the density values of the SH fibers from this study would fall into the lower range of stem fiber density.
3.5. Morphology of Fibers
Bast fibers are one of the main types of sclerenchyma cell whose main function is to provide mechanical stiffness and strength to plant (plant support tissue). Bast fibers are long, spindle-shaped, usually dead cells that have a thickened secondary cell wall consisting of lignin and high cellulose contents (60–80%). Fibers are often organized in groups or bundles and are called technical fibers [84].
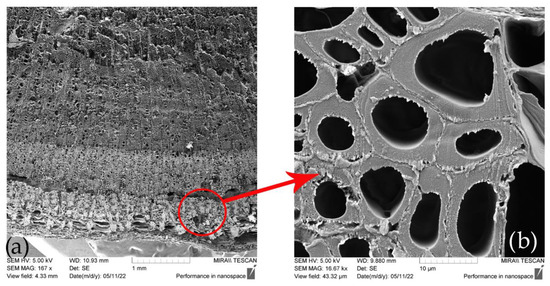
Figure 6.
Cross-section of (a) SH stem and (b) SH technical fiber [42].
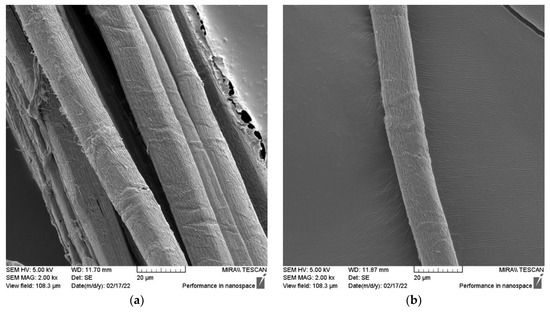
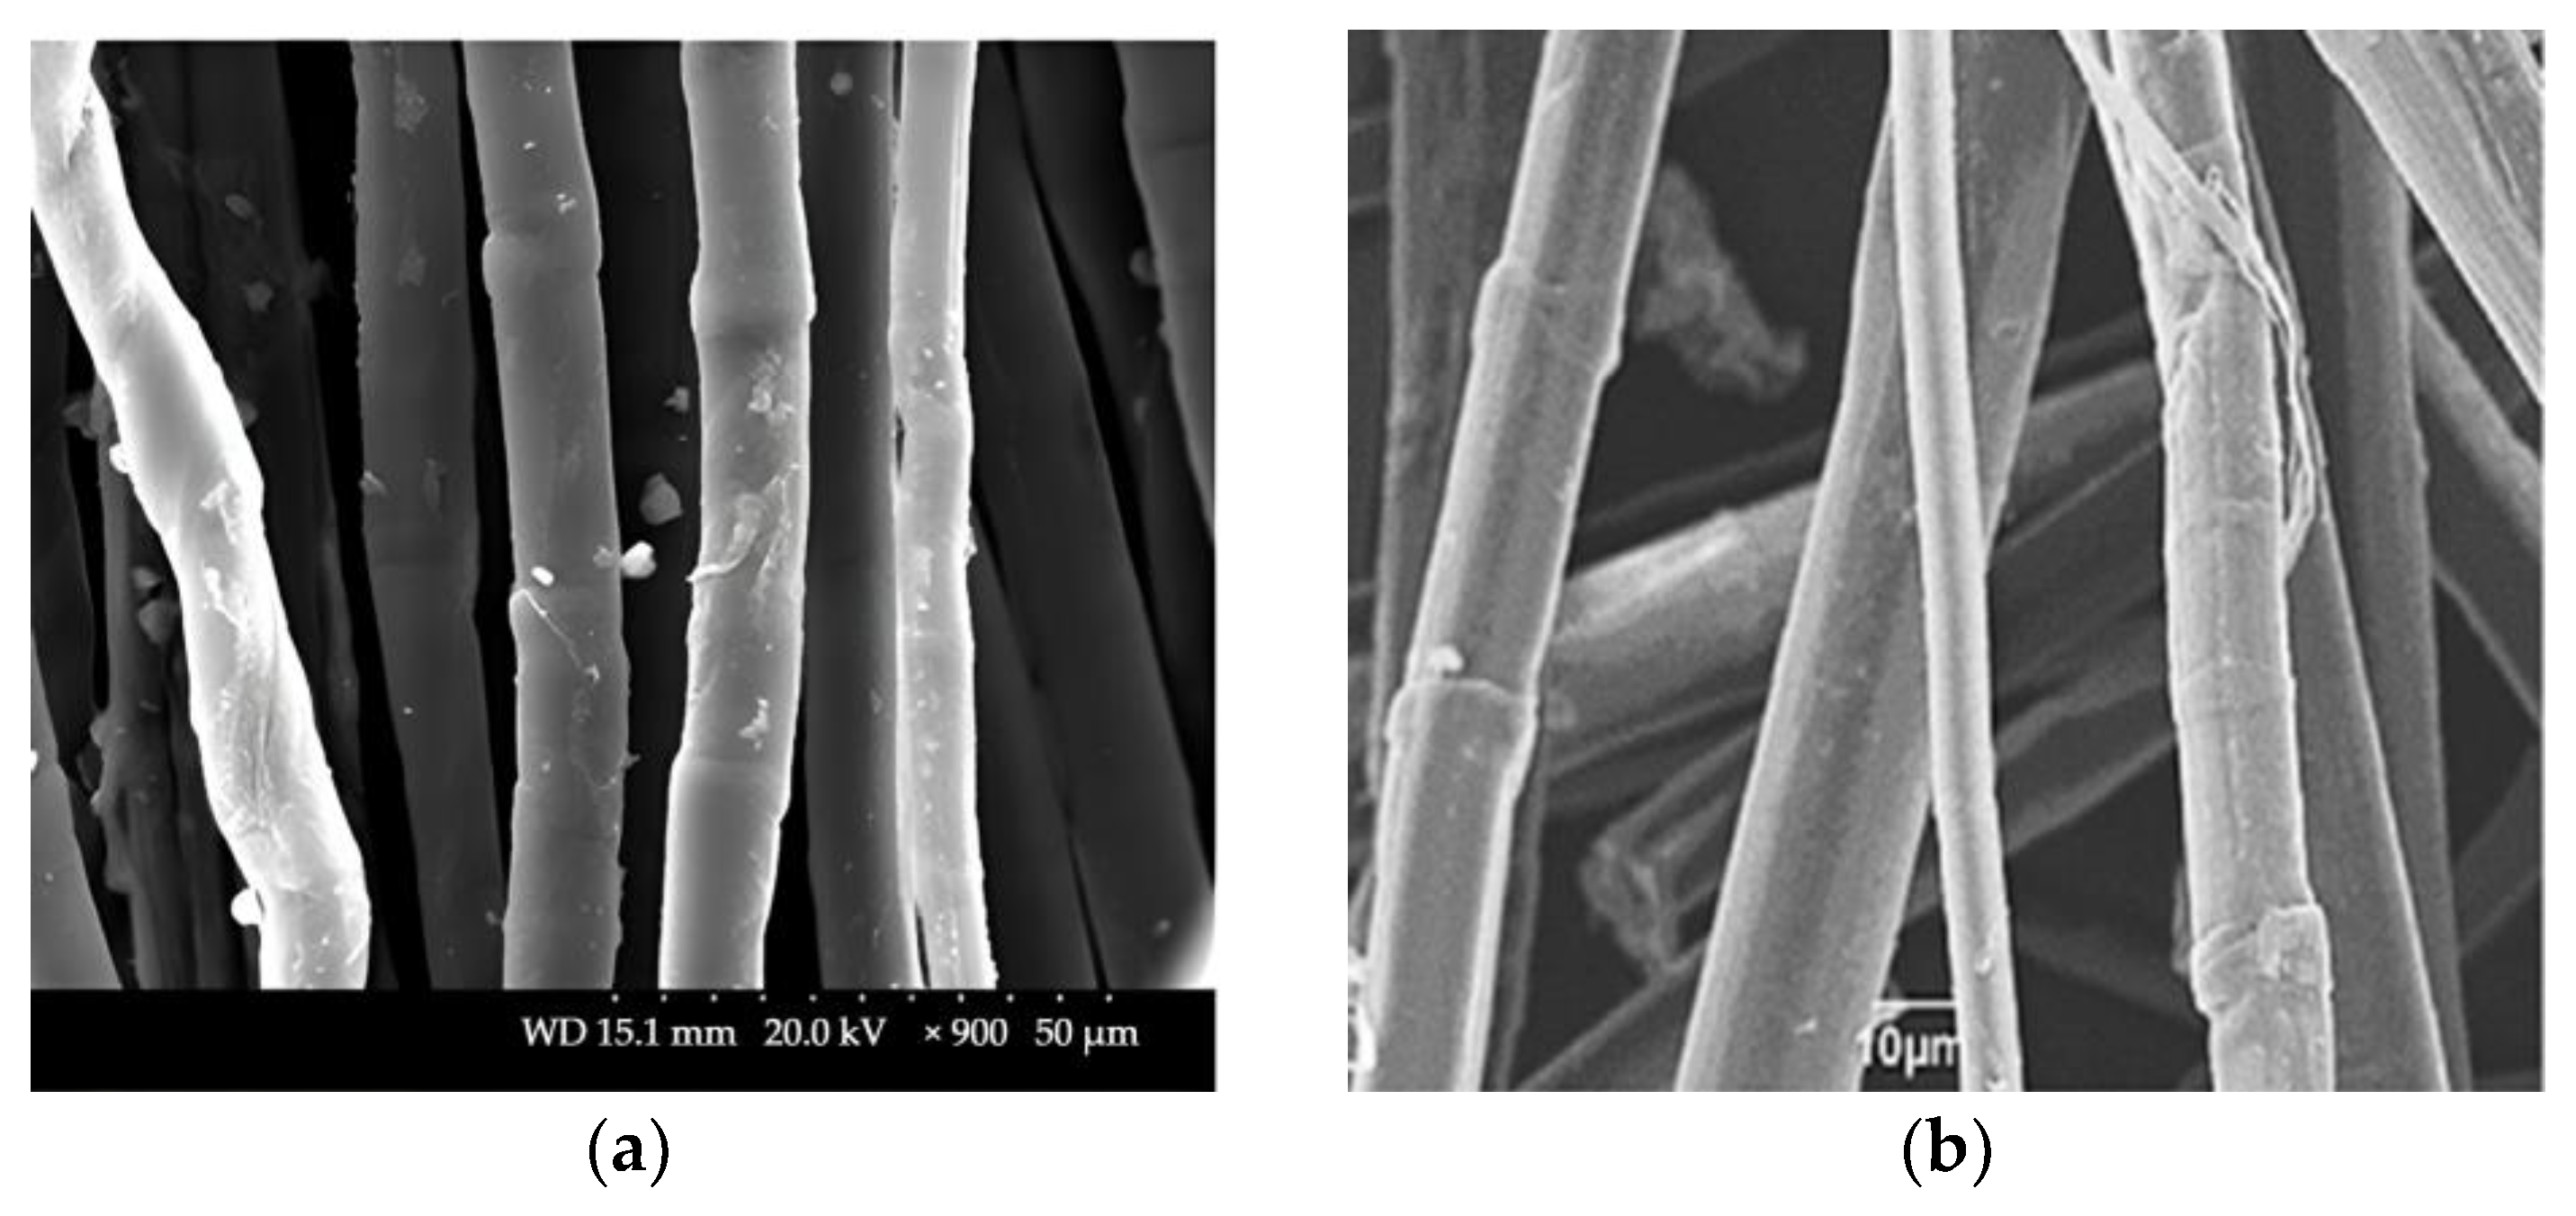
Figure 7.
SEM micrographs of (a) SH technical fiber (longitudinal view) and (b) SH elementary fiber (longitudinal view).
The sclerenchyma tissue close to the outer part of the stem is presented in Figure 6a. A 16.000-times-enlarged view of a sclerenchyma fiber cell cross-section is presented in Figure 6b. Variability in lumen size, which is quite large if compared to that of flax, hemp, jute, and Spanish broom fibers [85], suggests the possible lower density of these fibers. Its usage for technical textiles purposes is therefore promising since it will cause new manufactured materials to be more lightweight [34]. Longitudinal views of SH technical and elementary fibers are presented in Figure 7. The surface morphology of the fiber closely resembles that of other bast fibers, such as hemp and flax, as shown in Figure 8.
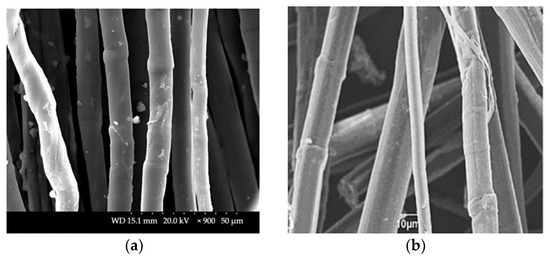
Figure 8.
SEM micrographs of alkaline-treated (a) hemp elementary fiber (longitudinal view) and (b) flax elementary fiber (longitudinal view) [86,87].
Each elementary fiber consists of a network of ultrafine cellulose fibrils embedded in a hemicellulose–lignin matrix [86,87,88]. Pronounced wrinkles and grooves were also observed in the longitudinal view of the SH fiber, which are attributed to the use of alkali during the fiber isolation process [89]. Kink bands on the fiber surface are associated with lower tensile strength in the fibers since they represent weak points where crack propagation starts during fiber tensile tests. The possible way of reducing kink bands, and consequently increasing fiber strength is the modification of the fiber isolation method [90], although the environmental conditions and abiotic stress during growth are also factors that influence the shape and morphology of the kink band region [91].
3.6. FTIR Analysis
The chemical surface properties as well as the structural properties of the SH fibers obtained from the different harvest times were investigated by FTIR analysis and presented in Figure 9 and Table 8.
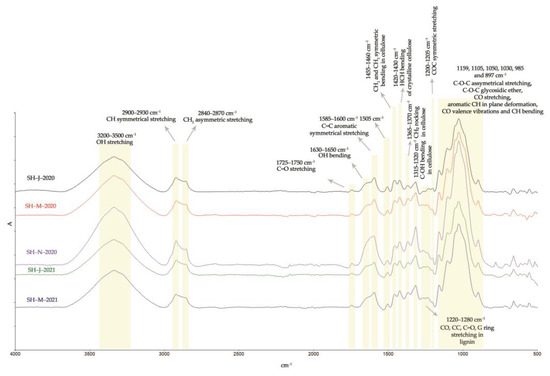
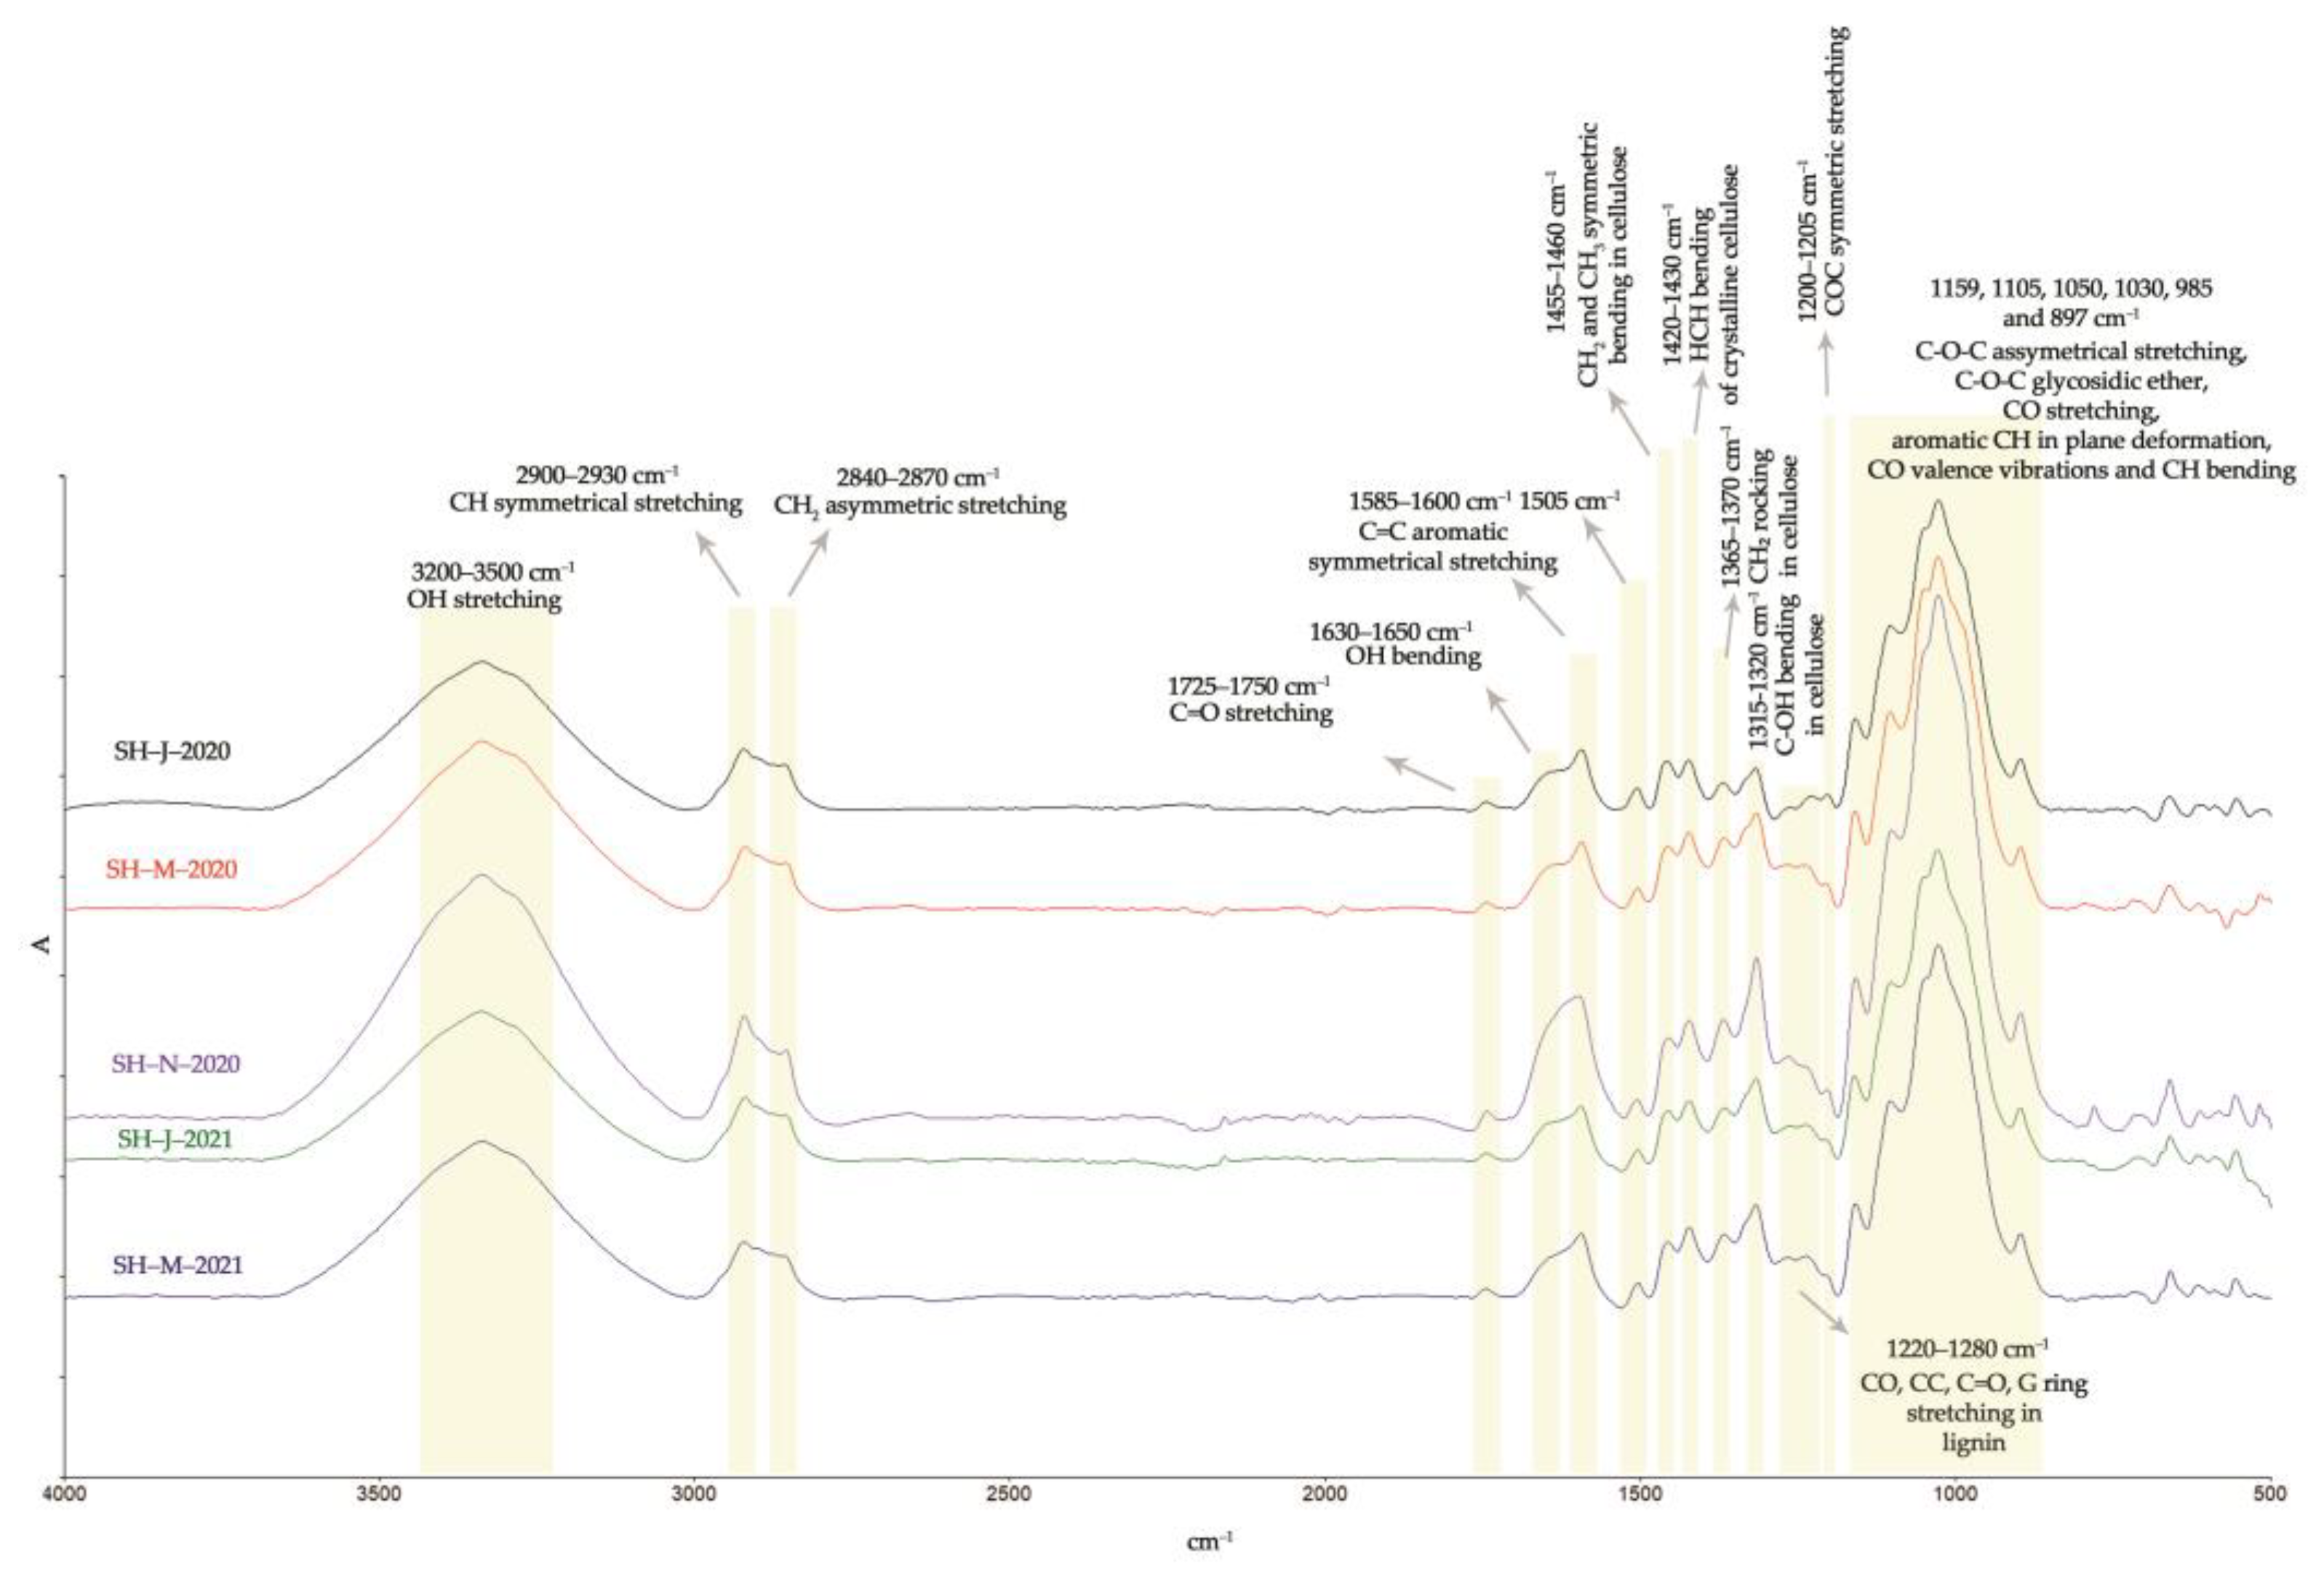
Figure 9.
FTIR analysis of SH fibers.
Table 8.
Main FTIR crystallinity indices for SH fibers.
The ATR-FTIR spectra of the investigated fibers isolated from the different harvests are presented in Figure 9. The wide band visible in the range of 3200–3500 cm−1 was attributed to the -OH group, while the bands within the ranges of 2900–2930 cm−1 and 2840–2870 cm−1 were attributed to the -CH and -CH2 groups of cellulose, hemicellulose, pectin, fats, and waxes [47]. The SH fibers isolated from the plants harvested in January 2020 and January 2021 exhibited the highest intensity of band at 1745 cm−1. This peak was associated with the free -COOH group of polygalacturonic acid, which is the main constituent of pectin, and therefore the lower intensity of this peak observed within the SH fibers isolated from the autumn and spring harvests (November 2020 and March 2020) indicates a lower quantity of pectin, and thus the better quality of fiber.
The absorption band within the range of 1630–1650 cm−1 corresponds to the water absorbed and derived from hydrogen bonding in the amorphous region of cellulose macromolecules [92]. The fibers from November 2020 showed a lower intensity of this peak, which means less hemicellulose content, thus improving the internal organization of cellulose chains in the more crystalline regions, and consequently allowing for increased fiber strength [65]. The SH fibers from all the harvests showed characteristic bands for lignin at 1585–1600 cm−1 and 1505 cm−1. The lower intensity of those peaks is noticeable in the case of the SH fibers isolated from the stems harvested in November 2020, indicating a lower lignin content [93,94]. The same observations were noticed for the lignin bands within the range of 1220–1280 cm−1. The absorption band at around 1420–1430 cm−1 corresponds to the cellulose crystalline structure, while the band at 897 cm−1 is associated with the amorphous structure of cellulose [65,79,95]. The bands at 1367 cm−1, 1317 cm−1, and 1203 cm−1 are associated with the stretching and bending of the -CH2, -OH, and C-O-C bonds in cellulose and hemicellulose [79,95]. In comparison to the FTIR spectra found in the literature, the fibers isolated from SH stem correspond well with the other cellulose fibers (especially bast fibers), showing the same peaks at 1159 cm−1, 1105 cm−1, 1050 cm−1, 1030 cm−1, and 985 cm−1. These peaks are assigned to C-O-C glycosidic ether, the -CO stretching vibrations of acetyl xylan, and the -CO stretching vibrations of polysaccharide components, mainly cellulose [79,80].
The rigidity of cellulose fibers increases and their flexibility decreases with an increase in the ratio of crystalline in the amorphous regions. While an increase in crystallinity causes greater strength, a decrease in crystallinity causes increased elongation, higher water intake since the amorphous regions can absorb more water [96], and more sites available for chemical reactions. A parameter called the crystallinity index (CI) has been used to present the relative amount of crystalline or amorphous regions in cellulose. The CI has been determined by XRD, solid-state NMR, IR spectroscopy, Raman spectroscopy, etc. FTIR spectroscopy turned out to be the simplest method and in good correlation with the more detailed XRD method [97]. The crystalline characteristics of the SH fiber structure were investigated in each FTIR spectrum by comparing the peak of the functional group in the crystalline region with a peak of the other functional group in the amorphous region.
Table 8 presents the values of different crystallinity ratios (TCI, LOI, and HBI) for the SH fibers. Usually, elevated TCI and LOI values indicate the highest degree of crystallinity and a more ordered cellulose structure, while lower TCI and LOI values designate the amorphous structure of cellulose [45,98].
SH-J-2020 and SH-M-2021 showed the lowest TCI indexes of 0.83% and 0.95%, respectively, pointing to the higher content of amorphous domains in its cellulose chains. SH-M-2020 and SH-N-2020 have higher degree of crystallinity (TCI) and a more ordered structure (LOI) since this method is correlated to more laterally ordered macromolecular chains [99,100]. Although the hydrogen bond intensity (HBI) of cellulose is closely related to the degree of intermolecular crystallinity, it could relate to the lignin content as well. Both the hydrogen bonds of cellulosic and non-cellulosic components could lead to higher values of the HBI. Therefore, it is assumed that a higher value of HBI in SH-J-2020 fibers is related to lignin, which may form intramolecular hydrogen bonds between the phenolic groups [90].
4. Conclusions
With the aim of encouraging sustainability and the wider use of renewable resources, this research has pointed to the possibility of closing the loop in the process of utilizing SH plant biomass. Sida hermaphrodita (L.) Rusby fibers were chosen as a sustainable and versatile material suitable for various industrial applications, particularly technical textiles and biocomposites. The findings confirm that fiber yield remains relatively stable across the different harvest times and years, indicating consistent productivity. The best mechanical properties, including a high breaking tenacity and Young’s modulus, were observed in the fibers harvested in November 2020. The density of the Sida hermaphrodita fibers (1.52–1.58 g/cm3) aligns with those of other natural bast fibers, making them a viable alternative in lightweight applications. The favorable moisture content and regain values ensure the ease of processing and storage, while morphological and surface chemistry analyses confirm the structural characteristics necessary for reinforcement in biocomposites.
A significant outcome of this research is the cascade usage of solid residues remaining after fiber isolation, which holds promise for biofuel production, supporting the zero-waste principle. Additionally, Sida hermaphrodita thrives in poor soils and has an exploitation period of up to 20 years, making it a valuable crop for marginal lands and a promising solution in the context of climate change and environmental sustainability. These results position Sida hermaphrodita as a renewable resource that aligns with the sustainability efforts of fiber-based industries. Further research should also focus on optimizing fiber-processing techniques to enhance its applicability in high-performance bio-based materials.
Author Contributions
Conceptualization, G.V. and Z.K.; methodology, Z.K.; software, G.V. and Z.K.; validation, Z.K. and S.B.; formal analysis, G.V. and Z.K.; investigation, G.V. and Z.K.; resources, S.B. and Z.K.; data curation, Z.K.; writing—original draft preparation, G.V.; writing—review and editing, Z.K. and S.B.; visualization, G.V. and Z.K.; supervision, Z.K. and S.B.; project administration, S.B.; funding acquisition, S.B. All authors have read and agreed to the published version of the manuscript.
Funding
This research was performed using equipment purchased by the projects K.K.01.1.1.02.0024 Modernization of Textile Science Research Centre Infrastructure (MI-TSRC), and KK.01.1.1.04.0091 Design of Advanced Biocomposites from Sustainable Energy Sources (BIOCOMPOSITES) both funded by European Regional Development Fund, Operational Programme Competitiveness and Cohesion.
Data Availability Statement
The raw data supporting the conclusions of this article will be made available by the authors on request.
Acknowledgments
Fiber breaking tenacity and titer measurements were conducted using TTF’s Vibroskop and Vibrodyn devices. The authors would like to acknowledge the contribution of Ksenija Višić, and Sofia Šoufek to the experimental part (isolation of fibers and determination of their physical and mechanical properties).
Conflicts of Interest
The authors declare no conflicts of interest.
References
- El-Rayes, N.; Chang, A.; Shi, J. Plastic Management and Sustainability: A Data-Driven Study. Sustainability 2023, 15, 7181. [Google Scholar] [CrossRef]
- Song, Y.K.; Hong, S.H.; Jang, M.; Han, G.M.; Jung, S.W.; Shim, W.J. Corrections to “Combined Effects of UV Exposure Duration and Mechanical Abrasion on Microplastic Fragmentation by Polymer Type”. Environ. Sci. Tech. 2018, 52, 3831–3832. [Google Scholar] [CrossRef] [PubMed]
- da Costa, J.P. Micro- and Nanoplastics in the Environment: Research and Policymaking. Curr. Opin. Environ. Sci. Health 2018, 1, 12–16. [Google Scholar] [CrossRef]
- Gigault, J.; ter Halle, A.; Baudrimont, M.; Pascal, P.-Y.; Gauffre, F.; Phi, T.-L.; El Hadri, H.; Grassl, B.; Reynaud, S. Current Opinion: What Is a Nanoplastic? Environ. Pollut. 2018, 235, 1030–1034. [Google Scholar] [CrossRef] [PubMed]
- Cohen, N.; Radian, A. Microplastic Textile Fibers Accumulate in Sand and Are Potential Sources of Micro(Nano)Plastic Pollution. Environ. Sci. Tech. 2022, 56, 17635–17642. [Google Scholar] [CrossRef] [PubMed]
- Chan, C.K.-M.; Lo, C.K.-Y.; Kan, C.-W. A Systematic Literature Review for Addressing Microplastic Fibre Pollution: Urgency and Opportunities. Water 2024, 16, 1988. [Google Scholar] [CrossRef]
- Yee, M.S.-L.; Hii, L.-W.; Looi, C.K.; Lim, W.-M.; Wong, S.-F.; Kok, Y.-Y.; Tan, B.-K.; Wong, C.-Y.; Leong, C.-O. Impact of Microplastics and Nanoplastics on Human Health. Nanomaterials 2021, 11, 496. [Google Scholar] [CrossRef]
- Kozłowski, R.M.; Mackiewicz-Talarczyk, M.; Barriga-Bedoya, J. New Emerging Natural Fibres and Relevant Sources of Information. In Handbook of Natural Fibres; Kozłowski, R.M., Mackiewicz-Talarczyk, M., Eds.; Woodhead Publishing: Duxford, UK, 2020; pp. 747–787. [Google Scholar] [CrossRef]
- Krička, T.; Grubor, M.; Jurišić, V.; Leto, J.; Voća, N.; Bilandžija, N.; Matin, A. Nova Energetska Kultura Sida hermaphrodita U Republici Hrvatskoj. Glas. Zaštite Bilja 2017, 40, 44–49. [Google Scholar] [CrossRef]
- Borkowska, H.; Styk, B. Virginia Fanpetals (Sida hermaphrodita Rusby)-Cultivation and Use; WAR: Lublin, Poland, 2006; p. 69. [Google Scholar]
- Purwin, C.; Starczewski, M.; Borsuk, M.; Nogalski, Z.; Opyd, P.M.; Mazur-Kuśnirek, M.; Białobrzewski, I. The Quality, Intake, and Digestibility of Virginia Fanpetals (Sida hermaphrodita L. Rusby) Silage Produced under Different Technologies and Its Effect on the Performance of Young Cattle. Animals 2021, 11, 2270. [Google Scholar] [CrossRef]
- Gudelj-Velaga, A.; Bilandžija, N.; Leto, J.; Bischof, S.; Voća, N.; Kovačević, Z. Energy properties of the Virgina mallow (Sida hermaphrodita) residue from enzymatic fiber isolation. In Proceedings of the 59th Croatian & 19th International Symposium on Agriculture, Dubrovnik, Croatia, 11–16 February 2024; pp. 521–524. [Google Scholar]
- Mallow, V. Recovery Strategy for the Virginia Mallow (Sida hermaphrodita) in Canada. Species at Risk Act, Recovery Strategy Series, Adopted under Section 44 of SARA. Available online: https://www.registrelep-sararegistry.gc.ca/virtual_sara/files/plans/rs_virginia_mallow_e_final.pdf (accessed on 1 March 2025).
- Wróbel, M.; Mudryk, K.; Jewiarz, M.; Głowacki, S.; Tulej, W. Characterization of Selected Plant Species in Terms of Energetic Use. In Renewable Energy Sources: Engineering, Technology, Innovation; Springer International Publishing: New York, NY, USA, 2018; pp. 671–681. [Google Scholar] [CrossRef]
- Borkowska, H.; Molas, R. Two Extremely Different Crops, Salix and Sida, as Sources of Renewable Bioenergy. Biomass Bioenergy 2011, 36, 234–240. [Google Scholar] [CrossRef]
- Nahm, M.; Morhart, C. Virginia Mallow (Sida hermaphrodita (L.) Rusby) as Perennial Multipurpose Crop: Biomass Yields, Energetic Valorization, Utilization Potentials, and Management Perspectives. GCB Bioenergy 2018, 10, 393–404. [Google Scholar] [CrossRef]
- Borkowska, H.; Molas, R. Yield Comparison of Four Lignocellulosic Perennial Energy Crop Species. Biomass Bioenergy 2013, 51, 145–153. [Google Scholar] [CrossRef]
- Matin, A.; Bilandžija, N.; Voća, N.; Leto, J.; Bischof, S. Energy Production from Sida hermaphrodita Chippings as Solid Biofuel. In Proceedings of the 55th Croatian and 15th International Symposium on Agriculture, Vodice, Croatia, 16–21 February 2020; pp. 573–577. [Google Scholar]
- Bilandžija, N.; Krička, T.; Matin, A.; Leto, J.; Grubor, M. Effect of Harvest Season on the Fuel Properties of Sida hermaphrodita (L.) Rusby Biomass as Solid Biofuel. Energies 2018, 11, 3398. [Google Scholar] [CrossRef]
- Jurišić, V.; Bilandžija, N.; Matin, A.; Voća, N.; Leto, J.; Grubor, M.; Krička, T. Valorization of Energy Properties of Sida hermaphrodita. Available online: https://www.sumari.hr/biomasa/dvanaestidanibiomase/09.pdf (accessed on 21 February 2025).
- Jablonowski, N.D.; Kollmann, T.; Nabel, M.; Damm, T.; Klose, H.; Müller, M.; Bläsing, M.; Seebold, S.; Krafft, S.; Kuperjans, I.; et al. Valorization of Sida (Sida hermaphrodita) Biomass for Multiple Energy Purposes. GCB Bioenergy 2016, 9, 202–214. [Google Scholar] [CrossRef]
- von Gehren, P.; Gansberger, M.; Pichler, W.; Weigl, M.; Feldmeier, S.; Wopienka, E.; Bochmann, G. A Practical Field Trial to Assess the Potential of Sida hermaphrodita as a Versatile, Perennial Bioenergy Crop for Central Europe. Biomass Bioenergy 2019, 122, 99–108. [Google Scholar] [CrossRef]
- Jablonowski, N.D.; Kollmann, T.; Meiller, M.; Dohrn, M.; Müller, M.; Nabel, M.; Zapp, P.; Schonhoff, A.; Schrey, S.D. Full Assessment of Sida (Sida hermaphrodita) Biomass as a Solid Fuel. GCB Bioenergy 2020, 12, 618–635. [Google Scholar] [CrossRef]
- Šiaudinis, G.; Jasinskas, A.; Šarauskis, E.; Steponavičius, D.; Karčauskienė, D.; Liaudanskienė, I. The Assessment of Virginia Mallow (Sida hermaphrodita Rusby) and Cup Plant (Silphium perfoliatum L.) Productivity, Physico–Mechanical Properties and Energy Expenses. Energy 2015, 93, 606–612. [Google Scholar] [CrossRef]
- Czarnecki, R.; Dukarska, D. Estimating the possibilities of applying Sida hermaphrodita Rusby to the production of low-density particleboards, Annals of Warsaw University of Life Sciences—SGGW. For. Wood. Technol. 2010, 71, 83–86. [Google Scholar]
- Höller, M.; Lunze, A.; Wever, C.; Deutschle, A.L.; Stücker, A.; Frase, N.; Pestsova, E.; Spiess, A.C.; Westhoff, P.; Pude, R. Meadow Hay, Sida hermaphrodita (L.) Rusby and Silphium perfoliatum L. As Potential Non-Wood Raw Materials for the Pulp and Paper Industry. Ind. Crops Prod. 2021, 167, 113548. [Google Scholar] [CrossRef]
- Kmiotek, M.; Dybka-Stepien, K.; Molas, R.; Kiełtyka-Dadasiewicz, A.; Gapinska, M.; Glinska, S.; Sicinski, M.; Imiela, M. Sida hermaphrodita Rusby as a Papermaking Raw Material—Chemical and Morphological Characteristics. BioResources 2024, 19, 4381–4395. [Google Scholar] [CrossRef]
- Lewtak, K.; Fiołka, M.J.; Czaplewska, P.; Macur, K.; Kaczyński, Z.; Buchwald, T.; Szczuka, E.; Rzymowska, J. Sida hermaphrodita Seeds as the Source of Anti—Candida Albicans Activity. Sci. Rep. 2019, 9, 12233. [Google Scholar] [CrossRef]
- Lewtak, K.; Czaplewska, P.; Wydrych, J.; Keller, R.; Nowicka, A.; Skrzypiec, K.; Fiołka, M.J. Antimycobacterial Activity of Sida hermaphrodita (L.) Rusby (Malvaceae) Seed Extract. Cells 2023, 12, 397. [Google Scholar] [CrossRef]
- Antonkiewicz, J.; Jasiewicz, C.; Ryant, P. The use of heavy metal accumulating plants for detoxication of chemically polluted soils. Acta. Univ. Agric. Silvic. Mendel. Brun. 2004, 52, 113–120. [Google Scholar] [CrossRef]
- Antonkiewicz, J.; Kołodziej, B.; Bielińska, E.J. Phytoextraction of Heavy Metals from Municipal Sewage Sludge ByRosa Multiflora and Sida hermaphrodita. Int. J. Phytoremediat. 2016, 19, 309–318. [Google Scholar] [CrossRef] [PubMed]
- Madej, J.; Hilber, I.; Bucheli, T.D.; Oleszczuk, P. Biochars with Low Polycyclic Aromatic Hydrocarbon Concentrations Achievable by Pyrolysis under High Carrier Gas Flows Irrespective of Oxygen Content or Feedstock. J. Anal. Appl. Pyrolysis 2016, 122, 365–369. [Google Scholar] [CrossRef]
- Szyszlak-Bargłowicz, J.; Słowik, T.; Zajazc, G.; Piekarski, W. Inline plantation of Virginia mallow (Sida hermaphrodita R.) as biological acoustic screen. Annu. Set Environ. Prot. 2013, 15, 524–537. [Google Scholar]
- Kovačević, Z.; Pilipović, A.; Meheš, M.; Bischof, S. Zero Waste Concept in Production of PLA Biocomposites Reinforced with Fibers Derived from Wild Plant (Spartium junceum L.) and Energy Crop (Sida hermaphrodita (L.) Rusby). Polymers 2025, 17, 235. [Google Scholar] [CrossRef]
- Khadka, R. The Use of Fibrous Plants in the Production of Building Materials. In Proceedings of the 10th International Scientific Conference Rural Development 2021: Challenges for Sustainable Bioeconomy and Climate Change, Kaunas, Lithuania, 21–23 September 2021; pp. 101–105. [Google Scholar] [CrossRef]
- Kurucz, E.; Fári, M.G.; Antal, G.; Gabnai, Z.; Popp, J.; Bai, A. Opportunities for the Production and Economics of Virginia Fanpetals (Sida hermaphrodita). Renew. Sust. Energ. Rev. 2018, 90, 824–834. [Google Scholar] [CrossRef]
- OEC World. Jute and Other Bast Fibres (Not Spun, Nes Tow, Waste), OEC World, 2025. Available online: https://oec.world/en/profile/hs/jute-and-other-bast-fibres-not-spun-nes-tow-waste?latestTrendsScaleSelector=Trade+Value+Growth (accessed on 15 March 2025).
- Alliance for European Flax-Linen & Hemp. Flax-Linen and Hemp Economic Observatory. 2025. Available online: https://allianceflaxlinenhemp.eu/en/flax-linen-hemp-economic-observatory (accessed on 15 March 2025).
- Alliance for European Flax-Linen & Hemp. Flax-Linen and Hemp Economic Observatory—Figures 2023. 2023. Available online: https://allianceflaxlinenhemp.eu/en/flax-linen-hemp-economic-observatory/market-figures-flax-hemp-2023 (accessed on 15 March 2025).
- Bakšinskaitė, A.; Tilvikiene, V.; Doyeni, M.O. Biomass Yield and Biofiber Properties of Select Industrial Fiber Crops in Lithuania. Agron. J. 2022, 114, 3129–3140. [Google Scholar] [CrossRef]
- Ververis, C.; Georghiou, K.; Christodoulakis, N.; Santas, P.; Santas, R. Fiber Dimensions, Lignin and Cellulose Content of Various Plant Materials and Their Suitability for Paper Production. Ind. Crops Prod. 2004, 19, 245–254. [Google Scholar] [CrossRef]
- Bischof, S.; Kovačević, Z. Kemijska predobrada za izolaciju tekstilnih vlakana iz energetskih kultura. In Održivi Razvoj Biokompozita i Biogoriva iz Obnovljivih Izvora Energije; Bischof, S., Ed.; Tekstilno–tehnološki fakultet: Zagreb, Croatia, 2023; pp. 83–112. ISBN 978-953-8418-09-9. (In Croatian) [Google Scholar]
- ASTM D2495-07; Standard Test Method for Moisture in Cotton by Oven-Drying. ASTM: West Conshohocken, PA, USA, 2019.
- ASTM D8171-18; Standard Test Methods for Density Determination of Flax Fiber. ASTM: West Conshohocken, PA, USA, 2018.
- Poletto, M.; Ornaghi Junior, H.L.; Zattera, A.J. Native Cellulose: Structure, Characterization and Thermal Properties. Materials 2014, 7, 6105–6119. [Google Scholar] [CrossRef]
- Singh, A.; Ranawat, B.; Meena, R. Extraction and characterization of cellulose from halophytes: Next generation source of cellulose fibre. SN Appl. Sci. 2019, 1, 1311. [Google Scholar] [CrossRef]
- Chambre, D.R.; Dochia, M. FT-IR characterization of cellulose crystallinity from raw bast fibers. Scien. Tech. Bull-Chem. Food. Sci. Eng. 2021, 18, 10–17. [Google Scholar]
- Bennett, S.J.; Snell, R.; Wright, D. Effect of variety, seed rate and time of cutting on fibre yield of dew-retted hemp. Ind. Crops Prod. 2006, 24, 79–86. [Google Scholar] [CrossRef]
- Scheliga, M.; Brand, U.; Türk, O.; Gruber, S.; Medina, L.; Petersen, J. Yield and Quality of Bast Fibre from Abutilon Theophrasti (Medic.) in Southwest Germany Depending on the Site and Fibre Extraction Method. Ind. Crops Prod. 2018, 121, 320–327. [Google Scholar] [CrossRef]
- Rahman, A.; Rahman, M.M.; Ferdush, J.; Kaysar, M.A.; Uddin, M.M. Effect of Harvesting Time on the Fiber Yield and Characterization of Jute Fiber. J. Nat. Fibers 2022, 19, 12434–12445. [Google Scholar] [CrossRef]
- Haidir, F.; Fahma, F.; Firmanda, A.; Purnawati, R.; Suryanegara, L.; MacMillan, C. Review: Natural Fibres for Textile Application. IOP Conf. Ser. Earth Environ. Sci. 2024, 1358, 012006. [Google Scholar] [CrossRef]
- Charlet, K.; Baley, C.; Morvan, C.; Jernot, J.P.; Gomina, M.; Bréard, J. Characteristics of Hermès Flax Fibres as a Function of Their Location in the Stem and Properties of the Derived Unidirectional Composites. Compos.-A Appl. Sci. Manuf. 2007, 38, 1912–1921. [Google Scholar] [CrossRef]
- Charlet, K.; Jernot, J.P.; Gomina, M.; Bréard, J.; Morvan, C.; Baley, C. Influence of an Agatha Flax Fibre Location in a Stem on Its Mechanical, Chemical and Morphological Properties. Compos. Sci. Technol. 2009, 69, 1399–1403. [Google Scholar] [CrossRef]
- Državni Hidrometeorološki Zavod (DHMZ). Climate Data for Croatia—2017. Available online: https://meteo.hr/klima.php?section=klima_podaci¶m=k2_1&Godina=2017 (accessed on 18 March 2025).
- Poudel, S.; Shaw, R. The Relationship between Climate Variability and Crop Yield in a Mountainous Environment: A Case Study in Lamjung District, Nepal. Climate 2016, 4, 13. [Google Scholar] [CrossRef]
- Pandya, P.A.; Ghosiya, S.M.; Pithiya, V.H.; Dudhatra, S.P. Effect of rainfall on productivity of cotton. Emer. Life Sci. Res. 2020, 6, 56–63. [Google Scholar] [CrossRef]
- Butorac, J.; Brunšek, R.; Pospišil, M.; Augustinović, Z. The Influence of Water Hardness on the Agronomic Traits of Foreign Fibre Flax Varieties in the Republic of Croatia. Tekstilec 2022, 65, 218–226. [Google Scholar] [CrossRef]
- Kitczak, T.; Jarnuszewski, G.; Łazar, E.; Malinowski, R. Sida hermaphrodita Cultivation on Light Soil—A Closer Look at Fertilization and Sowing Density. Agronomy 2022, 12, 2715. [Google Scholar] [CrossRef]
- Gudelj-Velaga, A.; Bilandžija, N.; Grubor, M.; Leto, J.; Krička, T. Influence of a dry year on the Virginia mallow energy properties. In Proceedings of the 58th Croatian & 18th International Symposium on Agriculture, Dubrovnik, Croatia, 11–17 February 2023; pp. 427–431. [Google Scholar]
- BIOCOMPOSITES Project Team. Final Report BIOCOMPOSITES 2020–2023; Tekstilno—Tehnološki Fakultet, Agronomski Fakultet, University of Zagreb: Zagreb, Croatia, 2024; Available online: https://biokompoziti.eu/wp-content/uploads/2024/02/Finalni-izvjestaj_BIOKOMPOZITI_2020-2023.pdf (accessed on 2 March 2025).
- Andrassy, M.; Čunko, R. Vlakna; Zrinski d.d.: Čakovec, Croatia, 2005. [Google Scholar]
- Senwitz, C.; Kempe, A.; Neinhuis, C.; Mandombe, J.L.; Branquima, M.F.; Lautenschläger, T. Almost Forgotten Resources—Biomechanical Properties of Traditionally Used Bast Fibers from Northern Angola. BioResources 2016, 11, 7595–7607. [Google Scholar] [CrossRef]
- Yusoff, R.B.; Takagi, H.; Nakagaito, A.N. Tensile and Flexural Properties of Polylactic Acid-Based Hybrid Green Composites Reinforced by Kenaf, Bamboo and Coir Fibers. Ind. Crops Prod. 2016, 94, 562–573. [Google Scholar] [CrossRef]
- Alcock, M.; Ahmed, S.; DuCharme, S.; Ulven, C. Influence of Stem Diameter on Fiber Diameter and the Mechanical Properties of Technical Flax Fibers from Linseed Flax. Fibers 2018, 6, 10. [Google Scholar] [CrossRef]
- Kovačević, Z. Development of Advanced Polylactide Nanobiocomposite Reinforced with Spartium junceum L. Fibres. Ph.D. Thesis, University of Zagreb Faculty of Textile Technology, Zagreb, Croatia, 25 October 2019. [Google Scholar]
- Kovačević, Z.; Vukušić, S.B.; Zimniewska, M. Comparison of Spanish Broom (Spartium junceum L.) and Flax (Linum usitatissimum) Fibre. Text. Res. J. 2012, 82, 1786–1798. [Google Scholar] [CrossRef]
- Oladele, I.O.; Michael, O.S.; Adediran, A.A.; Balogun, O.P.; Ajagbe, F.O. Acetylation Tretament for the Batch Processing of Natural Fibers: Effects on Constituents, Tensile Properties and Surface Morphology of Selected Plant Stem Fibers. Fibers 2020, 8, 73. [Google Scholar] [CrossRef]
- Keskin, Y.; Dalmis, R.; Balci Kilic, G.; Seki, Y.; Koktas, S. Extraction and Characterization of Cellulosic Fiber from Centaurea Solstitialis for Composites. Cellulose 2020, 27, 9963–9974. [Google Scholar] [CrossRef]
- Dawit, J.B.; Regassa, Y.; Lemu, H.G. Property Characterization of Acacia Tortilis for Natural Fiber Reinforced Polymer Composite. Results Mater. 2020, 5, 100054. [Google Scholar] [CrossRef]
- Liu, L.; Lao, C.; Zhang, N.; Chen, H.; Deng, G.; Zhu, C.; Peng, D. The Effect of New Continuous Harvest Technology of Ramie (Boehmeria nivea L. Gaud.) on Fiber Yield and Quality. Ind. Crops Prod. 2013, 44, 677–683. [Google Scholar] [CrossRef]
- Vujasinović, E.; Pavunc Samaržija, M. Biokompoziti-materijali budućnosti. In Održivi Razvoj Biokompozita i Biogoriva iz Obnovljivih Izvora Energije; Bischof, S., Ed.; Sveučilište u Zagrebu Tekstilno-Tehnološki Fakultet: Zagreb, Croatia, 2023; pp. 113–152. ISBN 978-953-8418-09-9. [Google Scholar]
- Wallenberger, F.T. Natural Fibers, Plastics and Composites; Kluwer Academic: Boston, MA, USA, 2004. [Google Scholar]
- Li, X.; Tabil, L.G.; Panigrahi, S. Chemical Treatments of Natural Fiber for Use in Natural Fiber-Reinforced Composites: A Review. J. Polym. Environ. 2007, 15, 25–33. [Google Scholar] [CrossRef]
- Martin, N.; Mouret, N.; Davies, P.; Baley, C. Influence of the Degree of Retting of Flax Fibers on the Tensile Properties of Single Fibers and Short Fiber/Polypropylene Composites. Ind. Crops Prod. 2013, 49, 755–767. [Google Scholar] [CrossRef]
- AL-Oqla, F.M.; Sapuan, S.M.; Ishak, M.R.; Nuraini, A.A. A Novel Evaluation Tool for Enhancing the Selection of Natural Fibers for Polymeric Composites Based on Fiber Moisture Content Criterion. BioResources 2014, 10, 299–312. [Google Scholar] [CrossRef]
- Zuhudi, N.Z.M.; Zulkifli, A.F.; Zulkifli, M.; Yahaya, A.N.A.; Nur, N.M.; Aris, K.D.M. Void and Moisture Content of Fiber Reinforced Composites. J. Adv. Res. Fluid. Mech. Therm. Sci. 2021, 87, 78–93. [Google Scholar] [CrossRef]
- Moudood, A.; Hall, W.; Öchsner, A.; Li, H.; Rahman, A.; Francucci, G. Effect of Moisture in Flax Fibres on the Quality of Their Composites. J. Nat. Fibers 2017, 16, 209–224. [Google Scholar] [CrossRef]
- Shuvo, I.I. Fibre Attributes and Mapping the Cultivar Influence of Different Industrial Cellulosic Crops (Cotton, Hemp, Flax, and Canola) on Textile Properties. Bioresour. Bioprocess. 2020, 7, 51. [Google Scholar] [CrossRef]
- Kovačević, Z.; Strgačić, S.; Bischof, S. Barley Straw Fiber Extraction in the Context of a Circular Economy. Fibers 2023, 11, 108. [Google Scholar] [CrossRef]
- Kovačević, Z.; Bischof, S.; Bilandžija, N.; Krička, T. Conversion of Waste Agricultural Biomass from Straw into Useful Bioproducts—Wheat Fibers and Biofuels. Sustainability 2024, 16, 4739. [Google Scholar] [CrossRef]
- Sadrmanesh, V.; Chen, Y. Bast Fibres: Structure, Processing, Properties, and Applications. Int. Mater. Rev. 2018, 64, 381–406. [Google Scholar] [CrossRef]
- Thyavihalli Girijappa, Y.G.; Mavinkere Rangappa, S.; Parameswaranpillai, J.; Siengchin, S. Natural Fibers as Sustainable and Renewable Resource for Development of Eco-Friendly Composites: A Comprehensive Review. Front. Mater. 2019, 6, 226. [Google Scholar] [CrossRef]
- Le Gall, M.; Davies, P.; Martin, N.; Baley, C. Recommended Flax Fibre Density Values for Composite Property Predictions. Ind. Crops Prod. 2018, 114, 52–58. [Google Scholar] [CrossRef]
- Simpson, M.G. Plant Systematics; Academic Press: Oxford, UK, 2010. [Google Scholar] [CrossRef]
- Hamad, S.F.; Stehling, N.; Holland, C.; Foreman, J.P.; Rodenburg, C. Low-Voltage SEM of Natural Plant Fibers: Microstructure Properties (Surface and Cross-Section) and Their Link to the Tensile Properties. Procedia Eng. 2017, 200, 295–302. [Google Scholar] [CrossRef]
- Yu, C.; Zheng, Y.; Sun, Y.; Wang, J. Study on the Efficiency and Recyclability of Fenton-MnFe2O4 for the Degumming of Hemp Fibers. RSC Adv. 2023, 13, 36382–36391. [Google Scholar] [CrossRef]
- Amiri, A.; Ulven, C.A.; Huo, S. Effect of Chemical Treatment of Flax Fiber and Resin Manipulation on Service Life of Their Composites Using Time-Temperature Superposition. Polymers 2015, 7, 1965–1978. [Google Scholar] [CrossRef]
- Kostic, M.M.; Pejic, B.M.; Asanovic, K.A.; Aleksic, V.M.; Skundric, P.D. Effect of Hemicelluloses and Lignin on the Sorption and Electric Properties of Hemp Fibers. Ind. Crops Prod. 2010, 32, 169–174. [Google Scholar] [CrossRef]
- Le Guen, M.J.; Newman, R.H. Pulped Phormium Tenax Leaf Fibres as Reinforcement for Epoxy Composites. Compos.-A Appl. Sci. Manuf. 2007, 38, 2109–2115. [Google Scholar] [CrossRef]
- Morgillo, L.; Brionne, L.; Melelli, A.; Ouagne, P.; Scheel, M.; Weitkamp, T.; Shah, D.U.; Abida, M.; Beaugrand, J.; Bourmaud, A. Elucidating Links between the Mechanical Performance of Flax Fibres and Their Structural Defects. Ind. Crops Prod. 2023, 206, 117722. [Google Scholar] [CrossRef]
- Melelli, A.; Durand, S.; Arnould, O.; Richely, E.; Guessasma, S.; Jamme, F.; Beaugrand, J.; Bourmaud, A. Extensive Investigation of the Ultrastructure of Kink-Bands in Flax Fibres. Ind. Crops Prod. 2021, 164, 113368. [Google Scholar] [CrossRef]
- Abidi, N.; Hequet, E.; Cabrales, L.; Wilkins, T.; Wells, L.W. Evaluating Cell Wall Structure and Composition of Developing Cotton Fibers using Fourier Transform Infrared Spectroscopy and Thermogravimetric Analysis. J. Appl. Polym. Sci. 2008, 107, 476–486. [Google Scholar] [CrossRef]
- Huang, Y.; Wang, L.; Chao, Y.; Nawawi, D.S.; Akiyama, T.; Yokoyama, T.; Matsumoto, Y. Analysis of lignin aromatic structure in wood based on the IR spectrum. J. Wood. Chem. Technol. 2012, 32, 294–303. [Google Scholar] [CrossRef]
- Suciyati, S.W.; Manurung, P.; Sembiring, S.; Situmeang, R. Comparative study of Cladophora sp. Cellulose by using FTIR and XRD. J. Phys. Conf. Ser. 2021, 1751, 012075. [Google Scholar] [CrossRef]
- Hospodarova, V.; Singovszka, E.; Stevulova, N. Characterization of Cellulosic Fibers by FTIR Spectroscopy for their Further Implementation to Building Materials. Am. J. Anal. Chem. 2018, 9, 303–310. [Google Scholar] [CrossRef]
- Djafari Petroudy, S.R. Physical and mechanical properties of natural fibers. In Advanced High Strength Natural Fibre Composites in Construction; Fan, M., Fu, F., Eds.; Woodhead Publishing: Sawston, UK, 2017. [Google Scholar]
- Khai, D.M.; Nhan, P.D.; Hoanh, T.D. An investigation of the structural characteristics of modified cellulose from Acacia pulp. Viet. J. Sci. Technol. 2017, 55, 452–460. [Google Scholar] [CrossRef]
- Abbass, A.; Paiva, M.C.; Oliveira, D.V.; Lourenco, P.B.; Fangueiro, R. Insight into the Effects of Solvent Treatment of Natural Fibers Prior to Structural Composite Casting: Chemical, Physical and Mechanical Evaluation. Fibers 2021, 9, 54. [Google Scholar] [CrossRef]
- Fan, M.; Dai, D.; Huang, B. Fourier Transform Infrared Spectroscopy for Natural Fibres. In Fourier Transform, Materials Analysis; Salih, S., Ed.; InTechOpen Limited: London, UK, 2012. [Google Scholar]
- Cintron, M.S.; Hinchliffe, D.J. FT-IR Examniation of the Development of Secondary Cell Wall in Cotton Fibers. Fibers 2015, 3, 30–40. [Google Scholar] [CrossRef]


Disclaimer/Publisher’s Note: The statements, opinions and data contained in all publications are solely those of the individual author(s) and contributor(s) and not of MDPI and/or the editor(s). MDPI and/or the editor(s) disclaim responsibility for any injury to people or property resulting from any ideas, methods, instructions or products referred to in the content. |
© 2025 by the authors. Licensee MDPI, Basel, Switzerland. This article is an open access article distributed under the terms and conditions of the Creative Commons Attribution (CC BY) license (https://creativecommons.org/licenses/by/4.0/).