Abstract
Numerous experimental and numerical studies have extensively investigated the performance of reinforced deep beams made with natural coarse aggregate concrete. However, limited research has been carried out on reinforced deep beams made of concrete with coarse aggregate from recycled materials and steel fibers. The main goal of this research is to create an accurate finite element model that can mimic the behavior of deep beams using concrete with recycled coarse aggregate and different ratios of steel fibers. The suggested model represents the pre-peak, post-peak, confinement, and concrete-to-steel fiber bond behavior of steel fiber concrete, reinforcing steel, and loading plates by incorporating the proper structural components and constitutive laws. The deep beams’ nonlinear load–deformation behavior is simulated in displacement-controlled settings. In order to verify the model’s correctness, the ultimate loading capacity, load–deflection relationships, and failure mechanisms are compared between numerical predictions and experimental findings. The comparison outcomes of the performance of the beams demonstrate that the numerical model effectively predicts the behavior of deep beams constructed with recycled coarse aggregate concrete. The findings of the experiment and the numerical analysis exhibit a high degree of convergence, affirming the model’s capability to accurately simulate the performance of such beams. In light of how accurately the numerical predictions match the experimental results, an extensive parametric study is conducted to examine the impact of parameters on the performance of deep beams with different ratios of steel fibers, concrete compressive strength, type of steel fibers (short or long), and effective span-to-effective depth ratio. The effect of each parameter is examined relative to its effect on the fracture energy.
1. Introduction
According to the ACI 318M-21 [1] provisions, deep beams are structural members with a low span-to-depth ratio. This ratio allows for the development of compression struts between the loads and supports. Deep beams are further characterized by meeting one of the following criteria: (i) the proportion of clear spans (l0) to the total member’s height (h) is equal to or less than 4, or (ii) the point load distance (a) is twice the member depth measured from the face of the support (a ≤ 2 h). Deep beams serve as essential structural elements with various applications in different construction scenarios. Some prominent applications of deep beams include foundation walls, pile caps in foundations, and transfer girders in tall buildings. In each of these applications, deep beams play a crucial role in bearing and transferring loads and enhancing structural stability [2].
Discrete steel fibers are randomly distributed in a concrete matrix to develop a composite material called steel fiber-reinforced concrete (SFRC). In reinforced concrete structural members, SFRC is commonly used in conjunction with conventional reinforcing steel bars. However, defining the physical characteristics of the SFRC can be challenging due to several variables, such as the mechanical characteristics of the steel fibers, qualities of the concrete matrix, mixing and curing processes, rate of loading, and environmental conditions. Understanding the constitutive performance of SFRC in tension and compression is crucial for numerical modeling and design purposes. Researchers have conducted experimental programs to examine how steel fiber concrete (SFC) responds to uniaxial compressive loading [3,4]. These studies aimed to examine the impact of incorporating steel fibers into the concrete matrix. The mechanical properties and stress–strain behavior of steel fibrous concrete in compression are influenced by variables including the classification of fibers and their volume percentage. It has been found that adding fibers to the concrete mix significantly enhances the toughness, integrity, and ductility of the composite under compression. Furthermore, a better capacity for energy absorption and ductility is related to the augmentation of fiber content, particularly when using deformed fibers with hooked ends [5]. The fibers’ aspect ratio (length-to-diameter ratio) has proven to be more effective in improving the post-peak performance due to their strong resistance to pullout from the matrix [6]. The incorporation of fibers into concrete enhances the performance of the material in both tension and compression, particularly in the post-peak stage.
Deep beams are loaded as simple beams, where a substantial portion of the load is supported through compression forces. Consequently, the strain distribution deviates from linearity, and failure is primarily attributed to shear deformation rather than pure flexure. Numerous experimental studies have been conducted on simply supported deep beams made of fibrous concrete [7,8,9,10,11,12,13,14,15,16,17,18,19,20] with various shear span-to-effective depth ratios. These experimental tests investigated the shear behavior of SFRC deep beams and evaluated the effectiveness of fibers made of steel as web reinforcement in enhancing shear resistance. Typically, increasing the volume fraction of fibers in concrete results in an improvement in cracking strength. This can be justified by the delayed creation and subsequent spread of flexural and inclined cracks. By adding steel fibers, the concrete becomes more resilient and changes from being brittle to ductile. To the best of the authors’ knowledge, no previous studies in the available literature have examined the impact of concrete compressive strength on the shear behavior of steel fiber-reinforced concrete beams. However, numerous investigations have been conducted on prisms to assess steel fibrous concrete, establishing a well-understood statement of its behavior.
In the existing literature, a considerable number of experimental studies have been conducted on the shear behavior of steel fiber-reinforced concrete (SFRC) deep beams [21,22,23,24,25,26,27,28,29,30]. The effectiveness of steel fibers as web reinforcement in SFRC deep beams was investigated through experimental tests. Steel fiber volume fractions (Vf) ranged between 1.0 and 2.0%. Shear span-to-effective depth ratios (a/d) were between 0.75 and 1.50, and steel stirrup combinations were included in some specimens. The dominant loading scenario was put through a two-point top-loading test until failure. In all kinds of beams, it was clear that final strength declined as the a/d ratio increased. Flexural cracking was less common and less severe when the shear span decreased. In addition, an increase in the volume percentage of fibers generally results in an increase in cracking strength due to the delayed development and subsequent propagation of flexural and inclined fractures.
However, there is a scarcity of studies specifically focused on the finite element modeling of such beams. Additionally, the major concrete codes [1,31] have not provided design equations to estimate the shear strength of deep beams in the presence of steel fibers. To facilitate the broader application of steel fiber-reinforced concrete, further numerical studies, which are more economical than experimental ones, are required to enhance understanding of its behavior. Furthermore, the development of numerical models specifically tailored for SFRC deep beams is necessary to ensure accurate and reliable design practices. This study utilized the VecTor2 computer software version 4.4 [32] to analyze SFRC deep beams. Nonlinear finite element models were developed, and their analytical predictions were compared with experimental results obtained from testing simple SFRC deep beams. The primary objectives of this study are as follows: (i) to develop finite element models that can accurately predict the shear behavior of SFRC deep beams; (ii) to examine the importance of some variables on the performance of SFRC deep beams such as fiber content, fiber type, shear span-to-effective depth ratio, and concrete compressive strength; and (iii) to investigate the effect of each parameter relative to its effect on the fracture energy. Analyzing the effect of these parameters aims to provide insightful information on the construction and performance of such structural elements.
2. Numerical Simulation
The finite element method has emerged as the most powerful approach for conducting nonlinear simulations of reinforced concrete (RC) structures subjected to various loading circumstances. The method enables accurate and comprehensive evaluations of the structural behavior of RC elements, considering the complex interaction with various variables and the nonlinear response of materials. A three-dimensional nonlinear finite element model is created utilizing the VecTor2 software. It is based on the modified compression field theory (MCFT) [32,33], which has proven to be effective in accurately simulating the load–deformation behavior of structural members, making it suitable for analyzing deep beams. The material modeling and spatial discretization implemented to mimic the behavior of concrete and reinforcing steel are briefly described in this section. For more comprehensive information and implementation details, readers are directed to the VecTor2 manual [34].
2.1. Constitutive Laws for Materials
2.1.1. Concrete
The VecTor2 software is specialized for performing three-dimensional nonlinear finite element analysis (NLFEA) of reinforced concrete members. Its concrete model is created based on the modified compression field theory (MCFT). The MCFT was originally proposed by Vecchio and Collins [33] and has been widely accepted and endorsed by design codes such as the AASHTO [35] and the CSA [36]. The MCFT concrete model was developed based on a program of experimental tests to study how reinforced concrete panels respond to biaxial pressures, which encompassed mixed shear and normal forces in addition to pure shear forces [37,38,39,40,41,42,43,44,45]. Through these experiments, the MCFT concrete model was evaluated and found to accurately represent the complex response of reinforced concrete panels under different stress conditions.
The MCFT considers cracked concrete as an orthotropic material and employs the smeared rotating crack approach to ensure compatible crack patterns with those observed in numerous reinforced concrete (RC) members. In this approach, cracks are distributed uniformly and automatically reoriented to align with the principal concrete compressive stress field direction without restraint. The MCFT relies on several key assumptions, such as uniform distribution of smeared rotating cracks throughout the material, neglecting strain history, and considering each strain phase independently of previous phases. Furthermore, the theory expresses the mean stresses and strains of the three sets that make the MCFT, taking local strains and stresses at crack sites into consideration. These assumptions, along with the implementation of the smeared rotating crack method, facilitate the modeling of cracked concrete behavior and allow realistic representation of RC member responses, contributing to accurate analyses and predictions of their structural performance. The MCFT concrete model incorporates the essential aspects of compatibility, equilibrium, and constitutive relationships to accurately represent the behavior of concrete.
The stress–strain relationship for concrete incorporate the characteristics of compression softening, tension softening, and tension stiffening to accurately capture the nonlinear behavior of concrete under different loading scenarios. Figure 1 illustrates the simplified uniaxial stress–strain curve employed for concrete with fibers. Under compression, the stress–strain curve is split into the following three primary branches: pre-peak, post-peak, and softening. In the pre-peak ascending branch of the curve, the stress–strain relationship is linearly elastic up to 50 percent of the maximum compressive strength. Following the linear part, the curve transitions into a curved segment leading up to the peak value. This curvature is a result of the expansion and spread of micro-cracks within the composite material. The inclusion of fibers helps to distribute and control the growth of these micro-cracks, resulting in a more gradual and progressive failure mechanism. The VecTor2 software library provides a range of options to represent the behavior of concrete in the three parts of the stress–strain curve. The different models utilized to represent the behavior of steel fiber concrete, reinforcement steel, and concrete-to-steel fiber bond are provided in Table 1. Lee et al.’s concrete model [39,40,41,42,43] was implemented to represent the concrete in the pre-peak and post-peak branches, whereas the Vecchio 1992-A (e1/e2-Form) [44] was utilized for the softening branch. The stress–strain relation of concrete with steel fibers for the pre-peak and post-peak branches is described by the following equations:
where εc is the concrete strain; εc0 is the concrete strain corresponding to the peak compressive strength; and A and B are the parameters accounting for the effect of fibers, which are assessed for compressive behaviors before and after peak in the following ways:
fc′ is the concrete compressive strength; Vf is the volume fraction of steel fibers; lf and df are the length and the diameter of fibers, respectively. The concrete elastic modulus Ec is calculated as follows:
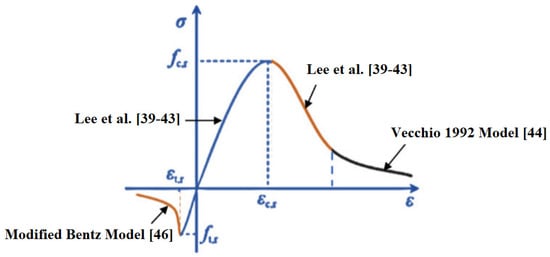
Figure 1.
Concrete model implemented [39,40,41,42,43,44,46].

Table 1.
Constitutive models used for concrete and reinforcing steel.
The concrete stress–strain relationship in the softening branch equations can be expressed as follows:
The formulation of the modified Bentz model [46] was adopted to represent the tension stiffening in the presence of steel-fibered concrete. The equations are as follows:
where ԑc1 is the average net concrete axial strain in the principal tensile 1-direction; m is the mass matrix; and ft is the concrete tensile strength.
For the steel-fibred concrete in tension, the simplified diverse embedment model (SDEM) [42] was employed. Before crack initiation, it is assumed linear up to the tensile strength (fct), which can be obtained as follows:
where αf is the fiber orientation factor taken as 0.5; βf is the fiber content factor taken as 0.6; wcr is the average width of the crack; sf is the slip at the frictional bond strength.
The nonlinear post-peak tensile stress–strain behavior (tension softening) was produced by Hordijk et al.’s model, implemented through the following equation:
where C1 and C2 are constants taken as 3 and 6.93, respectively; fcr is the cracking stress of the concrete; and Gf is the fracture energy required to form a complete crack of unit area, assumed to be 75 N/m.
The failure surface for concrete is adjusted to capture the impact of steel fibers. The presence of steel fibers in concrete provides high confinement, which effectively enhances the strength and performance of the material by controlling crack propagation. In this study, the Kupfer/Richart equation was selected to represent the confinement effect of the concrete that contains steel fibers. The confinement factor (βl) is expressed as follows:
where fcn is the normal lateral stresses acting on concrete and fcl is the concrete lateral confining stress. The cracking criterion considers the effect of stress states on the determination of the cracking strength (fcr) based on the specific stress conditions experienced by the concrete. The current study considered the Mohr–Coulomb failure criterion to account for the cracking strength as follows:
where is the internal angle of friction automatically assumed to be 37° in the VecTor2 software; c is the concrete cohesion.
In steel-fibered concrete, bond is the transfer of load between fiber and concrete. It can be categorized into various components, depending on the type of fiber: (i) fiber-to-concrete adhesion, (ii) frictional resistance, (iii) mechanical anchorage (fiber geometry), and (iv) fiber-to-fiber interlock. These components collectively contribute to the overall bond strength and effectiveness in load transfer between fiber and concrete. In this study, the Eligehausen model was utilized to represent the bond behavior of fibrous concrete [47]. It should be confirmed that Figure 2 is the Eligehausen bond stress–slip model. In the model, ꞵ is a parameter that regulates stress reduction (softening) following the maximum bond stress. Note that the bond between steel fibers and concrete appeared at the onset of cracking. The bond stress–slip relationship (τ-∆) is implemented to describe the behavior between bond concrete stress (τ) and slip (Δ) that happens at their contact. The bond stress–slip relationship (τ-∆) is expressed by the following equations:
where db is the bar diameter; S, H, and α are constants assumed to be 13.6, 0.98, and 0.4, respectively.
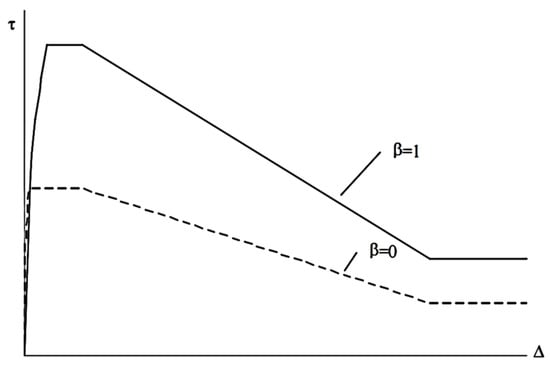
Figure 2.
Steel fiber-to-concrete bond stress–slip relationship.
2.1.2. Steel Reinforcement and Loading Plates
Steel reinforcement in structural applications is commonly represented using an elastic–plastic model. The VecTor2 software simulates the steel reinforcement by including linear response, yielding, and strain hardening, as depicted in Figure 3. Both tension and compression reinforcement had this behavior. In the linear branch, the modulus of elasticity of steel bars (Es) was taken as 200 GPa, whereas the behavior was horizontally aligned in the yielding branch. The elastic modulus in the strain hardening branch (Eh) is calculated as follows:
Eh = 0.1Es
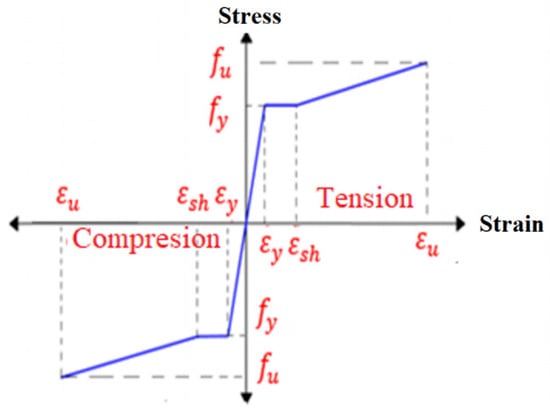
Figure 3.
Steel reinforcement model.
The assumption of Eh = 0.1Es is a standard default for reinforcing steel in VecTor2 unless there is experimental data.
To simulate the interaction between the concrete and steel reinforcement, a full contact bond assumption was applied. This assumption is based on the observation that no debonding failures were reported in the experimental investigations or in studies conducted on similar structural elements. The steel loading plates, where the load and supports were located, were modeled as linear elastic under tension and compression.
2.2. Spatial Discretization
Figure 4 presents a typical beam model of this study. The concrete elements were modeled using brick elements. Each element has eight nodes, and each node has three degrees of freedom (X-, Y-, and Z-directions). The brick elements incorporate features to account for plastic deformation, directional integration cracking in tension, and crushing in compression. This indicates that the MCFT model for brick elements replicates the real behavior of concrete under load, such as permanent (plastic) deformation, fracture development under tension, material deterioration, and crushing under compression. Furthermore, the concrete model is able to replicate rotation, tension stiffening, and realistic crack creation in three dimensions. The brick element is able to represent the whole nonlinear reaction of concrete, from first cracking to final crushing, due to this combination. For brick elements, the integration algorithm used is Gaussian numerical integration. The element stiffness and internal force were calculated at each integration point by adding the contributions of stresses and strains. Note that the steel loading plates were modeled as brick elements.
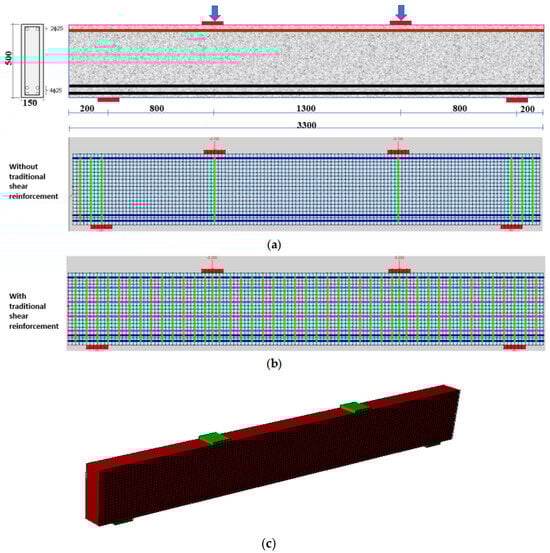
Figure 4.
Modeling of deep beams: (a) without steel stirrups, (b) with steel stirrups, and (c) typical 3D model of specimens with half thickness.
The longitudinal and transverse steel bars were represented as two-node truss elements with three degrees of freedom per node. In the numerical model, the steel bars were modeled as embedded elements within the concrete ones. This means that the reinforcing steel mesh and concrete had the same nodes. To ensure an appropriate mesh for the analysis, the aspect ratio of the elements was adjusted not to be more than 2.0. This means that the ratio between the vertical and horizontal dimensions of the elements was kept within this limit. Several iterative evaluations were carried out to establish the mesh size, where different mesh configurations were evaluated. The mesh size selected was the one that ensured that further refining did not significantly affect the numerical predictions while minimizing computational resources.
To take advantage of the symmetry of loading and geometry of the modeled beams, the numerical simulation only considered one-half of the beam thickness. This approach was used to reduce computational efforts and runtime while still capturing the essential behavior of the full beam. The correct boundary conditions were implemented through the centroid of the beam cross-section. These nodes were constrained in the Y-direction by setting the displacement along this direction to zero on the plane of symmetry. It is necessary to add that the displacement-controlled solutions were implemented to enable the numerical models to successfully replicate the post-peak behavior.
2.3. Modeled Specimens
The objective of the experimental tests conducted by Kachouh et al. [48,49] was to investigate the performance of SFRC deep beams. This study involved seven beams composed of concrete with recycled coarse aggregate (RCA). The beams’ cross-section was rectangular, with dimensions of 2900 mm, 500 mm, and 150 mm in length, depth, and thickness, respectively. The ratio of shear span-to-effective depth was 1.8, and it was maintained constant for all the specimens. The beams were classified as deep beams according to the American Concrete Institute guidelines [1]. The material properties remained consistent across all experiments and are presented in Table 2. The specimens’ representative dimensions are depicted in Figure 4. The beams’ compressive strength ranged from 24 to 36 MPa and they were subjected to four-point loading. Among the different available types of steel fibers, Kachouh et al. [48,49] utilized the end-hooked steel fibers (3D fibers) with fiber length, diameter, and ultimate tensile strength of 35 mm, 0.55 mm, and 1345 MPa, respectively. The fibers’ length-to-diameter (aspect ratio) was 65.
Table 2.
Properties of the tested specimens.
The experimental tests were carried out to evaluate the impact of steel-fibred concrete on deep beam shear behavior. The designation of the specimens considered the following three terms: recycled coarse aggregate, ratio of steel fibers, and presence of steel stirrups. The first term indicated the type of coarse aggregate. BR100 indicates 100% use of recycled coarse aggregate, whereas BR0 is for normal coarse aggregate. SF stands for steel fiber ratio, which is 0, 1, 2, or 3%. The last term ‘S’ denotes the presence of steel stirrups. Two specimens served as a reference to assess the impact of using concrete with coarse recycled aggregate. Steel stirrups along the shear span were not provided in these specimens. Furthermore, concrete with entirely coarse recycled aggregate was used to create two specimens which did not incorporate any steel fibers. These specimens were denoted as BR0-SF0-S and BR100-SF0-S. In order to improve the beams’ resistance to shear, different proportions of steel fibers were added to the concrete mixtures. The steel fiber ratios employed were 1, 2, and 3% for specimens SF100-SF1, SF100-SF2, and SF100-SF3, respectively. It is important to note that the specimen designations align with those used in the original reference [48,49].
3. Numerical Predictions and Parametric Analysis
The reliability of the numerical model is assessed by comparing its predictions with experimental results in terms of maximum loading capacity, load–deflection relationship, and failure mode. Once the accuracy is confirmed, parametric analyses are conducted for better comprehension of the variables impacting the shear behavior of SFRC deep beams.
3.1. Validation of Numerical Model
3.1.1. Maximum Loading Capacity
Figure 5 and Table 3 illustrate the comparison between the experimental results and numerical predictions regarding the maximum loading capacity and deflection. In the figure, the maximum loading capacity represents the maximum load that was attained by the specimens. For the beams constructed with normal coarse aggregate concrete and with no steel fibers (specimens BR0-SF0 and BR0-SF0-S), the theoretical predictions estimated load-carrying capacities with an increase of 3% and 17% over the experimental measurements. Note that specimen BR0-SF0-S contains steel stirrups along the shear span. It should be mentioned that the loading capacity of the beam was approximately increased by 88% when steel stirrups were installed along the shear span.
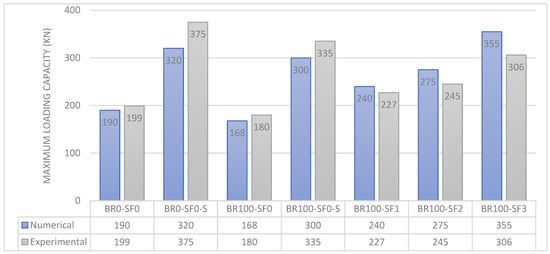
Figure 5.
Comparison between numerical and experimental results.
Table 3.
Numerical predictions versus experimental results.
In comparison to the published test values, the model findings for specimens BR100-SF0 and BR100-SF0-S, which include recycled coarse aggregate without steel fibers, are 107% and 112%, respectively. Although the BR100-SF0-S specimen was reinforced with steel stirrups along the shear span, using coarse recycled aggregate resulted in a decrease in the maximum loading capacity compared to the one with normal coarse aggregate.
By incorporating steel fibers into recycled coarse aggregate concrete deep beams, the experimental findings were used to further verify the numerical model. Specimens BR100-SF1, BR100-SF2, and BR100-SF3 were predicted with maximum loading capacities being 98, 80, and 77% of their corresponding experimental results, respectively. For these specimens, it can be noted that the numerical prediction of the maximum strength was lower than the experimental measurements. Both the experimental and numerical results prove that there is an ideal fiber content that can be used to explain the difference between the numerical forecasts and experimental outcomes. This indicates that an excessive increase in fiber content tends to decrease the strength and workability of fibrous concrete. The numerical predictions follow the conclusions highlighted by El-Hassan and Elkholy [4] and Lee et al. [50].
Overall, the numerical model showed a high level of accuracy in predicting the maximum loading capacity. The average loading capacity between experiments and numerical results was 102%, with a standard deviation of 0.12, indicating a strong agreement between the theoretical outcomes and the test data. It can be added that the percentage error is added in parentheses to Table 3 for better comparison between the results. Additionally, the fiber content results showed no significant difference in the maximum loading capacity between the experimental and numerical results.
3.1.2. Load–Deflection Relationship
Figure 6a–f compares the load–deflection relationships between the test measurements and numerical predictions. Initially, the identical stiffness was correctly anticipated by the numerical model as in the experimental data until the occurrence of shear cracking. However, after the initiation of cracks, the numerical model exhibited higher stiffness compared to the experimental results, indicating a slight overestimation of stiffness in the cracked parts. Moreover, the numerical model predicted smaller deflection values at the maximum loading capacity according to the outcomes of the experiment. For 1 and 2% steel fibers, it can be observed from Figure 6e that the load–deflection curve had a constant plateau beyond attaining its maximum loading capacity.
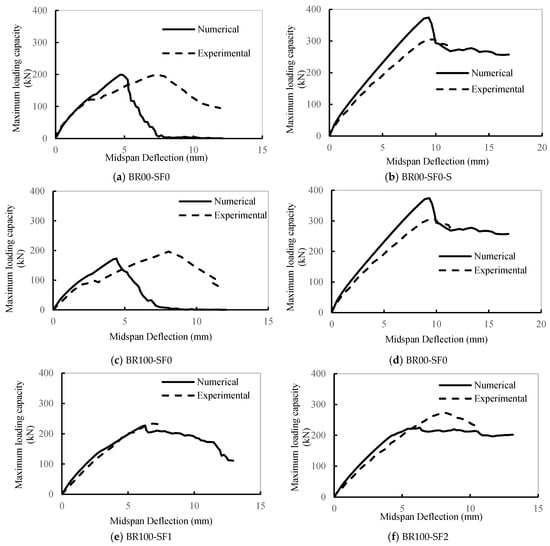
Figure 6.
Numerical and experimental load–deflection relationships for different specimens.
The mid-span deflection aligned to the maximum loading capacity was underestimated by the numerical model for specimens BR0-SF0, BR0-SF0-S, and BR100-SF1 with deviations of 25% and 17%, respectively. Similarly, the numerical predictions of central deflection for specimen BR100-SF0 were consistently smaller than the experimental values, with a deviation of 35%. Specimens BR100-SF0-S, BR100-SF1, BR100-SF2, and BR100-SF3 exhibited numerical central deflection comparable to the test measurements. It is observed that an increase in fiber content leads to an increase in the ductility (central deflection). This result is proved by an increase in central deflection corresponding to the maximum loading, which rose by 43% relative to the one with no steel fibers.
3.1.3. Failure Mode
Figure 7 illustrates the comparison between the failure mechanisms and fracture patterns identified from experiments and those predicted numerically for the deep beams. Generally, in terms of initialization, development, and slope, the computational results showed fracture patterns that closely matched the experimental findings. Shear failure was seen in every beam; it was mostly found in the mid-depth area of the beam’s web between the applied load and the support. As the applied load increased, the shear cracks widened and extended towards the point of applied load. With further load increase, horizontal cracks formed beneath the applied load, ultimately leading to beam failure due to concrete crushing at the load application point. The fracture region was significantly impacted by the presence of steel stirrups. Specifically, the presence of steel stirrups resulted in a wider shear cracking area (BR0-SF0-S and BR100-SF0-S specimens), whereas the absence of steel stirrups led to the observation of a single shear crack. In addition, the presence of steel fibers in the deep beam enhanced the bond strength and limited the shear crack area.
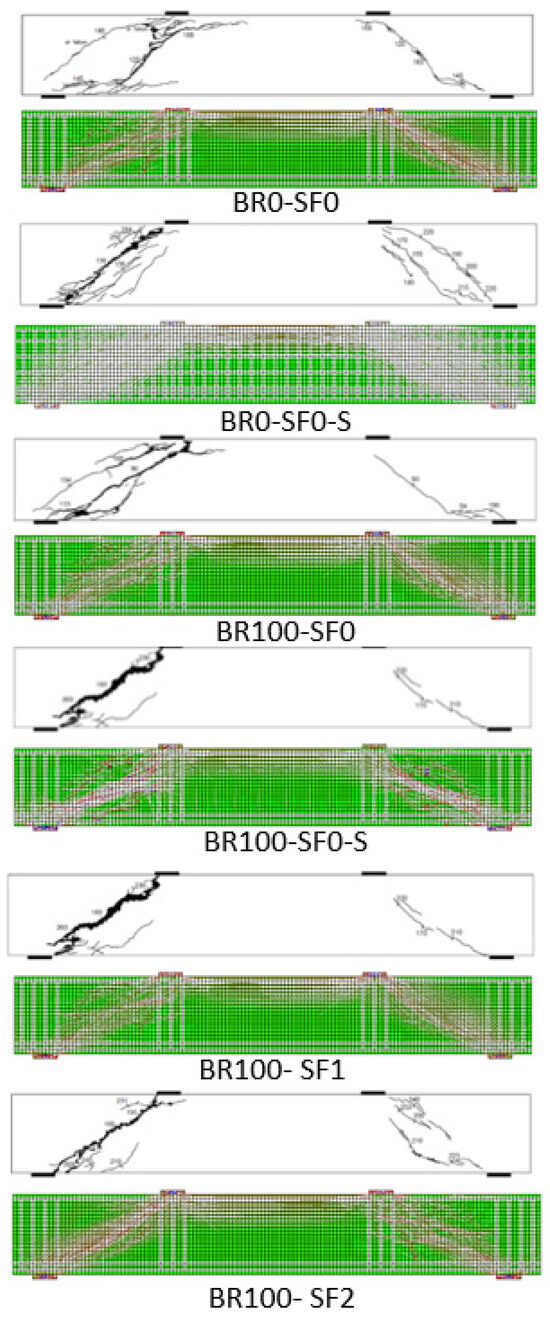
Figure 7.
Experimental versus numerical crack pattern and failure modes.
The theoretical outcomes displayed in Figure 7 demonstrated the capability of the numerical model to accurately replicate the experimentally observed failure mechanism. The main failure mechanism observed in every specimen was concrete crushing beneath the applied load point. The inclusion of steel fibers produced a significant influence in limiting the width of cracks. This suggests that the existence of steel fibers enhances the interlocking of aggregates, thereby improving the resistance to shear stresses and inhibiting the formation of shear cracks.
3.2. Parametric Study
Based on the accuracy of the numerical predictions against the experimental results, an extensive parametric study was carried out to examine the impact of key parameters, including the concrete compressive strength, amount of steel fibers, type of steel fiber (short or long), and effective span-to-effective depth ratio. The objective of the parametric study was to assess the influence of these parameters on the behavior of steel fiber-reinforced concrete deep beams. The parametric study was conducted using the beam dimension of Kachouh et al. [48,49].
Table A1 provides a comprehensive breakdown of the variables and their respective ranges of interest. As can be seen in the table, the parameters are divided into series based on the ratio of shear span-to-effective depth (a/d). Various values of a/d ratio were considered between 0.5 and 1.75, with an increment of 0.25. For each ratio, the effect of short and long fibers was investigated. The length and diameter of the fibers were 35 and 0.55 mm, respectively. For long fibers, it was 50 and 0.78 mm for the length and diameter, respectively. It can be observed that although the length and diameter for each type of fiber are different, they have identical aspect ratios. In addition, the tensile strength and elastic modulus were identical, 1346 MPa and 200 GPa, respectively, since they are both made of steel. Five different concrete compressive strength values, ranging from 20 to 50 MPa with increments of 10 MPa, were considered. The fiber content ratio was taken between 0.5 and 3%. At each trial, a ratio of 0.5% was added, except for the beam with a 0.5 shear span-to-effective depth ratio for both fiber types. The behavior of the beam with no steel fibers was also investigated. Throughout the parametric study, the deep beams were considered without web steel reinforcement along the shear span, in order to figure out the effect of the various parameters on increasing the shear resistance of deep beams. The theoretical outcomes displayed in Figure 7 demonstrated the capability of the numerical model to accurately replicate the experimentally observed failure mechanism. The main failure mechanism observed in every specimen was concrete crushing beneath the applied load point. The inclusion of steel fibers produced a significant influence on limiting the width of cracks, suggesting that the existence of steel fibers enhances the interlocking of aggregates, thereby improving the resistance to shear stresses and inhibiting the formation of shear cracks.
The results of the parametric study are mainly presented in terms of maximum loading capacity, which is utilized as a benchmark for comparison between the various parameters. The authors prioritize the maximum load capacity as it plays a crucial role in determining the effect of steel fiber contribution on shear strength. The numerical outcomes also consider the load–deflection relationship and the fracture energy of the beams. It is worth mentioning that concrete crushing under the applied load represents the predominant failure mode. Results of the parametric study are presented in Table A1.
3.2.1. Effect of Shear Span-to-Effective Depth Ratio
The effect of shear span-to-effective depth ratio (a/d) on the shear behavior of deep beams was investigated. Representative results are provided in Figure 8a–d. The numerical predictions reveal that the (a/d) ratio significantly influences the maximum shear strength of the beams. In all examined beams, the maximum shear strength in deep beams is primarily governed by the (a/d) ratio, regardless of the concrete strength and fiber type. The numerical results demonstrate that the maximum loading capacity increases as the value of (a/d) decreases. This outcome coincides with the one experimentally reported by [21,22,23]. When the same type of fiber, concrete strength, and fiber ratio are maintained, the maximum loading capacity of deep beams with (a/d) of 0.5 increases up to 156% compared to beams with (a/d) ratio of 1.5. The (a/d) ratio also exhibits a qualitative influence on the failure mode. It is necessary to add that at low values of (0.5 ≤ a/d ≤ 0.75), the presence of steel stirrups does not affect the maximum loading capacity. This can be attributed to the fact that the strut-and-tie is the governing failure mechanism in this case. When reducing the shear span-to-depth ratio (a/d), the maximum loading capacity increases due to enhanced arching action. As the (a/d) ratio decreases from 1.75 to 0.5, the maximum loading capacity experiences a remarkable increase of 55%. Deep beams with a smaller shear span-to-depth ratio (a/d) demonstrate lower central deflections corresponding to the maximum loading capacity, with an average reduction of 73% at the failure load. It is important to highlight that the failure mode of deep beams exhibited variation depending on the (a/d) ratio. Deep beams with a lower (a/d) ratio experience sudden failure with smaller shear crack areas compared to the observations made in deep beams with larger values of (a/d) ratio. The reduction in the (a/d) ratio produces a sudden brittle failure, whereas an increase in the (a/d) ratio leads to a more ductile failure mode.
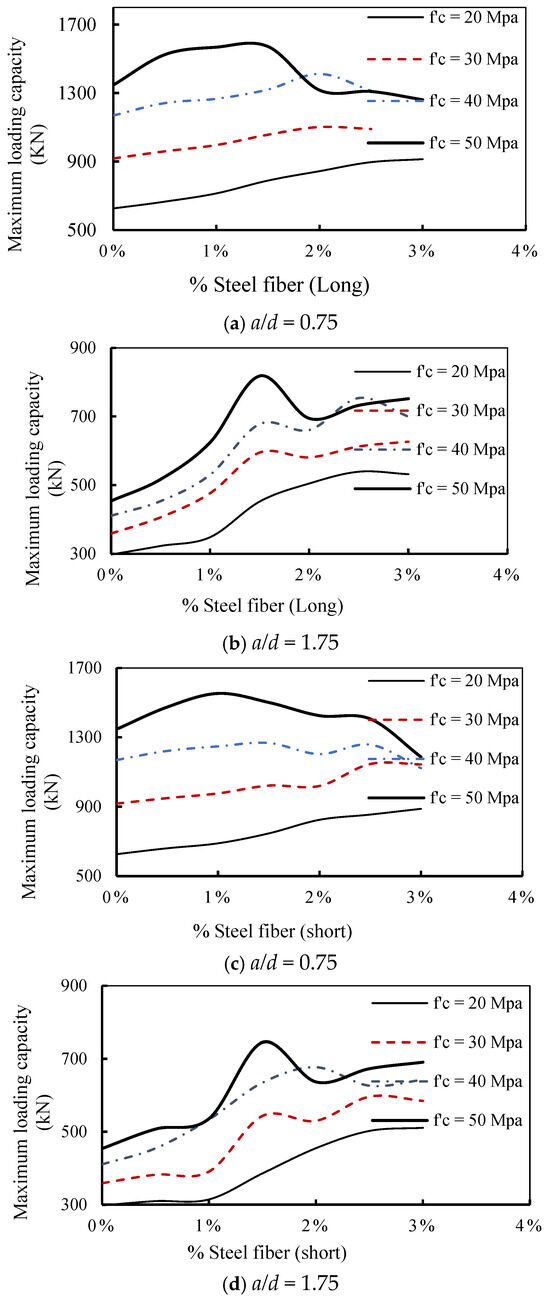
Figure 8.
The ultimate loading capacity for different concrete strengths and steel fiber percentages.
3.2.2. Effect of Fiber Type
The effect of short and long steel fibers on the shear performance of deep beams was verified. The numerical predictions reveal that the effect of steel fiber type depends on the shear span-to-effective depth ratio. The effect of steel fiber is insignificant when a low (a/d) ratio is utilized. However, as the (a/d) ratio increases, the effect of fiber type becomes more pronounced in terms of maximum loading capacity. Furthermore, the increase in the (a/d) ratio from 0.5 to 1.75 indicates the effect of fiber type and manifests the difference between short and long steel fibers on the shear strength. For a/d = 1.75, the numerical results reveal that long fibers are more effective than short fibers. For a/d = 0.5, the increase in maximum loading capacity is 22% for a 1.5 ratio of long fibers, whereas at a/d = 1.75, the same ratio results in an increase of 51.7%. This study is able to highlight the relationship between fiber type and concrete compressive strength. It has been found that the increase in concrete strength enhances the maximum loading capacity for the same fiber type, confirming the interaction between the type of steel fiber, a/d, and concrete compressive strength. The load–deflection relationship confirm that long steel fibers increase the central deflection corresponding to the maximum loading capacity compared to that of short steel fibers (Figure 8a,b). Thus, steel fiber type has a significant influence on the behavior of deep beams. These results follow the conclusion of the experimental results obtained by [12,14,15].
3.2.3. Effect of Concrete Strength
Generally, the behavior of deep beams is greatly influenced by concrete compressive strength, as it affects tensile strength, crack initiation, and crack propagation characteristics. In this particular study, the researchers assessed the effects of four concrete compressive strength values (20, 30, 40, and 50 MPa) on shear behavior. When considering deep beams without steel fibers, it was observed that the maximum loading capacity of the beam increases with higher concrete compressive strength. Steel fibers in concrete span micro-cracks, effectively controlling the spread of cracks and widening of cracks under applied stresses. This mechanism significantly increases the ability of the beam to support applied loads. However, this increase comes at the expense of reduced beam ductility. Conversely, for beams with varying ratios of steel fibers, a proportional relationship is noted between concrete compressive strength and maximum loading capacity. Additionally, within the same steel fiber ratio, the increase in maximum loading capacity is more prominent with higher concrete strength. This can be attributed to the fact that higher concrete compressive strength enhances the bond between concrete and steel fibers. It is of interest to mention that the numerical predictions show that the effect of concrete strength on the maximum loading capacity vanishes when the values of shear span-to-effective depth is ≤1.0.
3.2.4. Effect of Fiber Volume Ratio
The numerical model was prepared to study the influence of steel fiber volume ratio on the shear behavior of deep beams. Steel fiber ratios were examined between 0.5% and 3%, with increments of 0.5%. Overall, the augmentation of the steel fiber volume ratio results in an amplified maximum loading capacity by delaying the formation and subsequent propagation of inclined cracks. Increasing the fiber content leads to higher values of maximum loading capacity and postpones the formation of cracking. This increase improves shear and tension resistance of the concrete due to the inclusion of fibers. As the steel fiber volume ratio increases from 0.5% to 1.5%, the maximum loading capacity exhibits an average increase of 50%. The measured central deflections demonstrate that beams with higher fiber volume experience less deformation due to the bridging and crack-arrest capabilities of steel fibers within the brittle concrete. Moreover, the increase in fiber volume ratio in concrete improves ductility and energy absorption capability. However, the numerical predictions confirm the fact that there is a threshold for the increase in fiber volume ratio. The proportional increase between maximum loading capacity and fiber volume ratio depends on the a/d ratio and the fiber type. For long fibers, the optimum ranges between 2.0 and 2.5%, whereas for short fibers, the optimum is between 1.5 and 2.0%. Beyond these values, maximum loading capacity decreases with increasing fiber volume ratio.
This study investigates the fiber volume ratio relative to steel fiber type (long or short). At low values of the shear span-to-effective depth ratio (a/d ≤ 1.0), the maximum loading capacity increases with the increase in steel fiber volume ratio for both fiber types. The increase in the shear span-to-effective depth ratio (a/d > 1.0) reveals the difference between the two fiber types, where long steel fibers produce a higher increase in maximum loading capacity compared to short ones. For the same type and volume ratio of steel fibers, the gain in maximum loading capacity is proportional to the concrete compressive strength. It is observed that steel fibers act as closely spaced and randomly distributed steel stirrups, causing an increased number of hair cracks, which are preferable than a few wider cracks.
The reduction in the damage of concrete leads to an increase in the overall strength of beams. The central deflection corresponding to the maximum loading capacity demonstrates that deep beams with long steel fibers experience less deformation compared to short fibers. It is found that steel fibers have the potential to serve as a replacement for traditional steel stirrups, acting as effective shear reinforcement in deep beams. The results obtained herein are identical to those experimentally reported by Shah and Mishra [15].
3.3. Optimization of Parameters
In order to obtain an appropriate design that offers improved practicality and realism for steel fiber-reinforced deep beams, this study attempts to propose an optimization of the various parameters considered. Experimental test methods struggle to achieve cost-effective designs due to the large number of testing trials of beam dimensions and aspect ratios that may be beyond the project budget. To address this issue, a three-dimensional graph was constructed to analyze the relationship between multiple parameters and the maximum loading capacity. A number of figures are prepared to establish a meaningful correlation among the parameters investigated in this study. These relationships hold valuable insights for engineers in their practical design endeavors.
Figure 9a,b illustrate the relationship between the maximum loading capacity, fiber volume ratio, and shear span-to-effective depth ratio for long and short steel fibers. In general, the optimal fiber volume and a/d ratio are about 1.5% and 1, respectively. However, these optimized ratios are characterized by lower ductility and a sudden rupture ratio. The diagrams identify the same a/d ratio for both types of fibers (short and long). In this study, the optimal concrete compressive strength is also investigated. In general, deep beams tend to have larger loading capacity as concrete compressive strength increases. Based on the interaction with other parameters, it has been found that 50 MPa is the concrete strength required to obtain the highest loading capacity. Similarly, an increase in the fiber volume ratio results in an increase in the maximum loading capacity. The objective of optimization is to maximize the loading capacity while meeting ductility requirements with a lower fiber volume ratio and concrete compressive strength. In this study, the authors attempted to set the fiber volume ratio to its lower bound, while the concrete compressive strength is set to its upper bound. Based on the numerical predictions, the optimal fiber volume is different based on the type of steel fiber. For long steel fibers, 2% is found to be the optimum fiber volume ratio, whereas 1.5% is the one obtained for short fibers.
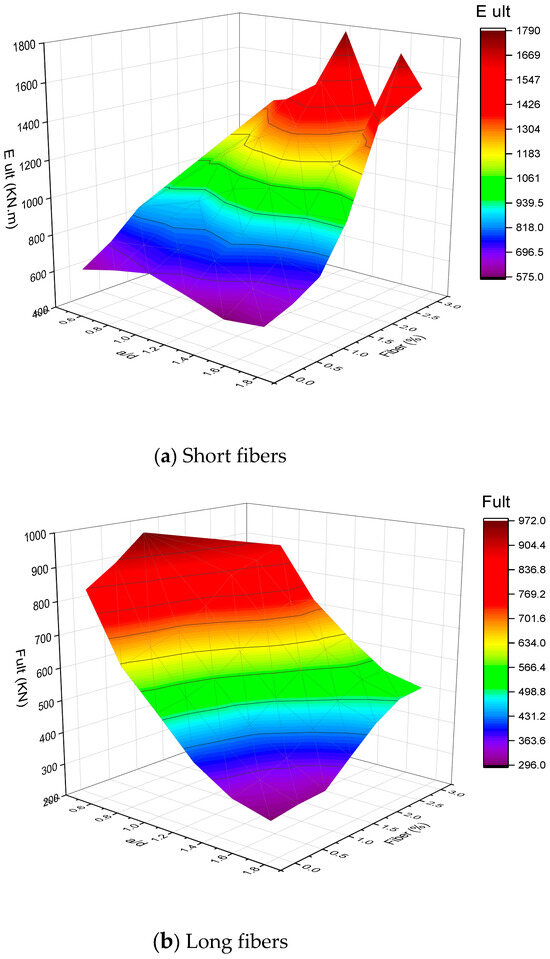
Figure 9.
Relationship between ultimate loading capacity (Fult), shear span-to-effective depth ratio (a/d), and steel fiber ratio.
3.4. Fracture Energy
In the current study, the behavior of steel fiber-reinforced concrete deep beams after reaching the maximum loading capacity is described by fracture energy, which also signifies the additional resistance exhibited along the descending branch of the load–deflection curve. The ductility increases as a consequence of the bond capacity. The fracture energy (E) for a monotonically increasing load (P) with displacement (u) can be obtained as follows:
where α represents the fracture energy coefficient. This study calculated the fracture energy of each beam for each suggested parameter. The numerical results reveal that the incorporation of steel fibers in the concrete leads to improve crack control and enhances the shear strength and deformation properties of deep beams. The ductility of deep beams is known to be influenced by the shear span-to-depth ratios, fiber volume ratios, and concrete compressive strength. A reduction in the a/d ratio in the deep beams enhances their maximum loading capacity but results in a more brittle failure mode.
E = αPu
The load–deflection relationship of deep beams can be divided into the following stages (Table A1): (a) Maximum stage: This stage occurs when the applied load reaches its maximum loading capacity. In this stage, the energy calculated is called ‘maximum energy Emax’ or ‘ultimate energy E1’. (b) Descending stage: This stage initiates when the beam cannot undergo further applied load, and the loading capacity starts to decrease [51]. At this stage, the applied load is resisted by the uncracked regions of the beam, where the anchorage between concrete and steel fibers plays an essential role in the ductility of deep beams. The ultimate energy (Eult) is the term that represents the full area under the load–deflection curve.
Overall, the failure progress of the structural members is typically characterized by their behavior beyond the maximum applied load. In this analysis, the fracture energy (E2) is taken to track the failure progress and resistance in deep beams (Figure 10). Results for fracture energy under different shear span-to-effective depth ratios, fiber volume ratios, and fiber types are provided in Figure 11a,b. It can be observed that the fracture energy is dependent on the shear span-to-effective depth ratio, where an increase in this ratio decreases the fracture energy of steel fiber-reinforced concrete deep beams. Furthermore, an increase in concrete compressive strength enlarges the deflection and improves the fracture energy of beams. The figures show an important finding, which is the relationship between the fiber volume ratio, a/d ratio, and the fracture energy. When a/d ≤ 1.0, the fracture energy increases up to a fiber volume ratio of 1.5%. The fracture energy remains almost steady regardless of further increases in the fiber volume ratio. Figure 11 shows that there is no significant difference between long and short fibers in enhancing fracture energy.
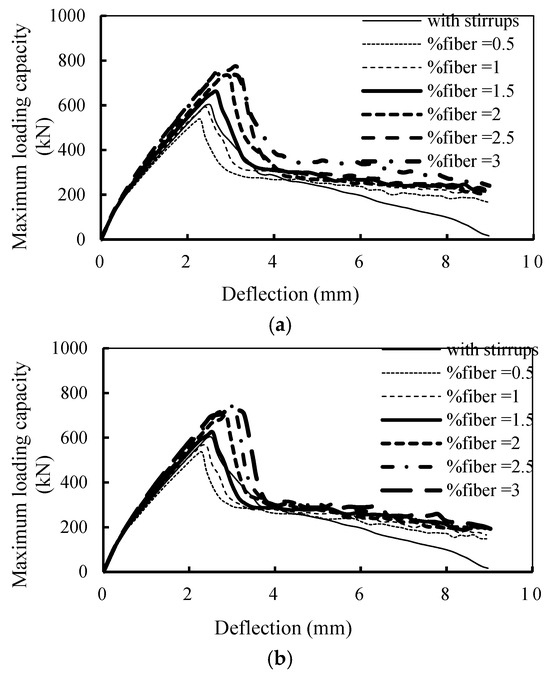
Figure 10.
Numerical load–deflection relationships for a/d = 1.0: (a) long fibers and (b) short fibers.
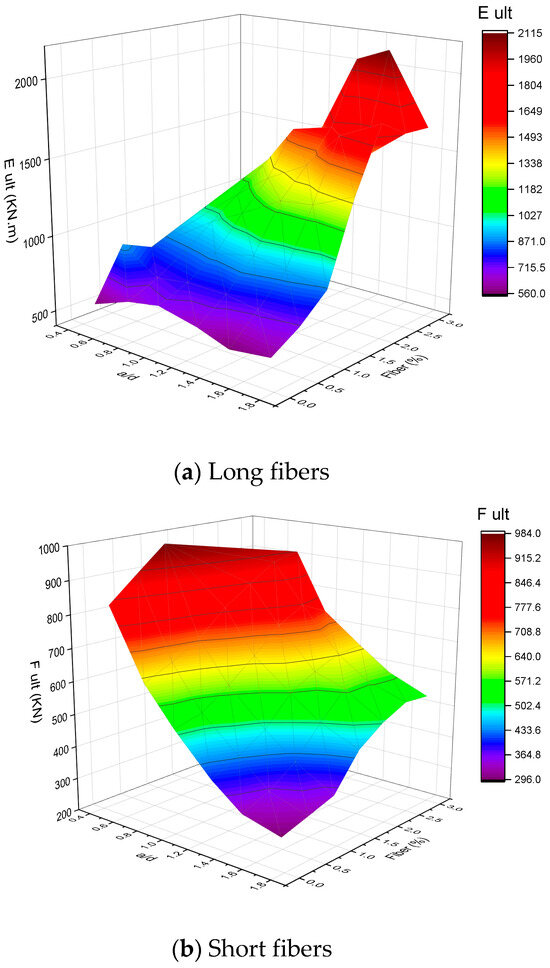
Figure 11.
Relation between fracture energy, shear span-to-effective depth ratio (a/d), and steel fiber ratio.
4. Conclusions
In this study, a nonlinear three-dimensional finite element model was created using the VecTor2 software. The main aim of this study was to establish a computationally efficient finite element model for analyzing deep beams made of steel fiber-reinforced recycled aggregate concrete. Appropriate material and structural models were employed to simulate the behavior of concrete, steel reinforcement, and loading plates. The material modeling of concrete was the most crucial part in simulation, because the inclusion of steel fibers in the concrete should be correctly considered. The numerical predictions were compared with experimental results in terms of failure modes, maximum loading capacities, and load–deflection relationships. Based on the accuracy obtained between numerical predictions and experimental results, a comprehensive numerical study was carried out to investigate the parameters having a major influence on the shear strength of steel fiber-reinforced concrete deep beams. The parameters examined were shear span-to-depth ratio (a/d), steel fiber volume content, concrete compressive strength, and type of steel fibers. The numerical predictions examined the influence of these parameters in terms of maximum loading-carrying capacity, load–deflection relationships, failure modes, and fracture energy. Furthermore, an optimization study was conducted to assess the optimized design of steel fiber-reinforced concrete deep beams. From the results of this study, the following conclusions can be proposed:
- The numerical predictions demonstrate a very good correlation with the experimental findings in terms of maximum loading capacity and load–deflection relationship. Additionally, the simulated cracking patterns and failure modes match the experimental results observed for the various considered deep beams.
- Reducing the shear span-to-effective depth ratio (a/d) increases the maximum loading capacity, stiffness of the load–deflection relationship, and the load values corresponding to the first diagonal shear crack. However, it decreases the central deflection corresponding to the maximum loading capacity and ductility.
- Increasing the fiber volume ratio of steel fibers increases the maximum loading capacity, central deflection at maximum load, ductility, and delayed the occurrence of the first diagonal shear. However, further increase in the fiber volume ratio decreases the concrete workability. Optimal fiber volume ratios are 2.0% for long steel fibers and 1.5% for short steel fibers. Once this limit is attained, additional increases in the fiber volume ratio no longer contribute to an increase in the shear behavior of the beams.
- An increase in the concrete compressive strength results in an improvement in the maximum loading capacity, the stiffness of the load–deflection relationship, and the ductility at failure.
- No significant difference is observed between the long and short steel fibers for low values of shear span-to-effective depth ratio (a/d ≤ 1.0). It is necessary to mention that the inclusion of steel fibers showed a notable enhancement in the shear strength and ductility of concrete beams with no shear steel reinforcement.
- The results of this study boost sustainability since it allows designers to select the ideal fiber dose and RCA replacement levels for certain design loads in order to balance ductility, strength, and cost. The practical application of this study includes the post-cracking behavior, which increases safety margins by allowing the structure to withstand load redistribution following initial cracking. In addition, it assists in locating possible areas of shear failure, enabling a reduction in stirrup reinforcement.
Author Contributions
Conceptualization, S.E., M.S. and A.G.; methodology, S.E., M.S. and A.G.; software, S.E. and M.S.; validation, S.E., M.S. and A.G.; formal analysis, S.E., M.S. and A.G.; investigation, S.E., M.S. and A.G.; resources, S.E., M.S. and A.G.; writing—original draft preparation, S.E. and A.G.; writing—review and editing, S.E. and A.G.; visualization, S.E., M.S. and A.G.; supervision, S.E. and A.G.; project administration, A.G.; funding acquisition, A.G. All authors have read and agreed to the published version of the manuscript.
Funding
The APC was funded by the Deanship of Research and Graduate Studies at Ajman University.
Data Availability Statement
All data, models, and code generated or used during the study appear in the submitted article.
Acknowledgments
The authors thank the Deanship of Research and Graduate Studies at Ajman University for supporting the article processing charges.
Conflicts of Interest
The authors declare no conflict of interest. The funders had no role in the design of the study; in the collection, analyses, or interpretation of data; in the writing of the manuscript; or in the decision to publish the results.
Appendix A
Table A1.
Numerical predictions for various parameters affecting the shear behavior.
Table A1.
Numerical predictions for various parameters affecting the shear behavior.
| No. | a/d | fc′ (MPa) | Types of Steel Fibers | Ratio of Steel Fibers (%) | Presence of Steel Stirrups | Maximum Loading Capacity (kN) | Maximum Deflection (mm) | Maximum Energy (E1) (kN.mm) | Ultimate Energy (E2) (kN.mm) |
|---|---|---|---|---|---|---|---|---|---|
| 1. | 0.5 | 20 | – | – | Yes | 833 | 1.1 | 604 | 1893 |
| 2. | – | – | No | 803 | 1.0 | 634 | 232 | ||
| 3. | Long | 0.5 | 833 | 1.2 | 564 | 1872 | |||
| 4. | 1.0 | 909 | 1.3 | 899 | 3052 | ||||
| 5. | 1.5 | 982 | 1.3 | 815 | 3146 | ||||
| 6. | 0.75 | 20 | – | – | Yes | 673 | 1.8 | 741 | 2514 |
| 7. | – | – | No | 627 | 1.7 | 655 | 1543 | ||
| 8. | Long | 0.5 | 666 | 1.8 | 741 | 2654 | |||
| 9. | 1.0 | 714 | 1.9 | 2848 | 854 | ||||
| 10. | 1.5 | 789 | 2.1 | 990 | 3045 | ||||
| 11. | 2.0 | 844 | 2.2 | 1121 | 3226 | ||||
| 12. | 2.5 | 897 | 2.3 | 1264 | 3264 | ||||
| 13. | 3.0 | 914 | 2.3 | 1358 | 3344 | ||||
| 14. | 0.75 | 30 | Long | 0 | No | 918 | 2.4 | 1302 | 2267 |
| 15. | 0.5 | 960 | 2.5 | 1429 | 3974 | ||||
| 16. | 1.0 | 996 | 2.5 | 1488 | 4124 | ||||
| 17. | 1.5 | 1057 | 2.8 | 1813 | 4436 | ||||
| 18. | 2.0 | 1102 | 2.9 | 1937 | 4642 | ||||
| 19. | 2.5 | 1091 | 3.0 | 2154 | 4561 | ||||
| 21. | 0.75 | 40 | Long | 0 | No | 1169 | 3.0 | 2122 | 3067 |
| 22. | 0.5 | 1242 | 3.2 | 2442 | 5448 | ||||
| 23. | 1.0 | 1267 | 3.3 | 2411 | 5432 | ||||
| 24. | 1.5 | 1321 | 3.5 | 2853 | 5884 | ||||
| 25. | 2.0 | 1412 | 3.7 | 3216 | 6164 | ||||
| 26. | 2.5 | 1313 | 3.6 | 3343 | 7628 | ||||
| 28. | 0.75 | 50 | Long | 0 | No | 1347 | 3.5 | 2894 | 4171 |
| 29. | 0.5 | 1525 | 4.0 | 3444 | 6673 | ||||
| 30. | 1.0 | 1569 | 3.9 | 3699 | 7022 | ||||
| 31. | 1.5 | 1572 | 4.1 | 3983 | 7424 | ||||
| 32. | 2.0 | 1317 | 4.3 | 3013 | 8904 | ||||
| 33. | 2.5 | 1309 | 4.4 | 4496 | 7883 | ||||
| 34. | 3.0 | 1261 | 4.5 | 2574 | 10,494 | ||||
| 35. | 1.0 | 20 | Long | – | Yes | 600 | 2.4 | 884 | 2278 |
| 36. | – | No | 515 | 2.2 | 694 | 1217 | |||
| 37. | 0.5 | 536 | 2.3 | 772 | 2362 | ||||
| 38. | 1.0 | 593 | 2.4 | 894 | 2638 | ||||
| 39. | 1.5 | 659 | 2.7 | 1099 | 2839 | ||||
| 40. | 2.0 | 731 | 2.8 | 1278 | 2959 | ||||
| 41. | 2.5 | 775 | 3.1 | 1563 | 3193 | ||||
| 42. | 3.0 | 738 | 3.2 | 1457 | 3480 | ||||
| 43. | 1.0 | 30 | – | – | No | 718 | 2.9 | 1251 | 1961 |
| 44. | Long | 0.5 | 748 | 3.1 | 1371 | 3358 | |||
| 45. | 1.0 | 795 | 3.2 | 1548 | 3656 | ||||
| 46. | 1.5 | 897 | 3.6 | 1954 | 4210 | ||||
| 47. | 2.0 | 965 | 3.9 | 2339 | 4415 | ||||
| 48. | 2.5 | 977 | 4.2 | 2717 | 4876 | ||||
| 49. | 3.0 | 926 | 4.1 | 2579 | 4558 | ||||
| 50. | 1.0 | 40 | – | – | No | 879 | 3.6 | 1886 | 2503 |
| 51. | Long | 0.5 | 949 | 3.8 | 2134 | 4471 | |||
| 52. | 1.0 | 975 | 4.1 | 2303 | 4845 | ||||
| 53. | 1.5 | 990 | 4.3 | 2467 | 5350 | ||||
| 54. | 2.0 | 1104 | 4.5 | 3887 | 3619 | ||||
| 55. | 2.5 | 1050 | 4.6 | 2619 | 5363 | ||||
| 56. | 3.0 | 1070 | 4.6 | 3887 | 6374 | ||||
| 57. | 1.0 | 50 | – | – | No | 985 | 4.1 | 2474 | 3006 |
| 58. | Long | 0.5 | 1128 | 4.6 | 3061 | 5507 | |||
| 59. | 1.0 | 1160 | 4.8 | 3372 | 6283 | ||||
| 60. | 1.5 | 1248 | 4.8 | 3639 | 6420 | ||||
| 61. | 2.0 | 1061 | 3.3 | 2857 | 8404 | ||||
| 62. | 2.5 | 1034 | 3.3 | 2271 | 6899 | ||||
| 63. | 3.0 | 1046 | 3.2 | 4617 | 9142 | ||||
| 64. | 1.25 | 20 | – | – | Yes | 590 | 3.7 | 1280 | 2565 |
| 65. | – | – | No | 399 | 2.5 | 639 | 1072 | ||
| 66. | Long | 0.5 | 438 | 2.8 | 770 | 2088 | |||
| 67. | 1.0 | 487 | 3.1 | 951 | 2432 | ||||
| 68. | 1.5 | 570 | 3.3 | 1243 | 2817 | ||||
| 69. | 2.0 | 611 | 3.5 | 1418 | 2912 | ||||
| 70. | 2.5 | 643 | 4.1 | 1620 | 2953 | ||||
| 71. | 3.0 | 629 | 3.9 | 2027 | 3368 | ||||
| 72. | 1.25 | 30 | – | – | No | 514 | 3.2 | 1019 | 1523 |
| 73. | Long | 0.5 | 556 | 3.5 | 1186 | 2860 | |||
| 74. | 1.0 | 599 | 3.7 | 1401 | 3233 | ||||
| 75. | 1.5 | 707 | 4.1 | 1792 | 3756 | ||||
| 76. | 2.0 | 719 | 4.5 | 2134 | 3941 | ||||
| 77. | 2.5 | 773 | 5.2 | 2887 | 4278 | ||||
| 78. | 3.0 | 711 | 3.5 | 2655 | 4362 | ||||
| 79. | 1.25 | 40 | – | – | No | 559 | 3.5 | 1244 | 1657 |
| 80. | Long | 0.5 | 650 | 3.9 | 1556 | 3611 | |||
| 81. | 1.0 | 744 | 4.6 | 2183 | 4324 | ||||
| 82. | 1.5 | 856 | 5.1 | 5437 | 4784 | ||||
| 83. | 2.0 | 794 | 6.3 | 2337 | 5437 | ||||
| 84. | 2.5 | 817 | 3.9 | 2240 | 6590 | ||||
| 85. | 3.0 | 811 | 3.8 | 2658 | 5920 | ||||
| 86. | 1.25 | 50 | – | – | No | 655 | 4.6 | 2048 | 2708 |
| 87. | Long | 0.5 | 743 | 5.0 | 2457 | 4530 | |||
| 88. | 1.0 | 855 | 5.5 | 3137 | 5371 | ||||
| 89. | 1.5 | 990 | 5.9 | 3653 | 5933 | ||||
| 90. | 2.0 | 992 | 5.2 | 4330 | 8902 | ||||
| 91. | 2.5 | 885 | 4.3 | 3592 | 9040 | ||||
| 92. | 3.0 | 880 | 3.9 | 2232 | 8278 | ||||
| 93. | 1.5 | 20 | – | – | Yes | 579 | 4.7 | 1595 | 2540 |
| 94. | – | – | No | 328 | 2.7 | 568 | 1027 | ||
| 95. | Long | 0.5 | 360 | 3.1 | 735 | 1867 | |||
| 96. | 1.0 | 415 | 3.4 | 915 | 2203 | ||||
| 97. | 1.5 | 502 | 4.0 | 1263 | 2637 | ||||
| 98. | 2.0 | 578 | 4.6 | 1648 | 2796 | ||||
| 99. | 2.5 | 580 | 4.1 | 1457 | 3193 | ||||
| 100. | 3.0 | 582 | 5.1 | 2115 | 2797 | ||||
| 1.5 | 30 | – | – | Yes | 714 | 5.5 | 2301 | 3836 | |
| 101. | – | – | No | 412 | 3.2 | 830 | 1358 | ||
| 102. | Long | 0.5 | 431 | 3.5 | 956 | 2490 | |||
| 103. | 1.0 | 496 | 4.1 | 1321 | 2860 | ||||
| 104. | 1.5 | 584 | 4.7 | 1800 | 3556 | ||||
| 105. | 2.0 | 720 | 5.7 | 2628 | 4349 | ||||
| 106. | 2.5 | 648 | 6.1 | 2143 | 4986 | ||||
| 107. | 3.0 | 664 | 4.2 | 1955 | 5365 | ||||
| 108. | 1.5 | 40 | – | – | No | 470 | 3.5 | 1037 | 1717 |
| 109. | Long | 0.5 | 491 | 4.1 | 1365 | 3144 | |||
| 110. | 1.0 | 581 | 4.9 | 1941 | 3841 | ||||
| 111. | 1.5 | 754 | 5.9 | 2810 | 4513 | ||||
| 112. | 2.0 | 835 | 6.6 | 3680 | 5524 | ||||
| 113. | 2.5 | 875 | 6.8 | 3873 | 5651 | ||||
| 114. | 3.0 | 753 | 4.5 | 2988 | 5685 | ||||
| 115. | 1.5 | 50 | – | – | No | 512 | 3.8 | 1258 | 1812 |
| 116. | Long | 0.5 | 554 | 4.8 | 1792 | 5384 | |||
| 117. | 1.0 | 700 | 5.9 | 3307 | 4625 | ||||
| 118. | 1.5 | 843 | 6.5 | 4686 | 8104 | ||||
| 119. | 2.0 | 885 | 6.8 | 3625 | 5414 | ||||
| 120. | 2.5 | 946 | 7.2 | 4805 | 9736 | ||||
| 121. | 3.0 | 806 | 4.7 | 2593 | 7289 | ||||
| 122. | 1.75 | 20 | – | – | Yes | 571 | 6.1 | 2022 | 2814 |
| 123. | – | – | No | 298 | 3.2 | 603 | 1088 | ||
| 124. | Long | 0.5 | 323 | 3.5 | 709 | 1742 | |||
| 125. | 1.0 | 349 | 3.8 | 863 | 1991 | ||||
| 127. | 1.5 | 452 | 4.8 | 1376 | 2404 | ||||
| 128. | 2.0 | 505 | 5.5 | 1772 | 2819 | ||||
| 129. | 2.5 | 539 | 5.0 | 1664 | 3171 | ||||
| 130. | 3.0 | 532 | 4.7 | 1656 | 2894 | ||||
| 131. | 1.75 | 30 | – | – | No | 359 | 3.6 | 819 | 1450 |
| 132. | Long | 0.5 | 406 | 4.3 | 1079 | 2301 | |||
| 133. | 1.0 | 477 | 5.1 | 1566 | 2791 | ||||
| 134. | 1.5 | 595 | 6.4 | 2379 | 3381 | ||||
| 135. | 2.0 | 581 | 5.0 | 1744 | 4133 | ||||
| 136. | 2.5 | 613 | 5.2 | 1876 | 5040 | ||||
| 137. | 3.0 | 627 | 5.2 | 2507 | 4813 | ||||
| 138. | 1.75 | 40 | – | – | No | 411 | 4.1 | 1065 | 1766 |
| 139. | Long | 0.5 | 454 | 4.6 | 1289 | 3273 | |||
| 140. | 1.0 | 531 | 5.3 | 1794 | 3332 | ||||
| 141. | 1.5 | 661 | 6.4 | 3000 | 5540 | ||||
| 142. | 2.0 | 678 | 7.0 | 2974 | 3888 | ||||
| 143. | 2.5 | 754 | 7.8 | 3819 | 6807 | ||||
| 144. | 3.0 | 700 | 5.5 | 2682 | 6436 | ||||
| 145. | 1.75 | 50 | – | – | No | 454 | 4.4 | 1299 | 1775 |
| 146. | Long | 0.5 | 517 | 5.3 | 1762 | 3990 | |||
| 147. | 1.0 | 625 | 6.1 | 2403 | 4151 | ||||
| 148. | 1.5 | 818 | 8.7 | 4904 | 5231 | ||||
| 149. | 2.0 | 752 | 5.5 | 2633 | 6673 | ||||
| 150. | 2.5 | 733 | 5.6 | 2472 | 6791 | ||||
| 151. | 3.0 | 694 | 5.6 | 2285 | 6567 | ||||
| 152. | 0.5 | 20 | – | – | Yes | 834 | 1.0 | 604 | 1884 |
| 153. | – | – | No | 834 | 1.0 | 604 | 1884 | ||
| 154. | Short | 0.5 | 895 | 1.1 | 707 | 3012 | |||
| 155. | 1.0 | 972 | 1.2 | 849 | 3279 | ||||
| 156. | 1.5 | 998 | 1.2 | 256 | 869 | ||||
| 157. | 0.75 | 20 | – | – | Yes | 673 | 1.7 | 740 | 2514 |
| 158. | – | – | No | 627 | 1.5 | 653 | 1543 | ||
| 159. | Short | 0.5 | 661 | 1.7 | 737 | 2563 | |||
| 160. | 1.0 | 689 | 1.8 | 844 | 2724 | ||||
| 161. | 1.5 | 746 | 1.8 | 885 | 2854 | ||||
| 162. | 2.0 | 825 | 2.0 | 1108 | 2906 | ||||
| 163. | 2.5 | 855 | 2.1 | 1180 | 3052 | ||||
| 164. | 3.0 | 888 | 2.2 | 1345 | 3209 | ||||
| 165. | 0.75 | 30 | – | – | No | 918 | 2.3 | 1302 | 2267 |
| 166. | Short | 0.5 | 949 | 2.4 | 1422 | 3791 | |||
| 167. | 1.0 | 977 | 2.4 | 1461 | 3974 | ||||
| 168. | 1.5 | 1020 | 2.5 | 1659 | 4221 | ||||
| 169. | 2.0 | 1022 | 2.6 | 1821 | 4255 | ||||
| 170. | 2.5 | 1146 | 2.9 | 2184 | 4548 | ||||
| 171. | 3.0 | 1144 | 2.8 | 2271 | 5388 | ||||
| 172. | 0.75 | 40 | – | – | No | 1169 | 2.9 | 2122 | 3067 |
| 173. | Short | 0.5 | 1222 | 3.0 | 2227 | 5077 | |||
| 174. | 1.0 | 1248 | 3.0 | 2279 | 5418 | ||||
| 175. | 1.5 | 1258 | 3.1 | 2893 | 6776 | ||||
| 176. | 2.0 | 1267 | 3.4 | 2359 | 5448 | ||||
| 177. | 2.5 | 1203 | 3.1 | 3031 | 7266 | ||||
| 178. | 3.0 | 1122 | 2.2 | 2426 | 6282 | ||||
| 179. | 0.75 | 50 | – | – | No | 1347 | 3.4 | 2894 | 4171 |
| 180. | Short | 0.5 | 1475 | 3.7 | 3202 | 6481 | |||
| 181. | 1.0 | 1553 | 4.1 | 3651 | 6952 | ||||
| 182. | 1.5 | 1501 | 4.0 | 3939 | 7429 | ||||
| 183. | 2.0 | 1425 | 3.8 | 3700 | 8285 | ||||
| 184. | 2.5 | 1406 | 3.7 | 4962 | 8887 | ||||
| 185. | 3.0 | 1187 | 2.2 | 2275 | 8847 | ||||
| 186. | 1.0 | 20 | – | – | Yes | 600 | 2.3 | 884 | 2278 |
| 187. | – | – | No | 515 | 2.0 | 694 | 1270 | ||
| 188. | Short | 0.5 | 534 | 2.2 | 768 | 2290 | |||
| 189. | 1.0 | 567 | 2.2 | 813 | 2474 | ||||
| 190. | 1.5 | 623 | 2.4 | 998 | 2671 | ||||
| 191. | 2.0 | 698 | 2.7 | 1238 | 2800 | ||||
| 192. | 2.5 | 740 | 2.9 | 1412 | 3008 | ||||
| 193. | 3.0 | 727 | 2.7 | 1393 | 3161 | ||||
| 194. | 1.0 | 30 | – | – | No | 718 | 2.8 | 1251 | 1961 |
| 195. | Short | 0.5 | 749 | 2.9 | 1373 | 3300 | |||
| 196. | 1.0 | 764 | 2.9 | 1415 | 3526 | ||||
| 197. | 1.5 | 823 | 3.3 | 1743 | 3718 | ||||
| 198. | 2.0 | 856 | 3.3 | 1892 | 3975 | ||||
| 199. | 2.5 | 916 | 3.7 | 2293 | 4232 | ||||
| 200. | 3.0 | 859 | 3.5 | 2222 | 4276 | ||||
| 201. | 1.0 | 40 | – | – | No | 879 | 3.4 | 1886 | 2503 |
| 202. | Short | 0.5 | 941 | 3.5 | 2128 | 4623 | |||
| 203. | 1.0 | 949 | 3.7 | 2164 | 4537 | ||||
| 204. | 1.5 | 979 | 4.3 | 2382 | 5043 | ||||
| 205. | 2.0 | 978 | 4.0 | 2843 | 5723 | ||||
| 206. | 2.5 | 959 | 3.8 | 3080 | 5609 | ||||
| 207. | 3.0 | 904 | 2.7 | 1953 | 5996 | ||||
| 208. | 1.0 | 50 | – | – | No | 985 | 3.9 | 2474 | 3006 |
| 209. | Short | 0.5 | 992 | 4.3 | 2934 | 9873 | |||
| 210. | 1.0 | 1082 | 4.4 | 2851 | 5463 | ||||
| 211. | 1.5 | 1119 | 5.5 | 3182 | 5979 | ||||
| 212. | 2.0 | 1117 | 4.4 | 3329 | 6523 | ||||
| 213. | 2.5 | 1042 | 3.0 | 4371 | 7145 | ||||
| 214. | 3.0 | 990 | 2.8 | 2839 | 7200 | ||||
| 215. | 1.25 | 20 | – | – | Yes | 590 | 3.5 | 1280 | 2565 |
| 216. | – | – | No | 399 | 2.4 | 639 | 1072 | ||
| 217. | Short | 0.5 | 427 | 2.7 | 762 | 1979 | |||
| 218. | 1.0 | 450 | 2.8 | 855 | 2204 | ||||
| 219 | 1.5 | 507 | 3.1 | 1048 | 2536 | ||||
| 220. | 2.0 | 567 | 3.5 | 1341 | 2705 | ||||
| 221. | 2.5 | 607 | 3.6 | 1542 | 2923 | ||||
| 222. | 3.0 | 626 | 4.1 | 1789 | 2973 | ||||
| 223. | 1.25 | 30 | – | – | No | 514 | 3.0 | 1019 | 1523 |
| 224. | Short | 0.5 | 537 | 3.1 | 1086 | 2819 | |||
| 225. | 1.0 | 573 | 3.4 | 1299 | 2989 | ||||
| 226. | 1.5 | 639 | 4.0 | 1699 | 3461 | ||||
| 227. | 2.0 | 670 | 4.2 | 1954 | 3790 | ||||
| 228. | 2.5 | 691 | 4.6 | 2311 | 4227 | ||||
| 229. | 3.0 | 737 | 5.0 | 2590 | 4320 | ||||
| 230. | 1.25 | 40 | – | – | No | 559 | 3.3 | 1244 | 1657 |
| 231. | Short | 0.5 | 650 | 3.9 | 1634 | 3558 | |||
| 232. | 1.0 | 714 | 4.2 | 1958 | 4112 | ||||
| 233. | 1.5 | 774 | 4.6 | 2341 | 4462 | ||||
| 234. | 2.0 | 798 | 5.7 | 3192 | 4936 | ||||
| 235. | 2.5 | 772 | 3.5 | 2183 | 6418 | ||||
| 236. | 3.0 | 755 | 3.5 | 1831 | 5492 | ||||
| 237. | 1.25 | 50 | – | – | No | 655 | 4.4 | 2048 | 2708 |
| 238. | Short | 0.5 | 728 | 4.5 | 2102 | 4345 | |||
| 239. | 1.0 | 800 | 5.1 | 2729 | 4987 | ||||
| 240. | 1.5 | 828 | 5.4 | 3089 | 5553 | ||||
| 241. | 2.0 | 1028 | 5.7 | 4586 | 7792 | ||||
| 242. | 2.5 | 827 | 4.6 | 4233 | 8361 | ||||
| 243. | 3.0 | 822 | 3.6 | 2035 | 9072 | ||||
| 244. | 1.5 | 20 | – | – | Yes | 579 | 4.6 | 1595 | 2540 |
| 245. | – | – | No | 328 | 2.5 | 576 | 1024 | ||
| 246. | Short | 0.5 | 347 | 2.8 | 675 | 1727 | |||
| 247. | 1.0 | 379 | 3.0 | 774 | 2017 | ||||
| 248. | 1.5 | 437 | 3.3 | 958 | 2260 | ||||
| 249. | 2.0 | 495 | 3.5 | 1156 | 2555 | ||||
| 250. | 2.5 | 537 | 3.7 | 1251 | 2656 | ||||
| 260. | 3.0 | 541 | 3.6 | 1321 | 2831 | ||||
| 261. | 1.5 | 30 | – | – | Yes | 714 | 5.3 | 2301 | 3836 |
| – | – | No | 412 | 3.0 | 830 | 1358 | |||
| 262. | Short | 0.5 | 425 | 3.3 | 938 | 2371 | |||
| 263. | 1.0 | 472 | 4.0 | 1298 | 2771 | ||||
| 264. | 1.5 | 535 | 4.4 | 1624 | 3216 | ||||
| 265. | 2.0 | 613 | 4.8 | 2021 | 3955 | ||||
| 266. | 2.5 | 662 | 5.3 | 2404 | 4146 | ||||
| 267. | 3.0 | 644 | 5.8 | 2835 | 4184 | ||||
| 268. | 1.5 | 40 | – | – | No | 470 | 3.3 | 1037 | 1717 |
| 269. | Short | 0.5 | 487 | 3.8 | 1254 | 3142 | |||
| 270. | 1.0 | 550 | 4.6 | 1701 | 3581 | ||||
| 271. | 1.5 | 618 | 4.9 | 1904 | 3982 | ||||
| 272. | 2.0 | 750 | 5.6 | 3041 | 5174 | ||||
| 273. | 2.5 | 697 | 6.9 | 3691 | 5499 | ||||
| 274. | 3.0 | 702 | 4.5 | 2577 | 6437 | ||||
| 275. | 1.5 | 50 | – | – | No | 512 | 3.6 | 1258 | 1812 |
| 276. | Short | 0.5 | 555 | 4.2 | 1554 | 3585 | |||
| 277. | 1.0 | 641 | 4.7 | 2106 | 4428 | ||||
| 278. | 1.5 | 697 | 5.2 | 2483 | 5120 | ||||
| 279. | 2.0 | 768 | 5.3 | 2815 | 6043 | ||||
| 280. | 2.5 | 899 | 6.7 | 5495 | 9538 | ||||
| 281. | 3.0 | 739 | 4.3 | 2167 | 7421 | ||||
| 282. | 1.75 | 20 | – | – | Yes | 571 | 5.9 | 2022 | 2814 |
| 283. | – | – | No | 298 | 3.0 | 603 | 1088 | ||
| 284. | Short | 0.5 | 310 | 3.2 | 654 | 1554 | |||
| 285. | 1.0 | 344 | 3.3 | 736 | 1807 | ||||
| 286. | 1.5 | 386 | 3.7 | 969 | 2149 | ||||
| 287. | 2.0 | 455 | 4.5 | 1345 | 2372 | ||||
| 288. | 2.5 | 503 | 5.2 | 1749 | 2617 | ||||
| 289. | 3.0 | 511 | 4.4 | 1537 | 3677 | ||||
| 290. | 1.75 | 30 | – | – | No | 359 | 3.5 | 819 | 1450 |
| 291. | Short | 0.5 | 382 | 3.8 | 943 | 2186 | |||
| 292. | 1.0 | 391 | 3.9 | 1077 | 2434 | ||||
| 293. | 1.5 | 530 | 5.0 | 1465 | 3501 | ||||
| 294. | 2.0 | 544 | 5.8 | 2050 | 3009 | ||||
| 295. | 2.5 | 596 | 6.0 | 2346 | 3695 | ||||
| 296. | 3.0 | 585 | 5.9 | 2405 | 5309 | ||||
| 297. | 1.75 | 40 | – | – | No | 411 | 3.9 | 1065 | 1766 |
| 298. | Short | 0.5 | 455 | 4.7 | 1408 | 2589 | |||
| 299. | 1.0 | 534 | 5.5 | 1930 | 3189 | ||||
| 300. | 1.5 | 635 | 6.5 | 2689 | 3579 | ||||
| 301. | 2.0 | 677 | 7.3 | 3317 | 5783 | ||||
| 302. | 2.5 | 643 | 4.9 | 1959 | 5677 | ||||
| 303. | 3.0 | 626 | 4.9 | 1893 | 5581 | ||||
| 304. | 1.75 | 50 | – | – | No | 454 | 4.2 | 1299 | 1775 |
| 305. | Short | 0.5 | 508 | 5.3 | 1763 | 3211 | |||
| 306. | 1.0 | 536 | 5.4 | 2002 | 4829 | ||||
| 307. | 1.5 | 745 | 7.7 | 3987 | 4740 | ||||
| 308. | 2.0 | 690 | 5.2 | 2253 | 6435 | ||||
| 309. | 2.5 | 673 | 5.0 | 2351 | 6907 | ||||
| 310. | 3.0 | 637 | 4.9 | 1942 | 6522 |
References
- ACI Committee 318M-11. Building Code Requirements for Structural Concrete (ACI 318M-11); American Concrete Institute: Detroit, MI, USA; Farmington Hills, MI, USA, 2011; pp. 320–324. [Google Scholar]
- Wight, J.K. Reinforced Concrete: Mechanics and Design, 8th ed.; Pearson: Hoboken, NJ, USA, 2022. [Google Scholar]
- El-Hassan, H.; Elkholy, S. Enhancing the performance of Alkali-Activated Slag-Fly ash blended concrete through hybrid steel fiber reinforcement. Constr. Build. Mater. 2021, 311, 125313. [Google Scholar] [CrossRef]
- El-Hassan, H.; Elkholy, S. Performance Evaluation and Microstructure Characterization of Steel Fiber–Reinforced Alkali-Activated Slag Concrete Incorporating Fly Ash. J. Mater. Civ. Eng. 2019, 31, 04019223. [Google Scholar] [CrossRef]
- Balaguru, P.; Shah, S. Fiber Reinforced Cement Composites; McGraw Hill, Inc.: New York, NY, USA, 1992; pp. 17–38. [Google Scholar]
- ACI Committee 554. State-of-the-art report on fiber reinforced concrete. In Manual of Concrete Practice; Fiber Reinforced Concrete, ACI Committee 544, ACI 544-IR96: Farmington Hills, MI, USA, 2002. [Google Scholar]
- Ramakrishnan, V.; Gollapudi, S.; Iller, R. Performance characteristics and fatigue strength of polypropylene fiber reinforced concrete. In ACI, SP-105; American Concrete Institute (ACI): Farmington Hills, MI, USA, 1987; pp. 159–177. [Google Scholar]
- Costa, A.T.; Figueiredo, A.D.; Monte, R.; Bitencourt, L., Jr. Steel fiber reinforced recycled aggregate concrete as a structural material: Properties and applications. Structures 2025, 71, 108068. [Google Scholar] [CrossRef]
- Gao, D.; Zhang, W.; Gu, Z.; Hu, Y.; Yang, Z.; Yang, L. Investigation on shear performance of steel fiber reinforced recycled concrete short/deep beams. Constr. Build. Mater. 2025, 497, 143873. [Google Scholar] [CrossRef]
- Sheikh, N.A.; Katkhuda, H.; Shatarat, N. Effect of 3D, 4D, 5D steel fibers on the shear behavior of SFRC beams incorporating recycled coarse aggregate. Constr. Build. Mater. 2025, 460, 139842. [Google Scholar] [CrossRef]
- Summra, A.A.; Mahmoud, H.; Mahmoud, M.; Soliman, M. Influence of using various types of steel fibers on shear behaviour of reinforced concrete beams containing recycled coarse aggregate. J. Eng. 2024, 2024, 6493687. [Google Scholar] [CrossRef]
- Mansur, M.; Ong, K. Behavior of reinforced fiber concrete deep beams in shear. ACI Struct. J. 1991, 88, 98–105. [Google Scholar] [CrossRef]
- Campione, G. Flexural behavior of steel fibrous reinforced concrete deep beams. J. Struct. Eng. ASCE 2012, 138, 235–246. [Google Scholar] [CrossRef]
- Kumar, S.; Singh, S. Steel fibers as replacement of web reinforcement for RCC deep beams in shear. Asian J. Civ. Eng. (Build. Hous.) 2007, 8, 479–489. [Google Scholar]
- Shah, R.; Mishra, F. Crack and deformation characteristics of SFRC deep beams. J. Inst. Eng. 2004, 85, 44–48. [Google Scholar]
- Minelli, F.; Plizzari, G. On the effectiveness of steel fibers as shear reinforcement. ACI Struct. J. 2013, 110, 379–390. [Google Scholar] [CrossRef]
- Abed EL-Hamed, M. Behaviour of Fiber Reinforced Deep Beams. Ph.D. Thesis, Zagazig University, Zagazig, Egypt, 1998; pp. 111–120. [Google Scholar]
- Patel, V.; Mojidra, B.; Pandya, I. Ultimate shear strength of fibrous moderate deep beams without stirrups. Int. J. Eng. Res. Dev. 2012, 1, 16–21. [Google Scholar]
- Narayanan, R.; Darwish, I. Fiber concrete deep beams in shear. ACI Struct. J. 1988, 85, 141–149. [Google Scholar] [CrossRef]
- Yousef, A. Shear strength prediction of high-strength fiber reinforced concrete deep beams. In Proceedings of the 10th International Colloquium on Structural and Geotechnical Engineering, Cairo, Egypt, 20–22 December 2011; Ain Shams University: Cairo, Egypt; pp. 1–19. [Google Scholar]
- Tan, K.H.; Kong, F.K.; Teng, S.; Guan, L. High-Strength Concrete Deep Beams with Effective Span and Shear Span Variations. ACI Struct. J. 1995, 92, 395–405. [Google Scholar] [CrossRef]
- Tan, K.H.; Kong, F.K.; Teng, S.; Teng, S.; Weng, L.W. Effect of Web Reinforcement on High-Strength Concrete Deep Beams. ACI Struct. J. 1997, 94, 572–582. [Google Scholar] [CrossRef] [PubMed]
- Oh, J.K.; Shin, S.W. Shear Strength of Reinforced High-Strength Concrete Deep Beams. ACI Struct. J. 2001, 98, 164–173. [Google Scholar] [CrossRef] [PubMed]
- El-Barbary, A. Performance of Steel Fibers Reinforced Concrete Deep Beams. Ph.D. Thesis, Cairo University, Cairo, Egypt, 2006. [Google Scholar]
- De Souza, R.; Breña, S. Behavior predictions of deep beams with short straight bar anchorages using strut-and-tie models and nonlinear analysis. IBRACON Struct. Mater. J. 2016, 9, 710–721. [Google Scholar] [CrossRef][Green Version]
- Merdas, H.; Shallal, A. Efficiency of steel fibers in improving the performance of concrete beams without shear reinforcement. Salud Cienc. Tecnol.-Ser. Conf. 2024, 3, 830. [Google Scholar] [CrossRef]
- Dinh, N.; Roh, Y.; Truong, G. Shear strength model of FRP-reinforced concrete beams without shear reinforcement. Structures 2024, 64, 106520. [Google Scholar] [CrossRef]
- Mirzaaghabeik, H.; Mashaan, N.; Shukla, S.K. Shear Bbehavior of ultra-high-performance concrete deep beams reinforced with fibers: A state-of-the-art review. Infrastructures 2025, 10, 67. [Google Scholar] [CrossRef]
- Sandeep, M.S.; Pansuk, W.; Latcharote, P.; Nagarajan, P.; Raman, S.N. Sustainable self-compacting steel-fibre rubcrete: Mechanical response and deep beam behaviour. J. King Saud Univ.-Eng. Sci. 2025, 37, 37. [Google Scholar]
- Fathalla, E.; Mihaylov, B. Shear behaviour of deep beams strengthened with high-strength fiber reinforced concrete jackets. Eng. Struct. 2025, 325, 119404. [Google Scholar] [CrossRef]
- EN Eurocode 2; Design of Concrete Structures. European Standards for the Design of Concrete Structures: London, UK, 2023.
- Wong, P.; Vecchio, F.; Trommels, H. Vector2 and Formworks User’s Manual, 2nd ed.; Version 4.4; University of Toronto: Toronto, ON, Canada, 2013. [Google Scholar]
- Vecchio, F. Disturbed stress field model for RC: Formulation. J. Struct. Eng. 2000, 126, 1070–1077. [Google Scholar] [CrossRef]
- Vecchio, F.; Collins, M. The modified compression-field theory for RC elements subjected to shear. ACI Struct. J. 1986, 83, 219–231. [Google Scholar]
- AASHTO. Standard Specifications for Highway Bridges, 41st ed.; American Association of State Highway and Transportation Officials: Frederick, MD, USA, 2021. [Google Scholar]
- CSA A23.3-19; Design of Concrete Structures. Canadian Standards Association: Toronto, ON, Canada, 2019.
- Vecchio, F. Disturbed stress field model for RC: Implementation. J. Struct. Eng. 2001, 127, 12–20. [Google Scholar] [CrossRef]
- Vecchio, F. Disturbed Stress Field Model for RC: Validation. J. Struct. Eng. 2001, 127, 350–358. [Google Scholar] [CrossRef]
- Lee, S.; Cho, J.; Vecchio, F. Diverse embedment model for steel fiber-reinforced concrete in tension: Model development. ACI Mater. J. 2011, 108, 516–525. [Google Scholar] [CrossRef]
- Lee, S.; Cho, J.; Vecchio, F. Diverse embedment model for steel fiber-reinforced concrete in tension: Model verification. ACI Mater. J. 2011, 108, 526–535. [Google Scholar] [CrossRef]
- Lee, S.; Cho, J.; Vecchio, F. Model for post-yield tension stiffening and rebar rupture in concrete members. Eng. Struct. 2011, 33, 1723–1733. [Google Scholar] [CrossRef]
- Lee, S.; Cho, J.; Vecchio, F. Simplified diverse embedment model for SFRC elements in tension. ACI Mater. J. 2012, 110, 403–413. [Google Scholar]
- Lee, S.; Cho, J.; Vecchio, F. Tension stiffening model for steel fiber reinforced concrete containing conventional reinforcement. ACI Struct. J. 2012, 110, 639–648. [Google Scholar]
- Vecchio, F.J. Finite Element Modeling of Concrete Expansion and Confinement. J. Struct. Eng. 1992, 118, 2390–2406. [Google Scholar] [CrossRef]
- Sadeghian, V.; Vecchio, F. The modified compression field theory: Then and now. In Proceedings of the The Concrete Convention and Exposition, Salt Lake City, UT, USA, 25–29 March 2018. [Google Scholar]
- Bentz, E.C. Empirical modelling of reinforced concrete shear strength size effect for members without stirrups. ACI Struct. J. 2005, 102, 232–241. [Google Scholar] [CrossRef]
- Eligehausen, R.; Popov, E.; Bertero, V. Local Bond Stress-Slip Relationship of Deformed Bars Under Generalized Excitations; Report No. UCB/EERC-83/23; Earthquake Engineering Center, University of California: Berkeley, CA, USA, 1983. [Google Scholar]
- Kachouh, N.; El-Maaddawy, T.; El-Hassan, H.; El-Ariss, B. Shear behavior of steel-fiber-reinforced recycled aggregate concrete deep beams. Buildings 2021, 11, 423. [Google Scholar] [CrossRef]
- Kachouh, N.; El-Hassan, H.; El-Maaddawy, T. Effect of steel fibers on the performance of concrete made with recycled concrete aggregates and dune sand. Constr. Build. Mater. 2019, 213, 348–359. [Google Scholar] [CrossRef]
- Lee, S.; Oh, J.; Cho, J. Compressive behavior of fiber-reinforced concrete with end-hooked steel fibers. Materials 2015, 8, 1442–1458. [Google Scholar] [CrossRef]
- Wang, H.; Zhang, W.; Lin, J.; Guo, S.; Guo, S. Research on fracture energy prediction and size effect of concrete based on deep learning with SHAP interpretability method. Buildings 2025, 15, 2149. [Google Scholar] [CrossRef]


Disclaimer/Publisher’s Note: The statements, opinions and data contained in all publications are solely those of the individual author(s) and contributor(s) and not of MDPI and/or the editor(s). MDPI and/or the editor(s) disclaim responsibility for any injury to people or property resulting from any ideas, methods, instructions or products referred to in the content. |
© 2025 by the authors. Licensee MDPI, Basel, Switzerland. This article is an open access article distributed under the terms and conditions of the Creative Commons Attribution (CC BY) license (https://creativecommons.org/licenses/by/4.0/).