
Predicting the Tensile Properties of Carbon FRCM Using a LASSO Model

 , , , and
Abstract

1. Introduction
1.1. FRCM for Structural Retrofitting
1.2. Direct Tensile Testing of FRCM
1.3. Research Significance
2. Data Collection and Analysis
2.1. Database
- Matrix properties: compressive strength, tensile strength, and stiffness.
- Textile properties: grid spacing in the direction of loading and perpendicular to loading direction (also referred to as warp density and weft density), coating (if any), density, tensile strength, stiffness, and ultimate strength.
- Specimen characteristics: length, width, thickness, number of tensile longitudinal threads, textile cross-section, or volumetric percentage of reinforcement.
- Monitorization and testing: type of monitorization and data acquisition, test type, and test parameters (test speed).
- Results: identification of the modulus of elasticity and tensile strength for each branch, the number of identifiable branches in the stress–strain behaviour under tensile stresses.
2.2. Data Preprocessing
2.2.1. Data Imputation
2.2.2. Outliers’ Treatment
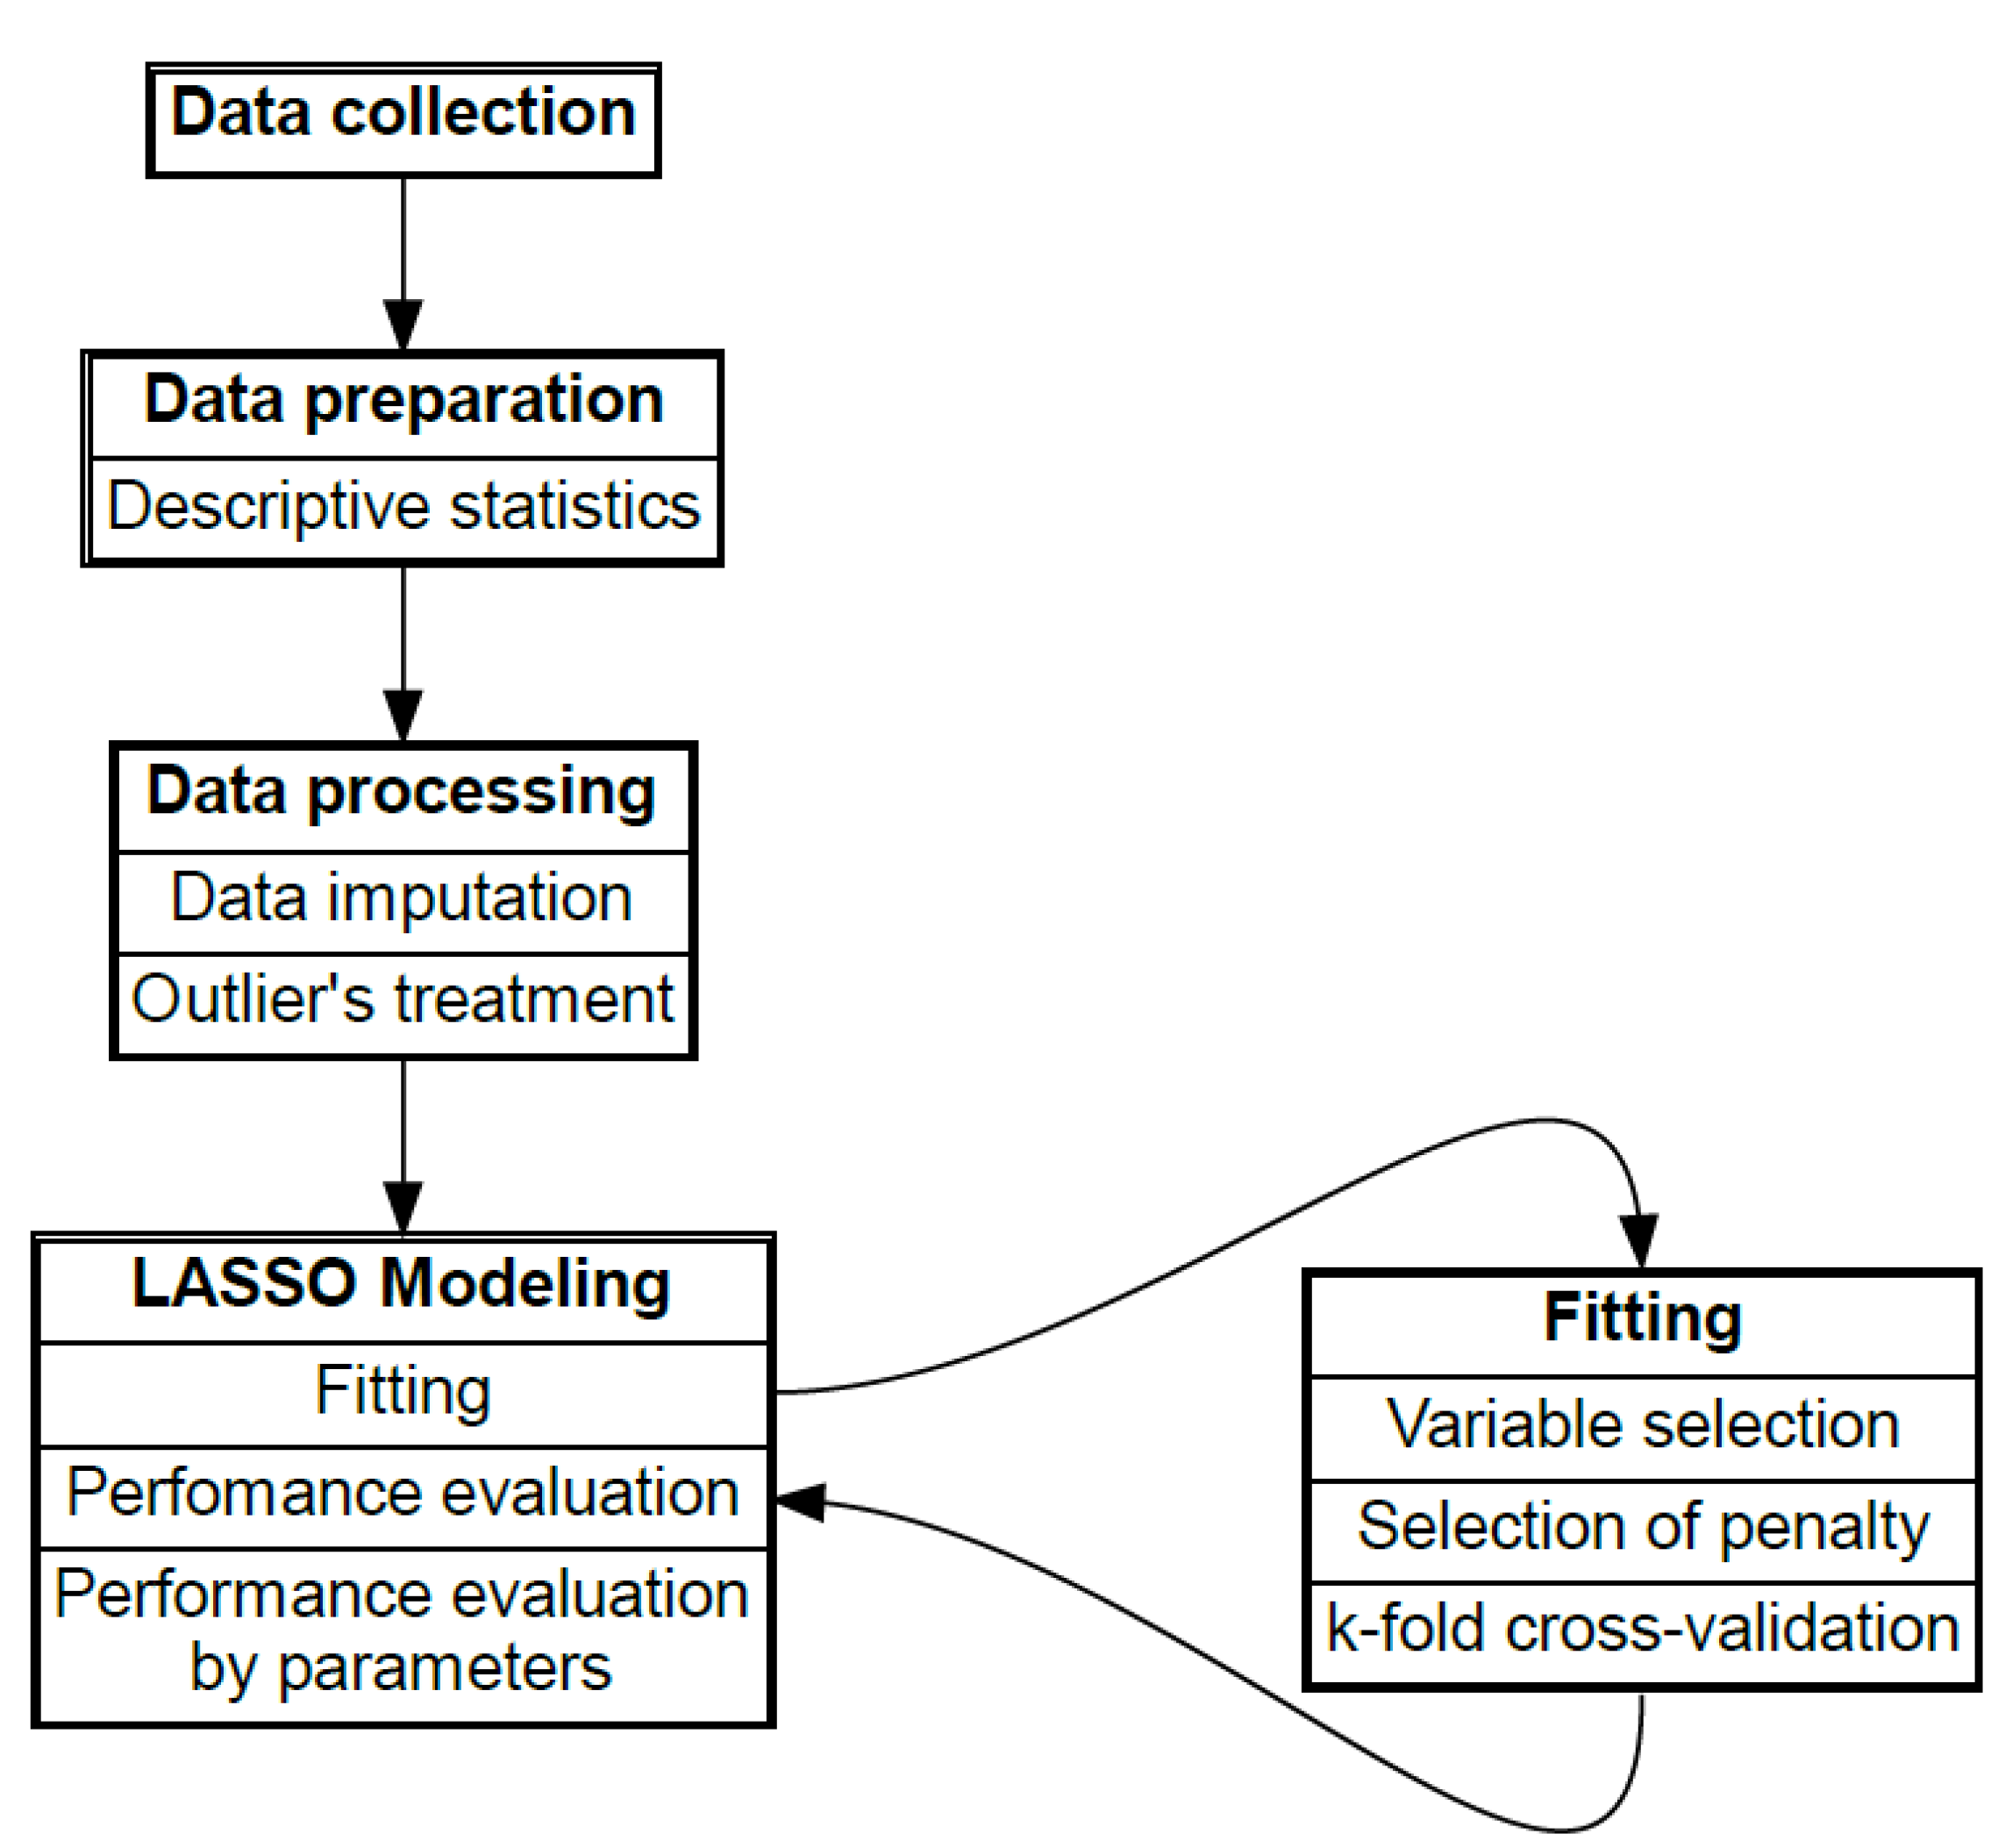
2.3. Model Introduction
3. Results and Discussion
3.1. Model Definition
3.2. Model Performance Evaluation
3.3. Impact of Material and Test Parameters on Performance
4. Conclusions and Future Works
- The models’ significance and performance allow for the conclusion that LASSO regression has proven to be highly effective, accurately predicting the properties of FRCM under direct tensile loadings while providing streamlined and interpretable models through optimal variable selection and mitigation of multicollinearity.
- With respect to the test parameters, both the gripping system and load–speed ratio have a significant influence on the results. The influence is greater for ultimate values (ultimate load and, if present, stiffness in the third branch of the stress–strain curve). The observed high impact of the load–speed ratio should be properly addressed when designing an experimental set-up. It is proposed that a relatively low speed be employed for conservative performance values until further evidence on this parameter exists. For the support system, the beneficial influence of clamping is not considered unconservative, as actual FRCM reinforcements are not subjected to equivalent stress concentrations as those caused by the clevis system, which leads to relatively poor performance.
- Of the material-related parameters, it is concluded that the combination of textile and matrix properties has a significant impact upon the stress–strain curve at all stages.
- The parameter of highest impact is the coating of the textile, as it affects not only the ultimate load and strain but also the existence of bilinear or trilinear behaviour, thus indicating a better interaction between fibres and matrix when the textile is coated. The influence of coating is greater upon the ultimate tensile load when combined with high matrix strengths.
- Similarly, the relevance of the mechanical properties of the matrix on the cracking development and ultimate load was observed, consistent with the enhanced load-carrying capacity of the matrix during the evolution of cracking.
Author Contributions
Funding
Data Availability Statement
Conflicts of Interest
References
- D’Antino, T.; Carloni, C.; Sneed, L.H.; Pellegrino, C. Matrix-fiber bond behavior in PBO FRCM composites: A fracture mechanics approach. Eng. Fract. Mech. 2014, 117, 94–111. [Google Scholar] [CrossRef]
- Carozzi, F.G.; Poggi, C. Mechanical properties and debonding strength of Fabric Reinforced Cementitious Matrix (FRCM) systems for masonry strengthening. Compos. Part B Eng. 2015, 70, 215–230. [Google Scholar] [CrossRef]
- Arboleda, D.; Carozzi, F.G.; Nanni, A.; Poggi, C. Testing Procedures for the Uniaxial Tensile Characterization of Fabric-Reinforced Cementitious Matrix Composites. J. Compos. Constr. 2016, 20, 04015063. [Google Scholar] [CrossRef]
- Papanicolaou, C.G.; Triantafillou, T.C.; Papathanasiou, M.; Karlos, K. Textile reinforced mortar (TRM) versus FRP as strengthening material of URM walls: Out-of-plane cyclic loading. Mater. Struct. Constr. 2008, 41, 143–157. [Google Scholar] [CrossRef]
- de Felice, G.; De Santis, S.; Garmendia, L.; Ghiassi, B.; Larrinaga, P.; Lourenço, P.B.; Oliveira, D.; Paolacci, F.; Papanicolaou, C.G. Mortar-based systems for externally bonded strengthening of masonry. Mater. Struct. Constr. 2014, 47, 2021–2037. [Google Scholar] [CrossRef]
- Tetta, Z.C.; Bournas, D.A. TRM vs FRP jacketing in shear strengthening of concrete members subjected to high temperatures. Compos. Part B Eng. 2016, 106, 190–205. [Google Scholar] [CrossRef]
- Valluzzi, M.R.; Modena, C.; de Felice, G. Current practice and open issues in strengthening historical buildings with composites. Mater. Struct. Constr. 2014, 47, 1971–1985. [Google Scholar] [CrossRef]
- Butler, M.; Mechtcherine, V.; Hempel, S. Durability of textile reinforced concrete made with AR glass fibre: Effect of the matrix composition. Mater. Struct. Constr. 2010, 43, 1351–1368. [Google Scholar] [CrossRef]
- Escrig, C.; Gil, L.; Bernat-Maso, E.; Puigvert, F. Experimental and analytical study of reinforced concrete beams shear strengthened with different types of textile-reinforced mortar. Constr. Build. Mater. 2015, 83, 248–260. [Google Scholar] [CrossRef]
- Bertolesi, E.; Carozzi, F.G.; Milani, G.; Poggi, C. Numerical modeling of Fabric Reinforce Cementitious Matrix composites (FRCM) in tension. Constr. Build. Mater. 2014, 70, 531–548. [Google Scholar] [CrossRef]
- Ombres, L. Analysis of the bond between Fabric Reinforced Cementitious Mortar (FRCM) strengthening systems and concrete. Compos. Part B Eng. 2015, 69, 418–426. [Google Scholar] [CrossRef]
- Awani, O.; El Refai, A.; El-Maaddawy, T. Bond characteristics of carbon fabric-reinforced cementitious matrix in double shear tests. Constr. Build. Mater. 2015, 101, 39–49. [Google Scholar] [CrossRef]
- D’Antino, T.; Papanicolaou, C. Comparison between different tensile test set-ups for the mechanical characterization of inorganic-matrix composites. Constr. Build. Mater. 2018, 171, 140–151. [Google Scholar] [CrossRef]
- De Santis, S.; De Felice, G. Tensile behaviour of mortar-based composites for externally bonded reinforcement systems. Compos. Part B Eng. 2015, 68, 401–413. [Google Scholar] [CrossRef]
- Donnini, J.; Corinaldesi, V.; Nanni, A. Mechanical properties of FRCM using carbon fabrics with different coating treatments. Compos. Part B Eng. 2016, 88, 220–228. [Google Scholar] [CrossRef]
- Papanicolaou, C.G.; Papantoniou, I.C. Optimum design of textile-reinforced concrete as integrated formwork in slabs. Text. Fibre Compos. Civ. Eng. 2016, 246–274. [Google Scholar]
- Peled, A.; Mobasher, B.; Bentur, A. Textile Reinforced Concrete, 1st ed.; CRC Press: London, UK, 2017. [Google Scholar] [CrossRef]
- Triantafillou, T.C.; Papanicolaou, C.G. Textile reinforced mortars (TRM) versus fiber reinforced polymers (FRP) as strengthening materials of concrete structures. Spec. Publ. 2005, 230, 99–117. [Google Scholar]
- Caggegi, C.; Carozzi, F.G.; De Santis, S.; Fabbrocino, F.; Focacci, F.; Hojdys, Ł.; Lanoye, E.; Zuccarino, L. Experimental analysis on tensile and bond properties of PBO and aramid fabric reinforced cementitious matrix for strengthening masonry structures. Compos. Part B Eng. 2017, 127, 175–195. [Google Scholar] [CrossRef]
- Caggegi, C.; Lanoye, E.; Djama, K.; Bassil, A.; Gabor, A. Tensile behaviour of a basalt TRM strengthening system: Influence of mortar and reinforcing textile ratios. Compos. Part B Eng. 2017, 130, 90–102. [Google Scholar] [CrossRef]
- Bilotta, A.; Ceroni, F.; Lignola, G.P.; Prota, A. Use of DIC technique for investigating the behaviour of FRCM materials for strengthening masonry elements. Compos. Part B Eng. 2017, 129, 251–270. [Google Scholar] [CrossRef]
- Tekieli, M.; De Santis, S.; de Felice, G.; Kwiecień, A.; Roscini, F. Application of Digital Image Correlation to composite reinforcements testing. Compos. Struct. 2017, 160, 670–688. [Google Scholar] [CrossRef]
- de Felice, G.; D’Antino, T.; De Santis, S.; Meriggi, P.; Roscini, F. Lessons Learned on the Tensile and Bond Behavior of Fabric Reinforced Cementitious Matrix (FRCM) Composites. Front. Built Environ. 2020, 6, 5. [Google Scholar] [CrossRef]
- Donnini, J.; Chiappini, G.; Lancioni, G.; Corinaldesi, V. Tensile behaviour of glass FRCM systems with fabrics’ overlap: Experimental results and numerical modeling. Compos. Struct. 2019, 212, 398–411. [Google Scholar] [CrossRef]
- Mazzucco, G.; D’Antino, T.; Pellegrino, C.; Salomoni, V. Three-dimensional finite element modeling of inorganic-matrix composite materials using a mesoscale approach. Compos. Part B Eng. 2018, 143, 75–85. [Google Scholar] [CrossRef]
- Leone, M.; Aiello, M.A.; Balsamo, A.; Carozzi, F.G.; Ceroni, F.; Corradi, M.; Garbin, E.; Gattesco, N.; Krajewski, P. Glass fabric reinforced cementitious matrix: Tensile properties and bond performance on masonry substrate. Compos. Part B Eng. 2017, 127, 196–214. [Google Scholar] [CrossRef]
- Carozzi, F.G.; Bellini, A.; D’Antino, T.; de Felice, G.; Focacci, F.; Hojdys, Ł.; Laghi, L.; Lanoye, E.; Micelli, F.; Panizza, M. Experimental investigation of tensile and bond properties of Carbon-FRCM composites for strengthening masonry elements. Compos. Part B Eng. 2017, 128, 100–119. [Google Scholar] [CrossRef]
- Ombres, L.; Mancuso, N.; Mazzuca, S.; Verre, S. Bond between Carbon Fabric-Reinforced Cementitious Matrix and Masonry Substrate. J. Mater. Civ. Eng. 2019, 31, 04018356. [Google Scholar] [CrossRef]
- Lignola, G.P.; Caggegi, C.; Ceroni, F.; De Santis, S.; Krajewski, P.; Lourenço, P.B.; Morganti, M.; Papanicolaou, C.; Pellegrino, C.; Prota, A.; et al. Performance assessment of basalt FRCM for retrofit applications on masonry. Compos. Part B Eng. 2017, 128, 1–18. [Google Scholar] [CrossRef]
- AC434; Acceptance Criteria for Concrete and Masonry Strengthening Using Fabric-Reinforced Cementitious Matrix (FRCM). ICC Evaluation Service: Whittier, CA, USA, 2018.
- CNR DT 215/2018; Guide for the Design and Construction of Externally Bonded FRP Systems for Strengthening Existing Structures. Italian ational Research Council: Pisa, Italy, 2018.
- D’Antino, T.; Papanicolaou, C. Mechanical characterization of textile reinforced inorganic-matrix composites. Compos. Part B Eng. 2017, 127, 78–91. [Google Scholar] [CrossRef]
- Peled, A.; Cohen, Z.; Pasder, Y.; Roye, A.; Gries, T. Influences of textile characteristics on the tensile properties of warp knitted cement based composites. Cem. Concr. Compos. 2008, 30, 174–183. [Google Scholar] [CrossRef]
- Peled, A.; Bentur, A. Geometrical characteristics and efficiency of textile fabrics for reinforcing cement composites. Cem. Concr. Res. 2000, 30, 781–790. [Google Scholar] [CrossRef]
- Hartig, J.; Jesse, F.; Schicktanz, K.; Häußler-Combe, U. Influence of experimental setups on the apparent uniaxial tensile load-bearing capacity of Textile Reinforced Concrete specimens. Mater. Struct. Constr. 2012, 45, 433–446. [Google Scholar] [CrossRef]
- Ascione, L.; De Felice, G.; De Santis, S. A qualification method for externally bonded Fibre Reinforced Cementitious Matrix (FRCM) strengthening systems. Compos. Part B Eng. 2015, 78, 497–506. [Google Scholar] [CrossRef]
- Bellini, A.; Bovo, M.; Mazzotti, C. Experimental and numerical evaluation of fiber-matrix interface behaviour of different FRCM systems. Compos. Part B Eng. 2019, 161, 411–426. [Google Scholar] [CrossRef]
- Choi, D.; Vachirapanyakun, S.; Ochirbud, M.; Naidangjav, U.; Ha, S.; Kim, Y. Tensile Performance, Lap-Splice Length and Behavior of Concretes Confined by Prefabricated C-FRCM System. Int. J. Concr. Struct. Mater. 2021, 15, 45. [Google Scholar] [CrossRef]
- Barhum, R.; Mechtcherine, V. Effect of short, dispersed glass and carbon fibres on the behaviour of textile-reinforced concrete under tensile loading. Eng. Fract. Mech. 2012, 92, 56–71. [Google Scholar] [CrossRef]
- Ding, Y.; Wang, Q.; Pacheco-Torgal, F.; Zhang, Y. Hybrid effect of basalt fiber textile and macro polypropylene fiber on flexural load-bearing capacity and toughness of two-way concrete slabs. Constr. Build. Mater. 2020, 261, 119881. [Google Scholar] [CrossRef]
- Jiang, J.; Jiang, C.; Li, B.; Feng, P. Bond behavior of basalt textile meshes in ultra-high ductility cementitious composites. Compos. Part B Eng. 2019, 174, 107022. [Google Scholar] [CrossRef]
- De Santis, S.; Hadad, H.A.; De Caso y Basalo, F.; de Felice, G.; Nanni, A. Acceptance Criteria for Tensile Characterization of Fabric-Reinforced Cementitious Matrix Systems for Concrete and Masonry Repair. J. Compos. Constr. 2018, 22, 04018048. [Google Scholar] [CrossRef]
- Estevan, L.; Varona, F.B.; Baeza, F.J.; Torres, B.; Bru, D. Textile Reinforced Mortars (TRM) tensile behavior after high temperature exposure. Constr. Build. Mater. 2022, 328, 127116. [Google Scholar] [CrossRef]
- Truong, V.D.; Lee, D.H.; Kim, D.J. Effects of different grips and surface treatments of textile on measured direct tensile response of textile reinforced cementitious composites. Compos. Struct. 2021, 278, 114689. [Google Scholar] [CrossRef]
- Rodríguez-Marcos, M.; Villanueva-Llaurado, P.; Fernández-Gómez, J.; López–Rebollo, J. Improvement of tensile properties of carbon fibre-reinforced cementitious matrix composites with coated textile and enhanced mortars. Constr. Build. Mater. 2023, 369, 130552. [Google Scholar] [CrossRef]
- Everitt, B.; Hothorn, T. MVA: An Introduction to Applied Multivariate Analysis with R; Springer Science & Business Media: Berlin/Heidelberg, Germany, 2015. [Google Scholar]
- Everitt, B.; Hothorn, T. An Introduction to Applied Multivariate Analysis with R; Springer Science & Business Media: Berlin/Heidelberg, Germany, 2008. [Google Scholar] [CrossRef]
- Xi, L.J.; Guo, Z.Y.; Yang, X.K.; Ping, Z.G. Application of LASSO and its extended method in variable selection of regression analysis. Zhonghua Yu Fang. Yi Xue Za Zhi 2023, 57, 107–111. [Google Scholar] [CrossRef]
- Chollet, F.; Allaire, J.J. Deep Learning with R; Manning Publications, Co.: Cherry Hill, NJ, USA, 2018. [Google Scholar]
- De Domenico, D.; Maugeri, N.; Longo, P.; Ricciardi, G.; Gullì, G.; Calabrese, L. Clevis-Grip Tensile Tests on Basalt, Carbon and Steel FRCM Systems Realized with Customized Cement-Based Matrices. J. Compos. Sci. 2022, 6, 275. [Google Scholar] [CrossRef]
- Ebead, U.; Shrestha, K.C.; Afzal, M.S.; El Refai, A.; Nanni, A. Effectiveness of Fabric-Reinforced Cementitious Matrix in Strengthening Reinforced Concrete Beams. J. Compos. Constr. 2017, 21, 04016084. [Google Scholar] [CrossRef]
- Kim, H.-S.; Truong, G.T.; Park, S.-H.; Choi, K.-K. Tensile Properties of Carbon Fiber-Textile Reinforced Mortar (TRM) Characterized by Different Anchorage Methods. Int. J. Concr. Struct. Mater. 2018, 12, 73. [Google Scholar] [CrossRef]
- Su, M.; Wang, Z.; Ueda, T. Optimization and design of carbon fabric-reinforced cementitious matrix composites. Struct. Concr. 2022, 23, 1845–1860. [Google Scholar] [CrossRef]
- Van Tran, H.; Truong, G.T.; Choi, K.-K. Effect of Harsh Conditions on the Tensile Behaviour of Lap-Spliced Carbon Fiber Textile-Reinforced Mortar (TRM) with Different Surface Treatment Methods. Appl. Sci. 2019, 9, 3087. [Google Scholar] [CrossRef]
- Wei, L.-L.; Zhu, J.-H.; Ueda, T.; Su, M.-N.; Liu, J.; Liu, W.; Tang, L.-P.; Xing, F. Tensile behaviour of carbon fabric reinforced cementitious matrix composites as both strengthening and anode materials. Compos. Struct. 2020, 234, 111675. [Google Scholar] [CrossRef]
- Younis, A.; Ebead, U.; Shrestha, K. Tensile characterization of multi-ply fabric-reinforced cementitious matrix strengthening systems. Struct. Concr. 2020, 21, 713–723. [Google Scholar] [CrossRef]
- Wille, K.; El-tawil, S.; Naaman, A.E. Properties of strain hardening ultra high performance fiber reinforced concrete (UHP-FRC) under direct tensile loading. Cem. Concr. Compos. 2014, 48, 53–66. [Google Scholar] [CrossRef]
- Gelman, A.; Hill, J. Missing-data imputation. In Data Analysis Using Regression and Multilevel/Hierarchical Models; Cambridge University Press: Cambridge, UK, 2006; pp. 529–544. [Google Scholar]
- Raheem, E. Missing Data Imputation: A Practical Guide. In Statistical Approaches for Epidemiology: From Concept to Application; Mitra, A.K., Ed.; Springer International Publishing: Cham, Switzerland, 2024; pp. 293–316. [Google Scholar] [CrossRef]
- Zhu, H.; Ibrahim, J.G.; Cho, H. Perturbation and scaled Cook’s distance. Ann. Stat. 2012, 40, 785–811. [Google Scholar] [CrossRef] [PubMed]
- Jayakumar, G.S.D.S.; Sulthan, A. Exact distribution of Cook’s distance and identification of influential observations. Hacettepe J. Math. Stat. 2015, 44, 165–178. [Google Scholar] [CrossRef]
- Hidekazu, T. Detecting influential observations by using a new expression of cook’s distance. Commun. Stat. Theory Methods 1991, 20, 261–274. [Google Scholar] [CrossRef]
- Abellán-García, J. Comparison of artificial intelligence and multivariate regression in modeling the flexural behavior of UHPFRC. Dyna 2020, 87, 239–248. [Google Scholar] [CrossRef]
- Abellán-García, J.; Ortega-Guzmán, J.J.; Chaparro-Ruiz, D.A.; García-Castaño, E. A Comparative Study of LASSO and ANN Regressions for the Prediction of the Direct Tensile Behavior of UHPFRC. Adv. Civ. Eng. Mater. 2022, 11, 235–262. [Google Scholar] [CrossRef]
- Friedman, J.; Hastie, T.; Tibshirani, R. Regularization Paths for Generalized Linear Models via Coordinate Descent. J. Stat. Softw. 2010, 33, 1–22. [Google Scholar] [CrossRef]


| ID | Name of Variable | Type of Variable |
|---|---|---|
| fcmat | Compressive strength of matrix | Scale |
| ftf | Tensile strength of the textile | Scale |
| Ef | Stiffness of the textile | Scale |
| SL | Spacing of the grid in the direction of loading | Scale |
| ST | Spacing of the grid in the direction perpendicular to loading | Scale |
| C | Coating (if any) of the fibres | Nominal |
| v | Test speed of increasing load | Scale |
| SS | Support system; this can be clevis or clamping | Nominal |
| t | Thickness of the specimen | Scale |
| b | Width of the specimen | Scale |
| l | Length of the specimen | Scale |
| ID | Symbol | Name of Variable | Type of Variable |
|---|---|---|---|
| O1 | σTA | Tensile strength of stage A | Scale |
| O2 | ETA | Young’s modulus of elasticity of stage A | Scale |
| O3 | σTB | Tensile strength of stage B | Scale |
| O4 | εTB | Strain of stage B | Scale |
| O5 | ETB | Young’s modulus of elasticity of stage B | Scale |
| O6 | σu | Tensile strength at peak | Scale |
| O7 | εu | Ultimate strain | Scale |
| O8 | Eu | Young’s modulus of elasticity of stage C | Scale |
| fcmat | ftf | Ef | SL | ST | v | t | b | l | |
|---|---|---|---|---|---|---|---|---|---|
| count | 105.00 | 91.00 | 92.00 | 99.00 | 99.00 | 104.00 | 106.00 | 103.00 | 103.00 |
| mean | 40.45 | 2737.22 | 198.70 | 14.22 | 14.98 | 0.46 | 13.54 | 70.72 | 461.54 |
| std | 22.49 | 1269.22 | 69.78 | 5.69 | 6.63 | 0.28 | 7.23 | 27.39 | 91.97 |
| CV | 55.60% | 46.37 | 35.12% | 40.01% | 44.26% | 60.87% | 53.40% | 38.73% | 19.93% |
| min | 6.50 | 441.00 | 1.80 | 8.50 | 7.00 | 0.15 | 6.00 | 40.00 | 260.00 |
| 25% | 17.00 | 1863.00 | 196.40 | 10.00 | 10.00 | 0.25 | 10.00 | 50.00 | 410.00 |
| 50% | 39.56 | 2125.00 | 223.00 | 10.00 | 10.00 | 0.30 | 10.00 | 60.00 | 450.00 |
| 75% | 70.20 | 4300.00 | 240.00 | 20.00 | 20.00 | 0.50 | 15.00 | 85.00 | 525.00 |
| max | 79.40 | 4900.00 | 263.00 | 30.00 | 30.00 | 1.00 | 30.00 | 125.00 | 650.00 |
| nan | 1.00 | 15.00 | 14.00 | 7.00 | 7.00 | 2.00 | 0.00 | 3.00 | 3.00 |
| mode | 16.40 | 4300.00 | 240.00 | 10.00 | 10.00 | 0.50 | 10.00 | 50.00 | 410.00 |
| O1 | O2 | O3 | O4 | O5 | O6 | O7 | O8 | O9 | |
|---|---|---|---|---|---|---|---|---|---|
| count | 98.00 | 97.00 | 102.00 | 106.00 | 104.00 | 82.00 | 106.00 | 104.00 | 83.00 |
| mean | 659.50 | 0.04 | 2620.13 | 1108.17 | 0.66 | 109.80 | 1400.46 | 0.80 | 155.20 |
| std | 511.10 | 0.05 | 2667.23 | 804.18 | 0.50 | 109.16 | 1202.14 | 0.52 | 170.14 |
| CV | 77.50% | 125.00% | 101.80% | 72.57% | 75.76% | 99.42% | 85.84% | 65.00% | 109.63% |
| min | 86.10 | 0.01 | 18.00 | 196.00 | 0.01 | 1.00 | 196.00 | 0.01 | 8.60 |
| 25% | 204.75 | 0.02 | 512.50 | 524.22 | 0.24 | 46.63 | 617.78 | 0.43 | 51.00 |
| 50% | 569.65 | 0.03 | 1540.93 | 1031.50 | 0.62 | 76.00 | 1201.50 | 0.80 | 105.90 |
| 75% | 888.28 | 0.05 | 3727.25 | 1358.75 | 0.96 | 135.00 | 1498.83 | 1.12 | 190.00 |
| max | 2495.00 | 0.48 | 11,707.00 | 5808.00 | 2.25 | 680.00 | 6159.00 | 2.25 | 799.00 |
| nan | 8.00 | 9.00 | 4.00 | 0.00 | 2.00 | 24.00 | 0.00 | 2.00 | 23.00 |
| Response | Original Number of Observations | Observations to Be Removed | Final Number of Observations for Training LASSO Models |
|---|---|---|---|
| O1 | 98 | 6 | 92 |
| O2 | 102 | 4 | 98 |
| O3 | 106 | 5 | 101 |
| O4 | 104 | 3 | 101 |
| O5 | 82 | 6 | 76 |
| O6 | 106 | 5 | 101 |
| O7 | 104 | 3 | 101 |
| O8 | 83 | 2 | 81 |
| Variable | Type | O1 | O2 | O3 | O4 | O5 | O6 | O7 | O8 |
|---|---|---|---|---|---|---|---|---|---|
| λ | Parameter | 0.17185 | 8.74607 | 43.71260 | 0.00021 | 1.53808 | 37.71957 | 0.00011 | 2.76502 |
| Intercept | Lineal | −1080.5492 | 4220.71564 | 1529.57966 | −1.951815 | 129.69499 | 1851.83024 | −1.84532 | 246.51386 |
| t | Lineal | - | - | - | 0.05244 | - | - | 0.07136 | - |
| fcmat | Lineal | 49.97333 | 16.02402 | - | - | - | - | −0.01103 | - |
| v | Lineal | −533.68788 | - | - | 0.71211 | - | - | - | - |
| b | Lineal | - | - | −10.36494 | 0.02960 | - | - | 0.03176 | - |
| l | Lineal | 0.11113 | - | - | 0.00133 | - | - | 0.00254 | −0.10579 |
| SL | Lineal | 126.02625 | - | - | 0.08360 | - | - | 0.10760 | - |
| ST | Lineal | 1.02557 | - | - | 0.04541 | - | - | 0.08398 | - |
| Ef | Lineal | - | - | - | −0.00196 | - | - | - | - |
| ftf | Lineal | −0.03275 | - | - | - | - | - | −7.37 × 10−05 | - |
| SS | Lineal | 1884.8536 | 1026.35973 | - | 0.85759 | - | - | - | - |
| C | Lineal | 2416.64108 | - | - | 0.72912 | - | - | - | - |
| t_fcmat | Interaction | −0.85624 | −0.29003 | - | −0.00147 | - | −0.49378 | −0.00063 | −0.07319 |
| t_v | Interaction | - | - | - | 0.19599 | - | - | 0.08785 | −1.63038 |
| t_b | Interaction | 0.07833 | - | - | - | −0.00477 | - | 0.00017 | - |
| t_l | Interaction | 0.09640 | - | - | 7.30 × 10−05 | −0.00199 | - | 0.00011 | - |
| t_SL | Interaction | 0.00065 | 2.80652 | - | −0.00821 | - | - | −0.00643 | - |
| t_ST | Interaction | - | - | - | - | - | - | - | −0.08217 |
| t_Ef | Interaction | - | - | - | - | - | - | −8.80 × 10−05 | - |
| t_ftf | Interaction | - | - | - | 7.84 × 10−06 | - | - | - | - |
| t_SS | Interaction | −15.79442 | - | - | 0.020627 | 2.25390 | - | 0.03677 | 3.02028 |
| t_C | Interaction | −50.04543 | - | −9.47848 | 0.04389 | - | −44.15476 | −0.00621 | −9.07314 |
| fcmat_v | Interaction | 17.48055 | - | - | −0.01036 | - | - | −0.00569 | - |
| fcmat_b | Interaction | −0.12322 | - | - | −0.00061 | - | - | −0.00065 | - |
| fcmat_l | Interaction | 0.01957 | - | - | 0.00010 | - | - | 3.98 × 10−05 | - |
| fcmat_SL | Interaction | −0.40605 | 8.55617 | - | 0.00031 | - | - | 0.00028 | −0.02669 |
| fcmat_ST | Interaction | - | - | 0.01973 | 5.75 × 10−05 | - | 0.31957 | 0.00056 | - |
| fcmat_Ef | Interaction | 0.02112 | - | - | −4.25 × 10−05 | −0.00447 | - | −4.21 × 10−05 | - |
| fcmat_ftf | Interaction | −0.00882 | −0.02369 | - | - | - | - | - | - |
| fcmat_SS | Interaction | −17.01157 | 37.02676 | 1.36691 | −0.00802 | - | - | 0.00827 | - |
| fcmat_C | Interaction | −1.05882 | −31.33745 | - | −0.01118 | −1.18493 | - | 0.00534 | - |
| v_b | Interaction | −13.05169 | −45.76146 | - | 0.009964 | −0.52841 | −6.47701 | 0.01270 | - |
| v_l | Interaction | 0.85194 | - | - | −0.00455 | - | - | −0.00265 | −0.15473 |
| v_SL | Interaction | −54.60457 | - | - | 0.14743 | - | - | 0.07710 | - |
| v_ST | Interaction | - | −109.39538 | 17.19090 | 0.01577 | 0.43927 | - | 0.07210 | - |
| v_Ef | Interaction | 5.58488 | 11.12098 | 1.18158 | −0.01199 | - | 3.15255 | −0.00536 | 0.43078 |
| v_ftf | Interaction | - | 1.55710 | - | −9.95 × 10−05 | - | - | 0.00018 | 0.02196 |
| v_SS | Interaction | −3.30525 | −3619.3552 | - | −1.17770 | - | - | −2.15643 | - |
| v_C | Interaction | −772.23127 | 3869.89198 | 298.91922 | 0.35410 | 126.69180 | 4074.7616 | 0.03091 | 342.81744 |
| b_l | Interaction | 0.00372 | - | - | −2.84 × 10−05 | −0.00028 | - | −3.51 × 10−05 | - |
| b_SL | Interaction | - | 0.97261 | −0.00242 | 0.00104 | - | - | 0.00150 | - |
| b_ST | Interaction | - | - | - | 0.00016 | −0.01343 | - | 0.00032 | - |
| b_Ef | Interaction | 0.02377 | 0.05445 | - | - | - | - | −3.33 × 10−05 | - |
| b_ftf | Interaction | 0.00046 | - | - | 3.88 × 10−06 | - | - | 8.71 × 10−06 | - |
| b_SS | Interaction | 18.07249 | 14.11763 | - | 0.00846 | - | - | 7.24 × 10−03 | - |
| b_C | Interaction | −2.86340 | −27.10386 | - | −0.01165 | −0.11839 | −15.46691 | - | −1.96501 |
| l_SL | Interaction | −0.02455 | - | - | −0.00033 | - | - | −0.00042 | - |
| l_ST | Interaction | −0.03044 | - | - | - | - | - | - | - |
| l_Ef | Interaction | - | - | - | 1.95 × 10−05 | - | - | 3.41 × 10−06 | - |
| l_ftf | Interaction | −0.00062 | −0.00120 | - | −5.27 × 10−07 | 1.85 × 10−05 | - | 1.40 × 10−07 | - |
| l_SS | Interaction | −5.90392 | −4.09624 | - | −0.00020 | - | - | 0.00014 | - |
| l_C | Interaction | - | 2.30317 | - | 1.54 × 10−05 | - | - | −0.00037 | - |
| SL_ST | Interaction | −1.99106 | −7.15118 | - | - | - | - | −0.00234 | - |
| SL_Ef | Interaction | - | - | - | −0.00013 | - | - | −2.81 × 10−05 | - |
| SL_ftf | Interaction | 0.02314 | 0.05316 | - | −4.27 × 10−06 | - | - | −1.00 × 10−05 | - |
| SL_SS | Interaction | 26.72357 | - | - | −0.08911 | - | - | −0.07794 | - |
| SL_C | Interaction | −35.66590 | - | - | 0.00036 | 0.52578 | - | 0.01819 | - |
| ST_Ef | Interaction | −0.12982 | −0.58577 | - | −8.36 × 10−05 | - | - | −5.75 × 10−05 | - |
| ST_ftf | Interaction | - | - | −1.15 × 10−05 | - | - | −9.69 × 10−06 | - | |
| ST_SS | Interaction | 2.44207 | - | - | - | - | - | - | - |
| ST_C | Interaction | 1.41889 | 83.40750 | - | 0.00910 | - | - | 0.02932 | - |
| Ef_ftf | Interaction | - | - | - | - | 3.33 × 10−05 | - | - | - |
| Ef_SS | Interaction | 0.99707 | - | - | 0.00222 | −0.10975 | −2.17723 | 0.00088 | - |
| Ef_C | Interaction | 2.16414 | - | - | - | 0.09757 | 1.22845 | −0.00192 | 0.05136 |
| ftf_SS | Interaction | 0.09861 | −0.01918 | - | −5.96 × 10−05 | - | - | 0.00013 | −0.37311 |
| ftf_C | Interaction | −0.09481 | 0.05063 | - | −0.00012 | - | - | 1.14 × 10−05 | 0.06120 |
| SS_C | Interaction | −1942.8705 | −2102.3335 | - | −0.15304 | - | - | −0.52274 | −7.93388 |
| t2 | Squared | - | - | - | −0.00091 | - | - | −0.00105 | - |
| fcmat2 | Squared | −0.16403 | −0.29107 | - | 0.00026 | - | - | 0.00033 | - |
| v2 | Squared | 14.35983 | - | - | 0.19151 | - | - | −0.61315 | - |
| b2 | Squared | −0.02899 | - | - | −0.00019 | - | −0.02203 | −0.00023 | - |
| l2 | Squared | 0.00283 | −0.00087 | - | - | - | - | 2.04 × 10−06 | - |
| SL2 | Squared | −2.86847 | - | - | 0.00059 | - | −0.97159 | - | - |
| ST2 | Squared | 1.06919 | - | - | 0.00085 | - | - | −0.00076 | - |
| Ef2 | Squared | −0.01157 | −0.04597 | - | - | - | - | 6.78 × 10−06 | - |
| ftf2 | Squared | 3.13 × 10−05 | - | - | 5.14 × 10−08 | - | - | −4.31 × 10−08 | - |
| SS2 | Squared | - | - | - | - | - | - | - | - |
| C2 | Squared | - | - | - | - | - | - | - | - |
| Response | R2 | NMBE (%) | MAE | p-Value |
|---|---|---|---|---|
| O1 | 0.921 | 0.000% | 85.244 | 2.22 × 10⁻¹⁶ |
| O2 | 0.726 | 0.000% | 910.625 | 1.21 × 10⁻¹⁵ |
| O3 | 0.4297 | 0.000% | 361.313 | 9.06 × 10−03 |
| O4 | 0.796 | 0.000% | 0.136 | 1.62 × 10−02 |
| O5 | 0.637 | 0.000% | 32.435 | 1.91 × 10−04 |
| O6 | 0.830 | 0.000% | 396.861 | 3.82 × 10−06 |
| O7 | 0.829 | 0.000% | 0.118 | 4.40 × 10−02 |
| O8 | 0.884 | 0.000% | 41.955 | 1.77 × 10−07 |
| O6 (σu) | |||
|---|---|---|---|
| Material Properties | SS | Uncoated | Coated |
| fcmat = 6.5 MPa; SL = 30 mm; ST = 30 mm; Ef = 66 GPa | Clevis | 831 MPa | 844 MPa |
| fcmat = 6.5 MPa; SL = 30 mm; ST = 30 mm; Ef = 66 GPa | Clamping | 975 MPa | 987 MPa |
| fcmat = 79.4 MPa; SL = 8.5 mm; ST = 7 mm; Ef = 263 GPa | Clevis | 1230 MPa | 1485 MPa |
| fcmat = 79.4 MPa; SL = 8.5 mm; ST = 7 mm; Ef = 263 GPa | Clamping | 1803 MPa | 2057 MPa |
| O6 (σu) | |||
|---|---|---|---|
| Material Properties | Coated | Clevis | Clamping |
| fcmat = 6.5 MPa; SL = 30 mm; ST = 30 mm; Ef = 66 GPa | Uncoated | 831 MPa | 975 MPa |
| fcmat = 6.5 MPa; SL = 30 mm; ST = 30 mm; Ef = 66 GPa | Coated | 844 MPa | 987 MPa |
| fcmat = 79.4 MPa; SL = 8.5 mm; ST = 7 mm; Ef = 263 GPa | Uncoated | 1230 MPa | 1803 MPa |
| fcmat = 79.4 MPa; SL = 8.5 mm; ST = 7 mm; Ef = 263 GPa | Coated | 1485 MPa | 2057 MPa |
| O6 (σu) | |||
|---|---|---|---|
| Material Properties | Coated-SS | v = 0.2 mm/min | v = 1 mm/min |
| fcmat = 6.5 MPa; SL = 30 mm; ST = 30 mm; Ef = 66 GPa | Uncoated Clevis | 831 MPa | 791 MPa |
| fcmat = 6.5 MPa; SL = 30 mm; ST = 30 mm; Ef = 66 GPa | Uncoated Clamping | 975 MPa | 934 MPa |
| fcmat = 6.5 MPa; SL = 30 mm; ST = 30 mm; Ef = 66 GPa | Coated Clevis | 844 MPa | 4063 MPa |
| fcmat = 6.5 MPa; SL = 30 mm; ST = 30 mm; Ef = 66 GPa | Coated Clamping | 987 MPa | 4206 MPa |
| fcmat = 79.4 MPa; SL = 8.5 mm; ST = 7 mm; Ef = 263 GPa | Uncoated Clevis | 1230 MPa | 1686 MPa |
| fcmat = 79.4 MPa; SL = 8.5 mm; ST = 7 mm; Ef = 263 GPa | Uncoated Clamping | 1803 MPa | 2259 MPa |
| fcmat = 79.4 MPa; SL = 8.5 mm; ST = 7 mm; Ef = 263 GPa | Coated Clevis | 1485 MPa | 5200 MPa |
| fcmat = 79.4 MPa; SL = 8.5 mm; ST = 7 mm; Ef = 263 GPa | Coated Clamping | 2057 MPa | 5773 MPa |
| O6 (σu) | |||
|---|---|---|---|
| Coated | SS | fcmat = 6.5 MPa | fcmat = 79.4 MPa |
| Uncoated | Clevis | 831 MPa | 1314 MPa |
| Uncoated | Clamping | 975 MPa | 1458 MPa |
| Coated | Clevis | 844 MPa | 1327 MPa |
| Coated | Clamping | 987 MPa | 1470 MPa |
Disclaimer/Publisher’s Note: The statements, opinions and data contained in all publications are solely those of the individual author(s) and contributor(s) and not of MDPI and/or the editor(s). MDPI and/or the editor(s) disclaim responsibility for any injury to people or property resulting from any ideas, methods, instructions or products referred to in the content. |
© 2024 by the authors. Licensee MDPI, Basel, Switzerland. This article is an open access article distributed under the terms and conditions of the Creative Commons Attribution (CC BY) license (https://creativecommons.org/licenses/by/4.0/).
Share and Cite
Rodríguez-Marcos, M.; Villanueva-Llaurado, P.; Fernández-Gómez, J.; Abellán-García, J.; Sisa-Camargo, A. Predicting the Tensile Properties of Carbon FRCM Using a LASSO Model. Fibers 2024, 12, 109. https://doi.org/10.3390/fib12120109
Rodríguez-Marcos M, Villanueva-Llaurado P, Fernández-Gómez J, Abellán-García J, Sisa-Camargo A. Predicting the Tensile Properties of Carbon FRCM Using a LASSO Model. Fibers. 2024; 12(12):109. https://doi.org/10.3390/fib12120109
Chicago/Turabian StyleRodríguez-Marcos, María, Paula Villanueva-Llaurado, Jaime Fernández-Gómez, Joaquín Abellán-García, and Augusto Sisa-Camargo. 2024. "Predicting the Tensile Properties of Carbon FRCM Using a LASSO Model" Fibers 12, no. 12: 109. https://doi.org/10.3390/fib12120109
APA StyleRodríguez-Marcos, M., Villanueva-Llaurado, P., Fernández-Gómez, J., Abellán-García, J., & Sisa-Camargo, A. (2024). Predicting the Tensile Properties of Carbon FRCM Using a LASSO Model. Fibers, 12(12), 109. https://doi.org/10.3390/fib12120109