Article

Corrosion and Magnetization Analyses of Iron Encapsulated Aluminum Particles by Numerical Simulations

College of Aerospace and Civil Engineering, Harbin Engineering University, Nangang District, Harbin 150001, China
*
Authors to whom correspondence should be addressed.
These two authors contribute equally to this study.
Coatings 2019, 9(9), 557; https://doi.org/10.3390/coatings9090557
Submission received: 8 July 2019 / Revised: 1 August 2019 / Accepted: 26 August 2019 / Published: 2 September 2019

Abstract

:
In this study, the effects of corrosion and magnetization on iron (Fe) encapsulated aluminum (Al) particles were uncovered through the assistance of molecular dynamic (MD) simulations and finite element analysis (FEA). The corrosion of metal particles with two phases was designed to be surrounded by O2 or H2O molecules. Next, the magnetization was simulated to be under a constant magnetic field. According to the obtained results, a portion of O2 molecules did not react with Fe atoms. They were actually adsorbed on the particle surface and the adsorption eventually reached a saturated state. However, the saturated effect did not appear to be due to the oxidation behavior of other O2 molecules. Both oxidation and adsorption effects released pressure on Fe atoms and caused different extents of displacements. Next, a similar saturated effect was also observed for adsorbed H2O molecules. At the same time, other reacted H2O molecules produced a significant amount of OH and caused charge transfer from Fe atoms. Additionally, the geometrical distribution of particles’ magnetic flux density and magnetization intensity were also studied.

1. Introduction

As the most plentiful transition metal and the fourth most abundant element stored in the crust of the Earth, Fe is a critical pillar of modern human industry [1]. In this investigation, we focus on Fe and its composite particles. Although humans have a long history of applying Fe-based products, investigations relating to Fe particles and its alloys have continued in recent years. For example, Plachy et al. investigated the impact of corrosion on carbonyl iron particles’ magnetorheological behavior. It was noted that the suspension-based particles’ yield stress and saturation magnetization were reduced because of the induced oxidation effect [2]. Without the attendance of reductant gas, Wang et al. have announced a novel method to prepare α-Fe microparticles with qualified activity, and the saturating magnetization of produced particles is as high as 138.5 emu/g [3]. Motozuka et al. reported a graphite particle-based ball milling process to form fibre texture on Fe particles. It was deduced that uniaxial compression and multidirectional-rooling-like deformation in ball milling typically worked on the formation of texture [4]. Moreover, Fe nanoparticles also showed their outstanding performance in recycling lindane production wastes [5]. In the field of intelligent sensors, Fe-based particles also have played critical roles and attracted much attention. For wearable sensors with high bending and strain properties, Cheng synthesized Fe3O4@AuNWs particles with a magnetic sensing function. Those reported particles were connected with golden wires that maintained good electrical conductivity and showed highlights on soft wearable sensors [6]. Furthermore, Fe and its alloy-based particles were also appropriate for sensors for hydrogen gas detection [7], long-period fiber grating (LPFG) corrosion [8], and mining waste water and soil leachate detection [9].
As one of the Earth’s most abundant metallic elements, Al has shown outstanding electrical, mechanical and thermal properties in many applications [10]. For example, one application of Al and its alloys relates to new energy resources. Generally, the mechanism of hydrogen production through Al and its alloys has been previously reviewed by Wang [11]. Specifically, many published original studies were accomplished by experimental characterizations and tests [12,13,14,15,16,17], while some other investigations were based on numerical simulations [18,19,20]. Furthermore, another conventional application is in the field of energetic materials, as pure Al shows excellent reaction and explosion properties while being exposed in atmosphere [21]. Al particles, especially nano-sized particles, have been widely applied as propellants, explosives and pyrotechnics in industry [22].
It has been noted that ignition characteristics of Al solid propellants would be improved if a transition metal layer was coated on an Al powder surface [23]. As an alternative transition metal, Fe could be selected as a coating material for higher potential performances. Currently, studies relating to Fe encapsulated Al particles are still lacking. Previously, some other core-shell investigations have been reported [10,24,25,26]. In this study, we mainly focused on corrosion and magnetization of Fe encapsulated Al particles. Corrosion behaviors of particles were studied by molecular dynamic (MD) simulations, and magnetization states were estimated by finite element analysis (FEA). It was expected that this investigation would not only provide basial support for Fe–Al applications, such as solid propellants, hydrogen sources and intelligent sensors, but also enlarge the scope of Fe–Al industrial applications. Moreover, this work could also be considered as preparation for necessary experimental studies to be conducted in the future.

2. Methods

2.1. MD Simulation System and Settings

Governed by Newton’s second law, MD simulations can efficiently provide coordinates of each atom and further estimate the dynamic behaviors of the overall system [27]. All MD simulations in this work were accomplished by the LAMMPS package (stable version, 2018) [28]. In order to simulate the effect of H2O/O2 corrosion on Fe encapsulated Al particles, we created a virtual model comprising a Fe–Al composite particle with H2O or O2 molecules, respectively. There were two types of potential functions applied in this study. One was a ReaxFF force field and the other was an embedded atom method (EAM) force field. The potential of ReaxFF was introduced by Duin [29]. It was designed to simulate practical chemical reactions on the basis of MD simulations and this characteristic truly overcame the barrier of conventional MD simulations. Specifically, reactions are described by bond breaking and formation judged by the calculation of interatomic bond-orders [30]. By ReaxFF, the energy of the system can be obtained by the critical many-body empirical potential terms in Equations (1) and (2) [31].
E system = E bond - dependent + E vdW + E Coul
E bond - dependent = E bond + E over
where Esystem is the total energy of system; Ebond-dependent is the bond order-dependent energy; EvdW is the van der Waals energy; ECoul is the Coulomb interaction energy; Ebond is the bond energy; and Eover is the penalty for over-coordinated energy. The performed ReaxFF file was developed by Skin et al. [31]. It was trained for Fe/Al/Ni alloys by quantum mechanical calculation and relative parameters have been presented in their work. Next, an EAM potential function developed by Mendelev [32] was applied to describe interatomic interactions of Al and Fe at the equilibrating stage. This stage was performed before corrosion estimations in order to obtain a stabilized Fe–Al composite particle. In EAM potential, the total energy of each atom can be computed by Equation (3).
E i = F α   [ j i ρ β ( r i j ) ] + 1 2 j i ϕ α β ( r i j )
where E is the total energy of the atom; F is the embedding energy; ρ is the atomic electron density; Φ is the pair potential interaction; α and β are element types; and i and j are atomic IDs. Parameters of this force field were obtained by correcting specified potential functions to experimental properties of Fe–Al alloy.
Limited by computing capability of reactive MD simulations, creating a mesoscopic particle was unpractical in this study. Therefore, we designed an Al core with a radius of 4 nm. The core was encapsulated by a Fe layer with 2-nm thickness. There were 16,100 Al atoms and 54,460 Fe atoms with fcc- and bcc-style crystals, respectively. The composite particle was equilibrated for about 1 ns under EAM potential and the running timestep was set as 1 fs. According to the real environment, the temperature of the particle was controlled to be around 300 K (room temperature) by canonical ensemble (NVT). Rendered by OVITO software (version 2.9.0) [33], the equilibrated Fe–Al composite particle is presented as Figure 1.
Next, a large number of potential reactants were packed randomly around the composite particle. The packing optimization was accomplished by the PACKMOL program [34]. Corrosion behaviors were investigated individually in this study, so different kinds of reactants were not mixed. As Figure 2 shows, there were 7430 oxygen gas molecules placed in system 1# and 2400 water molecules placed in system 2#. As guided by previous studies [19], the temperatures of O2 and H2O molecules were fixed at 1000 K in order to increase the rate of reactions. Similar to the equilibrating process, metal atoms were still kept at 300 K and the Nose [35]/Hoover [36] thermostat method was also applied to the reaction processes. Although the reaction mainly happened within 0.5 ns, both simulations were performed in total for approximately 1 ns with a timestep of 0.25 fs.

2.2. Magnetization Simulations

All magnetization simulations in this study were accomplished by the Magnetic Fields functionality of the AC/DC module in FEA software with multiphysics, in which numerical simulations of multiphysics fields can be solved via time-domain, stationary, and frequency-domain studies [37]. Since the particle was planned to be magnetized under a constant magnetic field, stationary studies were performed in this investigation. The basis of the magnetic fields solver in this study was Maxwell equations [38]. Those equations are generally presented as Equation (4).
E ¯ d l = B ¯ t d S D ¯ d S = ρ d V H ¯ d l = ( j + D ¯ t ) d S B ¯ d S = 0
where H ¯ is the magnetic field vector; B ¯ is the magnetic flux density; ρ is the volume density of exterior charges; D ¯ is the bias current vector; j is the current density; S is the surface square; and l is the distance.
In MD simulations, the model was required to be built at the nano scale due to the consideration of computing cost. However, in FEA applications, the geometry of the particle could be created according to its real size. Initially, an Al core with radius of approximately 40 µm was built in the work plane. Then, a 20-µm thick Fe layer was coated on the Al core surface to create the Fe–Al composite particle. Next, the atmosphere was represented by an air region with a 50-µm thickness and an infinite element region with a 20-µm thickness at the outermost layer of the sphere. Within the category of “Magnetic Fields, No Current”, a constant background magnetic field was assigned as 100000 A/m along the z-axis of the geometry. Generally, the magnetization model is presented as Figure 3 below.

3. Results and Discussion

3.1. Oxygen Involved Corrosion Behaviors for Fe Encapsulated Al Particle

In an atmospheric environment, metal particles are prone to be oxidized and this will obviously have negative effects on their application. Based on system 1#, this section discusses the oxidation behaviors of Fe encapsulated Al particles. Figure 4 is the configuration of the Fe–Al particle’s outside surface after oxidation reaction. It shows that the surface of the Fe coating layer was covered by oxygen atoms and molecules. By statistical analysis, there were a total of 8698 oxygen atoms within the radius of the Fe–Al particle after 1 ns. They were respectively supplied from 1364 adsorbed and 2985 consumed O2 molecules. In Figure 4, many adsorbed O2 molecules with complete configurations on the particle surface could be directly distinguished, while those reacted oxygen atoms were imbedded into the Fe layer and further formed Fe oxide. Thus, the particle surface mainly consisted of three components, namely, unreacted Fe, Fe oxide and adsorbed O2 molecules. Moreover, the rate of reaction and adsorption processes could be simply demonstrated by the decrease of the system’s potential energy. As the most explicit change happened in the very initial stages, only the potential energy in the first 150 ps is plotted in Figure 5. It seems that the first 20 ps was a rapid Fe–O contact period, during which large number of O2 molecules were adsorbed on the Fe surface and a portion were consumed by reactions with Fe atoms. After, the decrease of potential energy was slow and stable, meaning that the Fe–O contact continued but was much slower than before. In order to demonstrate adsorption and reaction behaviors respectively, the adsorption and reaction curve is presented by Figure 6, in which both reaction and adsorption curves successfully validate the rapid Fe–O contact period obtained from Figure 5. It shows that the number of adsorbed O2 molecules was a little higher than the reacted molecule. In other words, the reaction effect was weaker than adsorption in this period. However, the number of adsorbed O2 molecules was saturated after 30 ps. Since then, maximum adsorption fluctuated around 1364 molecules. As for the Fe–O reaction, the behavior was stable until the end of this simulation. It was observed that the stabilized reacting rate was approximately 2 molecules per picosecond. Therefore, it could be deduced that the decrease of potential energy after 30 ps was mainly caused by the Fe–O reaction.
In addition to the statistics of the oxygen involved in reaction and adsorption, another critical issue is the change of particle configuration itself. Figure 7 shows the cross section of the Fe–Al particle with a 20-Å thickness. The snapshot is coloured by the extent of atom displacement. Because of the adsorption and reaction effect, some local displacement concentrations appeared on several parts of the surface. Then, this concentration effect was spread into the interface of Fe and Al. From the figure, the boundary of the two metal phases can be explicitly presented, as the extent of its displacement is much larger than other parts. To some extent, the displacement concentration was also the stress concentration. By plotting the radial stress distribution of the Fe encapsulated Al particle in Figure 8, the stress concentration on the outer surface and phase interface could be clearly presented. As the plot shows, there were two peaks of stress from the core to the shell. The location of the two peaks was in line with the initial design of the Fe–Al interface and particle radius. Generally, Figure 7 and Figure 8 show the distribution of displacement and stress for the encapsulated particle in the oxidation process. Initially, surface Fe atoms were pressed by O2 molecules and displaced by adsorption and reaction effects. Next, the displacement was conducted inward through atom stress. Finally, the stress was uniformly distributed on the Fe–Al interface and caused further displacement.

3.2. Water Involved Corrosion Behaviors for Fe Encapsulated Al Particle

In addition to the O2 attended corrosion discussed above, another corrosive matter for metal particles is H2O molecules. In this section, the single reactive source of H2O was simulated on the basis of system 2#. Figure 9 is an enlarged view of the particle surface at 100 ps. The selection of the surface was random in order to demonstrate the transient state of the corrosion process. As Figure 9 shows, there were two types of components on the particle surface. One was adsorbed H2O molecules, and the other was OH disassociated from consumed H2O molecules. Additionally, free H2O and H2 molecules can also be observed in the figure. As the reactant in this section, water molecules with high kinetic energy would be more likely to contact the Fe surface and, thus, we applied separated temperature control for higher computing efficiency. In this study, the extent of H2O diffusion is represented by mean square displacement (MSD). The MSD result is plotted as Figure 10 below, in which MSD values at 10, 30 and 50 ps are selected to further calculate the slop and diffusion coefficient [39]. It was found that the diffusion coefficient was about 0.0193 cm2/s.
Similar to the O2 adsorption behaviors, the saturated adsorption phenomenon also appeared in system 2#. In Figure 11, 52 ps was a critical point for the overall process. Before this point, the system was under a rapid adsorption stage. Then, the number of adsorbed H2O molecules stabilized around 1752. In the rapid adsorption stage, a large number of H2O molecules were captured by the Fe encapsulated Al particle. Some of these were retained on the particle surface, while other molecules were consumed. Through Figure 12, it seems that the reaction was not started immediately. According to a previous study, the disassociation of H2O molecules should be assisted by a neighboring molecule [19]. Thus, the density of neighboring H2O molecules was not enough before 25 ps. After, the system experienced rapid and slow reaction stages, respectively. Finally, the reaction curve also trended to equilibrium. Figure 13 shows the distribution of the particle charge at the end of this simulation. Due to the H2O involved corrosion effect, a Fe layer with high charge values was formed on the particle surface. It seems that the layer was about one atom thick and atoms on the second layer were not affected. The relatively high charge distribution displayed the formation of iron hydroxide. Differently from the oxidation effect, those hydroxides were only located on the surface of the particle and did not have impacts on inner metal atoms.

3.3. Magnetization Properties of Fe Encapsulated Al Particles

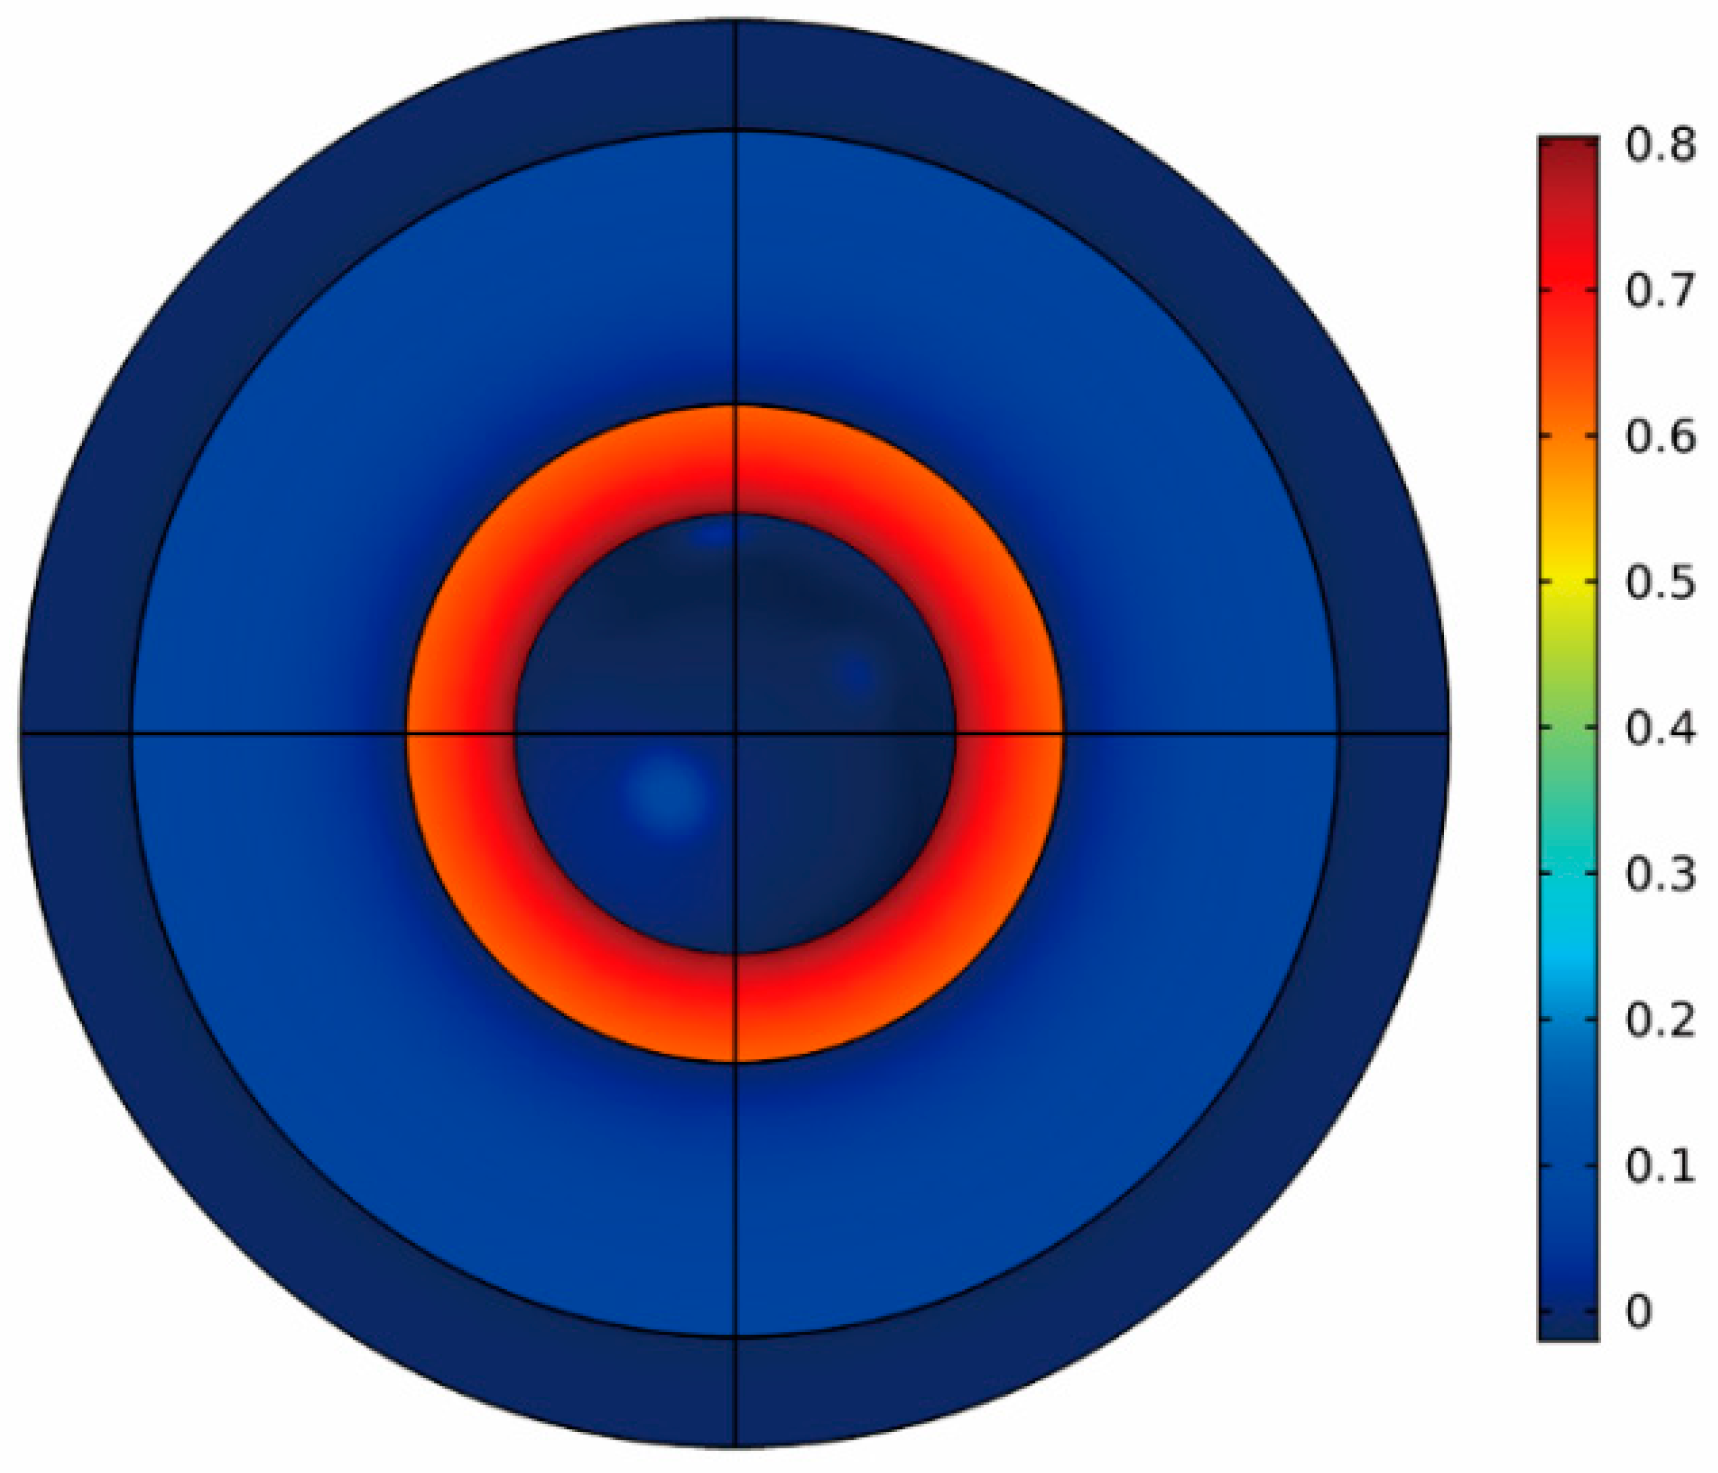
The magnetization of particles could be considered a basal step before exploring its further applications. Figure 14 demonstrates the magnetic flux density of the Fe encapsulated Al particle along the z-axis, in which one-quarter of the particle is sliced in order to show its inner distribution. It shows that the magnetic flux is mainly concentrated around the middle of the particle, but is rare at the top and bottom of the particle. Al is a typical paramagnetic metal material, which has weak magnetic characteristics under a magnetic field. According to the initial materials’ parameters in the computing program, the relative permeability (permeability of the medium/permeability of free space, H/m) of Al equals 1, which means that the permeability of Al is too weak for magnetic flux. Due to the initial direction of flux, two magnetic flux-rich regions would be formed at low cross-sectional areas. Figure 15 shows the statistical distribution of magnetic flux density for half of the Fe cross-sectional area. In order to demonstrate the numerical distribution of magnetic flux density on the Fe layer, the 180° area was equally divided into seven sections with radius of approximately 50 µm. The point vertically under the geometrical center of the sphere was set as the 0° point. According to Figure 15, the distribution of magnetic flux density from 0° to 180° was almost symmetrical. It is found that the peak of magnetic flux density was approximately 0.673 T, while the minimum point was approximately 0.249 T. Figure 14 and Figure 15 show the vertical distribution of magnetic flux density, but are unable to show the horizontal distributions. Therefore, the top view of the half sphere is shown in Figure 16. From the figure, it is conformed that the horizontal distribution of magnetic flux density for the Fe cross-section was uniform, and the Fe layer was explicitly in contrast to Al and air regions.
Figure 17 shows the side elevation of the Fe encapsulated Al particle colored by magnetization intensity. The figure was prepared to demonstrate the extent and distribution of particle magnetization. From the figure, the middle cross section, which was almost vertical to the background magnetic field direction, had the highest extent of magnetization. This result is in good agreement with the magnetic flux density result and their physical relationships. As Figure 18 shows, the maximum magnetization intensity was approximately 535370 A/m, while the minimum value was approximately 197760 A/m. The deviation of magnetization intensity between 180° and 0° points was about 4720 A/m. Furthermore, the horizontal magnetization intensity distribution of the Fe cross-section is presented in Figure 19. Combined with Figure 17, it could be deduced that the Fe coating will form uniform annular magnetization layers with different extents of magnetization intensity, and that its vertical distribution is closely related to the background magnetic field.

4. Concluding Remarks

This work represents a basial step in estimating Fe encapsulated Al particles. Both MD simulations and FEA have been performed to investigate the corrosion and magnetization of the particle. To some extent, the obtained results have clearly presented relative details of Fe encapsulated Al particles. This work is difficult to achieve by conventional experiments and is critical for future applications. The corrosion behavior of O2 showed that the adsorbed oxygen atoms can be simply divided into two types: adsorbed O2 molecules and reacted oxygen atoms. Limited by the availability of adsorbing sites, the adsorbed curve was saturated eventually, while the oxidation reaction lasted from the beginning until the end. As more and more oxygen atoms were imbedded into the particle, the surface Fe atoms were inevitably displaced and released stress on inner atoms. It is shown that those atoms on the Al–Fe interface were affected more explicitly than other core atoms. In terms of H2O molecules, their adsorption curve was similar to the former, and their reaction curve contained four stages. Initially, H2O molecules needed to be gathered until there were enough neighboring molecules. Then, the system experienced rapid and slow reaction stages, respectively. Finally, the reaction trended to equilibrium. As many hydroxides were produced, the charge of surface Fe atoms was higher than that of inner atoms.
The magnetization of Fe encapsulated Al particles was considered to be under a static magnetic field. It is concluded that the distribution of magnetic flux and magnetization intensity are closely related to the direction of the magnetic field. Along the magnetic field, the extent of magnetization was almost symmetrical, and the peak was at the middle of the Fe layer. In the horizontal direction, the distribution of magnetic flux density and magnetic intensity were uniform.

Author Contributions

Writing-original draft preparation, J.G.; Conceptualization, R.S.; Project administration, H.Q.; Data curation, F.L.

Funding

The authors gratefully acknowledge the support from the Fundamental Research Funds for Central Universities (3072019CF0205).

Conflicts of Interest

The authors declare that they have no conflict of interest.

Abbreviations

FeIron
AlAluminum:
MDMolecular dynamic
FEAFinite element analysis
LPFGLong period fiber gratings
EAMEmbedded atom method
NVTCanonical ensemble
MSDMean square displacement

References

  1. Huber, D.L. Synthesis, properties, and applications of iron nanoparticles. Small 2005, 1, 482–501. [Google Scholar]
  2. Plachý, T.; Kutalkova, E.; Sedlacik, M.; Vesel, A.; Masar, M.; Kuritka, I. Impact of corrosion process of carbonyl iron particles on magnetorheological behavior of their suspensions. J. Ind. Eng. Chem. 2018, 66, 362–369. [Google Scholar] [CrossRef]
  3. Wang, J.; Shao, X.; Tian, G.; Li, Z.; Bao, W. Preparation and properties of a-Fe microparticles with high stability. Mater. Lett. 2017, 192, 36–39. [Google Scholar] [CrossRef]
  4. Motozuka, S.; Ikeda, T.; Miyagawa, T.; Sato, H.; Morinaga, M. Formation process of the {001} fiber texture on iron particles using simple ball milling. Powder Technol. 2017, 321, 9–12. [Google Scholar] [CrossRef]
  5. Dominguez, C.M.; Romero, A.; Fernandez, J.; Santos, A. In situ chemical reduction of chlorinated organic compounds from lindane production wastes by zero valent iron microparticles. J. Water Process. Eng. 2018, 26, 146–155. [Google Scholar] [CrossRef]
  6. Yap, L.W.; Shi, Q.; Gong, S.; Wang, Y.; Chen, Y.; Zhu, C.; Gu, Z.; Suzuki, K.; Zhu, Y.; Cheng, W. Bifunctional Fe3O4@AuNWs particle as wearable bending and strain sensor. Inorg. Chem. Commun. 2019, 104, 98–104. [Google Scholar] [CrossRef]
  7. Monamary, A.; Vijayalakshmi, K.; Jereil, S.D. Fe overlayered hybrid TiO2/ITO nanocomposite sensor for enhanced hydrogen sensing at room temperature by novel two step process. Sens. Actuators B Chem. 2019, 287, 278–289. [Google Scholar] [CrossRef]
  8. Guo, C.; Fan, L.; Wu, C.; Chen, G.; Li, W. Ultrasensitive LPFG corrosion sensor with Fe-C coating electroplated on a Gr/AgNW film. Sens. Actuators B Chem. 2019, 283, 334–342. [Google Scholar] [CrossRef]
  9. Hwang, J.H.; Pathak, P.; Wang, X.; Rodriguez, K.L.; Park, J.; Cho, H.J.; Lee, W.H. A novel Fe-chitosan-coated carbon electrode sensor for in situ As(III) detection in mining wastewater and soil leachate. Sens. Actuators B Chem. 2019, 294, 89–97. [Google Scholar] [CrossRef]
  10. Yi, Q.; Xu, J.; Liu, Y.; Zhai, D.; Zhou, K.; Pan, D. Molecular dynamics study on core-shell structure stability of aluminum encapsulated by nano-carbon materials. Chem. Phys. Lett. 2017, 669, 192–195. [Google Scholar] [CrossRef]
  11. Wang, H.; Leung, D.Y.; Leung, M.K.; Ni, M. A review on hydrogen production using aluminum and aluminum alloys. Renew. Sustain. Energy Rev. 2009, 13, 845–853. [Google Scholar] [CrossRef]
  12. Ilyukhina, A.; Kravchenko, O.; Bulychev, B. Studies on microstructure of activated aluminum and its hydrogen generation properties in aluminum/water reaction. J. Alloy. Compd. 2017, 690, 321–329. [Google Scholar] [CrossRef]
  13. Thampi, K.R.; Newell, A. Novel amorphous aluminum hydroxide catalysts for aluminumewater reactions to produce H2 on demand. Int. J. Hydrog. Energy 2017, 42, 23446–23454. [Google Scholar]
  14. Zou, H.; Chen, S.; Zhao, Z.; Lin, W. Hydrogen production by hydrolysis of aluminum. J. Alloy. Compd. 2013, 578, 380–384. [Google Scholar] [CrossRef]
  15. Liu, H.; Yang, F.; Yang, B.; Zhang, Q.; Chai, Y.; Wang, N. Rapid hydrogen generation through aluminum-water reaction in alkali solution. Catal. Today 2018, 318, 52–58. [Google Scholar] [CrossRef]
  16. Elitzur, S.; Rosenband, V.; Gany, A. Study of hydrogen production and storage based on aluminum–water reaction. Int. J. Hydrogen Energy 2014, 39, 6328–6334. [Google Scholar] [CrossRef]
  17. Shmelev, V.; Nikolaev, V.; Lee, J.H.; Yim, C. Hydrogen production by reaction of aluminum with water. Int. J. Hydrogen Energy 2016, 41, 16664–16673. [Google Scholar] [CrossRef]
  18. Shimojo, F.; Ohmura, S.; Kalia, R.K.; Nakano, A.; Vashishta, P. Molecular dynamics simulations of rapid hydrogen production from water using aluminum clusters as catalyzers. Phys. Rev. Lett. 2010, 104. [Google Scholar] [CrossRef]
  19. Russo, M.F.; Li, R.; Mench, M.; Van Duin, A.C. Molecular dynamic simulation of aluminum–water reactions using the ReaxFF reactive force field. Int. J. Hydrogen Energy 2011, 36, 5828–5835. [Google Scholar] [CrossRef]
  20. Sun, R.; Liu, P.; Qi, H.; Liu, J.; Ding, T. Molecular dynamic simulations of ether-coated aluminum nano-particles as a novel hydrogen source. J. Nanoparticle Res. 2019, 21, 72. [Google Scholar] [CrossRef]
  21. Kim, K.T.; Kim, D.W.; Kim, S.H.; Kim, C.K.; Choi, Y.J. Synthesis and improved explosion behaviors of aluminum powders coated with nano-sized nickel film. Appl. Surf. Sci. 2017, 415, 104–108. [Google Scholar] [CrossRef]
  22. Vorozhtsov, A.; Lerner, M.; Rodkevich, N.; Nie, H.; Abraham, A.; Schoenitz, M.; Dreizin, E.; Dreizin, E. Oxidation of nano-sized aluminum powders. Thermochim. Acta 2016, 636, 48–56. [Google Scholar] [CrossRef] [Green Version]
  23. Timothy, A.; Shafirovich, E.A.; Varma, A. Ignition of iron-coated and nickel-coated aluminum particles under normal and reduced-gravity conditions. J. Propuls. Power 2008, 24, 805–813. [Google Scholar]
  24. Sundaram, D.S.; Puri, P.; Yang, V. Thermochemical behavior of nickel-coated nanoaluminum particles. J. Phys. Chem. C 2013, 117, 7858–7869. [Google Scholar] [CrossRef]
  25. Sundaram, D.S.; Puri, P.; Yang, V. Thermochemical behavior of nano-sized aluminum-coated nickel particles. J. Nanoparticle Res. 2014, 16, 2392. [Google Scholar] [CrossRef]
  26. Hong, S.; Van Duin, A.C.T. Atomistic-scale analysis of carbon coating and its effect on the oxidation of aluminum nanoparticles by reaxff-molecular dynamics simulations. J. Phys. Chem. C 2016, 120, 9464–9474. [Google Scholar] [CrossRef]
  27. Lin, P.; Colina, C.M. Molecular simulation of protein–polymer conjugates. Curr. Opin. Chem. Eng. 2019, 23, 44–50. [Google Scholar] [CrossRef]
  28. Plimpton, S. Fast parallel algorithms for short-range molecular dynamics. J. Comput. Phys. 1995, 117, 1–19. [Google Scholar] [CrossRef]
  29. Van Duin, A.C.T.; Dasgupta, S.; Lorant, F.; Goddard, W.A. ReaxFF: A reactive force field for hydrocarbons. J. Phys. Chem. A 2001, 105, 9396–9409. [Google Scholar] [CrossRef]
  30. Wang, N.; Peng, J.; Pang, A.; He, T.; Du, F.; Jaramillo-Botero, A. Thermodynamic simulation of the RDX–aluminum interface using ReaxFF molecular dynamics. J. Phys. Chem. C 2017, 121, 14597–14610. [Google Scholar] [CrossRef]
  31. Kwak, H.; Zou, C.; Vasenkov, A.V.; Van Duin, A.C.T.; Shin, Y.K. Development and validation of a ReaxFF reactive force field for Fe/Al/Ni alloys: Molecular dynamics study of elastic constants, diffusion, and segregation. J. Phys. Chem. A 2012, 116, 12163–12174. [Google Scholar]
  32. Mendelev, M.; Srolovitz, D.; Ackland, G.; Han, S.; Ackland, G. Effect of Fe segregation on the migration of a non-symmetric Σ5 tilt grain boundary in Al. J. Mater. Res. 2005, 20, 208–218. [Google Scholar] [CrossRef]
  33. Alexander Stukowski, Visualization and analysis of atomistic simulation data with OVITO—The Open Visualization Tool. Model. Simul. Mater. Sci. Eng. 2010, 18, 1–7.
  34. Martinez, L.; Andrade, R.; Birgin, E.G.; Martínez, J.M. PACKMOL: A package for building initial configurations for molecular dynamics simulations. J. Comput. Chem. 2009, 30, 2157–2164. [Google Scholar] [CrossRef] [PubMed]
  35. Nosé, S. A unified formulation of the constant temperature molecular dynamics methods. J. Chem. Phys. 1984, 81, 511. [Google Scholar] [CrossRef]
  36. William, G. Hoover, Canonical dynamics: Equilibrium phase-space distributions. Am. Phys. Soc. 1984, 31, 1695–1697. [Google Scholar]
  37. Butler, S.; Zhang, Z. Forward modeling of geophysical electromagnetic methods using Comsol. Comput. Geosci. 2016, 87, 1–10. [Google Scholar] [CrossRef]
  38. Soltanova, D.; Baranov, P.; Baranova, V.; Chudinova, A. Simulating magnetic field of a ferromagnetic pipe underwater in COMSOL Multiphysics. IOP Conf. Ser. Mater. Sci. Eng. 2015, 93, 012023. [Google Scholar] [CrossRef]
  39. Liu, P.; Sun, R.; Liu, J. Adsorption behaviors of ether and aluminum surface: A molecular dynamics study. Int. J. Mod. Phys. B 2019, 33, 1950028. [Google Scholar] [CrossRef]
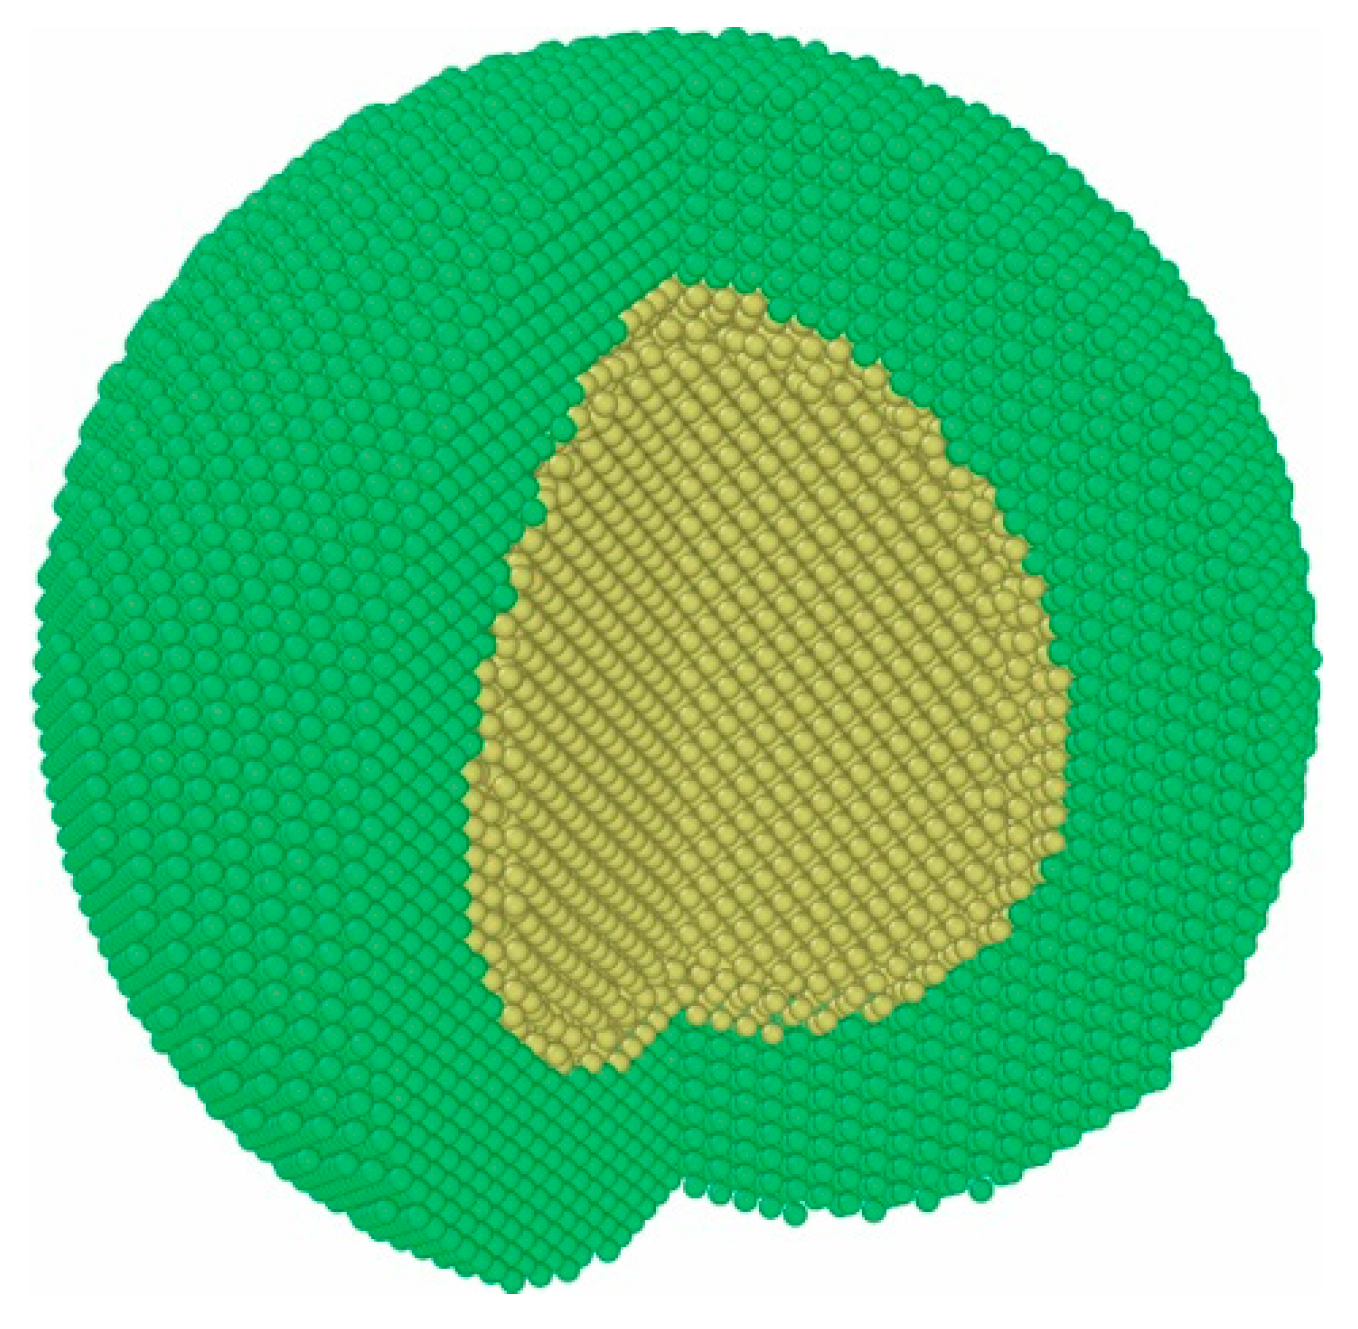
Figure 1. The snapshot of the Fe encapsulated Al particle.
Coatings 09 00557 g001
Figure 2. Snapshots of (a): system 1# and (b): system 2#.
Coatings 09 00557 g002
Figure 3. Snapshot of magnetization model with vertical magnetic field consisting of (a): infinite element region; (b): air region; (c): Al core and (d): Fe coating layer.
Coatings 09 00557 g003
Figure 4. Snapshot of Fe encapsulated Al particle surface at 1 ns.
Coatings 09 00557 g004
Figure 5. Plot of potential energy changes as a function of time.
Coatings 09 00557 g005
Figure 6. Number of adsorbed and reacted oxygen gas molecules as a function of time.
Coatings 09 00557 g006
Figure 7. Snapshots of the cross section of displacement (Å) distributions of Fe encapsulated Al particle at 300 K.
Coatings 09 00557 g007
Figure 8. The radial stress distribution of Fe–Al particle at 1 ns.
Coatings 09 00557 g008
Figure 9. Snapshot of the Fe–Al particle surface with H2O, OH and H2 at 100 ps.
Coatings 09 00557 g009
Figure 10. Plot of the mean square displacement (MSD) result for H2O molecules in the first 50 ps.
Coatings 09 00557 g010
Figure 11. Plot of adsorption curve for H2O molecules from 0 to 200 ps.
Coatings 09 00557 g011
Figure 12. Plot of consumption curve for H2O molecules: (a) 0–25 ps; (b) 25–55 ps; (c) 55–175 ps; (d) 175–1000 ps.
Coatings 09 00557 g012
Figure 13. Snapshot of particle’s charge distribution from core to shell at 1 ns (unit: multiple of electron charge).
Coatings 09 00557 g013
Figure 14. The side elevation of three-quarters of the sphere colored by magnetic flux density (T).
Coatings 09 00557 g014
Figure 15. The statistical distribution of magnetic flux density for Fe coating from 0° to 180°.
Coatings 09 00557 g015
Figure 16. The top elevation of half of the sphere colored by magnetic flux density (T).
Coatings 09 00557 g016
Figure 17. The side elevation of three-quarters of the sphere colored by magnetization intensity (A/m).
Coatings 09 00557 g017
Figure 18. The statistical distribution of magnetization intensity for Fe coating from 0° to 180°.
Coatings 09 00557 g018
Figure 19. The top elevation of half of the sphere colored by magnetization intensity (A/m).
Coatings 09 00557 g019