Article

The Corrosion Resistance of Aluminum–Bronze Coatings as a Function of Gas Pressure Used in the Thermal Spraying Process

Grupo de Investigación en Corrosión, tribología y Energía, Department of Mechanical and Mechatronics Engineering; Universidad Nacional de Colombia, Bogotá 111321, Colombia
*
Author to whom correspondence should be addressed.
Coatings 2019, 9(8), 507; https://doi.org/10.3390/coatings9080507
Submission received: 17 July 2019 / Revised: 4 August 2019 / Accepted: 8 August 2019 / Published: 10 August 2019

Abstract

:
We report the results of the influence of acetylene and oxygen gas pressure on the corrosion resistance of bronze–aluminum coatings deposited on a naval brass substrate by means of the thermal (flame) deposition process. The coatings were characterized by means of scanning electronic microscopy (SEM), energy-dispersive X-ray spectrometry (EDS), X-ray diffraction (XRD), X-ray fluorescence (XRF), and transmission electron microscopy (TEM). The corrosion tests were carried out via Tafel and electrochemical impedance spectroscopy (EIS). In addition, some samples were selected in order to investigate heat treatment and its effects on corrosion resistance. The results indicate that changes in the pressure and flow of the gas affects the composition, morphology, and physical properties of the coatings, and these effects have consequences for the behavior of the coatings when they are immersed in corrosion environments. The collision speed of the particles was identified as the most significant factor that influences the properties and the performance of the coating. The gas pressure modified the oxides and the porosity level, which improved the corrosion resistance.

1. Introduction

In industry, there is a need to improve the processes of protection and repair of naval, automotive, and aeronautical components. These structural elements are in a marine environment in the transportation system, where the high degree of deterioration, wear, and marine corrosion causes loss of material. In order to reduce the corrosion rate of these components, the application of protective coatings using thermal spraying is a strategy that has undergone rapid development in recent years. These techniques seek to extend the useful life of the components in the face of the difficulties of fabrication and the rise in price of the components in the replacement process. The practice of installing a new piece or discarding it once it has been worn out and replacing it with a spare part has been reduced, and now there is a tendency to install parts with protective coatings produced by thermal spraying.
Some of the parts that fail most in the naval sector are made with bronze alloys, for example propellers, pumps, shafts, pipes, and bushings. As mentioned above, an economical and efficient alternative for protecting these components is the use of flame spraying. For this purpose, an aluminum–bronze alloy can be used, which is a good alternative for replacing parts subjected to corrosive environments [1] and which has a chemical composition very similar to that exhibited by the components that are used in the transportation industry.
Previously, several researchers have produced Cu–Al coatings according to the application recommendations of the suppliers, but they have not obtained improvements in the quality of the coatings in terms of adherence, mechanical properties, and corrosion resistance [2]. In order to optimize the results, the coatings have been deposited while changing the work distance and substrate roughness, and the effect of the pretreatment of the surface using different physical and chemical methods has been studied [3]. However, a combination of parameters relating to the combustion and gas projection pressure for producing better strength and good adhesion has not been found. Aluminum–bronze coatings have good wear and corrosion resistance properties because a copper oxide layer is formed on the surface. They are recommended for the protection and dimensional restoration of parts that are subject to harsh operating conditions [1].
In the process of thermal projection by combustion, the chemical energy of combustible and combustion gases is used for the generation of the flame responsible for melting the projected particles. Oxyacetylene torches use a mixture of acetylene (C2H2) and oxygen (O2), which in a stoichiometric ratio produces a flame that reaches a temperature of up to 3386 K at 1 atmosphere of pressure [4]. An oxidant or highly oxidizing flame is when an excess of oxidizer is applied, and as a result, a primary reaction zone (cone of the flame) is obtained that is much longer than in a reductive flame or a stoichiometric flame. The particles stay longer in the hottest area of the flame, and therefore they can achieve better heating.
The axial and radial temperature distribution and the changes in the velocity of the flame gases significantly affect the temperature of the particles and their behavior in flight, which influences the quality of the coating. The hot gases generated by combustion undergo complex events that involve heat and mass transfer phenomena in the boundary layers of the particle [5]. In order to predict the thermal effect of a particle in flight during the process of thermal projection by an oxyacetylene flame, numerical simulations have been made using Jets & Poudres software, 2019 [6]. This software is based on the GENMIX computer code, which was developed by Spalding and Patankar [7], and was improved by the use of thermodynamic and transport properties related to the local temperatures and the composition of the thermal sources that it simulates. Some of the most important conclusions of the two earlier studies were that the thermodynamic and kinetic parameters of the deposition were controlled by a combination of deposition conditions, such as the pressure, working distance, temperature of flame or substrate, and surface preparation, which in turn affects the properties of the coatings produced. Thermal spraying by flame is an effective system for modifying the microstructure of the coating, as the configuration of the deposition parameters can control the impact velocity of the particle from the flame towards the substrate, and this can be used to modify the properties of the coating. These studies have focused on the microstructural, corrosion, and mechanical properties of the coatings. However, to the authors’ knowledge, no studies have reported the effect of the collision speed of the particles on the electrochemical behavior of bronze–aluminum coatings deposited via thermal spraying. Furthermore, there are no studies related to investigating heat treatment and its effects on the corrosion resistance of these coatings.
Therefore, the main objective of this research was to study the effect of the pressure of the feed gases on the corrosion resistance of the aluminum–bronze coatings that were deposited via thermal spraying by flame. To understand the effect of the gas pressure on the chemical and structural properties of the coatings deposited, previous simulations with the Jets & Poudres software were done, which allowed us to establish the main thermodynamic and kinetic parameters during the growth of the coating. Furthermore, in the present paper we have concentrated on improving the quality of the coatings produced; in particular, heat treatment was carried out in order to improve the density and adherence of the system produced.

2. Materials and Methods

Before the application of the coatings, numerical simulations were carried out with the Jets & Poudres software (SPCTS, UMR-CNRS 6638 University of Limoges, 123, avenue Albert Thomas 87060 Limoges Cedex, France), in order to predict the behavior of the particles during the transport from the combustion zone to the substrate surface in the process of thermal spraying under different gas pressures. The Jets & Poudres software allows one to control the gas and the material feed conditions in order to simulate the thermodynamic variables during the spraying process of the material. This software is used to estimate the effect of the geometry of the torch nozzle and the volumetric flow of the gases involved in the combustion.
Proxon 21071 powders (Castolin Eutectic, Messer Castolin Eutectic, Frankfurt, Germany) were used to produce the sample coatings by means of the flame thermal spray process. This raw material is a bronze–aluminum alloy (10% Al; 0.6% Si; Fe 2%; 87.4% Cu) used to recover soft sliding surfaces in the naval industry and is distinguished by its machinability. The aluminum–bronze coatings were obtained by the technique of thermal projection by flame, using TeroDyn® System 2000 equipment (Castolin Eutectic, Messer Castolin Eutectic, Frankfurt, Germany). The coatings were produced by varying the feed pressures of the combustion gases, oxygen and acetylene. For the application of the aluminum–bronze coatings, experimental variation of the combustion gases was carried out. Table 1 presents the factors and their levels for the design of the experiment, which allowed us to see the modification of the feed pressures. During the fabrication of the coating, the projection distance was maintained at 160 mm, the preheating temperature of the substrate was maintained at approximately 367 K, the compressed air pressure was 275.8 kPa, and a flat position was used. The coatings were deposited on a navy brass substrate UNS No. C46400 (Cu 60%, Zn 39.25% and Sn 0.75% and lead-free) of 25 mm in diameter.
The surface of the substrates was prepared by sanding with abrasive paper from #80–100, and then the surface was shot blasted with Al2O3 (aluminum oxide) with a particle size of 100 μm “No. 24” at a pressure of 689.5 kPa for 30 s. Then the cleaning of the surface was continued using dry air under pressure to remove the waste from the shot blasting. The average rugosity of the substrate was approximately 30 μm. In order to improve the quality of the coating, an annealing treatment was carried out on sample B-6. This process was carried out in a Lindberg/Blue (Thermo Fischer Scientific, Waltham, MA, USA), furnace at a temperature of 773 K, with a heating increase of 5 K/min and a controlled atmosphere of N2.
The crystallographic structure was analyzed with X’PertPro(Panalytical, Almelo, The Netherlands) equipment operating in the Bragg–Brentano configuration with CuKα (1.5406 Å) radiation at 40 kV and 30 mA. The sweep range was from 10° to 60°, with a step size of 0.05° and 2θ. The changes in the morphology and the chemical composition of coatings were determined through scanning electron microscopy (SEM) with Jeol JSM-7400F (Jeol, 3-1-2 Musashino, Akishima, Tokyo 196-8558, Japan) in a high vacuum with a voltage of 30 kV. Complementary studies to characterize the structure were done by means of transmission electron microscopy with FEI TECNAI 20 TWIN (Thermo Fischer Scientific, Waltham, MA, USA) equipment operating in diffraction mode, with a potential difference of 300 kV and with a constant chamber of 730 mm. The chemical composition was determined through X-ray dispersive energy spectroscopy (EDS) using Hitachi SU1510 (Hitachi High-Technologies, 24-14 Nishi-Shimbashi 1-chome, Minato-ku, Tokyo 105-8717, Japan) equipment with an EDAX APOLLO probe (Edax Inc., Devon-Berwyn, PA, USA).
The percentage of porosity in the coatings was determined from SEM images, from cross-sectional specimens. The SEM images were characterized at 300× and 250× through Image J (National Institutes of Health, Bethesda, MD, USA) image analysis software. Through grayscale contrast analysis, ImageJ software quantifies the total area and the gray areas of the cross-section micrography and automatically quantifies the percentage of porosity. The roughness and the morphology of the surfaces were determined using an OLYMPUS reference SX500 optical-digital microscope (Olympus Corporation, Shinjuku, Tokyo, Japan). Thickness measurements were taken in the cross section of the coating. For these measurements, Quartz PCI image analysis software was used (Quartz Image Corporation, Vancouver, BC, Canada). Ten measurements were made per record in four different continuous sections of the coating, and thicknesses between 127 μm and 299 μm were obtained.
The corrosion and electrochemical behavior of the uncoated and coated specimens was studied using a three-electrode system and a Gamry Reference 600 potentiostat at room temperature (Gamry Instruments, Inc., Philadelphia, PA, USA). The samples were mounted in a special cell that limited the exposed area of the coated steel substrate face to 0.196 cm2. In the corrosion resistance experiments, the substrates were used as the working electrode, a platinum rod was used as the counter electrode, and a saturated calomel electrode was used as the reference electrode. The electrolytes that made up the solution had 3.5% NaCl. Prior to each corrosion experiment, the corrosion potential was allowed to stabilize for 0.75 h immersed in the test solution, followed by carrying out potentiodynamic polarization or electrochemical impedance tests. For the polarization, experiments were performed in a polarization range of −0.4 V to 0.5 V with respect to the open circuit potential, and the scanning rate was 1 mV/s. The corrosion current density (Icorr) was estimated by a linear fit and Tafel extrapolation to the cathodic part of the polarization curve [8]. Electrochemical impedance spectroscopy (EIS) measurements were carried out using the same custom cell described above at a stable open circuit potential. The perturbing signal had an AC amplitude of 10 mV and a frequency range of 0.01 Hz to 100 kHz. Measurements were taken after 1 h of immersion. The EIS analysis was conducted using the equivalent circuit-fitting model with Gamry Echem Analyst software (Gamry Instruments, Inc., Philadelphia, PA, USA).

3. Results and Discussion

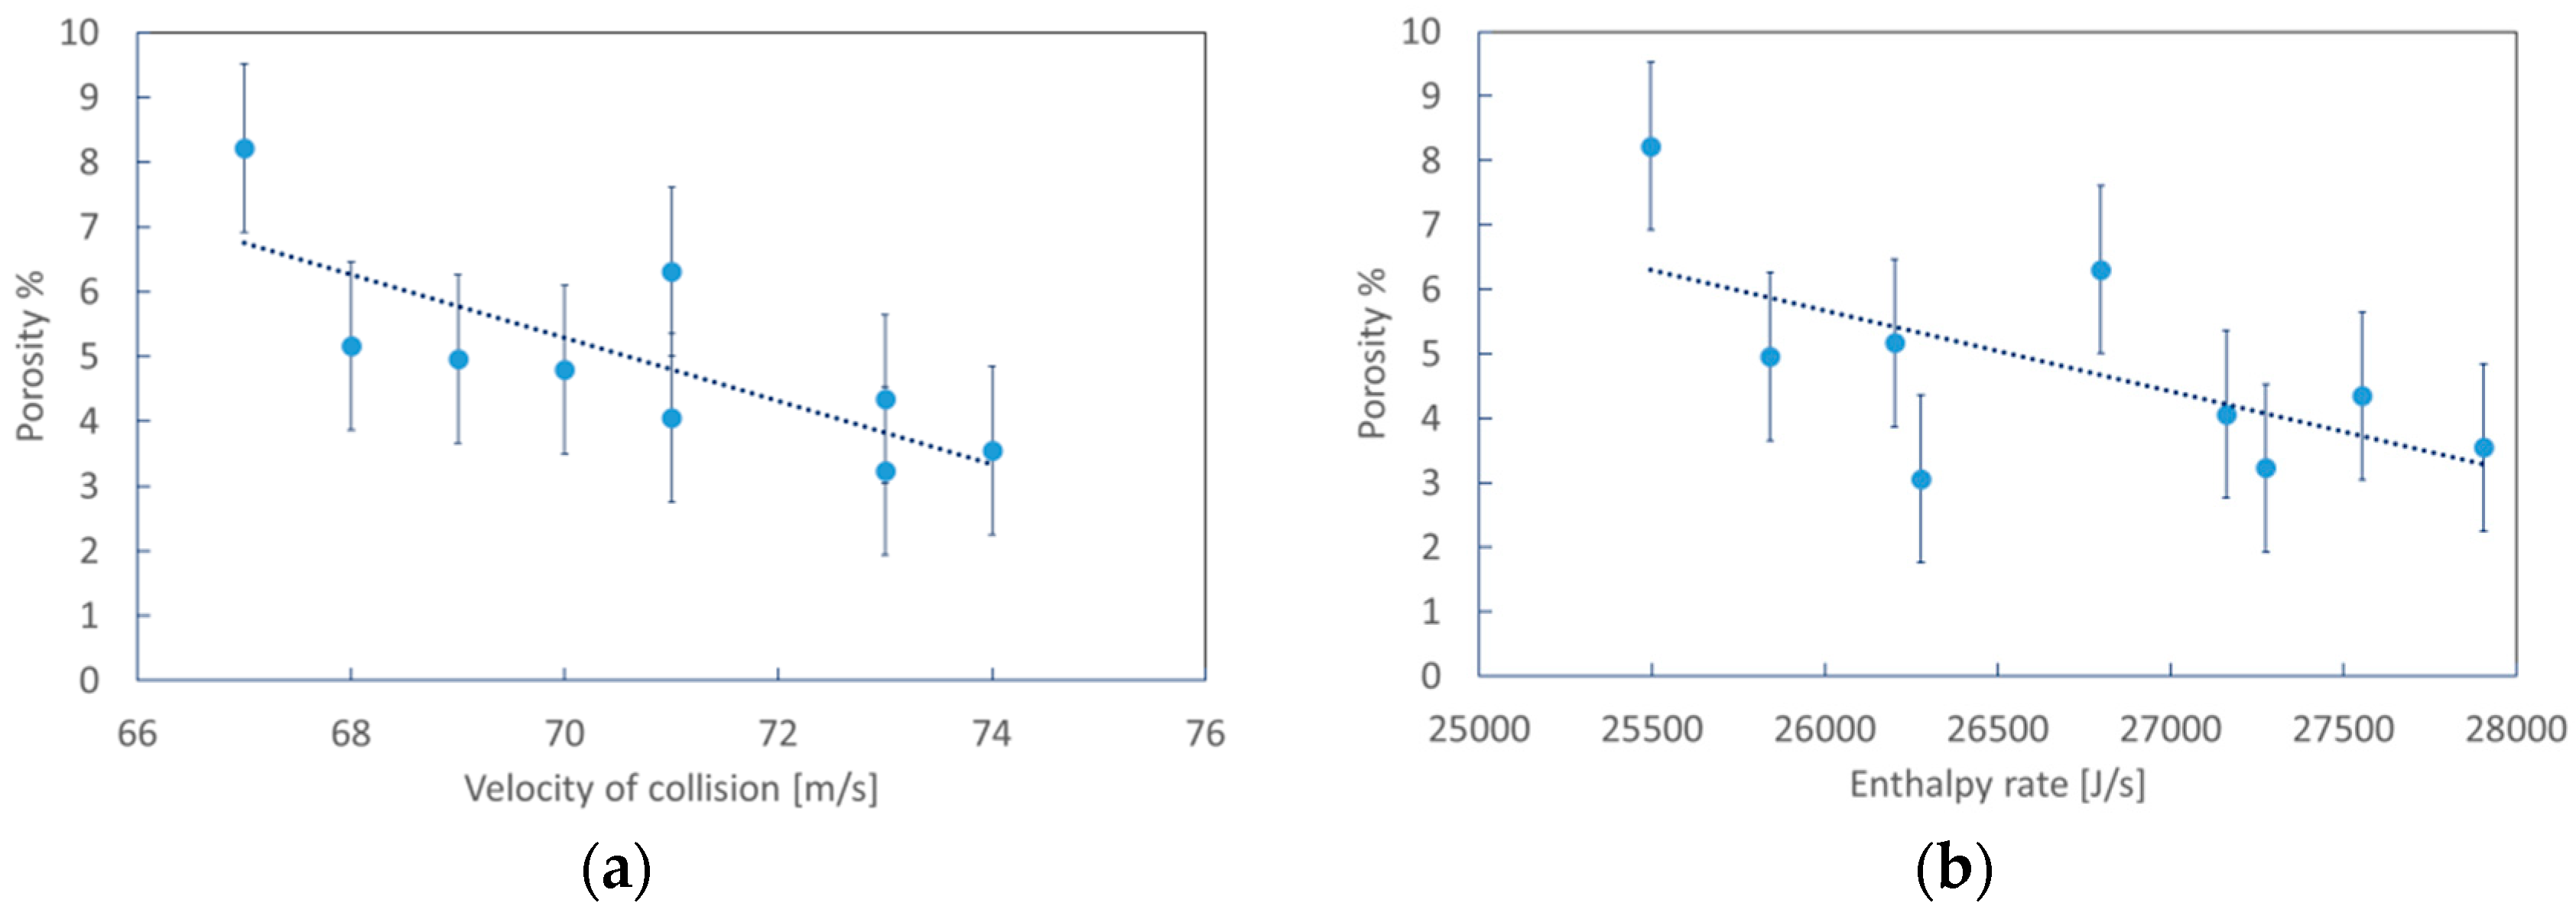
3.1. Numerical Simulation

Figure 1 shows the results obtained from the numerical simulation of the particle velocity at the time of the collision and the enthalpy of the different gas pressure conditions. In general, it can be seen that the velocities increase with the pressures of oxygen and acetylene, and that the highest collision velocity of the particles corresponds to an oxygen pressure of 359 kPa and 97 kPa of acetylene. The behavior observed for the velocities is consistent with the expected behavior for subsonic gas flows, in which the increase in velocity is a consequence of the increase in the flow rates of the gases through a constant section and the addition of heat generated during the combustion reaction. On the other hand, it can be seen that the enthalpy of the particles increases with the increase of oxygen and acetylene feed pressures. The lowest enthalpy values are exhibited for the sample produced at pressures of 331 kPa O2 and 69 kPa C2H6. In general, it is well known that a more energetic flame will transfer greater enthalpy to the powders, generating an over-melting in the particles and favoring the production of splashes when they reach the substrate [9].

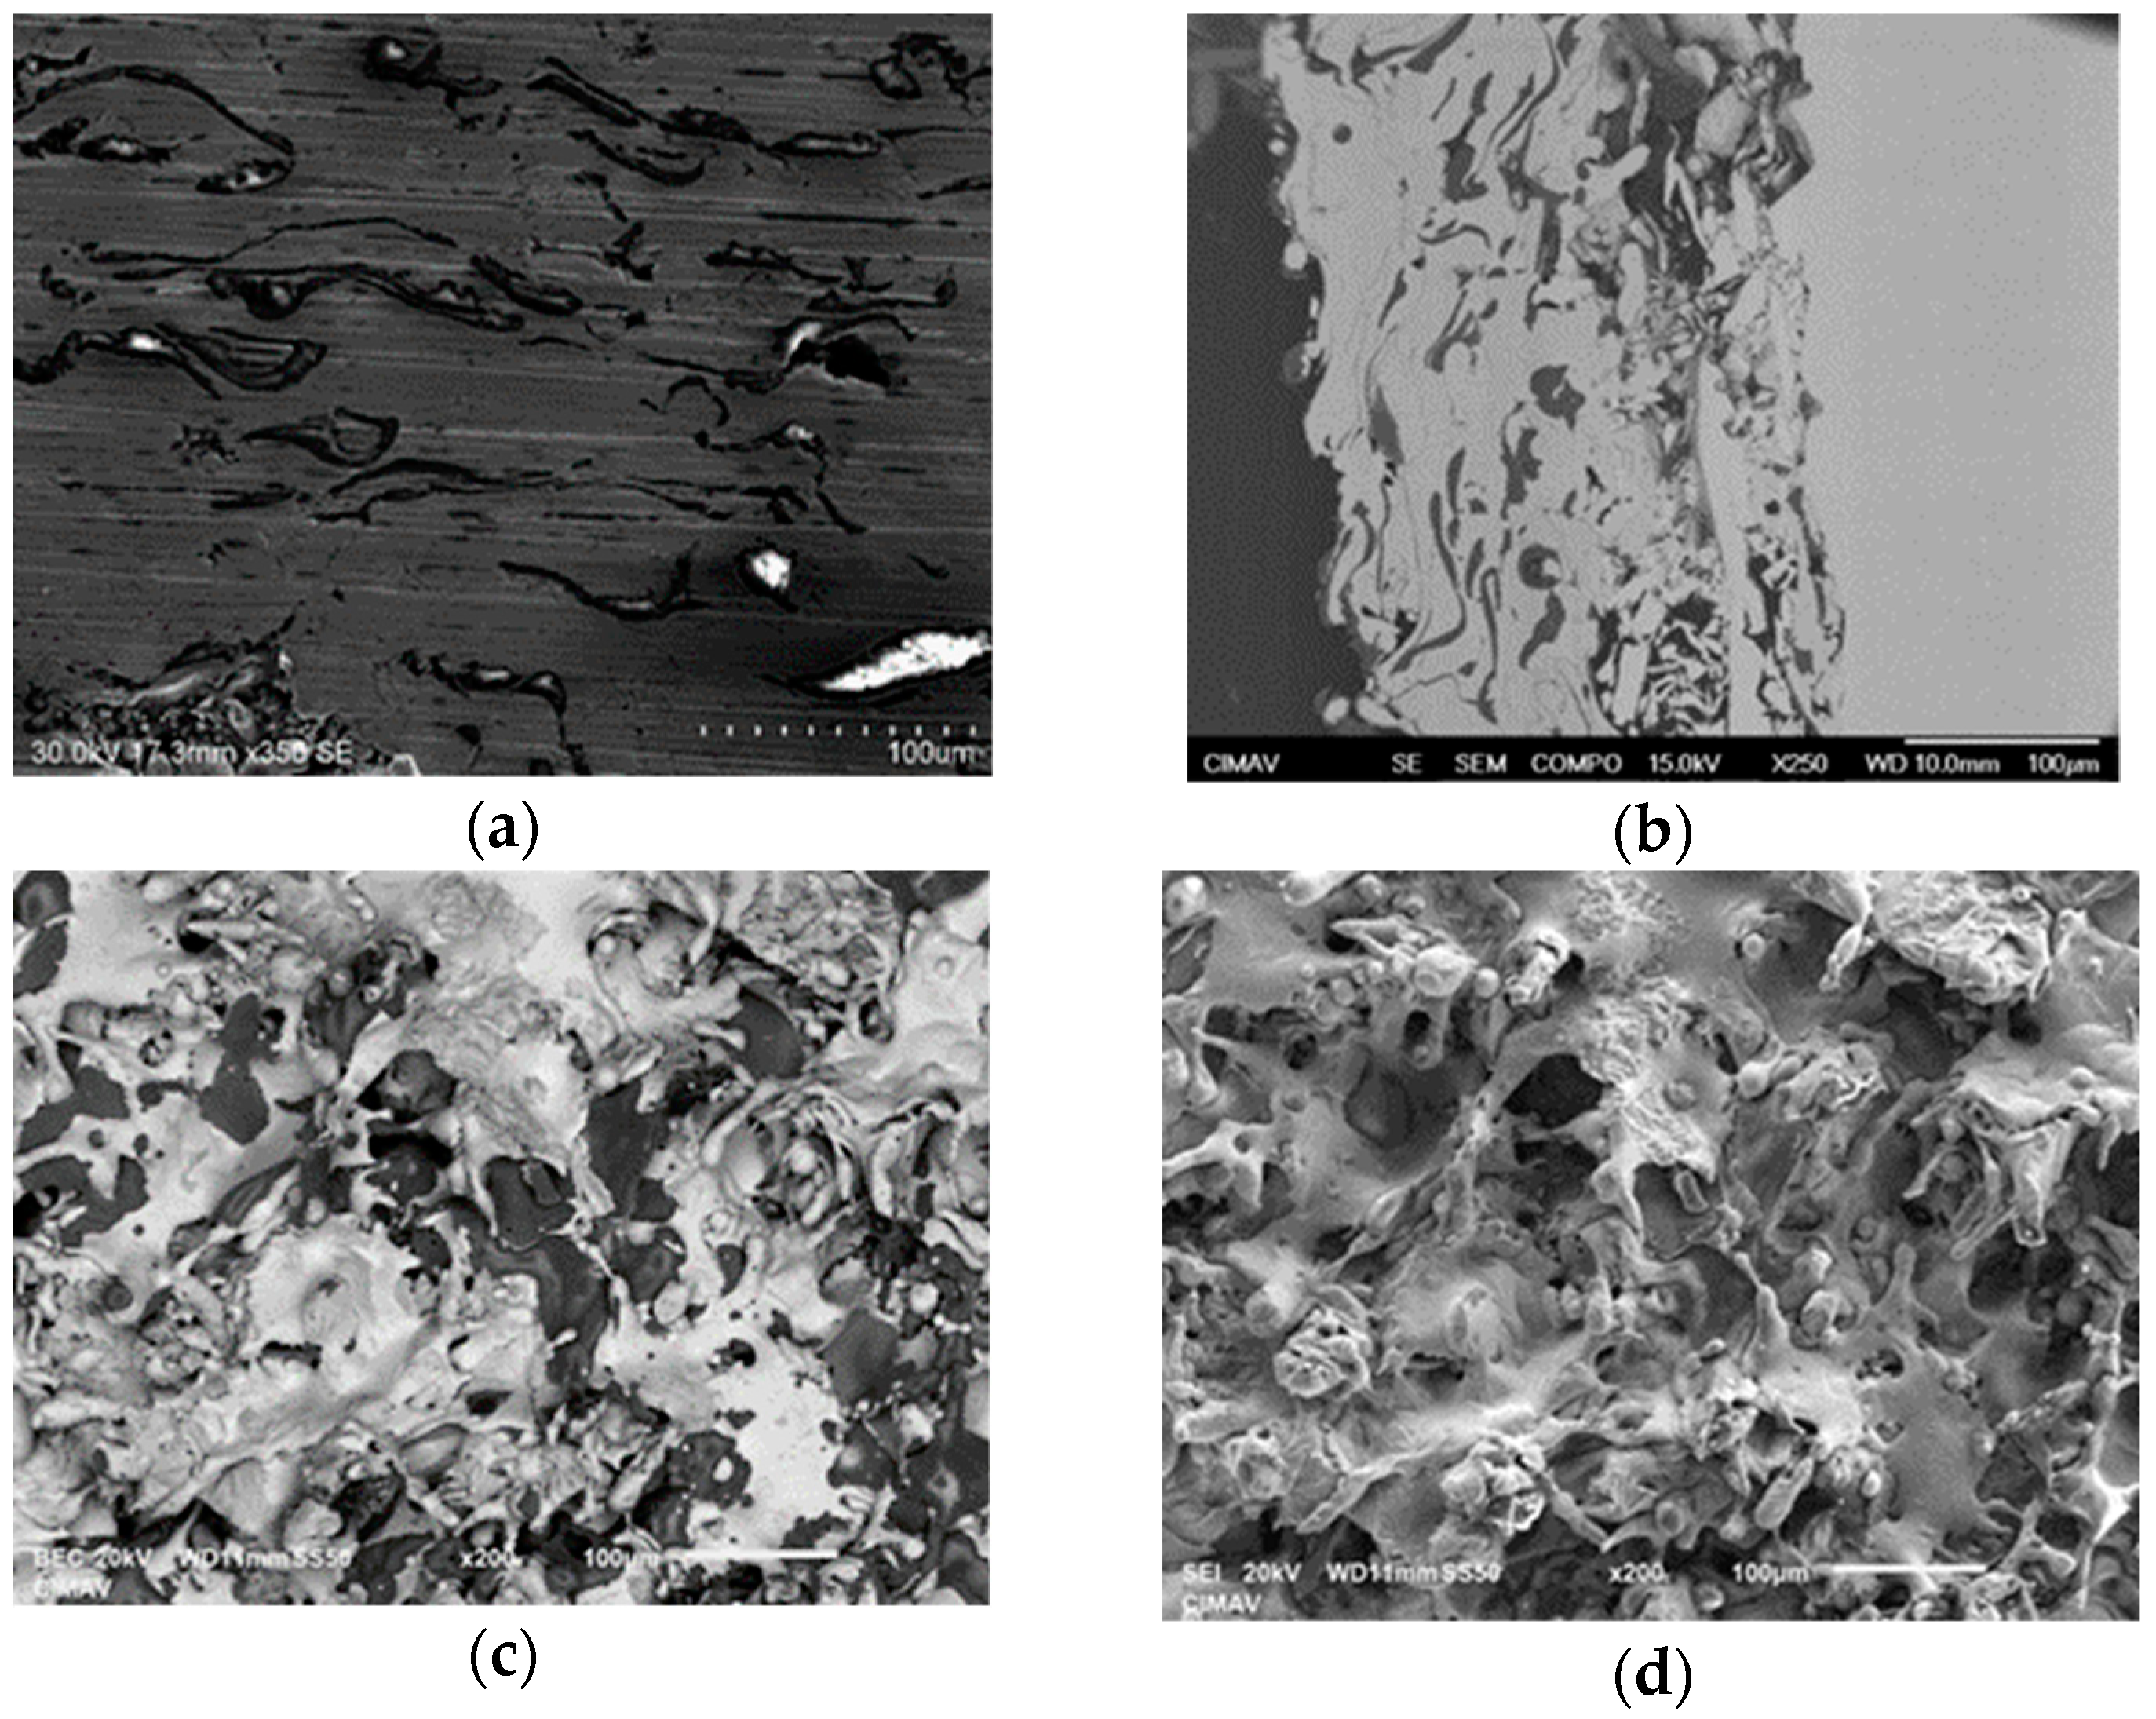
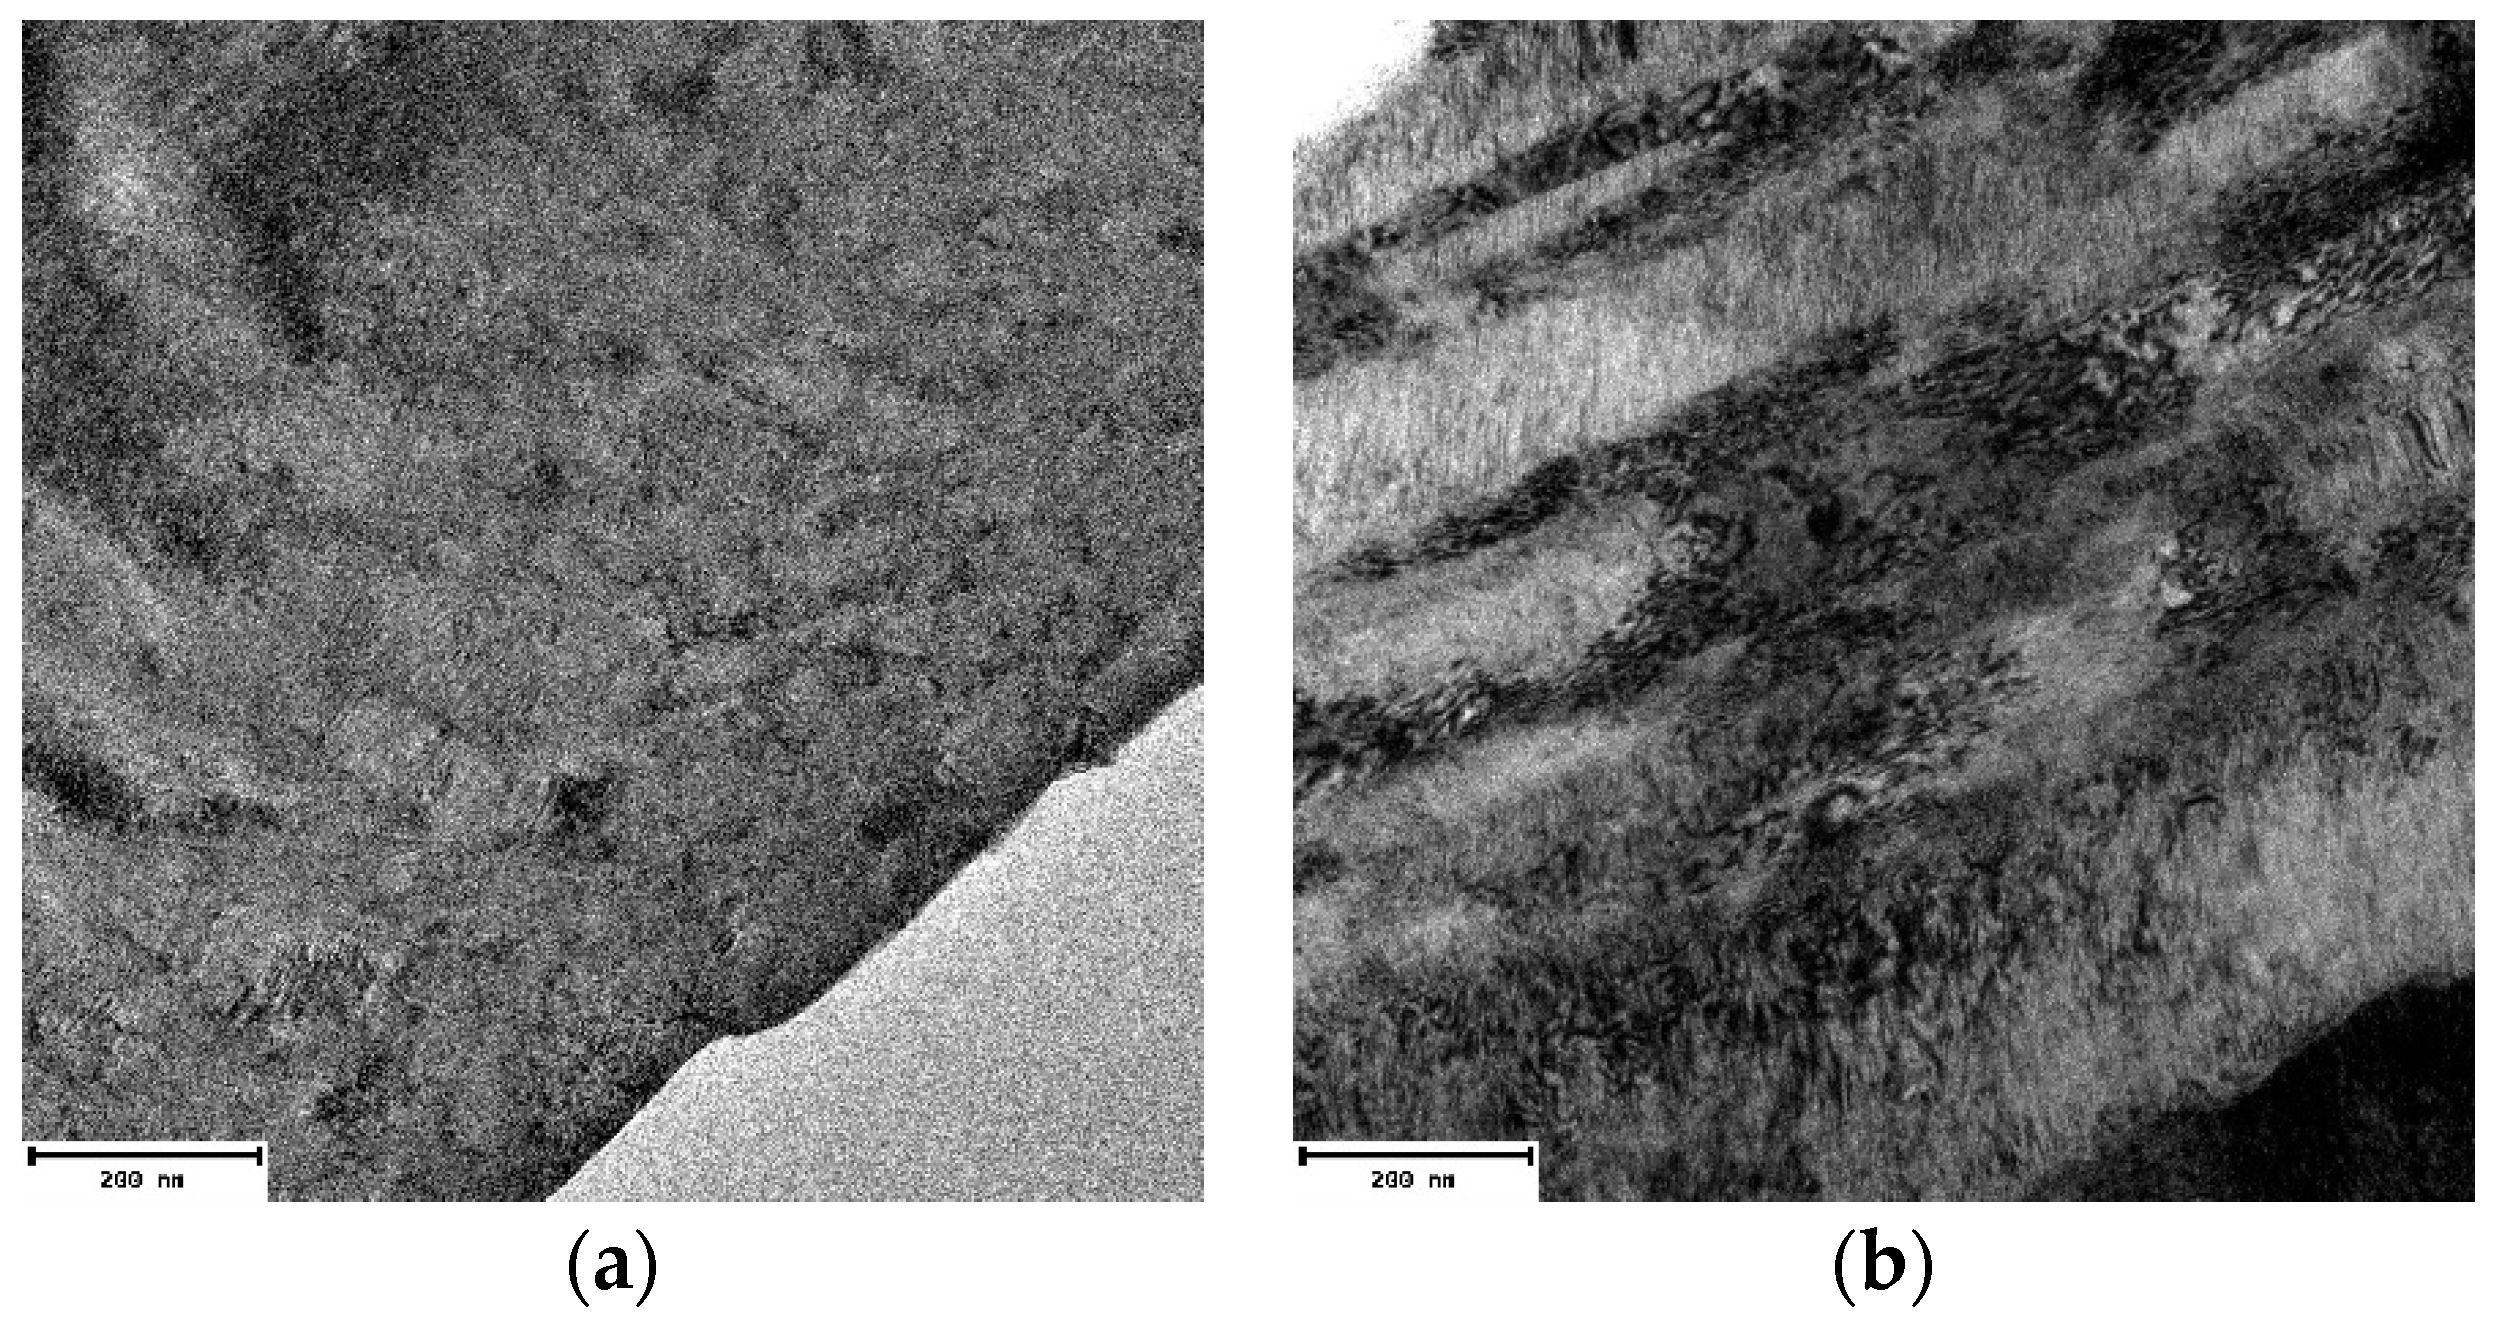
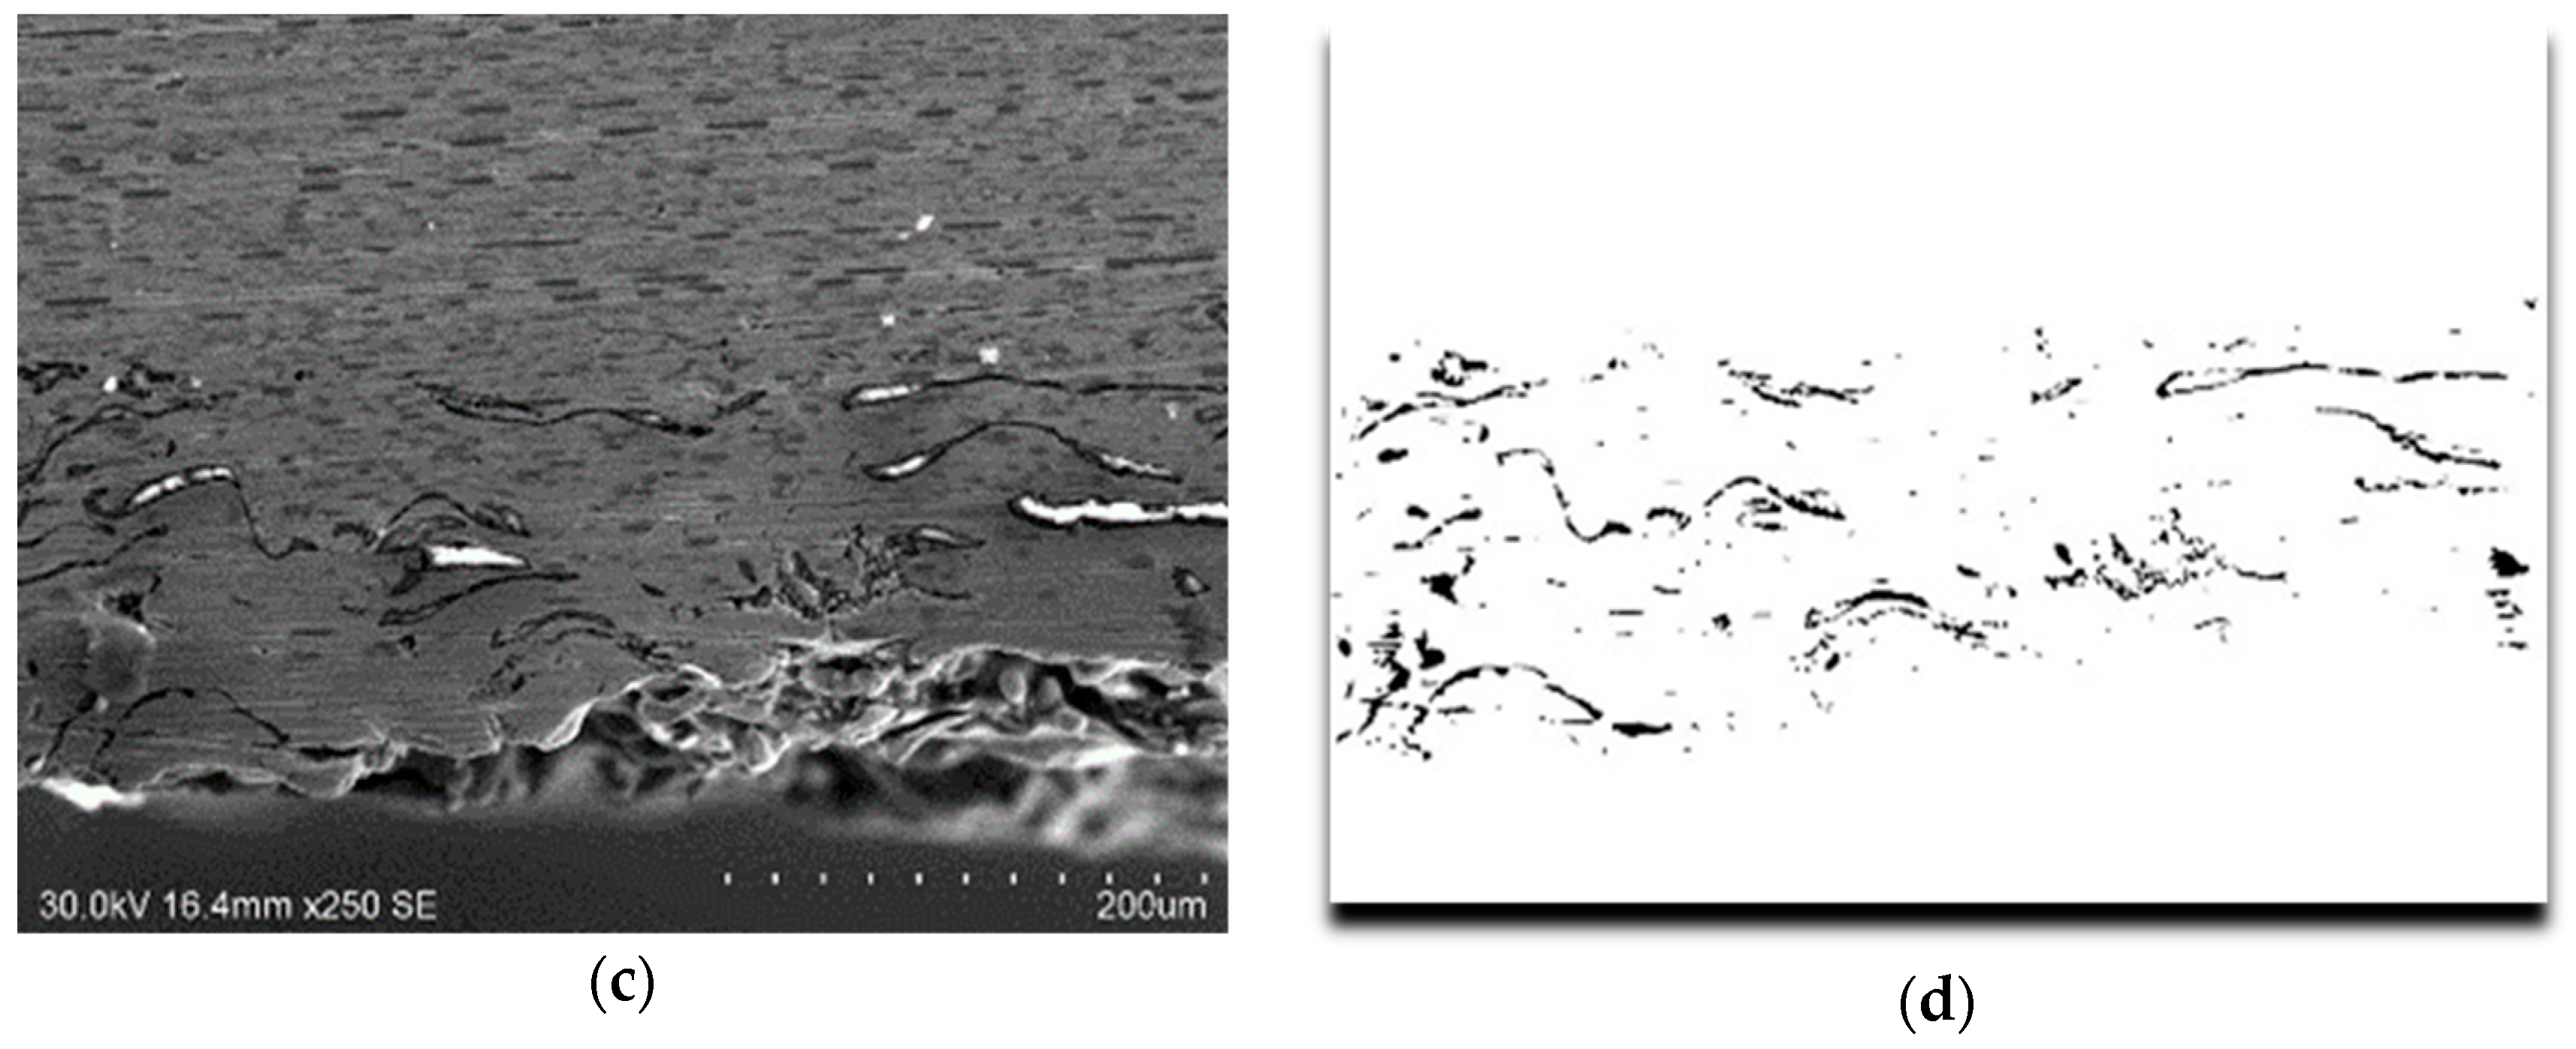
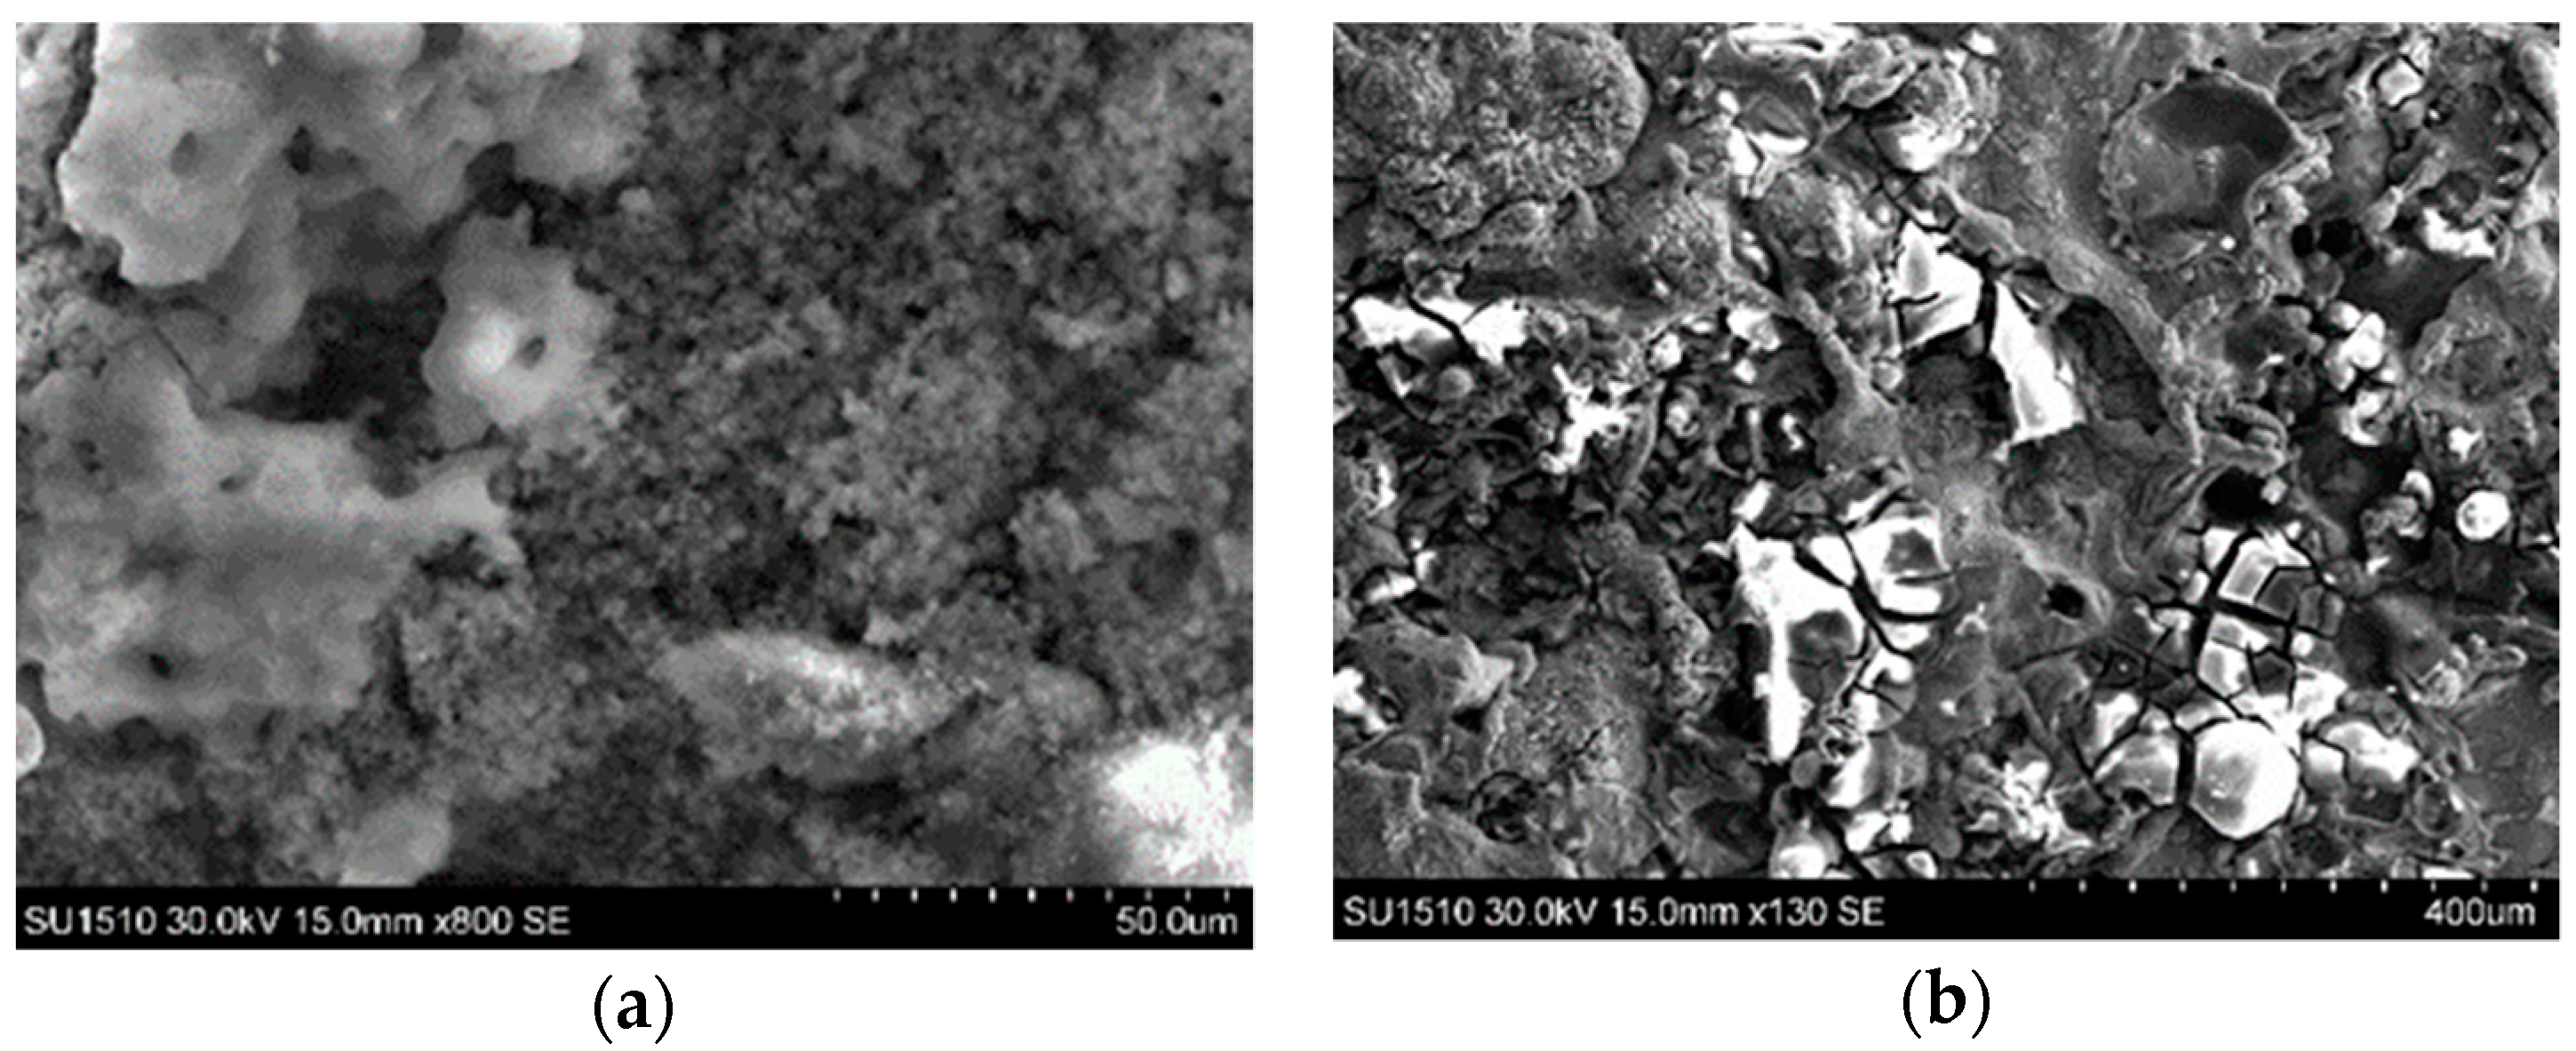
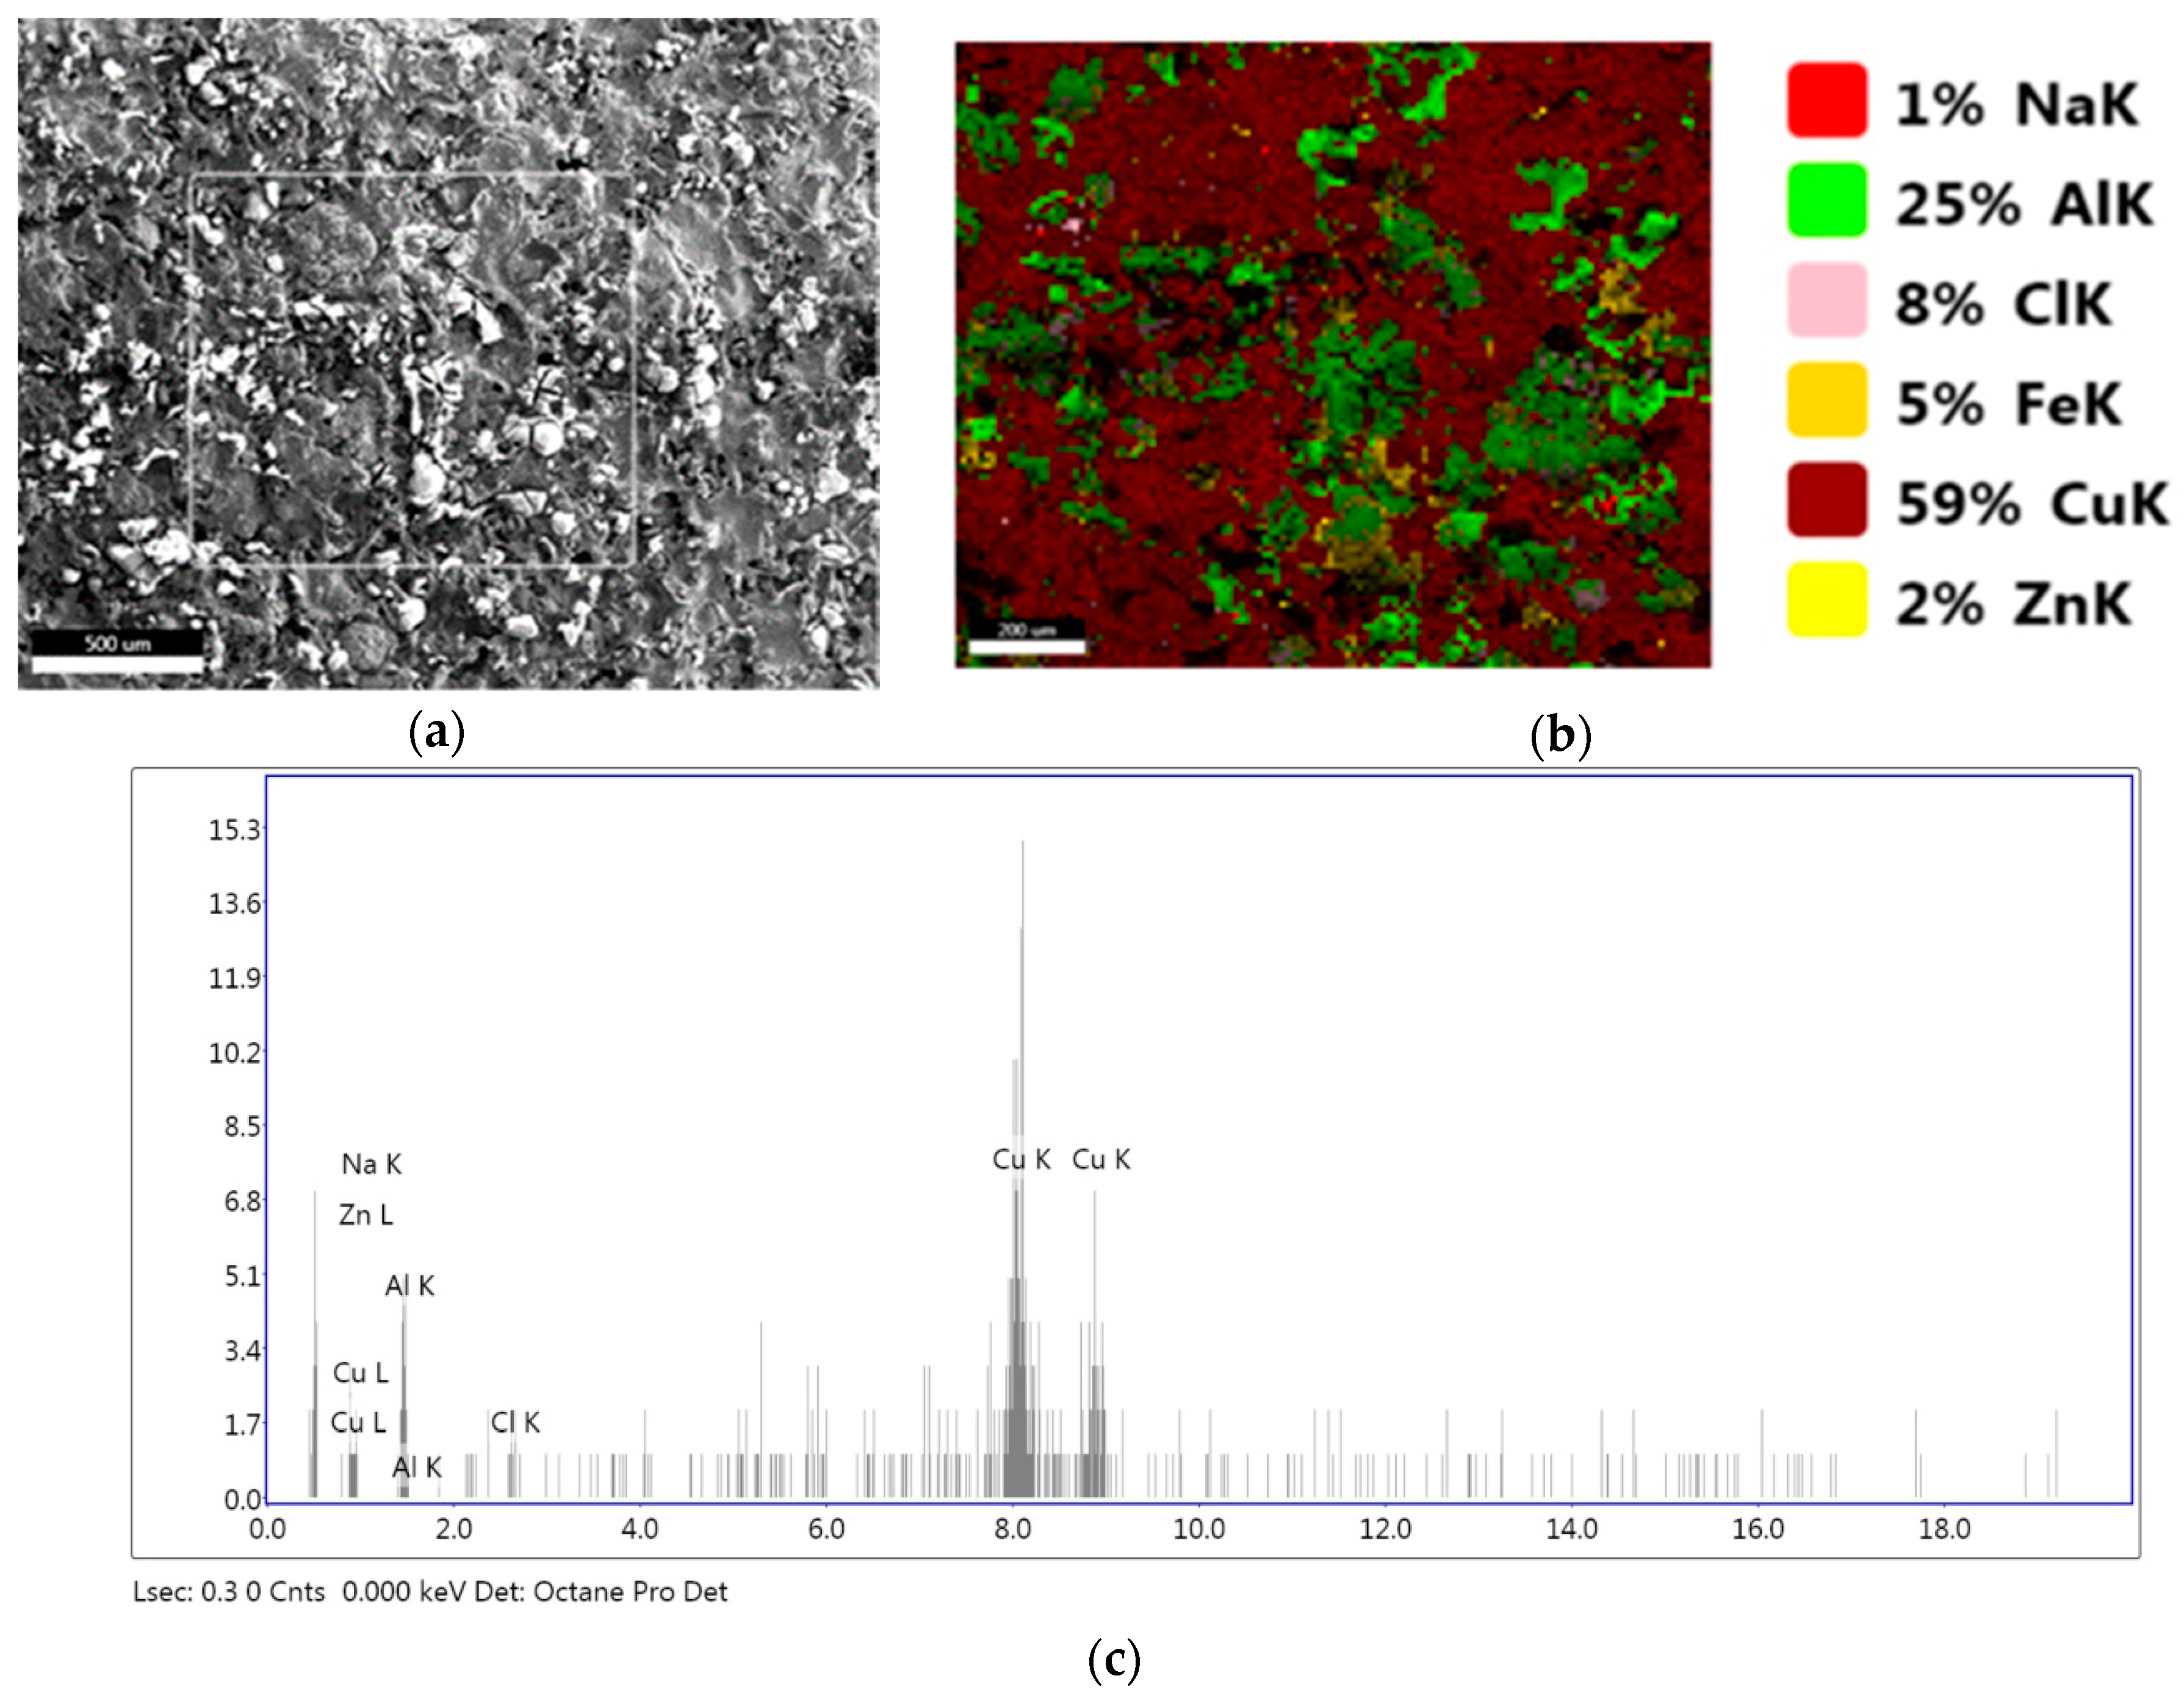
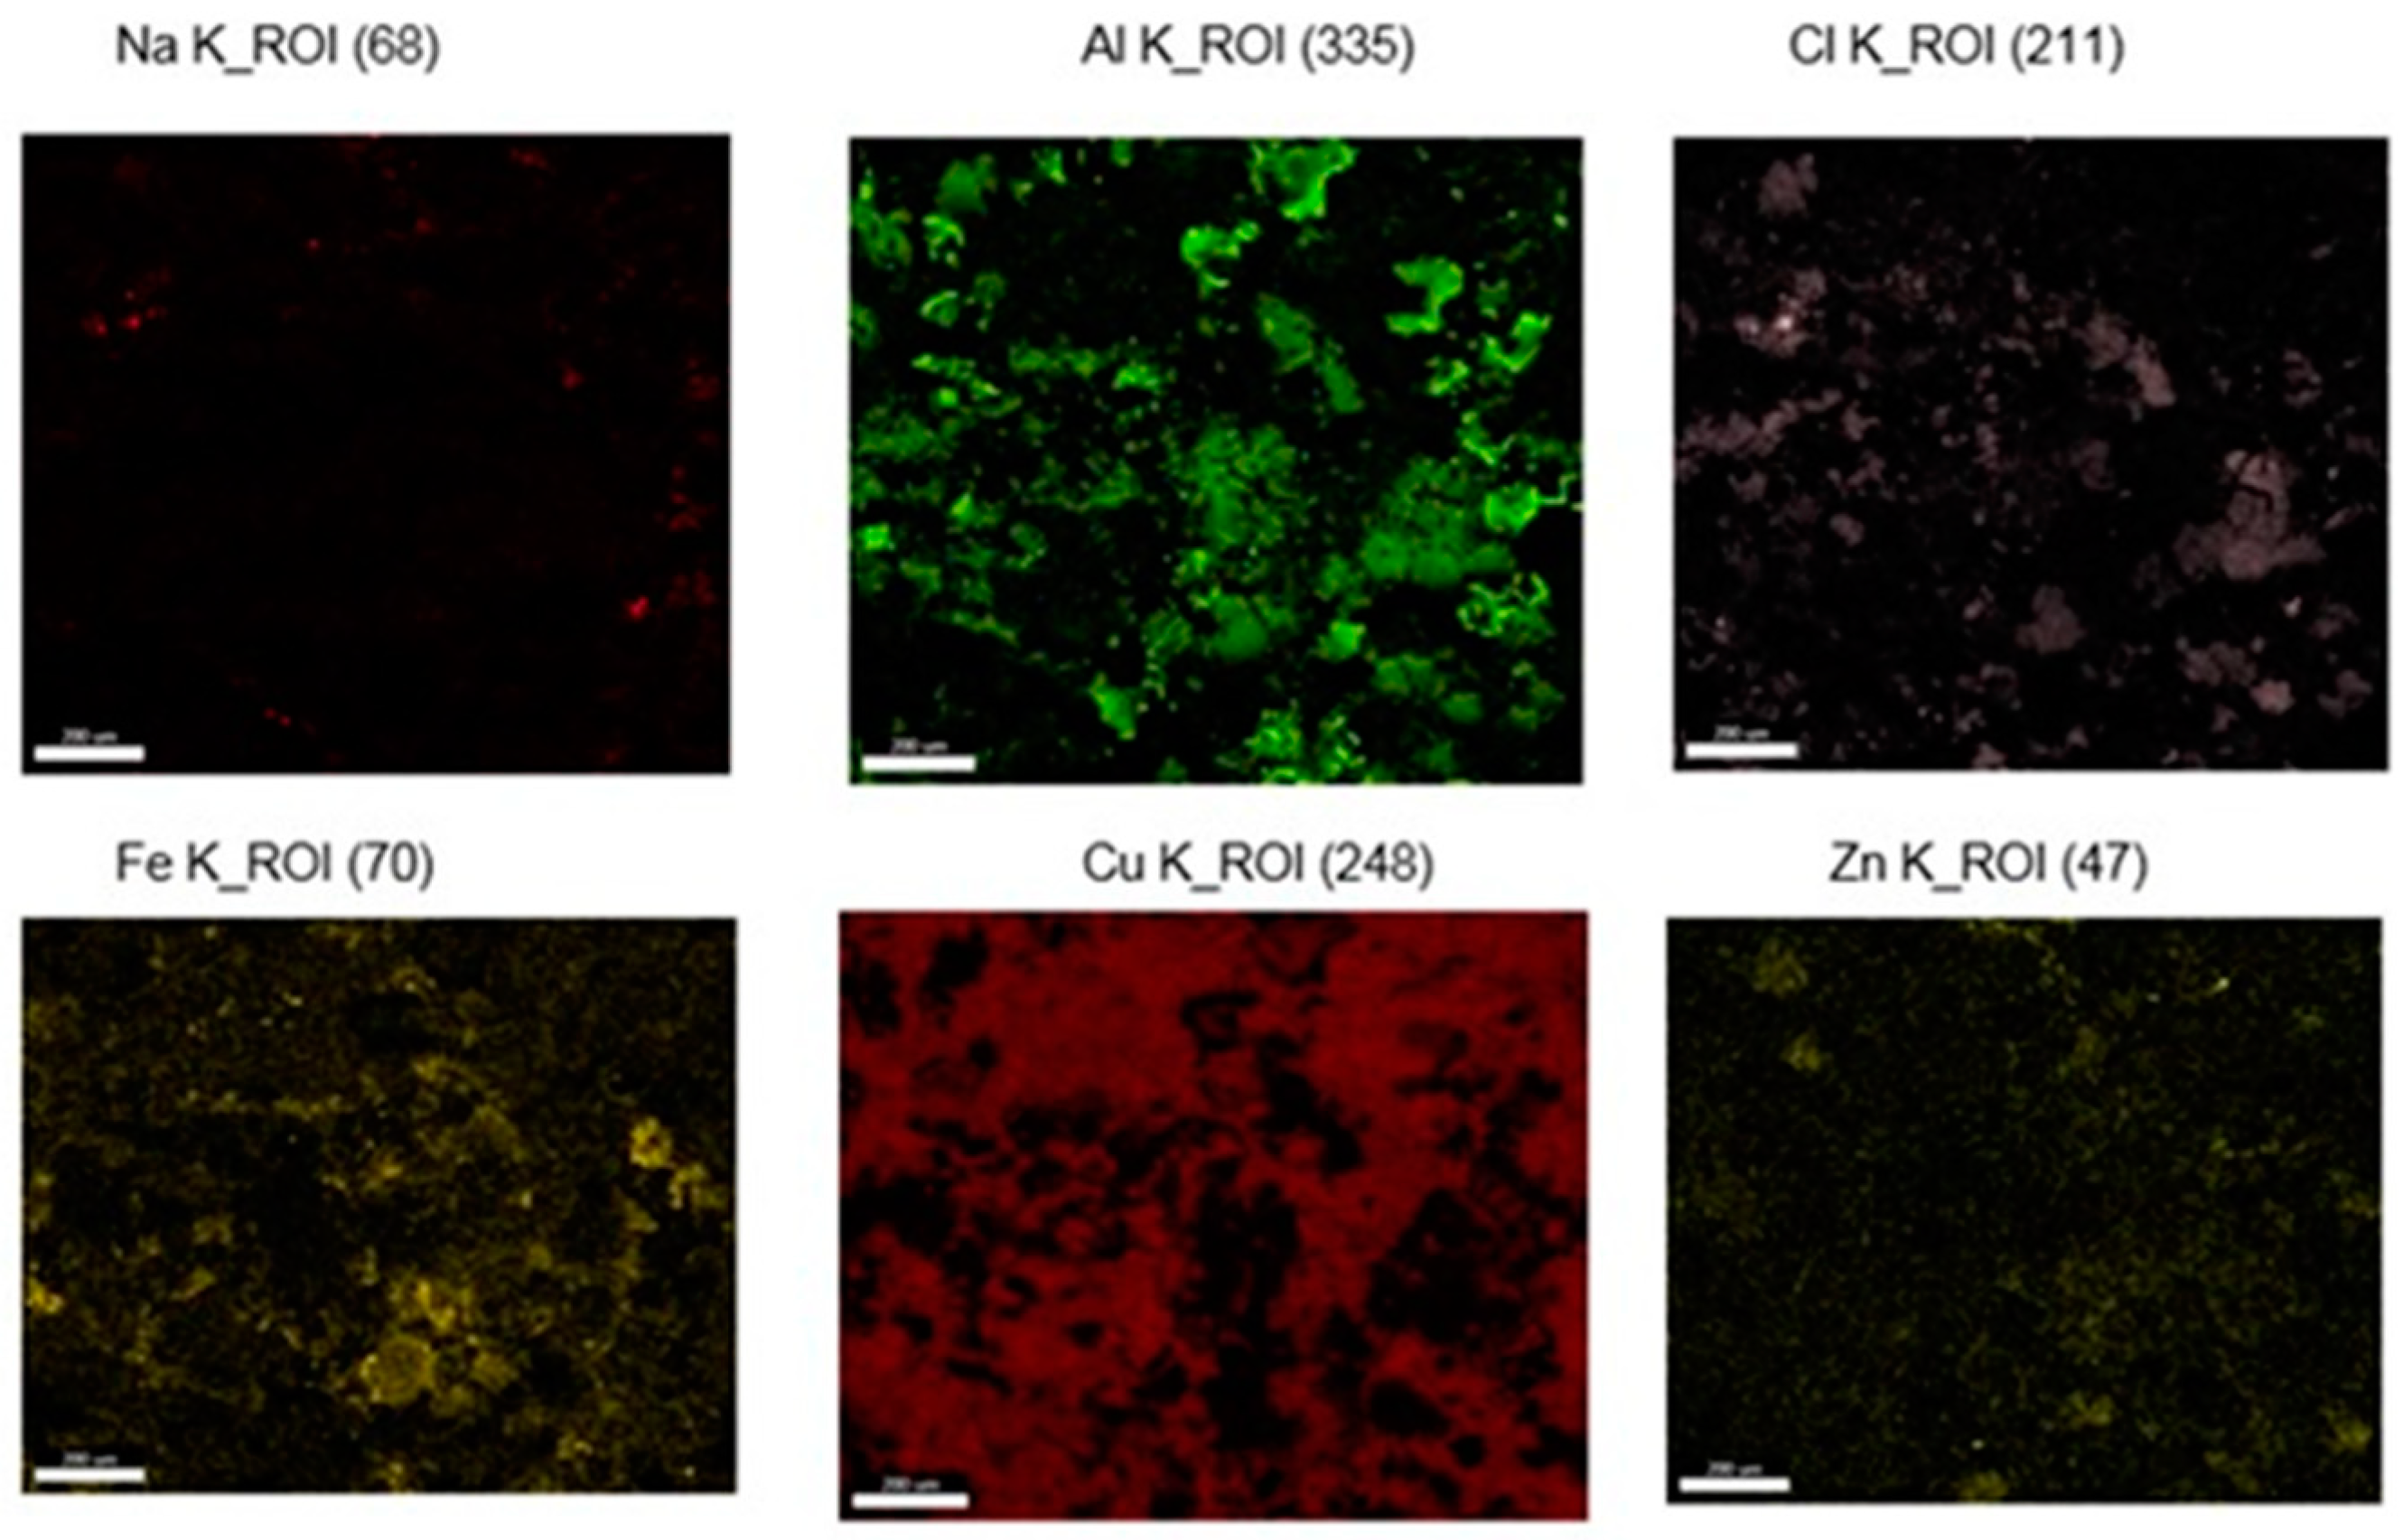
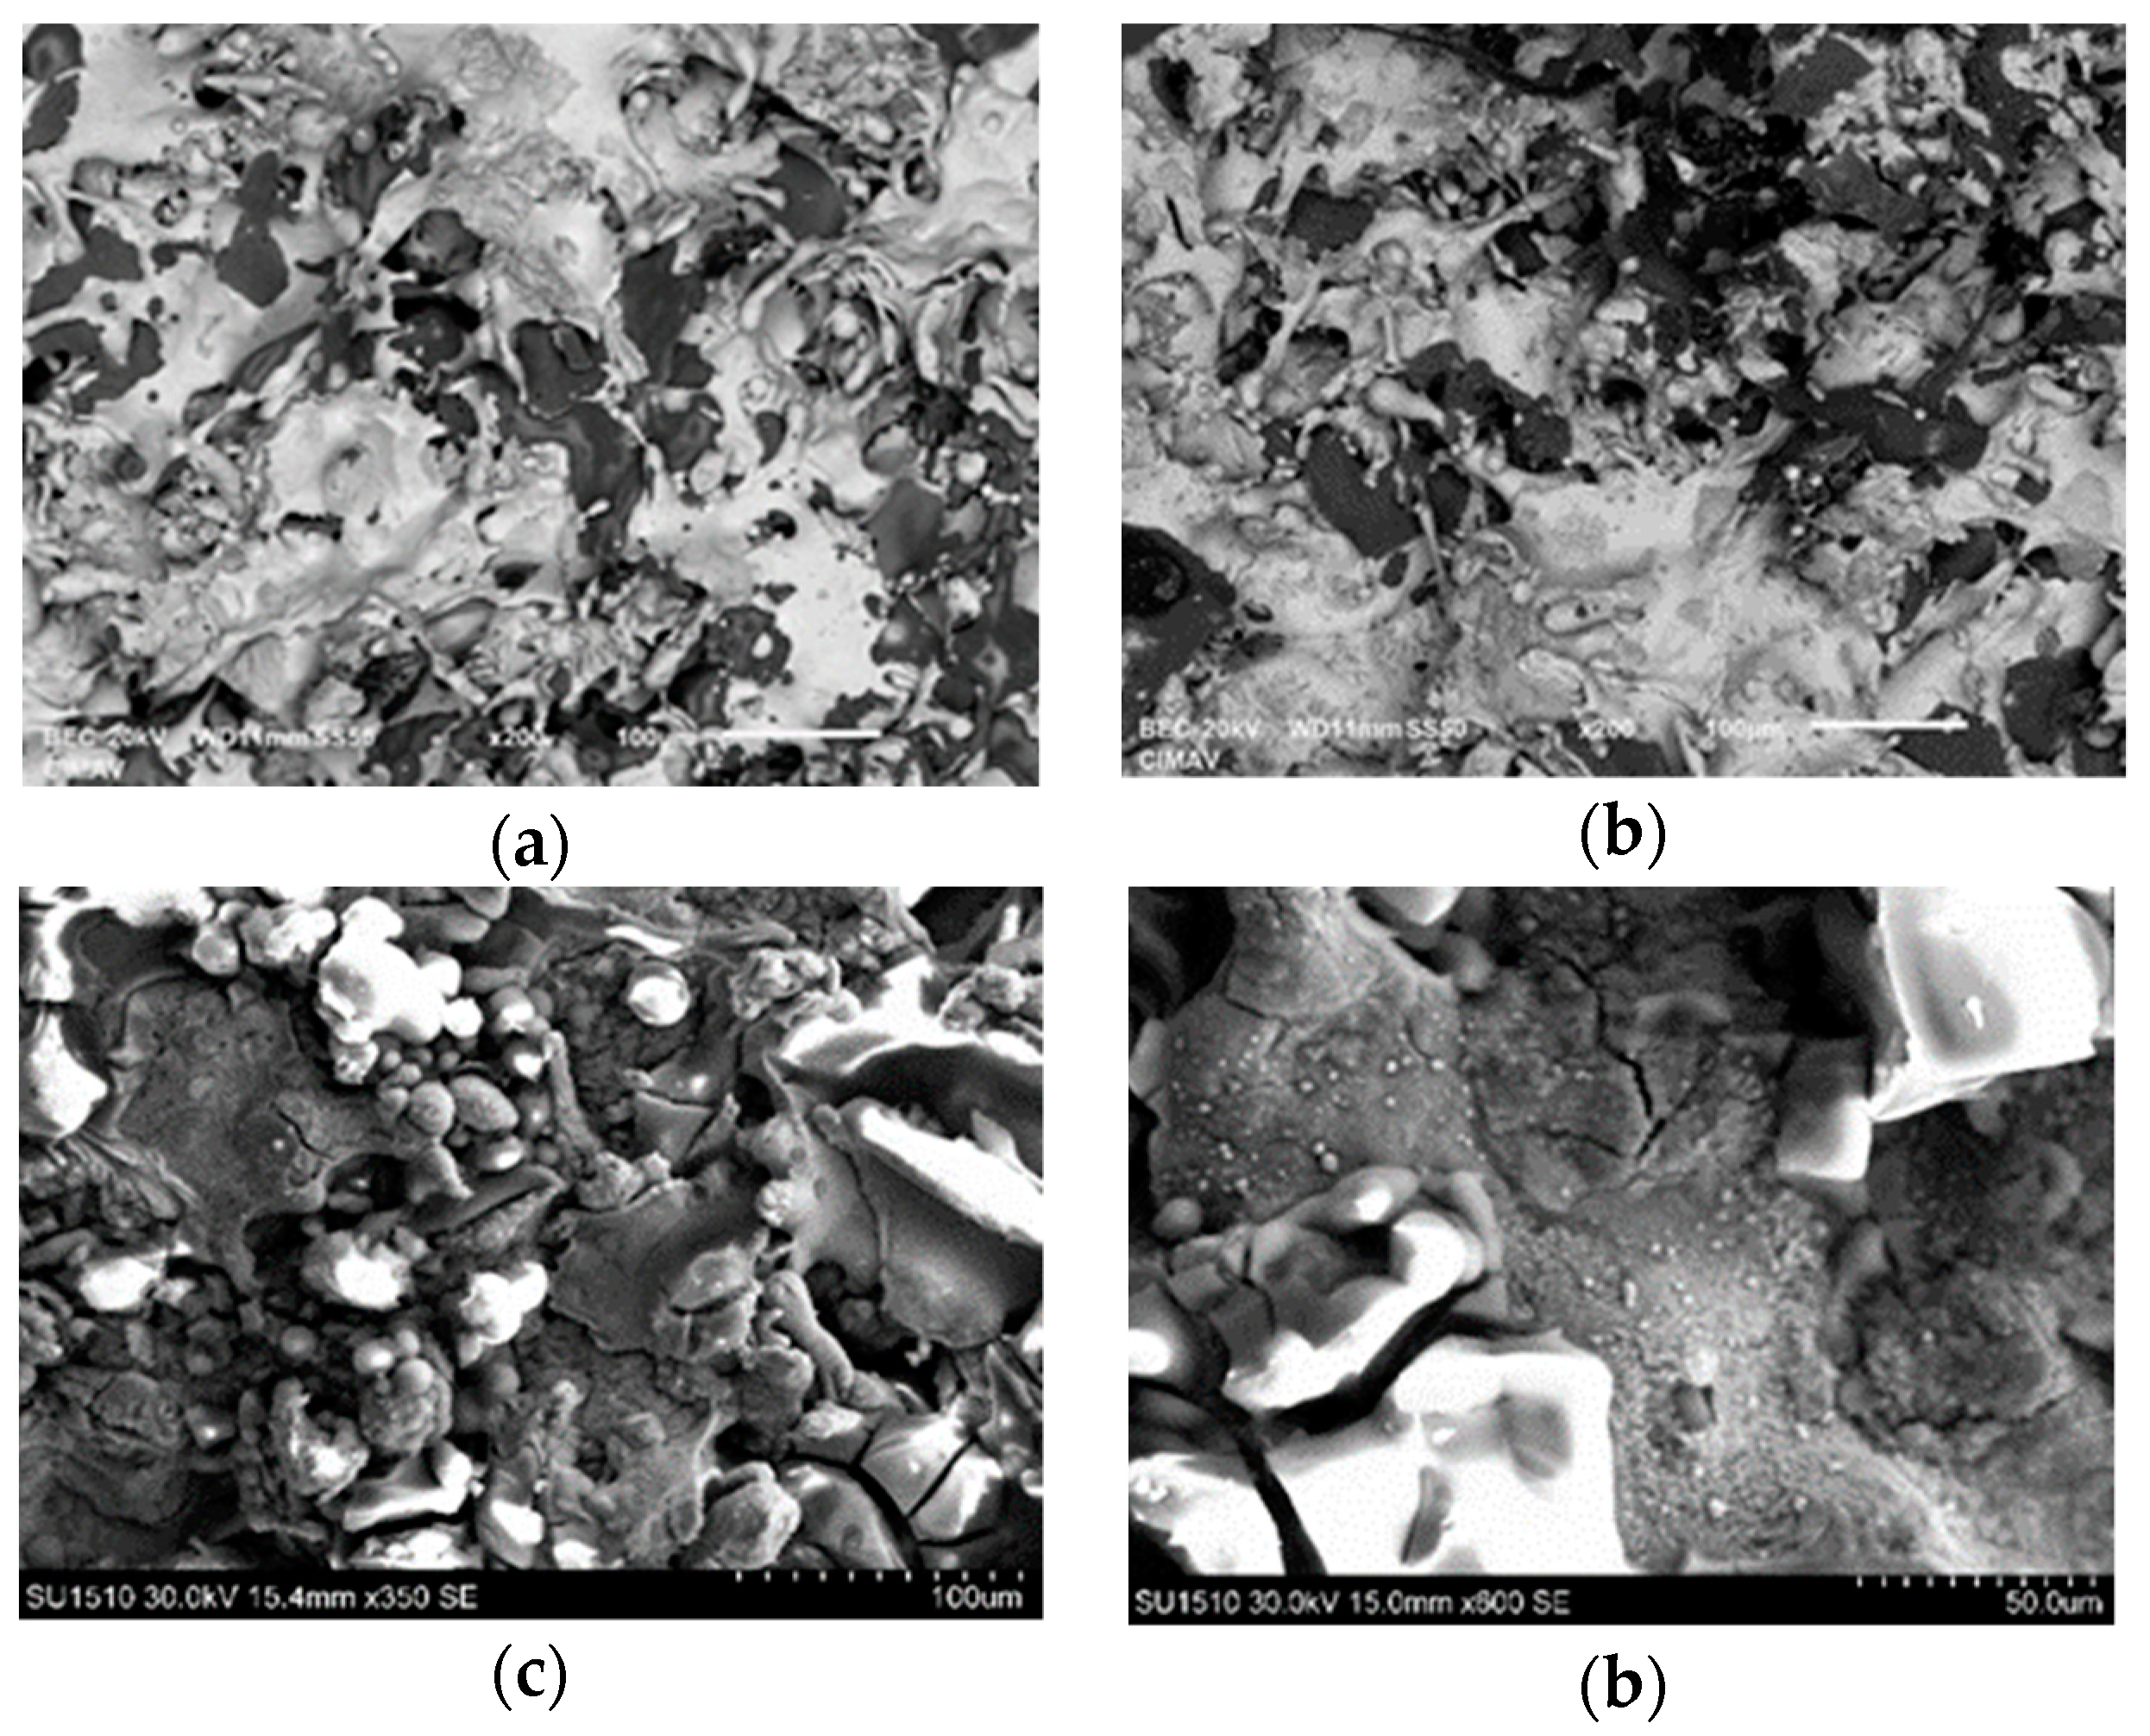
3.2. Microstructural Characterization of Al–Cu–Fe Coatings

The composition in the zone corresponding to the splats was analyzed. According to these results, the coating is an alloy of bronze and aluminum, whose matrix is rich in copper alloyed with Al and a small amount of Fe, which agrees with results published by other researches in which they identified a matrix rich in copper in the α phase and the presence of the β ‘(Cu3Al) and κ1 (AlFe3) phases [10]. The amount of copper is in the range of 80 wt.% to 90 wt.% according to the initial composition of the deposition material. The aluminum content had values ranging between 5% and 10 wt.%, close to the concentration value of the material in the powder but probably affected in its measurement by a possible segregation of aluminum in the most energetic processes.
In Figure 2, it can be seen that with low acetylene and oxygen pressures, there is a decrease in the concentration of aluminum. This could be associated with high values of the maximum flame temperature, associated with lower values of speed in the particles, which results in longer travel times of the particles, which favors the processes of vaporization of materials with a lower melting point [10]. It can also be seen that the coatings have oxygen concentrations greater than 2% as a consequence of the oxidation process during the deposition and cooling. The highest concentrations of oxygen are present in the treatments in which the simulations indicated higher enthalpies of the particles during the collision, a factor that favors the reaction of the deposited metals with the oxygen of the flame and the environment.
Figure 3 shows the SEM image where the chemical composition mapping was carried out via EDS analysis. The red micrograph corresponds to the oxygen, the green to aluminum, the violet to copper, and the yellow to iron. The EDS map indicates that the distribution of most elements is uniform. Due to the movement of the molten particles from the combustion zone to the surface of the substrate, the elements react and form some oxides of copper and aluminum, which have high negative values of formation energies. In addition, some intermetallic compounds can be generated under the deposition conditions. For example, Wen-sheng [10], in his studies of bronze and aluminum, found the formation of a matrix rich in Cu and accompanied by the β ‘phase (AlCu3) and the κ1 phase (AlFe3).
Figure 4 shows the XRD patterns of the nine experiments performed during the fabrication of aluminum–bronze coatings. It can be seen that all the applications exhibited the same structural phases and that between them there was a small shift to the right. In general, the presence of the phase β’-AlCu3 can be seen, and its most important planes are in position 2θ of 40.28, 42.73, 44.81, 46.85 and 73.00 [JCPDS 00-028-0005]. In the study by Li Wen-she and colleagues [10], they stated that the AlCu3 stoichiometry corresponds to an intermetallic compound with a wide range of solubility, has a FCC crystal structure with a lattice spacing of 0.353 nm, and belongs to space group 221. In this spatial group, the Al3+ ions are located in the vertices of the cell and the Cu ions are located in the centers of the faces of the crystalline structure. The α phase of Cu FCC was also detected, which can be seen in the peaks located at 42.73, 50.5 and 88.9 (JCPDS, 96-901-3018).
Figure 5 shows the SEM images of the surface and a cross-section of the coatings produced with an oxygen pressure of 331 kPa and an acetylene pressure of 69 kPa. On the surface, unmelted spherical particles, molten particles that produce splats, and pores can be seen, and in some cases dendritic structures can be seen, due to the solidification processes of the molten drops. In the cross-section of the coatings, a stacking of splats can be seen, as well as the presence of defects typical of the technique, such as pores, cavities, oxides and limits between splats. The images show the interface that separates the substrate from the coating. In general, the coatings exhibited laminar structures made up of the stacking of particles in a molten or semi-molten state and pores generated by the short time of the material in the flame and the rate of cooling of the molten material during the formation of the coating [11]. In general, most of the coatings exhibited good compaction, providing an acceptable homogeneity. This may be due to the great ease with which the oxyacetylene flame melts aluminum–bronze (melting point of aluminum–bronze: 1153–1193 K).
Figure 6 shows the cross-sectional TEM micrograph of the Al–bronze coating produced at pressures of 331 kPa oxygen and 69 kPa acetylene. It can be seen that the microstructure of the coating is made up of deformed particles, which are represented in the form of bands generated by shearing stress due to the high degree of deformation of the coating. In Figure 6b, the structures in the form of sharp bands are identified more clearly, due to the high level of deformation, and in addition to this, areas of a high density of defects in the structure and fine grains due to dynamic recrystallization can be seen. These results agree with the investigations by Koivuluoto and W. Hincapie [12,13,14].
In Figure 7, the variations of the porosity percentages vs. the variation of collision velocities on the substrate and the enthalpy can be seen. Figure 7c,d show the SEM micrographics before and after the image treatment developed to quantify the percentage of porosity. In general, there is a tendency to reduce the porosity percentages as the collision speeds and enthalpy increase. The coatings have porosity percentages between 3.2% and 8.2%. The coating deposited with pressures of 331 kPa O2 and 69 kPa C2H6 exhibited the highest percentage of porosity, while the coating produced with higher pressures, acetylene at 97 kPa and oxygen at 345 kPa, had the lowest percentage of porosity. With an increase in particle velocity or pressure, the enthalpies and temperatures during the synthesis of the coating increased, which favors a greater atomization of the particles, generating smaller molten droplets, which are accelerated at a higher speed. The impact of these particles allows them to deform and form on the topography of the substrate before the solidification of a denser coating, with greater union between splats and the growth of a less porous structure. Similar results were reported by Y. Kawaguchi [15], who indicated that high porosity is due to a low velocity of the drops, resulting from their poor acceleration by the compressed air during the thermal spraying.

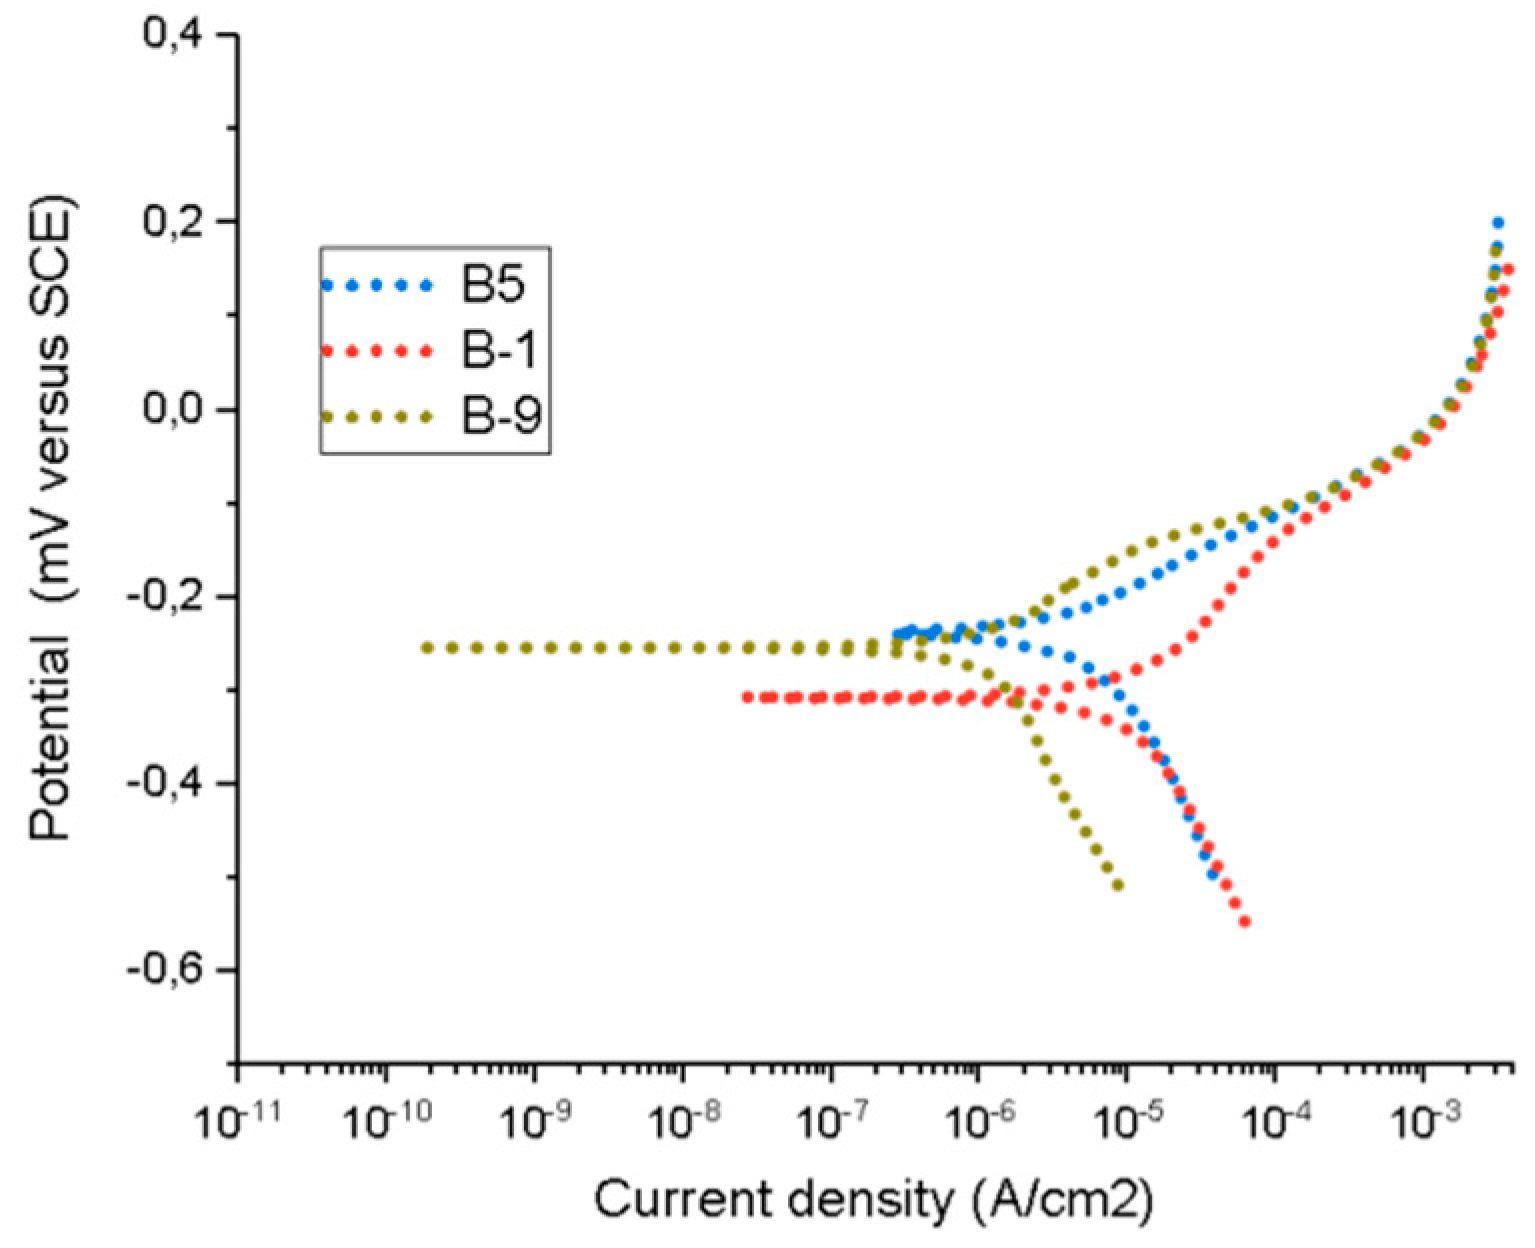
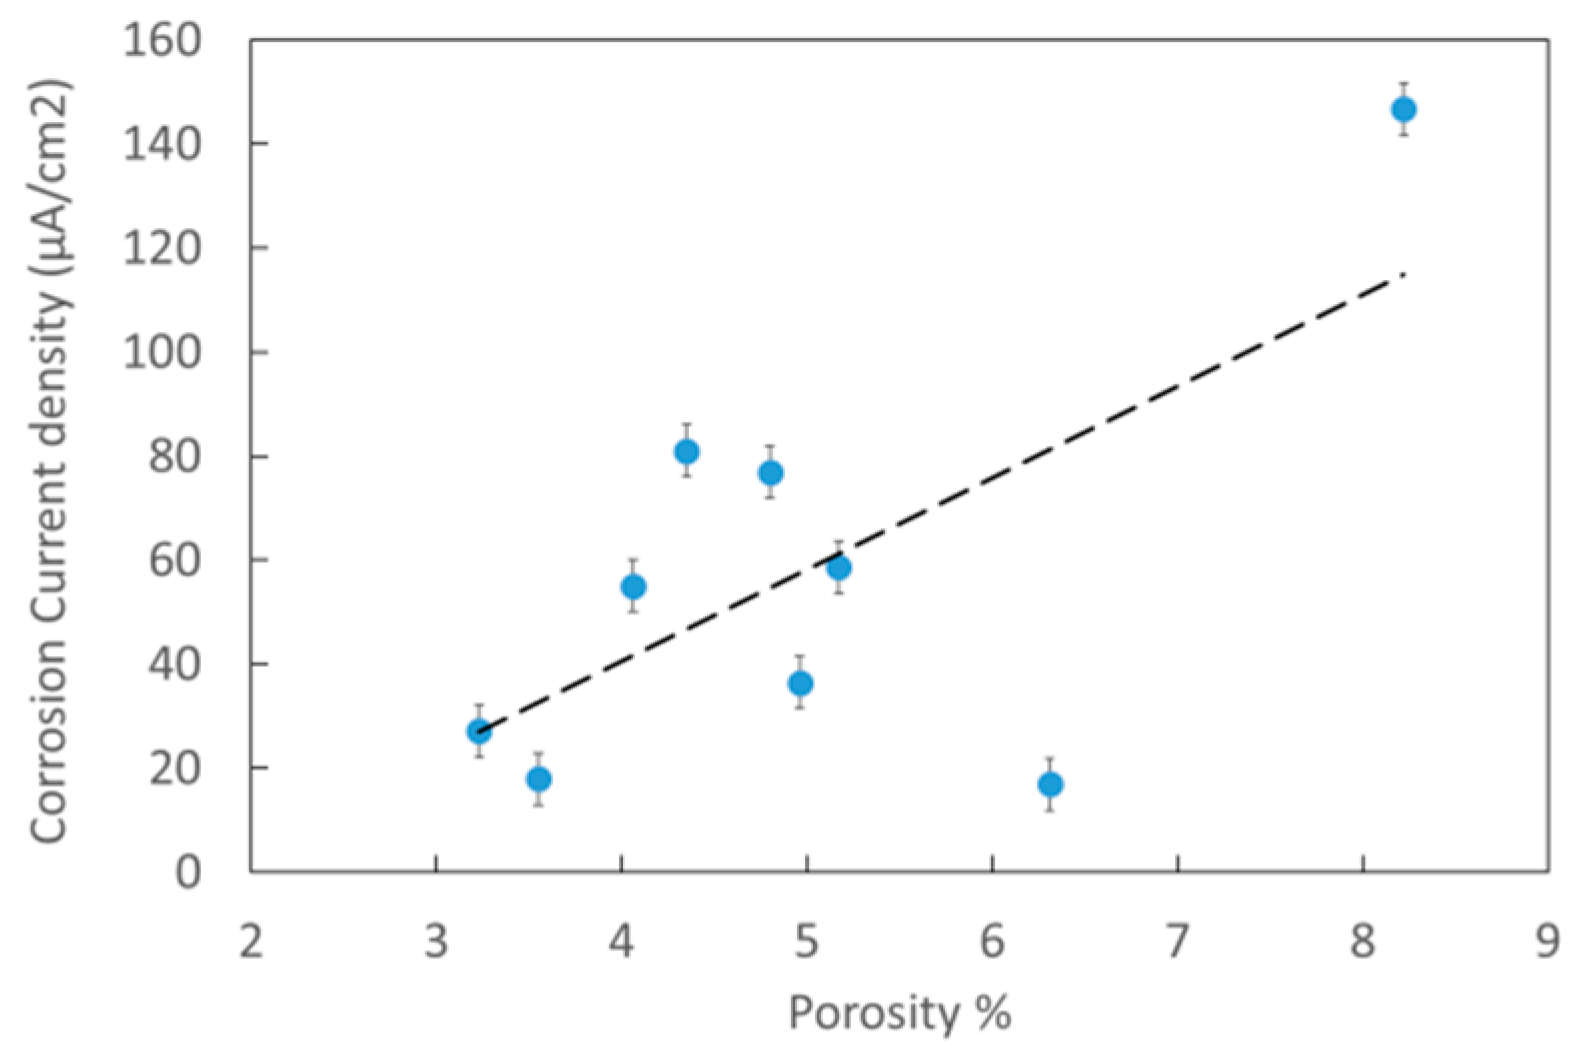
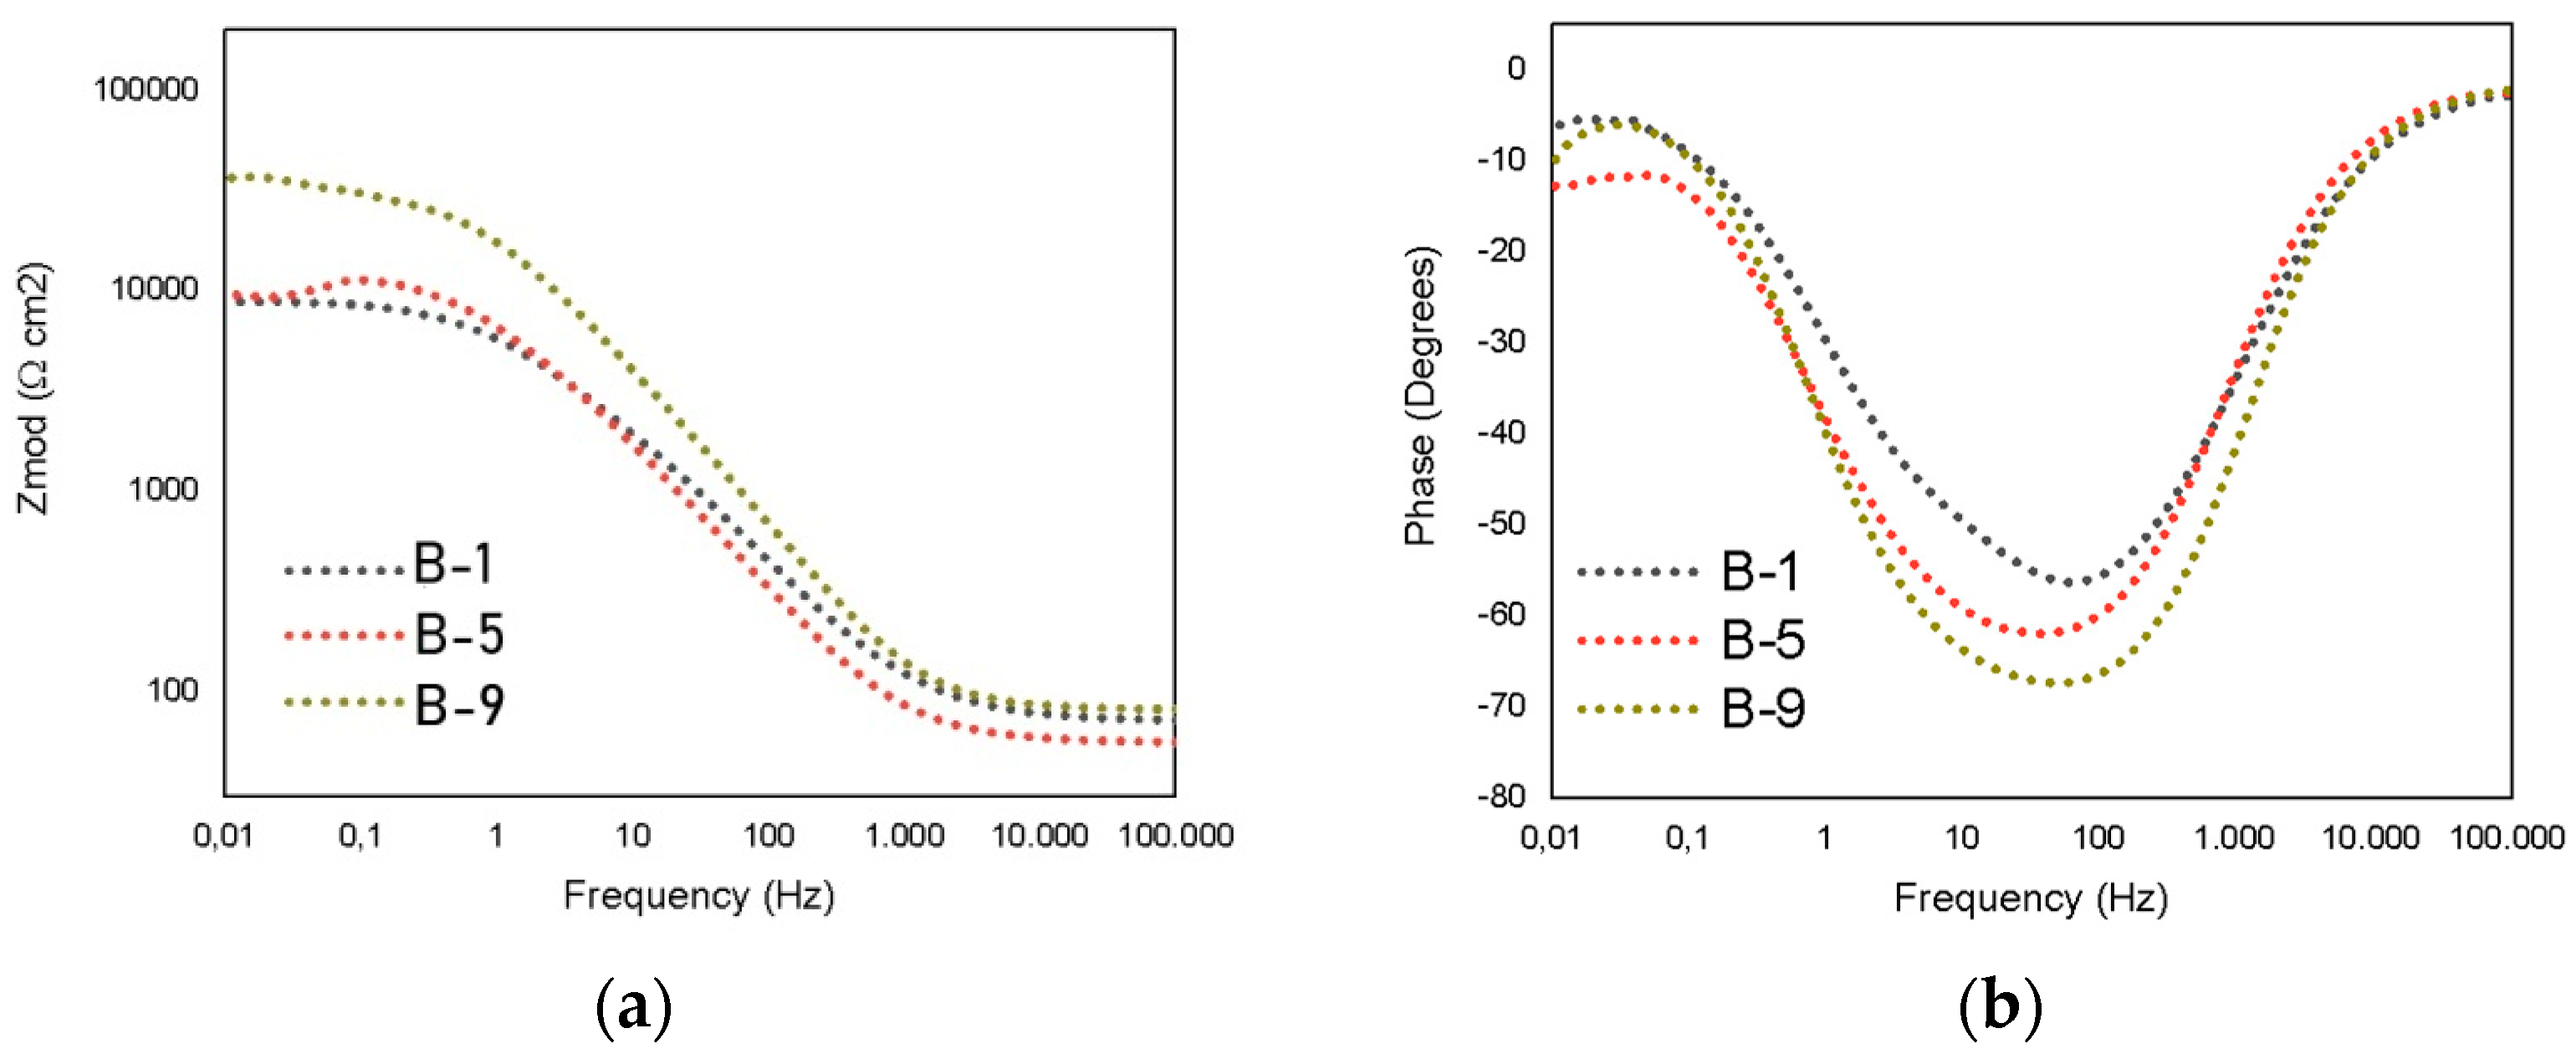
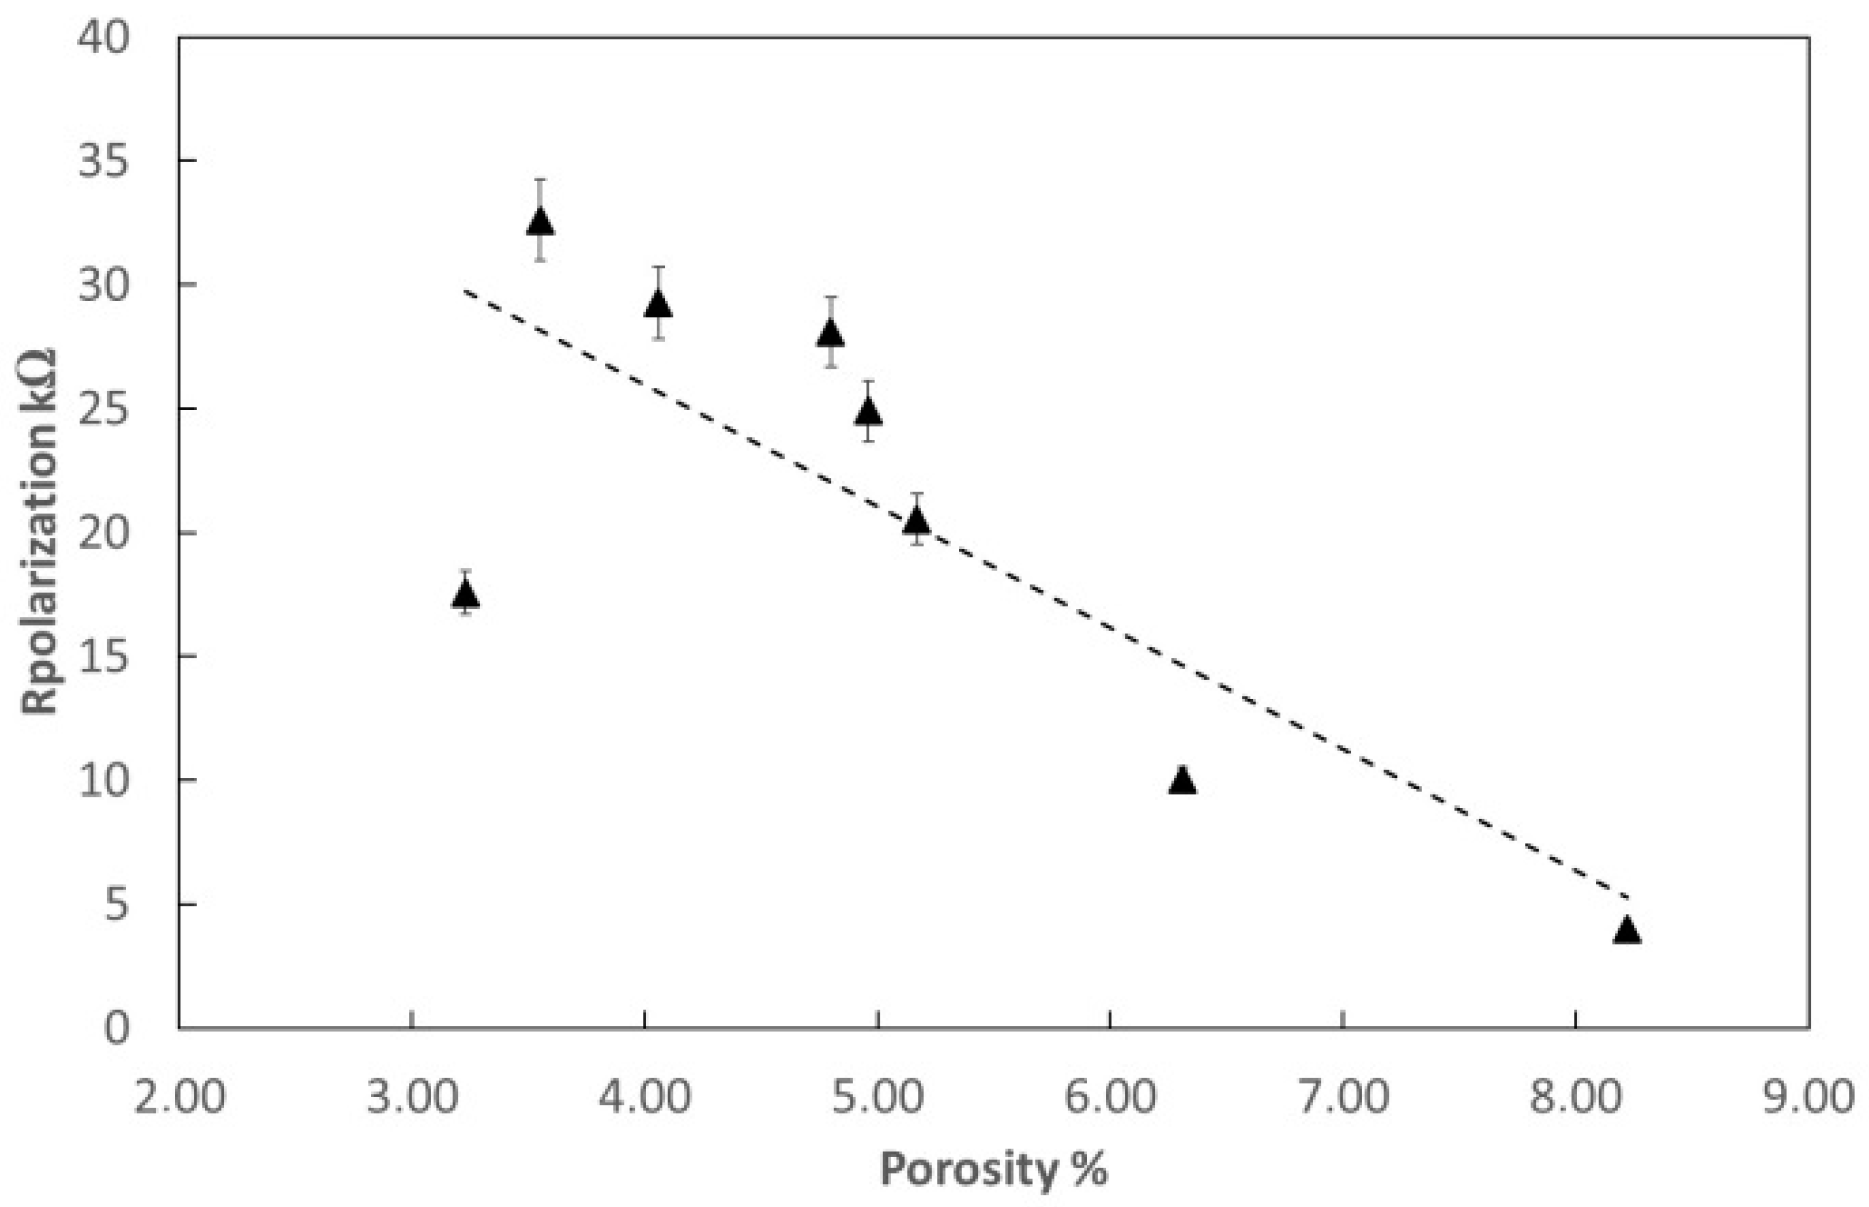
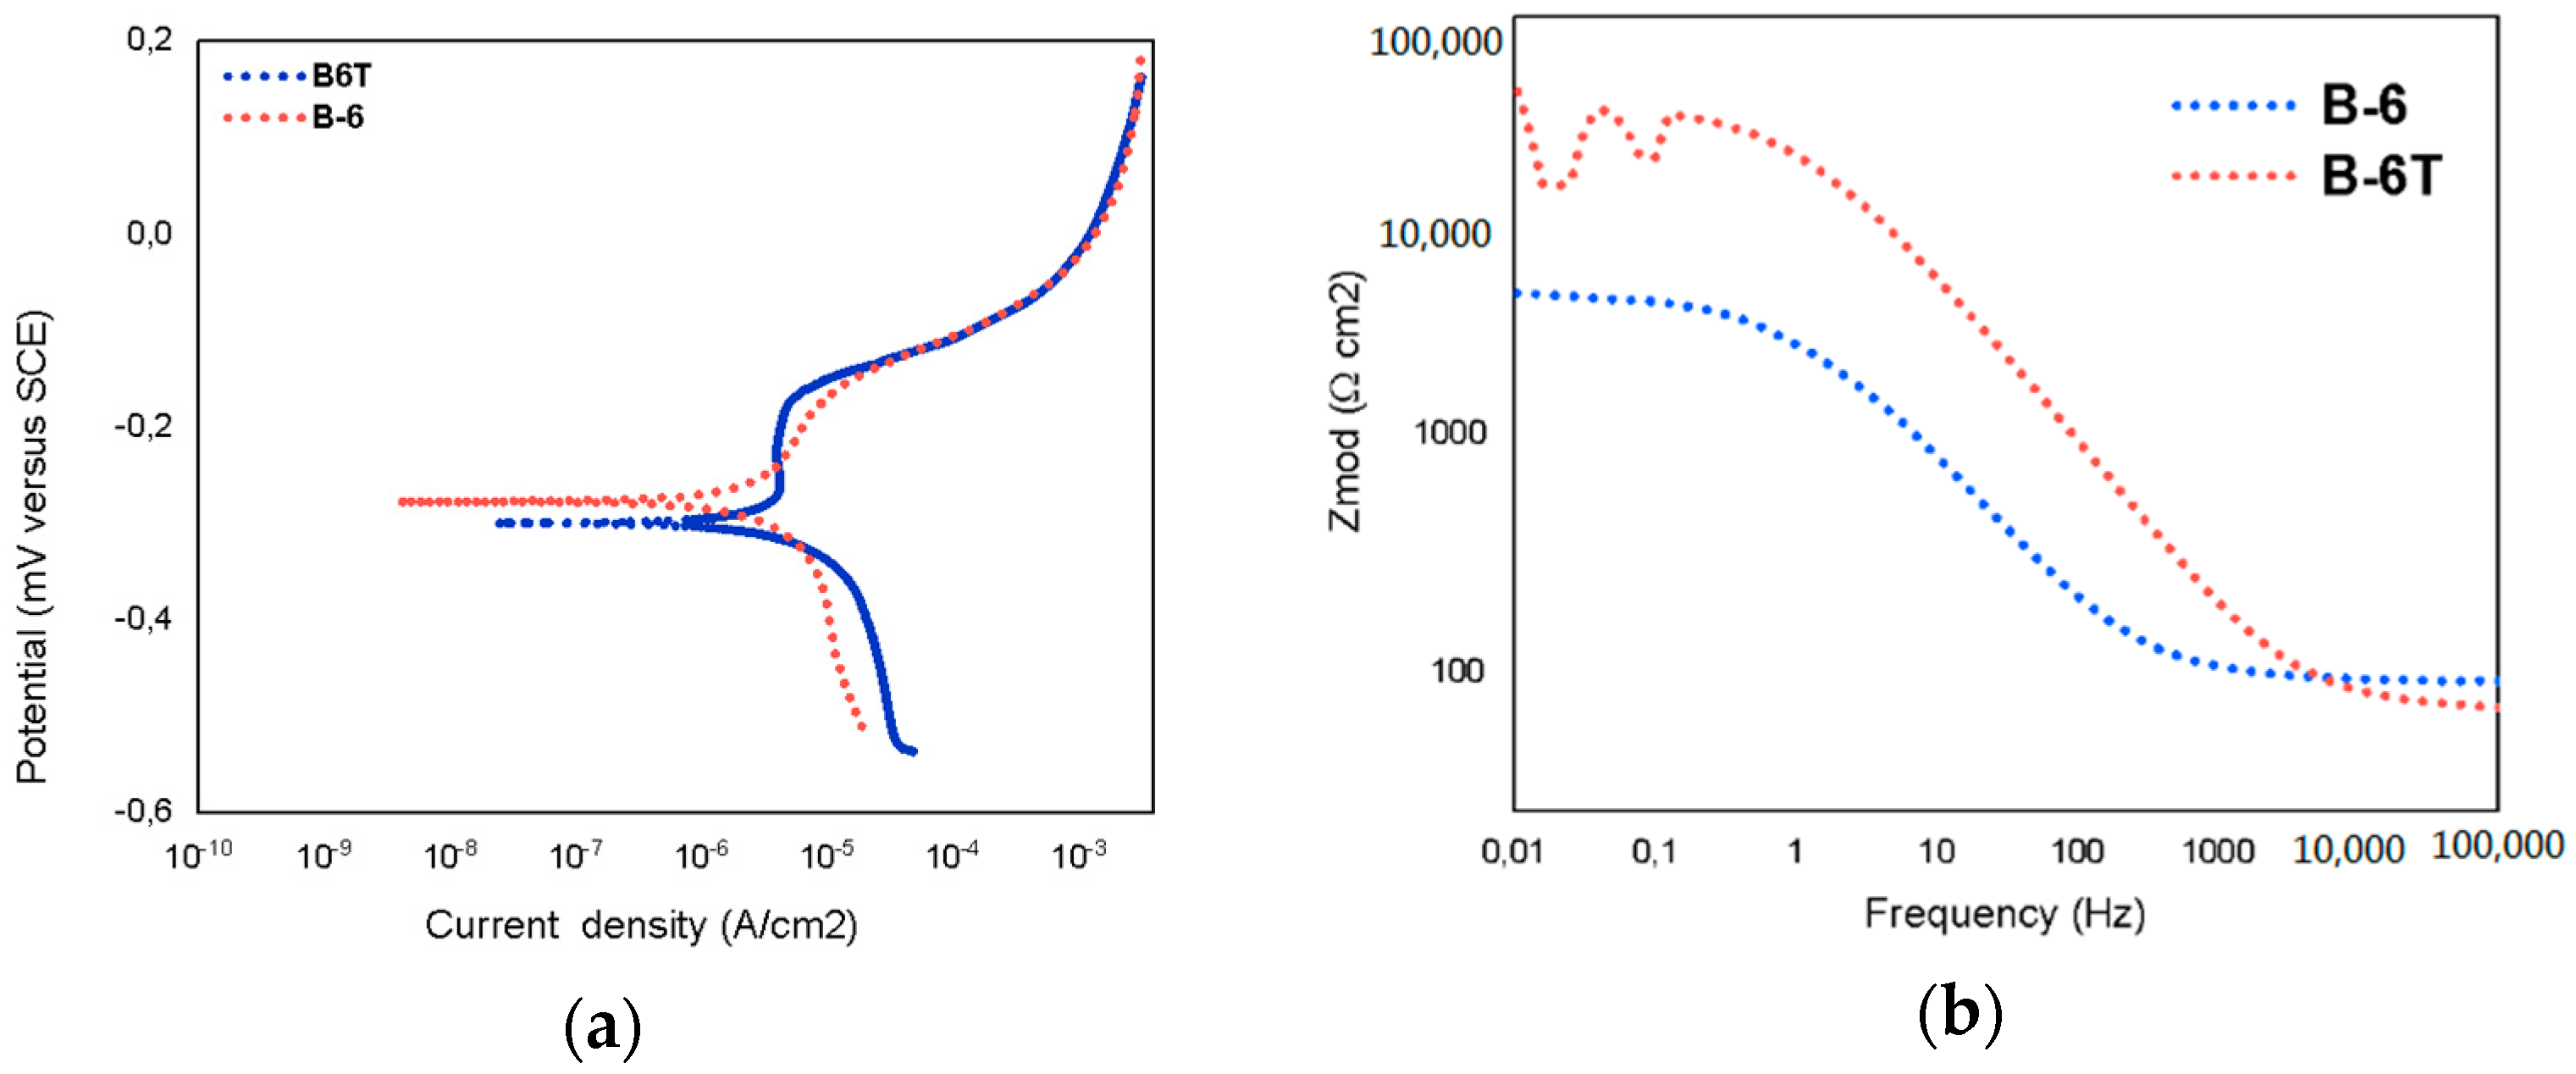
3.3. Electrochemical Measurements

Figure 8 shows the potentiodynamic polarization curves for the coatings deposited at various working pressures. It can be seen that the anodic and cathodic branches have a regular pattern and are almost the same as the coatings, with small changes in the value of the corrosion potential and the density of the corrosion current (Icorr). Comparatively, among them it is shown that the curve that corresponds to the application with 97 kPa acetylene and oxygen is the one with the lowest values of current in the figure, which indicates that it is the sample with the best resistance to corrosion. In general, the good corrosion resistance of aluminum–bronze and waterborne coatings is associated with a passive oxide film consisting of Cu2O and Al2O3, which self-repairs automatically [16]. However, the corrosion process of aluminum–bronze coatings surely occurs through the dissolution of copper to form the complex CuCl2, which can be hydrolyzed when in saline environments [17,18,19]. This compound is formed by the reaction of chlorine ions that diffuse through the pores of the coating and the dissolved copper in the coating and the substrate.
Figure 9 shows the corrosion current density (Jcorr) of the coatings as a function of the porosity. In general, there is a tendency for an increase in the Jcorr values with an increase in the porosity of the coating. For example, the coating deposited with a pressure of 331 kPa O2 and 69 kPa C2H6 exhibits the highest degree of porosity. The pores in the coatings act as “paths” or trajectories by which the corrosive electrolyte can flow to the splat of the coating and even reach the substrate itself, promoting active or anodic zones. Similarly, Walsh et al. reported that the increase in thickness reduces the degree of average porosity in Ni deposits, consequently optimizing the corrosion resistance in saline environments of 3% NaCl [20]. Likewise, Gavrila et al., in their research on the effect of the degree of porosity on the corrosion resistance of electrodeposited Zn–Ni deposition on steels, showed that an increase in the porosity of the deposits by a factor of 10 entails an equivalent increase in the corrosion rate [21].
In Figure 10, the SEM micrograph of the surface of the aluminum–bronze coating can be seen after the corrosion test on the surface of the coating, 69 kPa C2H6–345 kPa O2. There is an increase in the roughness, and a layer is formed with some corrosion products adhered to the coating after being exposed to the NaCl solution at 3.5 wt.%. It is also possible to observe the precipitation of electrolyte crystals, especially in the porous areas of the surface and the formation of the protective patina [22], which is characterized by its green color and by an appearance similar to that of fungi produced by moisture. These results agree with the research of Pompo et al. [23] and M. M. Sadawy [24], who reported that the corrosion products formed during the process strongly adhere to the surface. J.A. Wharton et al. [25] established that the corrosion resistance of aluminum–bronze can be attributed to the formation of a protective layer, perhaps 900 to 1000 nm thick, that contains aluminum and copper oxides. Figure 11 and Figure 12 show the SEM image and the EDS mapping of the elements in the corrosion film formed on the surface of the coating. In general, the presence of Cu, Al, and Fe can be seen, which are the most important elements of the coating, with Zn from the substrate and Na and Cl from the corrosive electrolyte. The presence of these elements makes it possible to conclude that after the electrochemical tests, a coating of thin salt crystals and corrosion products with cuprous chloride (CuCl) was produced [26].
Figure 13 shows the Bode diagrams of Al–Cu coating applications at 1 h immersion time. On the impedance vs. frequency graph, it can be seen that at high frequencies the values of resistance to the solution do not vary significantly, which indicates that the coating did not experience a high degree of degradation. In general, these results show two relaxation times, which are related to two slopes in the impedance graph and two loops in the Bode diagram. To better understand the electrochemical behavior of these coatings, the EIS results were fit to an equivalent circuit model proposed by Dermaj et al. [27] and Rahmouni et al. [28] for bronze subjected to corrosive processes in a 3% NaCl solution. A couple of elements, CPEc (c is the coating) and Rpo, were used in parallel to replace the dielectric properties of the coating. The other pair of elements, CPEdc and Rct in parallel, was adapted to describe the charge transfer at the coating/substrate interface due to the presence of micropores. Rpo is the resistance of the circuit to current flow through the pores, while Rsln represents the resistance of the electrolyte between the working electrode and the reference electrode, and Rct is the resistance to charge transfer. The time constant at higher frequencies in this circuit represents the dielectric pattern (CPEc and M) of the coating, and the time constant at lower frequencies represents the coating/substrate interface (CPEcd and N) properties [26].
The CPEs are a mathematical support that represents several elements of an electrical circuit. The impedance value of a CPE is shown by the following equation:
ZCPE = Zo(jω)n(1)
where Zo and n are frequency-independent fit parameters, j = (−1)1/2, and ω is the angular frequency. The factor n, defined as a CPE power, always had a value between 0.5 and 1. The Bode plot was obtained from the slope of |Z|. When n = 0.5, CPE represents the Warburg impedance, W, with a diffusion character, and CPE becomes reduced to an ideal capacitor for n = 1 and to a simple resistor for n = 0. Table 2 shows the results obtained through fitting the proposed equivalent circuit to the experimental data obtained in the EIS results of the aluminum–bronze coatings. In general terms, it can be seen that most coatings exhibit a capacitive behavior (n = 0.8), which indicates that the surface of the electrode is heterogeneous. Furthermore, as the value of n is lower than 1, it can be deduced that the surface under study behaves like a capacitor with leakage of charge or mass.
In general, the values of Rct and Rpo are high, which shows that the coating has good anticorrosive properties, which can be attributed to the formation of copper and aluminum oxides during the corrosive test. The sum of Rpo and Rcor is used to represent the polarization resistance (Rp), which is inversely proportional to the corrosion current density, that is, the higher the value of the sum, the slower the corrosion rate. Figure 14 shows the results of the polarization resistance as a function of the porosity of the produced coatings. An increase in the values of Rp is shown in the samples with low porosity percentage, that is, the reduction of the pores reduces the paths for the ions of the corrosive electrolyte to circulate through the thickness of the coating and the substrate to form pitting. According to the microstructural study, the less porous coatings were deposited with the highest values of collision speed and temperature, which favored a reduction in the size of the particles, their greater plasticity on the substrate, and better union between splats. This structure is more compact and generates greater obstacles for the diffusion of ions such as the Cl of the corrosive medium inside the coating, thus increasing the polarization resistance. On the other hand, some investigations [28,29,30] have found that during the time of the test, the pores or microcracks in the coating can improve the resistance to corrosion by plugging these defects with the corrosion products generated. In this way, the ionic conduction and the density of the electrolyte diffusion zones towards the substrate can be decreased. Polarization resistance can also be increased by partial passivation of the coating by the formation of protective oxide layers such as Al2O3 and Cu2O, which are known to be highly protective against corrosion, as they are easily formed and are also dense, homogeneous, and of high adherence [31].
Figure 15 shows images obtained via scanning electron microscopy of the coating applied with 331 kPa oxygen and 69 kPa acetylene. The surface of the coating is seen before immersion and after carrying out the corrosion tests. This comparative study allows observation of the deterioration undergone by these coatings due to the electrochemical tests, with a cracked surface and some corrosion products. This failure mode can be explained by the corrosive attack of the electrolyte when it penetrates into the coating through the pores, cracks, and defects, such as boundaries between splats and the grain, into which O2 ions can diffuse at a lower velocity than Cl ions, generating a process of crack corrosion [29]. In this process, anodic zones are generated by the dissolution of Cu, Al and Zn (from the substrate) that later react with oxygen and chlorine to form the corrosion products, plugging the pores and the surface of the coating. The dissolution of the metals in the substrate generates a loss of adherence to the coating, which can later generate small delaminations and a severe corrosive attack on the coating–substrate system [32]. In addition, it must be borne in mind that during the corrosion test, passivation layers can be generated that increase in thickness until localized corrosion is generated by grain boundaries [32].
Figure 16 shows the potentiodynamic polarization curves and the Bode diagrams for the sample B6, before and after thermal treatment. Thermal treatments were carried out in order to reduce the defects in the produced coatings. In this investigation, sample B6 was selected to compare the effect of the treatment on the corrosion resistance. Table 3 shows the main results obtained in the electrochemical test, and the porosity of the coatings with and without treatment are presented. The heat-treated coating (B-6T) exhibited a decrease in its current density compared to the coating without annealing (B-6). The effect of the mechanisms of diffusion on the microstructure was more significant in the response to corrosion of the coatings. This is surely due to the formation of a more compact structure, greater adherence between the coating and the substrate, and the increase in the oxide content. In Table 3, results of the potentio-dynamic tests of the coatings are shown. Finally, Table 3 also shows the results of the polarization resistance obtained via electrochemical impedance spectroscopy. The higher the value of Rp, the slower will be the corrosion rate. These results allow us to confirm that thermally-treated coatings improve corrosion resistance. The increase in Rp in of the annealed coatings is the result of an improvement in their structure due to pore plugging, increased oxide concentration, increased adhesion between splats, etc., and thus reduction in the density of zones of electrolyte diffusion into the coating and the substrate.
These results allow us to conclude that using this process, economical coatings can be achieved that can be used successfully for the protection and repair of naval, automotive, and aeronautical components or as coatings for increasing the durability of various industrial components subject to conditions of severe degradation. These structural elements are in a marine environment in the transportation system, where the high degree of deterioration and marine corrosion causes loss of material.

4. Conclusions

Aluminum–bronze coatings on naval brass were produced by means of thermal projection by the flame technique, varying the pressure of the feed gases. In this study, the following results were achieved.
In general, there is a tendency for a reduction in the porosity percentages with an increase of feed pressures and an increase in the Jcorr values, with an increase in the porosity of the coating. The coating deposited with oxygen at 359 kPa and acetylene at 97 kPa exhibited lower corrosion current, higher corrosion potential, and higher polarization resistance compared with the other depositions. By contrast, the results obtained show that the deposition carried out with pressures of 331 kPa oxygen and 69 kPa acetylene exhibited the lowest potential values, which automatically converts it into a less noble coating, with a low degree of protection against corrosion.
The good resistance to corrosion of these coatings is associated with a thin passive oxide film; however, the anticorrosive properties are reduced with an increase in the porosity of the coatings. This could be explained by the pores in the coatings acting as “paths” or trajectories through which the corrosive electrolyte can flow to the splat of the coating and even reach the substrate itself, promoting active or anodic zones. In this way, the corrosion process begins with the dissolution of the elements of the coating and the substrate, and then there is a loss of adherence in the interface of the coating–substrate system and plugging of pores by some corrosion products.
The thermal treatments of the B-6 coatings improved the resistance to corrosion. This was explained by the significant effect of the diffusion mechanisms on the microstructure; that is, a more compact structure, greater adherence between the coating and the substrate, better union between splats, and an increase in the oxide content were achieved.
These coatings can be used for the protection and repair of naval, automotive, and aeronautical components and for coating structural components in order to improve their durability in applications subject to severe corrosion. For future investigations, the influence of the pressure on the mechanical and tribological properties could be studied, and these coatings could be applied under the conditions of the greatest pressure achieved in this research to some industrial components, in order to determine their performance for different industrial sectors.

Author Contributions

O.P. and J.O. conceived and designed the experiments; A.M. performed the experiments; and O.P., J.O. and A.M. wrote the paper.

Funding

This research was funded by Departamento Administrativo de Ciencia, Tecnología e Innovación: Colciencias, convocatoria doctorados nacionales No. 727 de 2015.

Acknowledgments

The authors wish to acknowledge the technological support provided by: Universidad Nacional de Colombia; Centro de Investigación de MaterialesAvanzados CIMA and Research Associate Kleberg Advanced Microscopy Center, University of Texas at San Antonio.

Conflicts of Interest

The authors declare no conflict of interest.

References

  1. Castolin Eutectic. PROXON® 21071: One Step Alloy Powder for the Cold Spray Process Rebuilding Worn Parts; Castolin Eutectic: Lausanne, Switzerland, 2011. [Google Scholar]
  2. Morales, J.A.; Olaya, J.J. An Approach to Thermal Spray Technology; UNAL–COTECMAR: Cartagena, Colombia, 2009. [Google Scholar]
  3. Dimaté, L.M. Resistencia a la Corrosión en Recubrimientos Comerciales METACERAM 25050 y Proxon 21071 Producidos con el Sistema de Proyección Térmica por Llama. Master’s Thesis, Universidad Nacional de Colombia, Bogotá, Colombia, 2011. Available online: http://www.bdigital.unal.edu.co/5222/ (accessed on 1 June 2019).
  4. Fauchais, M.I.; Heberlein, P.L.; Boulos, J.V.R. Thermal Spray Fundamentals, from Powder to Part; Springer: New York, NY, USA, 2014; pp. 228–238. [Google Scholar]
  5. Djebali, M.; Pateyron, R.; ElGanaoui, B. Scrutiny of plasma spraying complexities with case study on the optimized conditions toward coating process control. Case Stud. Therm. Eng. 2015, 6, 171–181. [Google Scholar] [CrossRef] [Green Version]
  6. JETS and POUDRES. Available online: http://jets.poudres.free.fr/en/home.html (accessed on 15 July 2019).
  7. Delluc, G.; Mariaux, G.; Vardelle, A.; Fauchais, P.; Pateyron, B. A Numerical Tool for Plasma Spraying Part I: Modelling of Plasma Jet and Particle Behaviour. In Proceedings of the 16th International Symposium on Plasma Chemistry, Taormina, Italy, 22–27 June 2003. [Google Scholar]
  8. Ortiz, J.L.; Manzano, A.; Olvera, O.; Perez, M.A. Principios Básicos de Corrosión y Sus Prácticas de Laboratorio, 1st ed.; Limusa: Ciudad de Mexico, Mexico, 2009; pp. 21–40. [Google Scholar]
  9. Cadavid, E.; Parra, C.; Vargas, F. Estudio de llamas oxiacetilénica usadas en la proyección térmica. Rev. Colomb. Mater. 2016, 9, 15–16. Available online: http://aprendeenlinea.udea.edu.co/revistas/index.php/materiales/article/view/326490/20783786 (accessed on 1 July 2019).
  10. LI, W.S.; Yi, L.I.U.; Wang, Z.P.; Chao, M.; Wang, S.C. Effects of Ce in novel bronze and its plasma sprayed coating. Trans. Nonferrous Met. Soc. China 2012, 22, 2139–2145. [Google Scholar] [CrossRef]
  11. Gonzales, A.G. Estudio de la Influencia de Las Propiedades Físicas y Mecánicas en el Comportamiento Tribológico de Recubrimientos Duros Para Herramientas de Corte y Procesamiento de Polietileno. Master’s Thesis, Universidad de Antioquia, Medellin, Columbia, 2008. Available online: http://tesis.udea.edu.co/handle/10495/48 (accessed on 1 June 2019).
  12. Koivuluoto, H.; Honkanen, M.; Vuoristo, P. Cold-sprayed copper and tantalum coatings—Detailed FESEM and TEM analysis. Surf. Coat. Technol. 2010, 204, 2353–2361. [Google Scholar] [CrossRef]
  13. Hincapie-campos, W.S.; Olaya, J.J.; Alfonso-Orjuela, J.E. Microstructural, mechanical and wear characterization of CuxAly coatings deposited via thermal projection. DYNA 2017, 84, 155–163. [Google Scholar] [CrossRef]
  14. Richer, P.; Zúñiga, A.; Yandouzi, M.; Jodoin, B. CoNiCrAl Y microstructural changes induced during Cold Gas Dynamic Spraying. Surf. Coat. Technol. 2008, 203, 364–371. [Google Scholar] [CrossRef]
  15. Kawaguchi, Y.; Miyazaki, F.; Yamasaki, M.; Yamagata, Y.; Kobayashi, N.; Muraoka, K. Coating Qualities Deposited Using Three Different Thermal Spray Technologies in Relation with Temperatures and Velocities of Spray Droplets. Coatings 2017, 7, 27. [Google Scholar] [CrossRef]
  16. Richardson, I. Guide to Nickel Aluminium Bronze for Engineers. Copp. Dev. Assoc. 2016, 222, 8–9. Available online: https://www.copper.org/applications/marine/nickel_al_bronze/pub-222-nickel-al-bronze-guide-engineers.pdf (accessed on 1 June 2019).
  17. Kear, G.; Barker, B.D.; Walsh, F.C. Electrochemical Corrosion of Unalloyed Copper in Chloride media—A Critical Review. Corros. Sci. 2004, 49, 109–135. [Google Scholar] [CrossRef]
  18. Wharton, J.A.; Stokes, K.R. The Influence of Nickel-aluminium Bronze Microstructure and Crevice Solution on the Nitiation of Crevice Corrosion. Electrochim. Acta 2008, 53, 2463–2473. [Google Scholar] [CrossRef]
  19. Kabasakaloğlu, A.A.M.; Kiyak, T.; Şendil, O. Electrochemical Behavior of Brass in 0.1 M NaCl. Appl. Surf. Sci. 2002, 193, 167–174. [Google Scholar] [CrossRef]
  20. Walsh, F.C.; De León, C.P.; Kerr, C.; Court, S.; Barker, B.D. Electrochemical characterisation of the porosity and corrosion resistance of electrochemically deposited metal coatings. Surf. Coat. Technol. 2008, 202, 5092–5102. [Google Scholar] [CrossRef] [Green Version]
  21. Gavrila, M.; Millet, J.P.; Mazille, H.; Marchandise, D.; Cuntz, J.M. Corrosion behaviour of zinc-nickel coatings, electrodeposited on steel. Surf. Coat. Technol. 2000, 123, 164–172. [Google Scholar] [CrossRef]
  22. Bendezú, R.P.; Gonçalves, R.P.; Neiva, A.C.; De Melo, H.G. EIS and microstructural characterization of artificial nitrate patina layers produced at room temperature on copper and bronze. J. Braz. Chem. Soc. 2007, 18, 54–64. [Google Scholar] [CrossRef]
  23. Pombo Rodriguez, R.M.H.; Paredes, R.S.C.; Wido, S.H.; Calixto, A. Comparison of aluminum coatings deposited by flame spray and by electric arc spray. Surf. Coat. Technol. 2007, 202, 172–179. [Google Scholar] [CrossRef]
  24. Sadawy, M.M.; Ghanem, M.; Zohdy, K.M. Corrosion and Electrochemical Behavior of Leaded-Bronze Alloys in 3.5 wt% NaCl Solution. Am. J. Chem. Appl. 2014, 1, 1–6. [Google Scholar]
  25. Wharton, J.A.; Barik, R.C.; Kear, G.; Wood, R.J.K.; Stokes, K.R.; Walsh, F.C. The corrosion of nickel-aluminium bronze in seawater. Corros. Sci. 2005, 47, 3336–3367. [Google Scholar] [CrossRef]
  26. Saud, S.N.; Hamzah, E.; Abubakar, T.; Bakhsheshi-Rad, H.R.; Farahany, S.; Abdolahi, A.; Taheri, M.M. Influence of Silver nanoparticles addition on the phase transformation, mechanical properties and corrosion behaviour of Cu–Al–Ni shape memory alloys. J. Alloys Compd. 2014, 612, 471–478. [Google Scholar] [CrossRef]
  27. Dermaj, A.; Hajjaji, N.; Joiret, S.; Rahmouni, K.; Srhiri, A.; Takenouti, H.; Vivier, V. Electrochemical and spectroscopic evidences of corrosion inhibition of bronze by a triazole derivative. Electrochim. Acta 2007, 52, 4654–4662. [Google Scholar] [CrossRef]
  28. Rahmouni, K.; Keddam, M.; Srhiri, A.; Takenouti, H. Corrosion of copper in 3% NaCl solution polluted by sulphide ions. Corros. Sci. 2005, 47, 3249–3266. [Google Scholar] [CrossRef]
  29. Xu, C.; Du, L.; Yang, B.; Zhang, W. Study on salt spray corrosion of Ni-graphite abradable coating with 80Ni20Al and 96NiCr-4Al as bonding layers. Surf. Coat. Technol. 2011, 205, 4154–4161. [Google Scholar] [CrossRef]
  30. Epelboin, I.; Keddam, M.; Takenouti, H. Use of impedance measurements for the determination of the instant rate of metal corrosion. J. Appl. Electrochem. 1972, 2, 71–79. [Google Scholar] [CrossRef]
  31. Chen, Y.; Qi, D.M.; Wang, H.P.; Xu, Z.; Yi, C.X.; Zhang, Z. Corrosion behavior of aluminum bronze under thin electrolyte layers containing artificial seawater. Int. J. Electrochem. Sci. 2015, 10, 9056–9072. Available online: http://www.electrochemsci.org/papers/vol10/101109056.pdf (accessed on 1 June 2019).
  32. Lister, T.E.; Wright, R.N.; Pinhero, P.J.; Swank, W.D. Corrosion of thermal spray hastelloy C-22 coatings in dilute HCl. J. Therm. Spray Technol. 2002, 11, 530–535. [Google Scholar] [CrossRef]
Figure 1. Variation in the velocity of particles colliding with the substrate vs. the variation of oxygen pressure in kPa.
Coatings 09 00507 g001
Figure 2. Chemical composition of coatings. Weight percentage determined by EDS Analysis.
Coatings 09 00507 g002
Figure 3. Chemical mapping of the surface coating at applied pressures of 359 kPa oxygen and 97 kPa acetylene: (a) EDS map of oxygen in red; (b) EDS map of aluminum in green; (c) EDS map of copper in violet; (d) EDS map of iron in yellow; (e) SEM micrograph of the surface; (f) EDS spectrum.
Coatings 09 00507 g003
Figure 4. X-ray diffraction (XRD) of the nine variations of oxygen and acetylene pressures for aluminum–bronze coatings.
Coatings 09 00507 g004
Figure 5. Application projected with a pressure of 331 kPa oxygen and 69 kPa acetylene. (a) and (b) SEM micrograph in cross-section; (c) and (d) SEM micrograph of the surface.
Coatings 09 00507 g005
Figure 6. (a) TEM images with microstructural details in the transverse direction of the 331 kPa oxygen–69 kPa acetylene coating. The cutting bands are shown. (b) TEM image with details of the band microstructure, a density dislocation in the structure, and fine-grained areas.
Coatings 09 00507 g006
Figure 7. (a) Porosity percentage vs. collision velocity of the particles; (b) porosity percentage vs. enthalpy; (c) and (d) SEM micrography processing by gray contrast
Coatings 09 00507 g007aCoatings 09 00507 g007b
Figure 8. Potentio-dynamic polarization curves of coatings deposited under different pressure conditions of oxygen and acetylene.
Coatings 09 00507 g008
Figure 9. Current density vs. percentage of porosity.
Coatings 09 00507 g009
Figure 10. Surface coating of aluminum–bronze after the impedance test for the coating, 69 kPa C2H6– 345 kPa O2. (a) Salt crystals, and (b) corrosion products.
Coatings 09 00507 g010
Figure 11. SEM morphology, energy dispersion spectroscopy, and elementary mapping of the aluminum–bronze film after the Tafel tests for the coating, 69 kPa C2H6–359 kPa O2.
Coatings 09 00507 g011
Figure 12. Elementary mapping of the EDS coating, 69 kPa C2H6–359 kPa O2.
Coatings 09 00507 g012
Figure 13. Spectra for Cu–Al coatings. (a) Impedance vs. frequency; (b) phase angle vs. frequency.
Coatings 09 00507 g013
Figure 14. Variation of the polarization resistance as a function of the percentage of porosity for aluminum–bronze coatings.
Coatings 09 00507 g014
Figure 15. (a) and (b) SEM micrograph of the surface of the coating with 359 kPa oxygen–69 kPa acetylene applied before the EIS test. (c) and (d) Micrography of the surface of the coating with 359 kPa oxygen–69 kPa acetylene applied after the EIS test at 350× and 600×.
Coatings 09 00507 g015
Figure 16. Electrochemical test. (a) Potentio-dynamic polarization curves; (b) Bode spectra for Cu–Al coatings: Impedance vs. frequency and phase angle vs. frequency.
Coatings 09 00507 g016
Table 1. Samples and parameters depositionof the experiment.
TestingOxygen Pressure [kPa]Oxygen Volumetric Flow [L/min]Acetylene Pressure [kPa]Acetylene Volumetric Flow [L/min]
B-1331336927
B-2345356927
B-3359376927
B-4331338328
B-5345358328
B-6359378328
B-7331339729
B-8345359729
B-9359379729
Table 2. Results of the equivalent circuit settings of the EIS impedance results obtained from the aluminum–bronze coatings.
TestingRsoln [Ω]Rct [Ω]Rpo [Ω]CPE1nCPE2m Rp [Ω]
B-154.0631578191.39 × 10−40.6722.93 × 10−40.5563977
B-280.8416,65038782.66 × 10−80.9981.89 × 10−50.78620,528
B-364.1613,28015,9905.58 × 10−60.9548.32 × 10−60.83629,270
B-480.7410,31014,5906.90 × 10−60.8316.05 × 10−60.84524,900
B-556.21459554139.73 × 10−60.991.80 × 10−50.80410,008
B-684.26923656,6203.10 × 10−60.992.87 × 10−60.86965,856
B-757.6618,96091186.22 × 10−60.7406.60 × 10−60.84928,078
B-859.46967678975.73 × 10−60.9706.77 × 10−60.82217,573
B-981.5125,05075675.12 × 10−60.6616.17 × 10−60.84832,617
Table 3. Results of the potentiodynamic (current density) and EIS test (Rp) of the samples of coatings B-6 and B-6T without and with heat treatment.
TestingAcetylene Pressure [kPa]Oxygen Pressure [kPa]Porosity [%]Rp [Ω]Current Density [μA/cm2]
B-6693454.3548472.93 × 10−4
B-6T693452.6524,8501.89 × 10−5

