Article

Investigation of Micro-Hardness, Wear Resistance, and Defects of 316L Stainless Steel and TiC Composite Coating Fabricated by Laser Engineered Net Shaping

1
School of Mechanical and Automotive Engineering, Fujian University of Technology, Fuzhou 350118, China
2
Digital Fujian Industrial Manufacturing IoT Lab, Fuzhou 350118, China
3
School of Engineering and Technology, Western Carolina University, Cullowhee, NC 28723, USA
*
Author to whom correspondence should be addressed.
Coatings 2019, 9(8), 498; https://doi.org/10.3390/coatings9080498
Submission received: 10 July 2019 / Revised: 1 August 2019 / Accepted: 3 August 2019 / Published: 7 August 2019

Abstract

:
The influence of processing parameters in laser engineered net shaping (LENS) on the properties of 316L stainless steel and titanium carbide (TiC) composite coating was studied. The key processing parameters were laser power, scanning speed, TiC powder ratio, and powder feed rate. Mathematical models were developed to investigate the micro-hardness, wear volume, and defect area of the coating. The accuracy of the models was examined by analysis of variance and experimental validation. Results showed that micro-hardness was positively correlated with TiC powder ratio. Increasing TiC powder ratio could reduce the wear volume. In addition, the wear volume displayed an increase then decrease with increasing laser power and decreasing scanning speed. Both scanning speed and TiC powder ratio showed a recognizable impact on the defect area. Reducing the scanning speed and TiC powder ratio can effectively reduce the defect area. The targets for the processing parameters optimization were set to maximize micro-hardness, minimize wear volume, and defect area. The difference between the model prediction value and experimental validation result for micro-hardness, wear volume, and defect area were 0.46%, 4.54%, and 8.82%, respectively. These results provide guidance for the LENS processing parameters optimization in controlling and predicting of 316L/TiC composite coating properties.

1. Introduction

Laser engineered net shaping (LENS) is an additive manufacturing technology that is used to manufacture parts with enhanced property by melting a powder and depositing onto substrate with high energy laser beam [1,2,3]. This technology has become an academic and industrial focus because of the exceptional physical property, high density, and low pore rate of the finished product [4,5].
Beyond tradition materials, the materials used in additive manufacturing have expanded to composite materials [6]. Stainless steel has been widely used in industrial applications because of its plasticity, toughness, and corrosion resistance [7]. Among different types of stainless steel, AISI 316L draws the attention of researchers due to its well formability, outstanding oxidation, and corrosion resistance. However, its industrial application is limited due to its insufficient hardness and wear resistance [8]. This deficiency can be improved by adding a reinforcement material [9]. For instance, Lyu et al. used selective laser melting deposited multilayer of TiAlN/TiN coating on the substrate. By conducting orthogonal experiments they found the optimal coating with the best comprehensive property was made with a 170 W laser power, 110 mm/s scanning speed, and 0.08 mm scanning space [10]. Wu et al. deposited gradient SiC reinforced 316L metal matrix composite, and found that the micro-hardness and wear resistance were improved by increasing the SiC percentage [11]. Wang et al. applied laser melting deposition to fabricate 316L stainless steel with different levels of Cr3C2 content. They found the highest wear resistance was obtained with 15 wt.% Cr3C2 content [9]. Titanium carbide (TiC) is a favorable reinforcement material because of its outstanding wear resistance, corrosion resistance, and hardness [12]. In the past there have been numerous research work focused on TiC powder reinforcement coating. Obadele et al. [13] used the laser particle injection technique, deposited titanium carbide (TiC) and tungsten carbide (WC) composite coating, and investigated the relationship between laser process parameters and the composite coating. They found the micro-hardness was improved by hard ceramic particles, which provided an effective bonding with the substrate [13]. Liu and Shin studied TiC-reinforced Ti6Al4V-TiC composites and found carbon induced solid solution strengthening enhanced the composite microstructure [14]. Zhou et al. applied selective laser melting (SLM) in fabricating Al–15Si alloy and TiC composite. They found the TiC significantly improved the micro-hardness and wear resistance of the alloy [15].
Research on 316L stainless steel reinforcement primarily added Ti, SiC, or other ceramic powder and investigated the related mechanical properties. However, prediction and control of micro-hardness, wear resistance as well as defect diminishing was not thoroughly investigated in reinforced coating made by LENS. The value of the additive manufactured part was determined by its properties [16]. The micro-hardness and wear resistance affects the service life of parts. Therefore, improving micro-hardness and wear resistance is a goal for the additive manufactured part. Additionally, the parts’ performance are also affected by their defects (pores and cracks), which are influenced by the proportion of TiC during manufacturing [12]. Thus, the quality control regarding this defect is also a goal to guarantee the performance. This research aims to produce an outstanding 316L stainless steel and TiC-reinforced composite coating, which can be used to manufacture high performance parts. Mathematical models were developed by response surface methodology to optimize and predict the micro-hardness, wear resistance, and defect area by manipulating the LENS processing parameters.

2. Materials and Methods

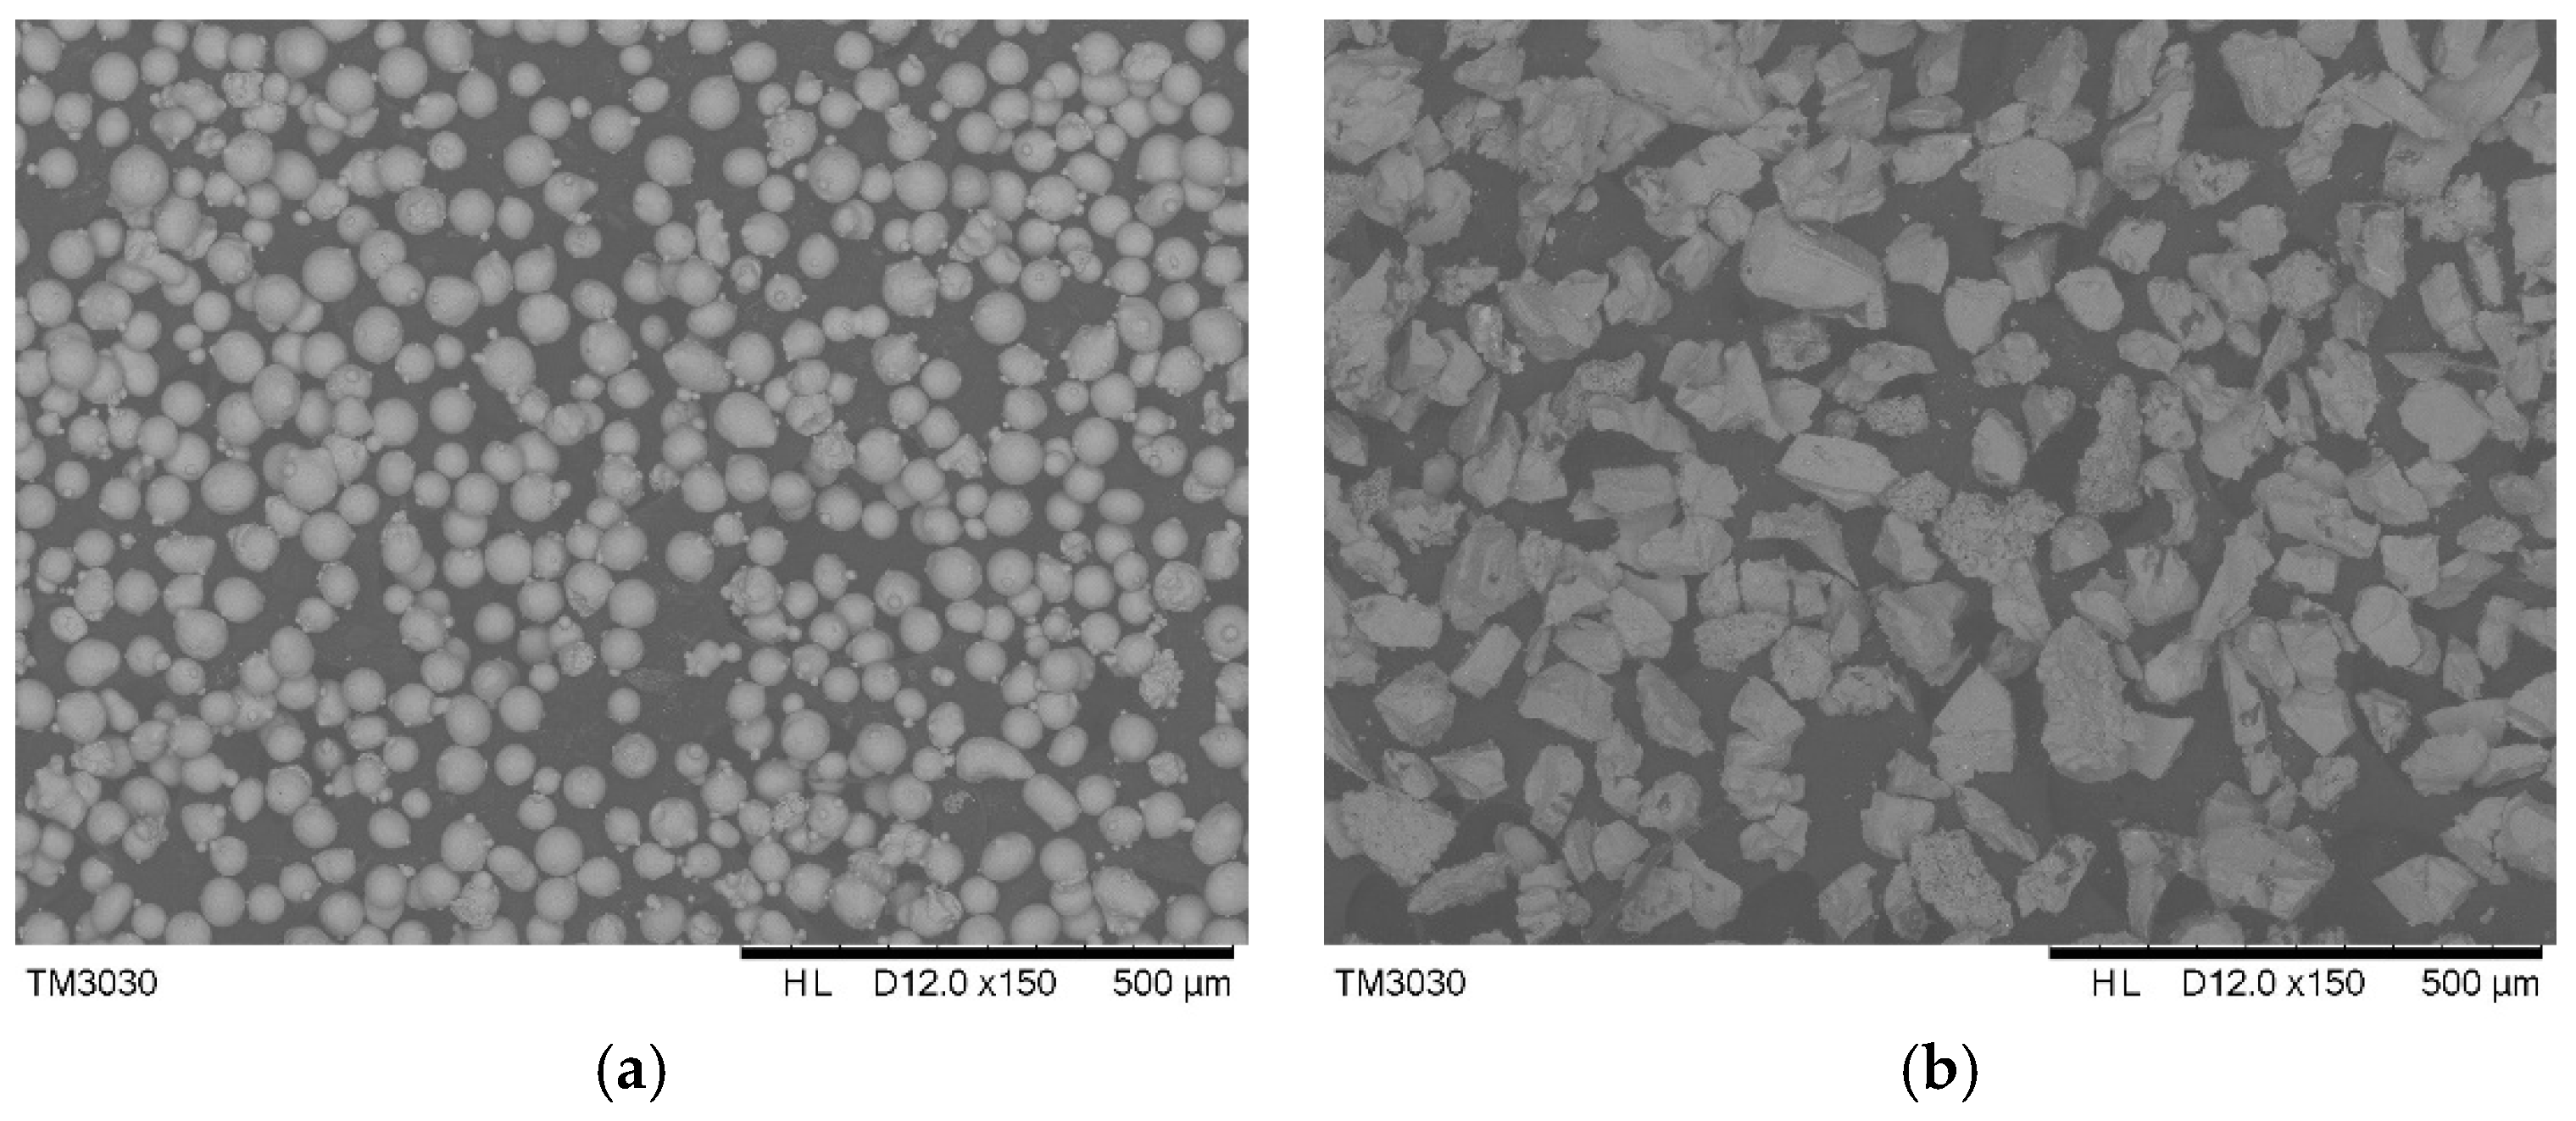
AISI/SAE 1045 steel was selected as the substrate with a size of 40 mm × 20 mm × 10 mm. The powder used in the LENS process was a composite of 316L stainless steel powder and titanium carbide (TiC) powder. Both types of powder had a particle size ~100 μm to meet the requirement of powder feeding system specification. The elemental composition of the cladding powders and the substrate is shown in Table 1. The morphology of 316L and TiC powder are shown in Figure 1.
Before conducting the LENS process, the 1045 steel substrate surface was cleaned by ethanol. The 316L and TiC powder was mixed at a speed of 400 rpm in a MITR–YXQM–2L ball mill machine (MITR, Changsha, China) for 30 min [17]. Then, the powder mixture was dried in a vacuum dryer for another 30 min at a temperature of 100 °C. Figure 2a illustrates the LENS 450 system (Optomec, Albuquerque, NM, USA) utilized in this study, consisting of a 400 W maximum output IPG fiber laser system (IPG Photonics, Oxford, MA, USA), a chamber system, a powder and gas delivery system, and a computer–controlled motion system. The powder was injected onto the substrate by the powder and gas delivery system, equipped with coaxial nozzles on a four–jet deposition head. Argon was used as a protective and carrier gas during the process. Gas flow in this study was kept at 5 L/min. The delivered powder was melted under the laser power, and the 3–axes numeric controlled motion workstation was moved to fabricate the coating, layer by layer, following the track of movement shown in Figure 2b. A 5 mm × 5 mm × 5 mm cubic size 316L/TiC composite coating was obtained on top of the substrate.
After the completion of LENS process, the samples were preceded by cutting, setting, and polishing. Next the samples were immersed in aqua regia for 10 s, and cleaned by alcohol and water afterwards. Then, the samples were dried by cold air gun. Afterwards, the microstructure and elemental analysis was examined by a scanning electron microscope (SEM) TM3030Plus (Hitachi, Tokyo, Japan) equipped with an energy-dispersive X–ray spectroscopy (EDS) A550I (IXRF, Austin, TX, USA). The micro-hardness was measured using a MVA–402TS micro-hardness tester, with 22° slant angle quadrangular pyramid diamond indenter (HDNS, Shanghai, China) by applying a 500 g force on the surface of the specimen with a 30 s duration. Then the diagonal length of the indentation was measured, and the measured length was used to check the corresponding micro-hardness with the micro-hardness table (Figure 3a). The average value was acquired by measurements that were repeated five times, to reduce errors. The complete diamond shape indentation in Figure 3a had a clear boundary, no obvious cracks and a minor pile-up effect was observed. A minor discontinuity (pop-in phenomenon) on the load–displacement curve was observed in Figure 3b, but the slight pop-in phenomenon did not imply a significant impact on the measurement of the micro-hardness [18].
The setup for the scratch test parameters are shown in Table 2. Then, the wear resistance was evaluated by a UMT-2 high load scratch tester (Bruker, Billerica, MA, USA). Additionally, the 3D morphology of the wear surface was obtained through white light interferometry, and the width and depth of the worn area was measured. Repeating the measurement of the width and depth in five different locations enabled to obtain the average wear-off area. Then, the wear volume was calculated by multiplying the average wear-off area with the scratching distance [17]. In the end, the defect area was measured by using a KH–1300 3D microscope (Hirox Co., Ltd., Tokyo, Japan).
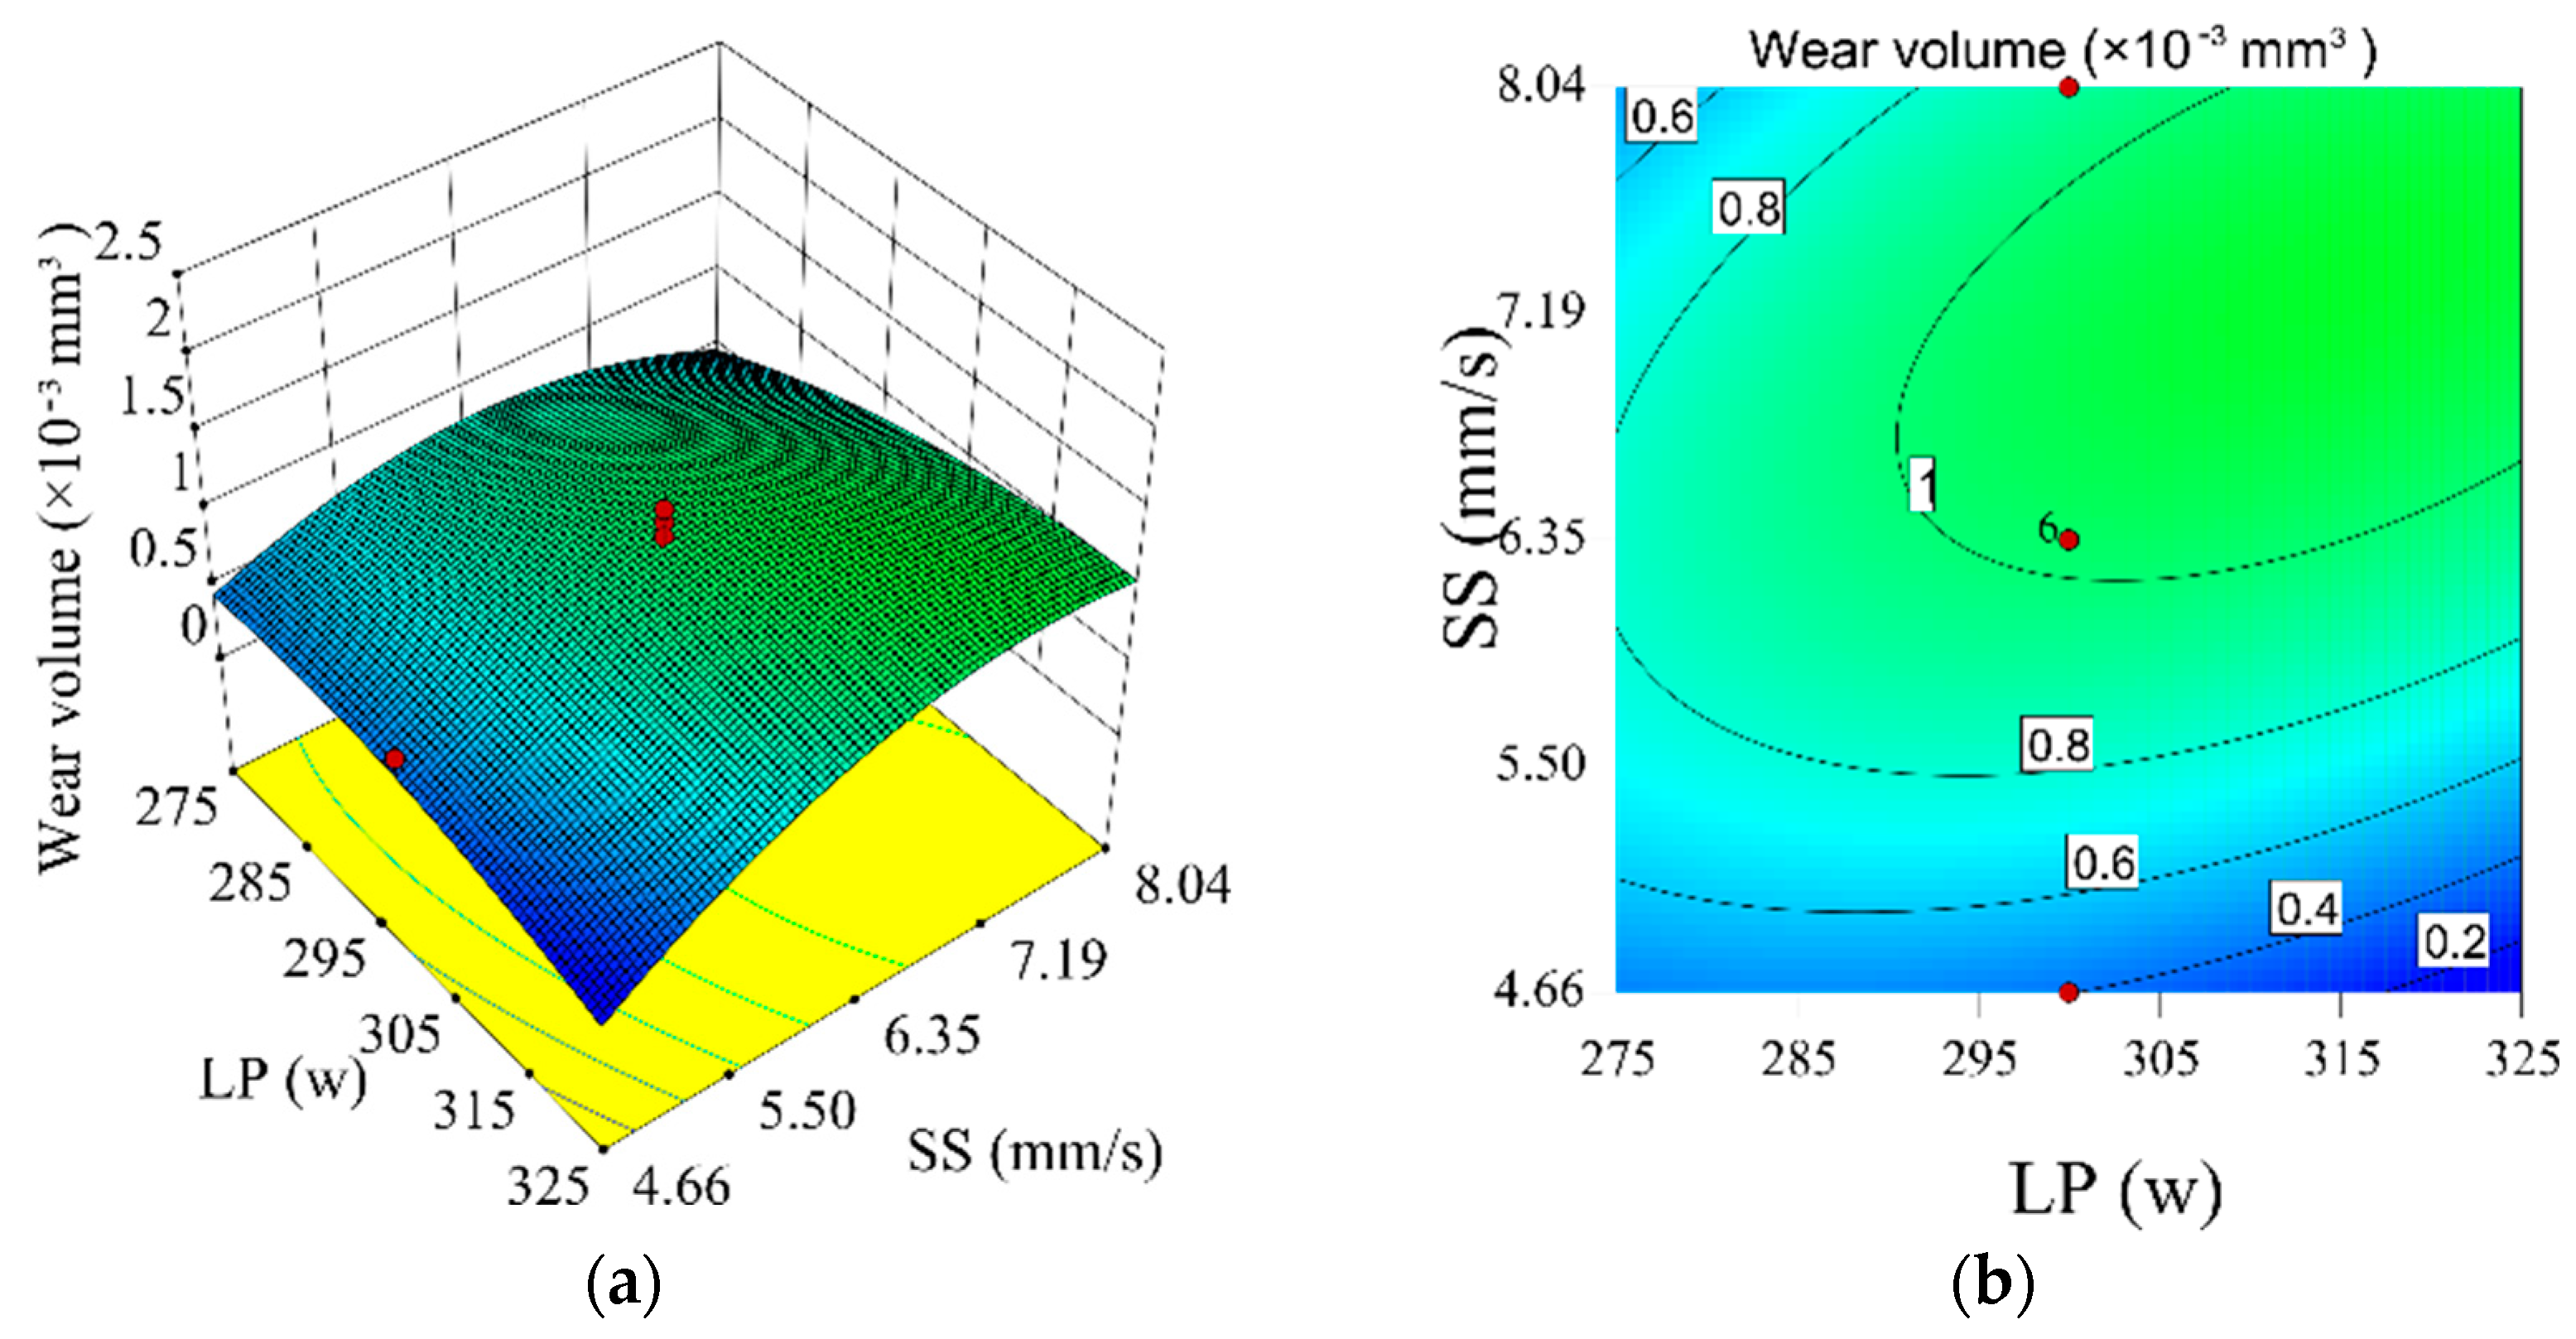
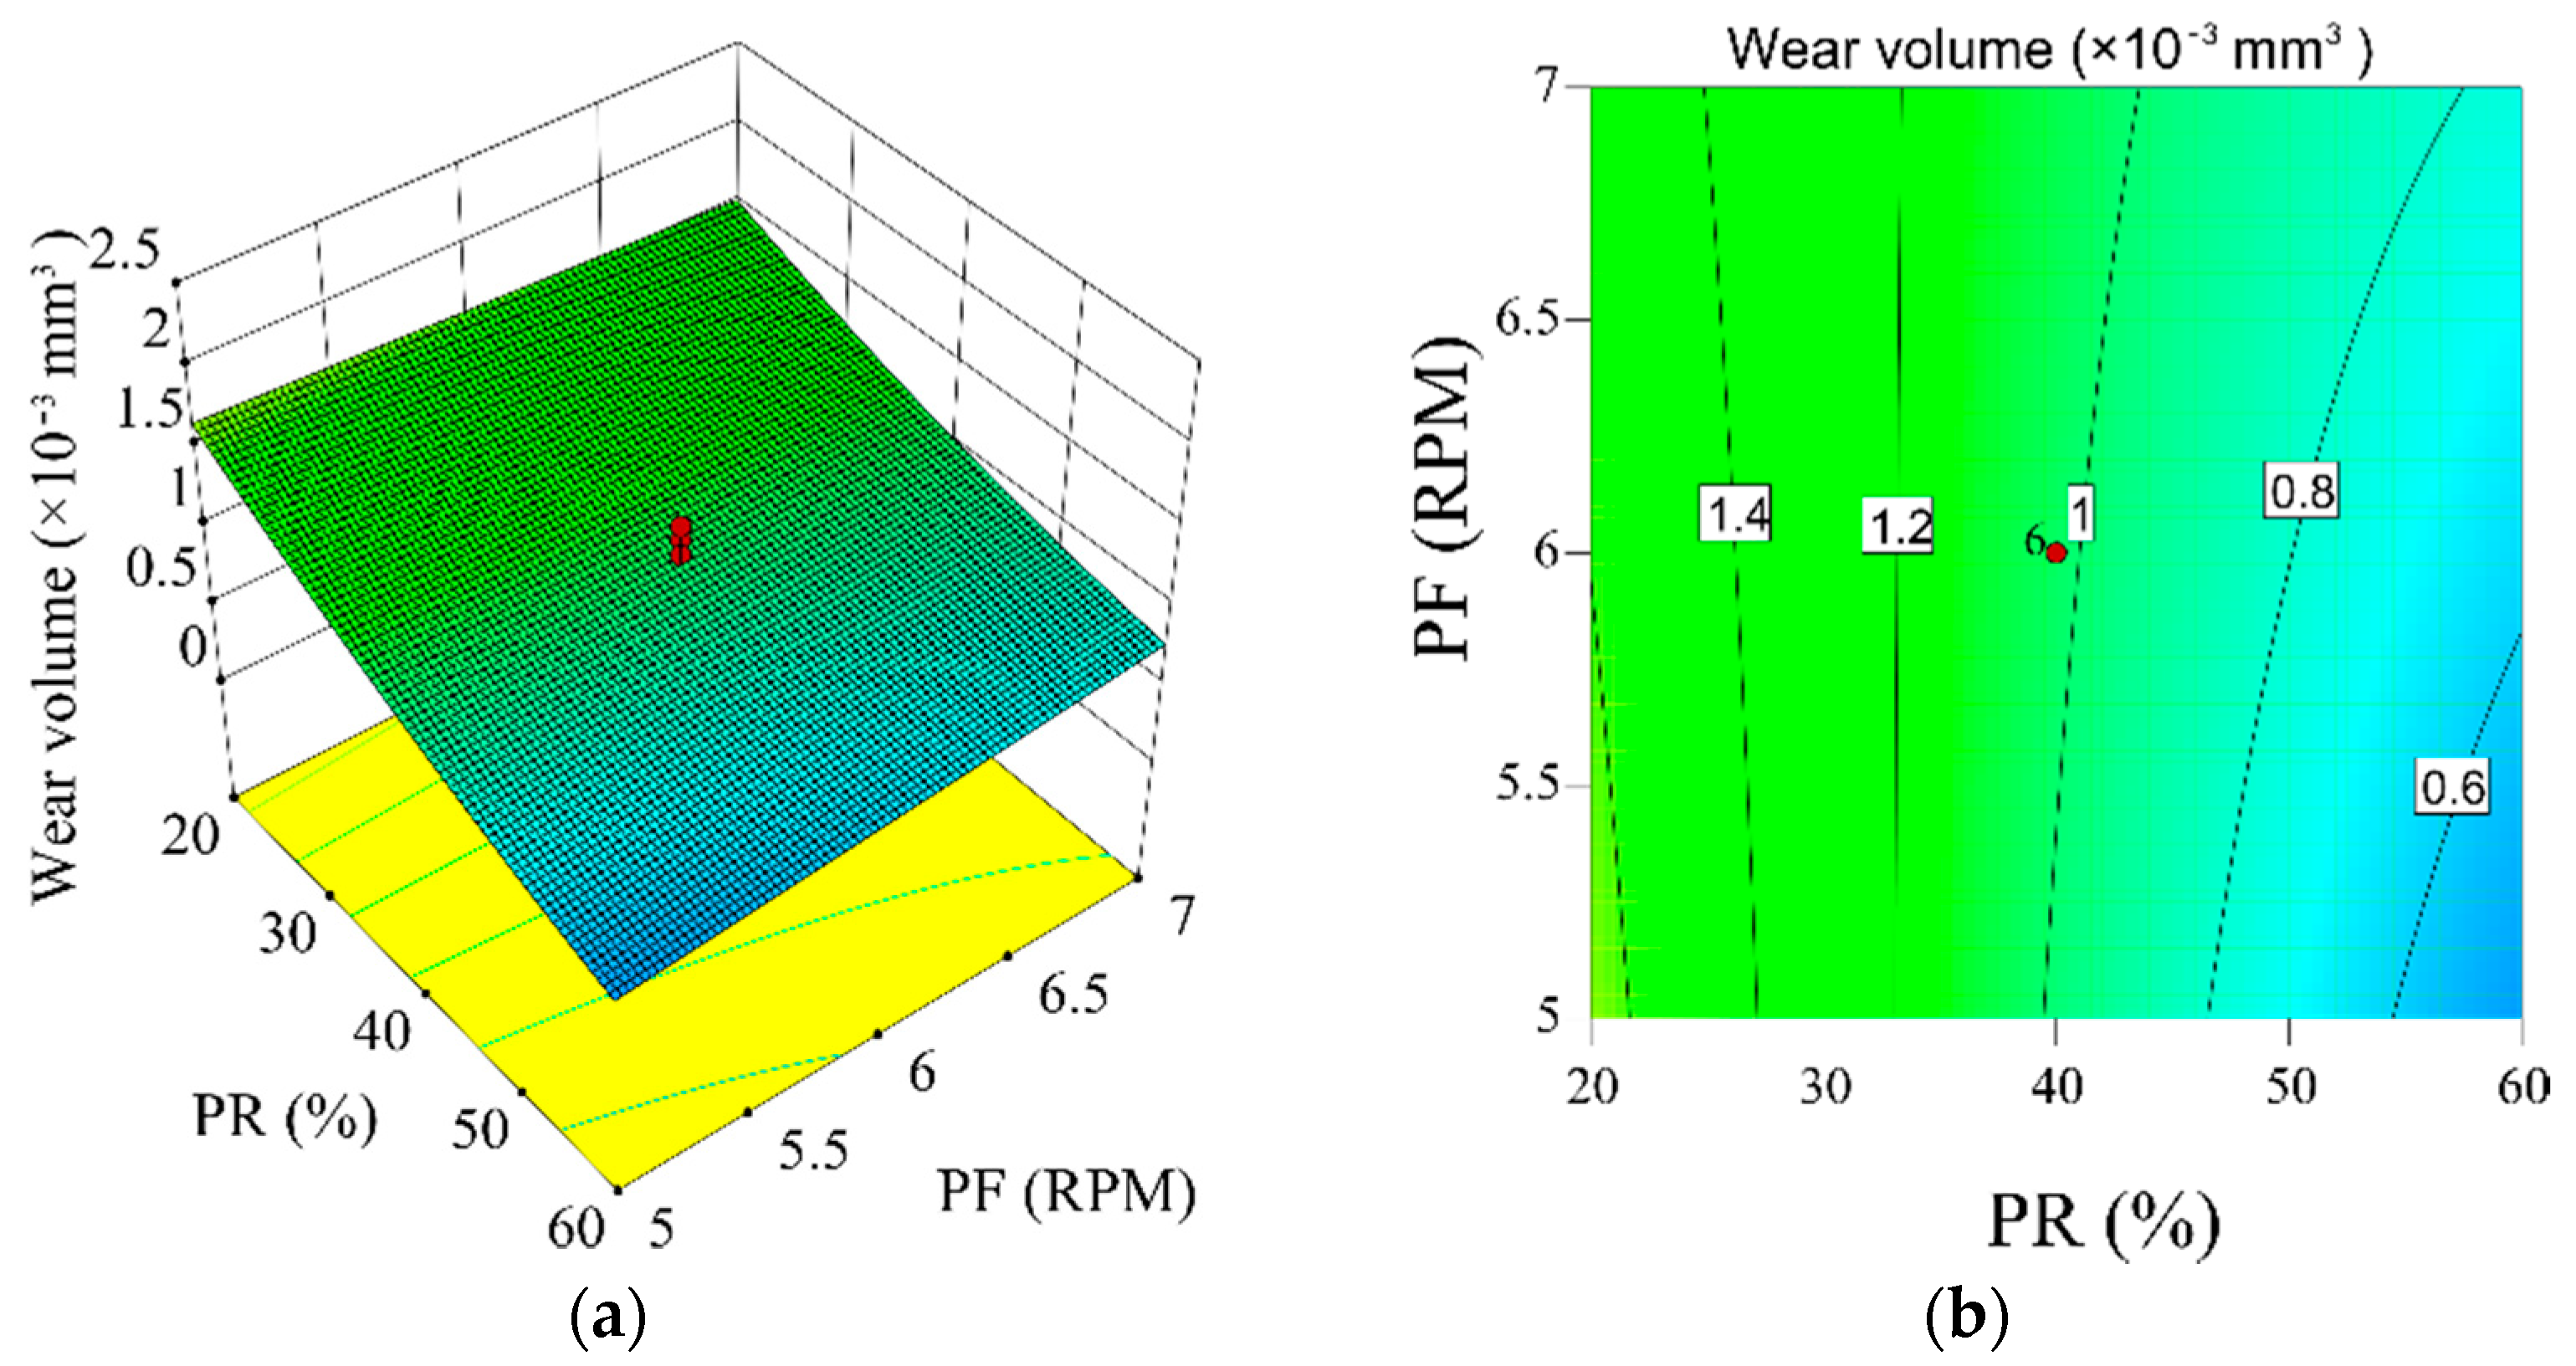
Respond surface methodology (RSM) is an integrated method that combines experimental design, data processing, and optimization. RSM is used to build a mathematic model between input and output variables. The central composite design (CCD) module was selected in RSM in this study. The experimental design matrix contained four factors and five levels. The four factors were laser power (LP), scanning speed (SS), TiC weight percentage powder ratio (PR), and powder feed rate (PF). The variables for the factors were set to 0, ±1, and ±2 in the Design Expert software (version 10.0), as shown in Table 3. Then, 30 runs of the experiment were generated by the Design Expert software, according to these factors and levels (Table A1).
A total of 30 specimens were made following the processing parameters setup in Table A1. The selected responses of micro-hardness, wear volume, and defect area were obtained; shown in 
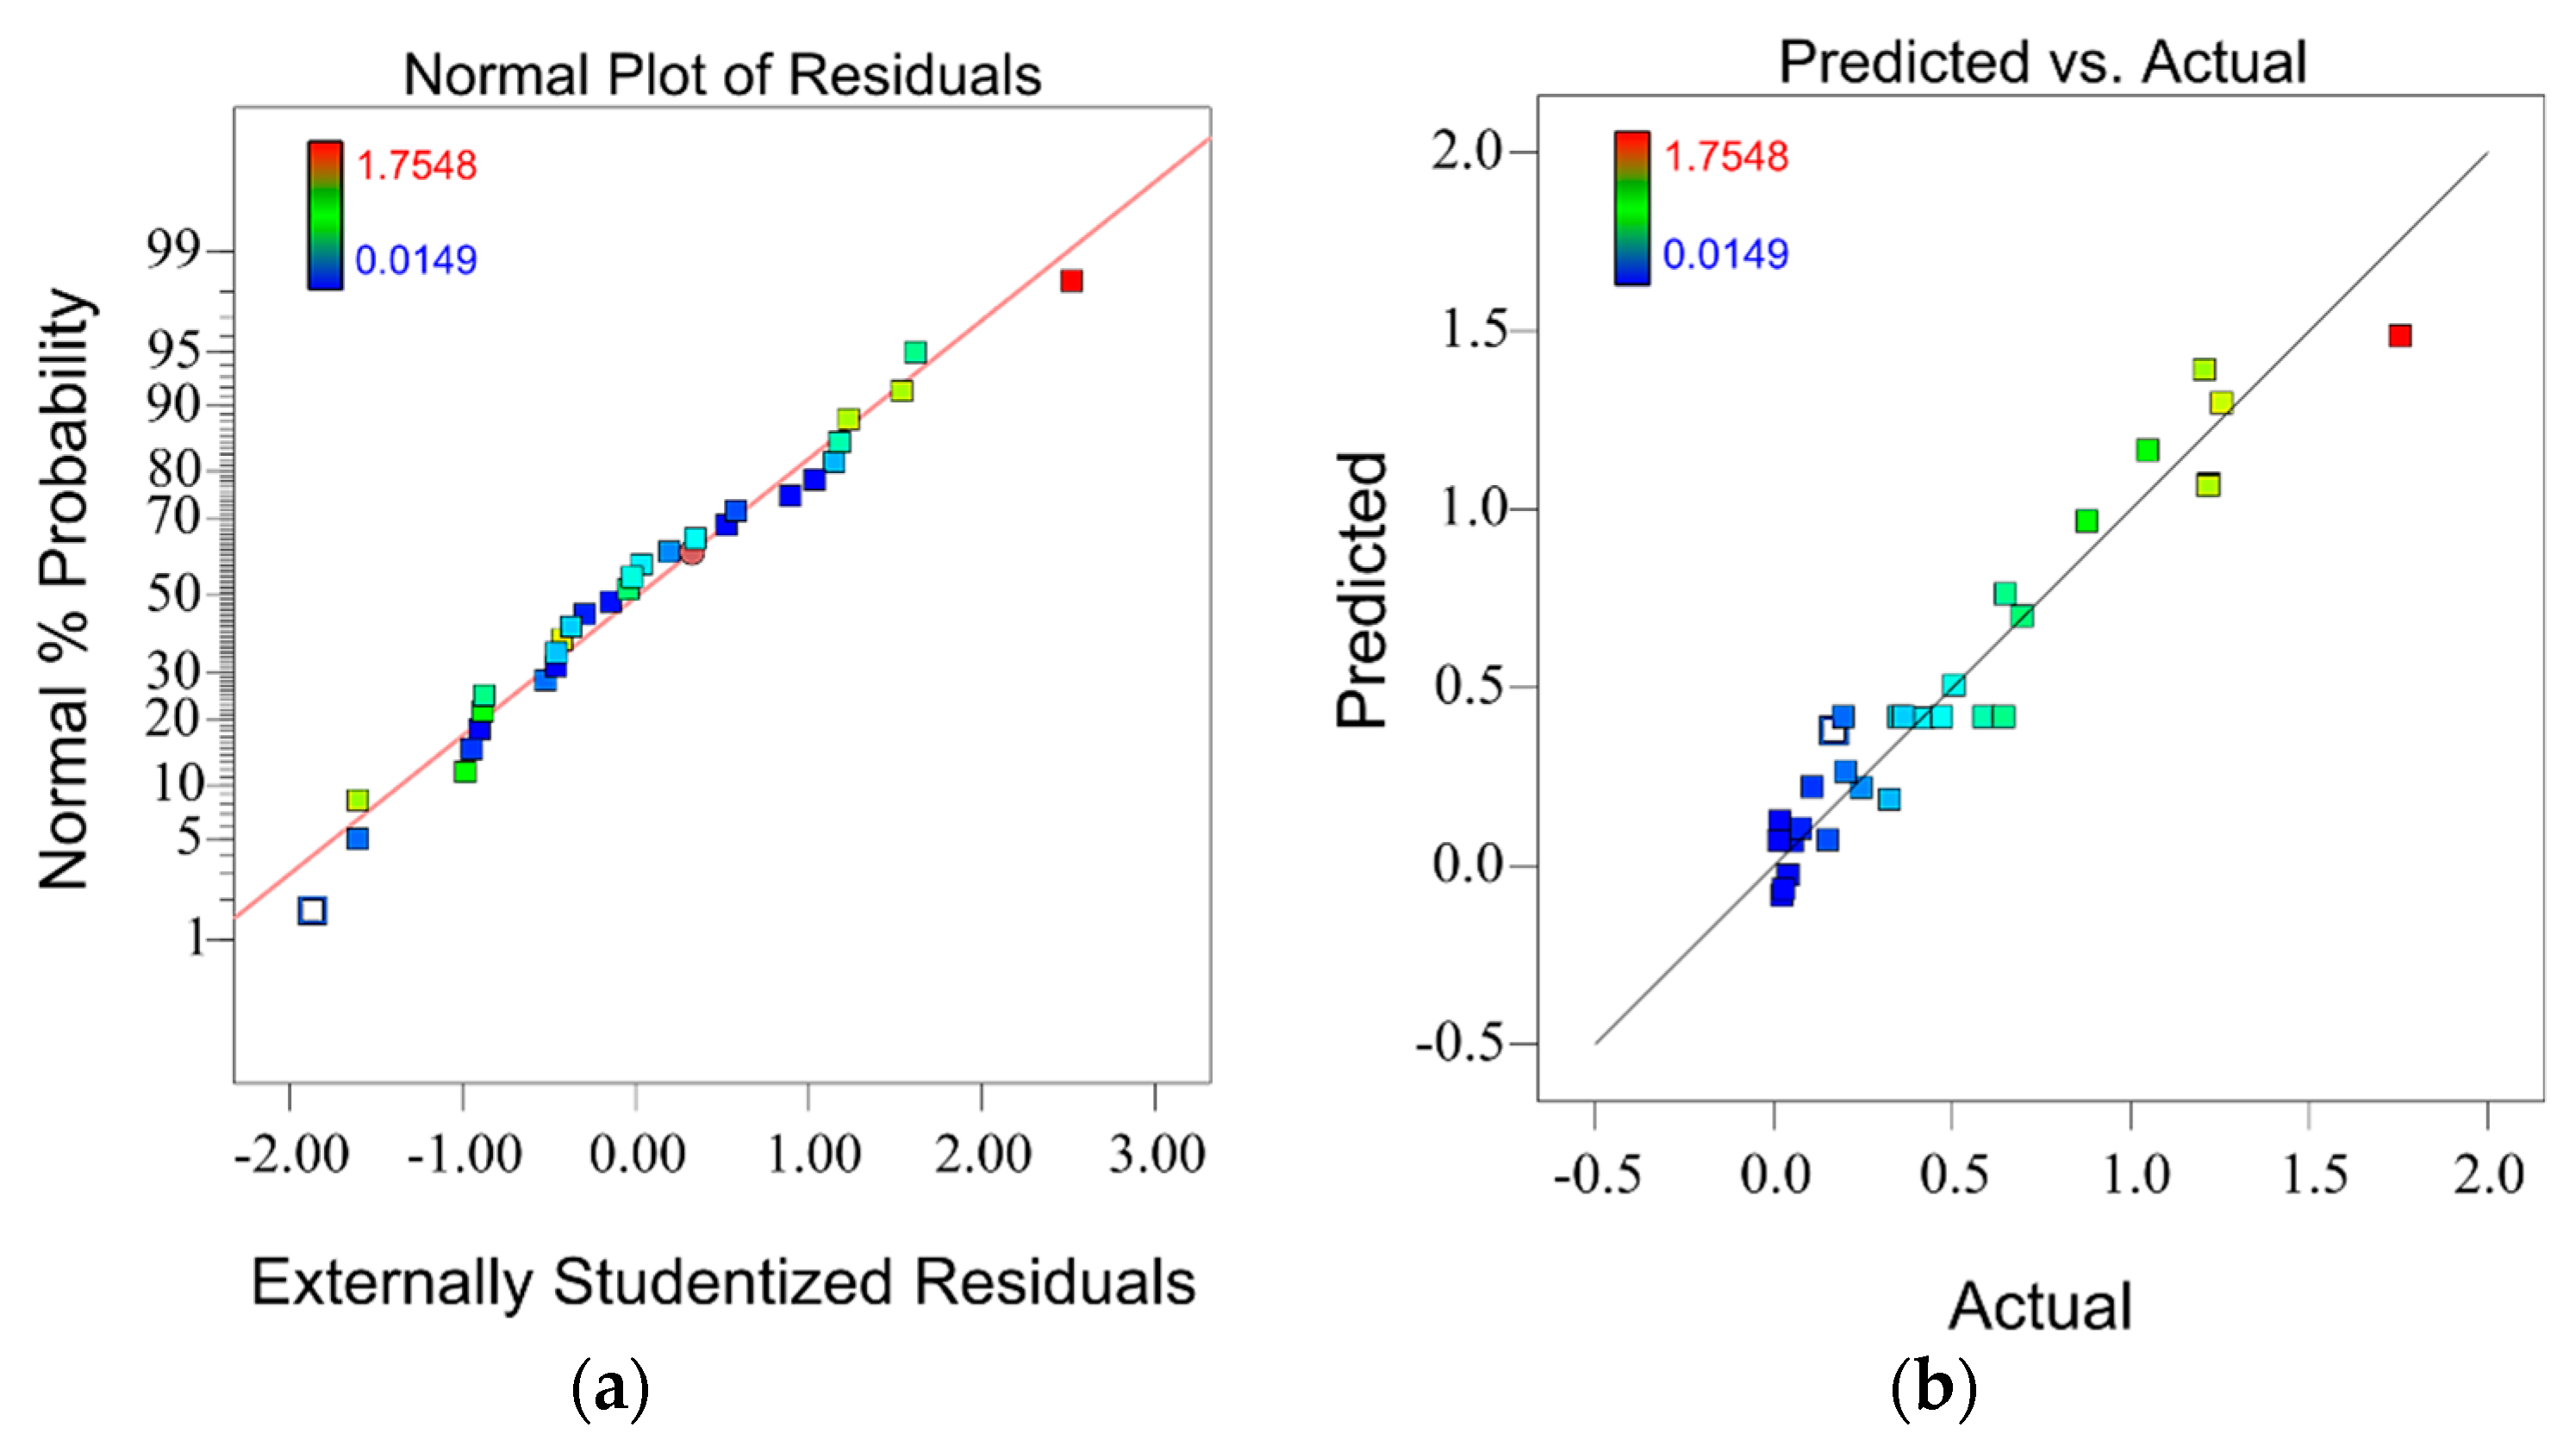
Table A1. Then, the mathematical models were obtained by the Design Expert software after importing the experimental results in 30 runs. These fitted models illustrate the interaction between the input variables (LENS process parameters) and the output (selected responses). Equation (1) is the expression of these polynomial regression function, where y stands for the response value, xi and xj represent the processing parameter. β0 stands for the intercept factor. βj, βij, and βjj indicates the coefficients for the linear term, interaction term, and the quadratic term, respectively. Additionally, k represents the number of factors and ε denotes the residual [17]. Afterwards, analysis of variance (ANOVA) and the respond surface methodology was used to analyze the model. The significance level (α) in ANOVA was set at 0.05.
y = β 0 + j = 1 k β j x j + i , j = 1 k β i j x i x j + j = 1 k β j j x j 2 + ε

3. Results and Discussion

3.1. Analysis of Variance

The fitted model for micro-hardness, wear volume, and the defect area are shown in Equations (2)–(4). The coefficients for the linear term, interaction term, and quadratic term were obtained through CCD. Additionally, non–significant factors were eliminated by stepwise regression. Analysis of variance on the micro-hardness, wear volume, and defect area are shown in Table 4, Table 5 and Table 6. In the micro-hardness model, the p-value was less than 0.0001 and the lack of fit was larger than 0.05, which indicated the statistical significance of the model. The signal-to-noise ratio was indicated by the Adeq Precision (adequate precision). The Adeq Precision value 36.608 was larger than 4, indicating the satisfactory accuracy of this model. The coefficient of determination (R-square) was close to 1, indicating the remarkable fit of this regression model. The adjusted R-square (Adj R-square) was used to reduce the influence of the sample size on the R-square, which was also close to 1. In addition, the difference between the Adj R-squared and the Pred R-squared values was less than the needed value of 0.2 [19]. These results displayed the high level of fit of this model, which could precisely predict the correlation between the LENS process parameters and micro-hardness. Similarly, these expectations were also met by the wear volume model and defect area model.
It is evident from Table 4 that the TiC powder ratio was the significant factor in the micro-hardness model, while the laser power and the scanning speed denoted a negligible effect. In Table 5, the significant factors affecting the wear volume were scanning speed, TiC powder ratio, and quadratic term of the laser power. Similarly, scanning speed, TiC powder ratio, interaction term of the scanning speed, the TiC powder ratio, and quadratic term of laser power had a significant impact on the defect area, as shown in Table 6.
Microhardness = 18.8767 + 0.0233 × LP + 0.3550 × SS + 0.7367 × PR
Wear   Volume = 12.2063 + 0.1137 × LP 0.31848 × SS 0.0416 × PR 0.8052 × PF + 5.6732 × 10 3 × LP × SS 5.0852 × 10 3 × SS × PR + 0.0993 × SS × PF + 5.3791 × 10 3 × PR × PF 2.4585 × 10 4 × LP 2 0.1279 × SS 2 + 2.1614 × 10 4 × PR 2
Defect   Area = 10.4358 0.12286 × LP + 1.3988 × SS + 0.0646 × PR + 1.0010 × PF 3.4087 × 10 3 × LP × SS 0.0145 × SS × PR + 5.8884 × 10 3 × PR × PF + 2.3919 × 10 4 × LP 2 + 1.1831 × 10 4 × PR 2 0.0995 × PF 2

3.2. Analysis of Micro-hardness

The almost linear plot of residuals in Figure 4a indicates the outstanding fit of the micro-hardness model. The high prediction accuracy of the fitted micro-hardness model was demonstrated by the small-scale error between predicted and actual experimental micro-hardness in Figure 4b, where the dark reference line represents where the model prediction is equal to the actual testing result.
According to the ANOVA result in Table 4, as well as the plot in Figure 5a, only the TiC powder ratio presents the significance in the micro-hardness model. Figure 5b shows the micro-hardness increase with the increasing TiC powder ratio. During the LENS process, high power laser energy created rapid melting and solidification, which led to elemental diffusion, resulting in super-saturation and solid solution strengthening. With the increasing TiC powder ratio, the second phase solid solution strengthening promoted the mixture of the ionic bond, the covalent bond, and the metallic bond within the grain structure, in the composite coating [17,20,21,22]. Thus, the micro-hardness was improved.

3.3. Analysis of Wear Volume

Figure 6a shows the plot of the residual factor for the wear volume model. This plot demonstrates a remarkable fit of the model indicated by the almost linear distribution of the plot. The dark reference line in Figure 6b indicates where the predicted wear volume from the model is equal to the actual testing wear volume. A close distribution of plots to the reference line is observed, which denotes a small-scale error between the predicted and actual experimental wear volume. The result shows the high prediction accuracy of the fitted wear volume model [23].
In Figure 7a,b, it can be seen that the wear volume displayed an increase followed by a decrease, with increasing laser power, while simultaneously decreasing the scanning speed. In addition, the 3D morphology in Figure 8 shows a consistent phenomenon. Initially, a low energy was received in the molten pool with a low laser power and a fast scanning speed. The TiC particles were not shattered under this level of energy. Thus, the boundary decomposition and partially sintering of TiC particles occurred, and a crack was formed during sintering (Figure 8b). Few TiC particles peel-off spots were observed in Figure 8a during the scratch testing. The slightly abrasive wear caused by the peeled-off particles led to a small wear volume. Then, a larger energy irradiation was accumulated with a larger laser power and slower scanning speed. The larger energy received by the molten pool reached the threshold to shatter the TiC particles and generate boundary decomposition (Figure 8d). However, the remaining energy after finishing the shattering was not sufficient to sinter all shattered TiC particles. The unsintered TiC particles were peeled-off during the scratch testing, which led to a severe abrasive wear and increased the wear volume, as shown in Figure 8c. Afterwards, keeping the trend of the increasing laser power and decreasing scanning speed, denoted that the molten pool absorbed more energy. Boundary decomposition and more condensed sintering were created around the TiC particles, shown in Figure 8f. These enhancements prevented the particles from peeling off during scratch testing and reforming abrasive wear to adhesive wear (Figure 8e), which reduced the wear volume [24].
It is evident that the TiC powder ratio is a significant factor that has an impact on the wear volume, while the powder feed rate has a non-significant impact (Figure 9). The wear volume was negatively correlated with the TiC powder ratio. In other words, the wear resistant was improved by increasing the TiC powder ratio, which was consistent with the aforementioned micro-hardness discussion [25].
The individual influence of the different LENS process parameters on the wear volume of the 316L/TiC composite coating is shown below in Figure 10. The TiC powder ratio had the most significant impact on the wear volume, which showed a negative correlation. Increased laser power and decreased scanning speed caused the wear volume to increase, followed by a decrease. The powder feed rate had a negligible impact.

3.4. Analysis of the Defect Area

The nearly linear distribution plot in Figure 11a and the minor error scale in Figure 11b indicate the accuracy of the defect area model, which could provide the guidance for LENS process parameters selection and predict the defect area accurately.
As shown in Figure 12, reducing the scanning speed and simultaneously increasing the TiC powder ratio has a significant impact on the increasing size of the defect area. The scanning speed determined the duration of laser beam irradiation. A slower scanning speed led to a longer laser energy exposure and longer reaction time, where carbon monoxide (CO) and carbon dioxide (CO2) were formed by the chemical reaction between TiC and oxygen under the high temperature in the LENS process, as shown in Equations (5) and (6). In addition, the consistent morphology was observed in Figure 13, where different levels of defect were shown in samples made with various TiC powder ratio. Negligible defect was present with a 0% TiC powder ratio. The pores and cracks displayed an increasing trend with a higher TiC powder ratio. Meanwhile, the appearance of TiC particles also increased. The plasticity of the sample reduced with a larger TiC powder ratio due to the brittleness of the proeutectoid carbide formed by the TiC during the LENS process [24,26]. Therefore, due to the rapid solidification effect in the LENS process, defects such as pores were formed because the gas generated could not be emitted completely [27].
TiC(s) + 2O2(g) = TiO2(l) + CO2(g)
2TiC(s) + 3O2(g) = 2TiO2(l) + 2CO(g)
Figure 14 shows the influence of different processing parameters on the defect area. The defect area was increased when the TiC powder ratio was increased. Reducing the scanning speed could decrease the defect area. Laser power and powder feed rate were not discussed since they were not statistically significant, according to the ANOVA result in Table 6.

3.5. Processing Parameter Optimization and Experimental Validation

Optimization on the processing parameters is essential to achieve the desired outcome of micro-hardness, wear volume, and defect area. Table 7 lists the criteria and limits of the LENS process parameters and the goal for each response. Due to the fact that all three responses were important evaluation factors for the 316L/TiC composite coating quality, the importance level in optimization were all set to 5. The range of importance in setup was from 1 to 5; a larger number denoted higher importance. The target was to achieve maximum micro-hardness, minimum wear volume, and minimum defect area, simultaneously.
After optimization within the range of criteria, the desired processing parameters were a laser power of 325.052 W, a scanning speed of 7.999 mm/s, a TiC powder ratio of 79.986%, and a powder feed rate of 6.075 rpm. A validation experiment was set to a laser power of 325 W, scanning speed of 8 mm/s, a TiC powder ratio of 80%, and a powder feed rate of 6 rpm, as permitted by the equipment accuracy level.
Through a completion of the experimental validation, Figure 15 exhibits the exceptional morphology of the 316L/TiC coating made by the optimal processing parameters set, where unmelted TiC particles clearly appeared and no obvious defect (pore and crack) was observed. The model prediction and experimental validation of micro-hardness, wear volume, and defect area are also shown in Table 8. The calculated error of prediction was 0.56%, 3.20%, and 8.90% for micro-hardness, wear volume, and defect area, respectively. The factors that caused these errors might be a minor difference in the processing parameters, between software optimization and experimental validation selections, or the slight pile-up effect and influence of residual stress during indentation [28,29]. However, these errors were within the range of acceptance. Thus, the accuracy of the models was experimentally validated.

4. Conclusions

This paper established the mathematical models that relate the LENS process parameters (laser power, scanning speed, TiC powder ratio, and powder feed rate) to the micro-hardness, wear volume, and defect area of 316L/TiC composite coating, through response surface methodology. Experimental validation with optimized processing parameters verified the reliability of these models. These models can serve as a guide in the composite LENS process for the prediction and control of the coating properties. The conclusions were addressed as follows:
  • A linear correlation was observed between micro-hardness and the processing parameters, where the TiC powder ratio has the primary influence. Increasing the TiC powder ratio can improve the composite coating micro-hardness.
  • The relationship between wear volume and processing parameters appeared to be nonlinear. The TiC powder ratio had the major impact on wear volume with a negative correlation. Increased laser power and a decreased scanning speed caused the wear volume to increase, followed by a decrease. The powder feed rate had a negligible influence on the wear volume.
  • The relationship between defect area and the processing parameters also appeared to be nonlinear. A positive correlation existed between the defect area and the TiC powder ratio if only the defect area was considered as the response. The defect area could be reduced by decreasing the TiC powder ratio and decreasing the scanning speed. The laser power and powder feed rate had a negligible influence on the defect area.
  • The optimized processing parameters to achieve maximum micro-hardness, minimum wear volume, and minimum defect area, simultaneously, were 325 W laser power, 8 mm/s scanning speed, 80% TiC powder ratio, and 6 rpm powder feed rate. The error of prediction was 0.46% for micro-hardness, 4.54% for wear volume, and 8.82% for the defect area.

Author Contributions

Methodology, G.L. and C.Z.; Experiment, C.Z.; Analysis, G.L., C.Z., Y.Z., X.H., C.C. and J.J.; Writing—Original Draft Preparation, G.L. And C.Z.; Writing—Review and Editing, G.L. and Y.Z.; Supervision, G.L. and Y.Z.

Funding

This research was funded by the National Natural Science Foundation of China (No. 51575110).

Acknowledgments

The authors gratefully acknowledge the support from the Public Service Platform for Technical Innovation of Machine Tool Industry in Fujian Province at the Fujian University of Technology.

Conflicts of Interest

The authors declare no conflict of interest.

Appendix A

Table A1. Central composite design (CCD) experimental design and results.
RunLP (W)SS (mm/s)PR (wt.%)PF (rpm)Micro-Hardness (HRC)Wear Volume (×10−3 mm3)Defect Area (mm2)
13006.3540653.10.77490.3633
22757.2060575.80.13320.1687
33006.350624.62.42490.0221
43006.3540859.91.14460.0752
52755.5020740.80.97910.0400
62755.5060566.60.46231.2178
72757.2060766.50.52560.6955
83257.2020535.11.80290.1076
93008.0440658.90.71440.1511
102757.2020546.01.45440.4198
113255.5020747.70.93370.0522
123006.3540658.20.93550.1947
132755.5020544.51.09350.0168
143006.3540650.81.26900.6442
153257.2060772.41.00550.5048
163006.3540656.51.18580.4702
173255.5060776.80.31431.7548
183006.3540652.10.85790.3508
192757.2020745.51.21500.2010
203257.2060574.40.37520.3239
213257.2020749.61.90430.0149
223004.6640657.10.53540.6485
233006.3580688.20.24731.2546
243006.3540461.50.87250.0269
252506.3540664.00.45101.2168
263006.3540659.71.08580.5882
273255.5020541.11.32840.2447
283506.3540659.20.30030.8772
293255.5060578.20.19831.0472
302755.5060766.00.39771.2060

References

  1. Zhang, Y.; Bandyopadhyay, A. Direct fabrication of compositionally graded Ti-Al2O3 multi-material structures using Laser Engineered Net Shaping. Addit. Manuf. 2018, 21, 104–111. [Google Scholar] [CrossRef]
  2. Zhai, Y.; Lados, D.A.; Brown, E.J.; Vigilante, G.N. Understanding the microstructure and mechanical properties of Ti-6Al-4V and inconel 718 alloys manufactured by laser engineered net shaping. Addit. Manuf. 2019, 27, 334–344. [Google Scholar] [CrossRef]
  3. Dass, A.; Moridi, A. State of the art in directed energy deposition: From additive manufacturing to materials design. Coatings 2019, 9, 418. [Google Scholar] [CrossRef]
  4. Srinivas, V.; Savitha, U.; Reddy, G.J. Processing and characterization of NiCr-YSZ compositionally graded coatings on superalloy using laser engineered net shaping (LENS). Mater. Today Proc. 2018, 5, 27277–27284. [Google Scholar] [CrossRef]
  5. Niu, F.; Wu, D.; Lu, F.; Liu, G.; Ma, G.; Jia, Z. Microstructure and macro properties of Al2O3 ceramics prepared by laser engineered net shaping. Ceram. Int. 2018, 44, 14303–14310. [Google Scholar] [CrossRef]
  6. Attaran, M. The rise of 3-D printing: The advantages of additive manufacturing over traditional manufacturing. Bus. Horiz. 2017, 60, 677–688. [Google Scholar] [CrossRef]
  7. Gardner, L. Stability and design of stainless steel structures—Review and outlook. Thin Walled Struct. 2019, 141, 208–216. [Google Scholar] [CrossRef]
  8. Sun, G.; Shen, X.; Wang, Z.; Zhan, M.; Yao, S.; Zhou, R.; Ni, Z. Laser metal deposition as repair technology for 316L stainless steel: Influence of feeding powder compositions on microstructure and mechanical properties. Opt. Laser Technol. 2019, 109, 71–83. [Google Scholar] [CrossRef]
  9. Wang, S.; Zhang, S.; Zhang, C.; Wu, C.; Chen, J.; Shahzad, M.B. Effect of Cr3C2 content on 316L stainless steel fabricated by laser melting deposition. Vacuum 2018, 147, 92–98. [Google Scholar] [CrossRef]
  10. Lyu, Y.; Wang, J.; Wan, Y.; Chen, Y. The influence of selective laser melting process parameters on the property of TiAlN/TiN multilayer coating on the 316L steel. Coatings 2019, 9, 377. [Google Scholar] [CrossRef]
  11. Wu, C.; Zhang, S.; Zhang, C.; Zhang, J.; Liu, Y.; Chen, J. Effects of SiC content on phase evolution and corrosion behavior of SiC-reinforced 316L stainless steel matrix composites by laser melting deposition. Opt. Laser Technol. 2019, 115, 134–139. [Google Scholar] [CrossRef]
  12. He, X.; Song, R.; Kong, D. Effects of TiC on the microstructure and properties of TiC/TiAl composite coating prepared by laser cladding. Opt. Laser Technol. 2019, 112, 339–348. [Google Scholar] [CrossRef]
  13. Obadele, B.; Olubambi, P.; Johnson, O. Effects of TiC addition on properties of laser particle deposited WC-Co-Cr and WC-Ni coatings. Trans. Nonferrous Met. Soc. China 2013, 23, 3634–3642. [Google Scholar] [CrossRef]
  14. Liu, S.; Shin, Y.C. The influences of melting degree of TiC reinforcements on microstructure and mechanical properties of laser direct deposited Ti6Al4V-TiC composites. Mater. Des. 2017, 136, 185–195. [Google Scholar] [CrossRef]
  15. Zhou, Y.; Duan, L.; Wen, S.; Wei, Q.; Shi, Y. Enhanced micro-hardness and wear resistance of Al-15Si/TiC fabricated by selective laser melting. Compos. Commun. 2018, 10, 64–67. [Google Scholar] [CrossRef]
  16. Ambrogio, G.; Gagliardi, F.; Muzzupappa, M.; Filice, L. Additive-incremental forming hybrid manufacturing technique to improve customised part performance. J. Manuf. Process. 2019, 37, 386–391. [Google Scholar] [CrossRef]
  17. Lian, G.; Zhang, H.; Zhang, Y.; Yao, M.; Huang, X.; Chen, C. Computational and experimental investigation of micro-hardness and wear resistance of Ni-Based alloy and TiC composite coating obtained by laser cladding. Materials 2019, 12, 793. [Google Scholar] [CrossRef]
  18. Zhang, W.; Song, H.; Zhang, Z.; Luo, H.; Jiang, Y.; Xie, X.; Yao, C.; Yuan, L.; Deng, J.; Hu, W.; et al. Determination of mechanical behaviors of Ho3+: BaY2F8 single crystals by nanoindentation. Ceram. Int. 2019, in press. [Google Scholar] [CrossRef]
  19. Lian, G.; Yao, M.; Zhang, Y.; Chen, C. Analysis and prediction on geometric characteristics of multi-track overlapping laser cladding. Int. J. Adv. Manuf. Technol. 2018, 97, 2397–2407. [Google Scholar] [CrossRef]
  20. Feng, Y.; Feng, K.; Yao, C.; Li, Z.; Sun, J. Microstructure and properties of in-situ synthesized (Ti3Al + TiB)/Ti composites by laser cladding. Mater. Des. 2018, 157, 258–272. [Google Scholar] [CrossRef]
  21. Tao, X.; Zhang, S.; Zhang, C.; Wu, C.; Chen, J.; Abdullah, A.O. Effect of Fe and Ni contents on microstructure and wear resistance of aluminum bronze coatings on 316 stainless steel by laser cladding. Surf. Coat. Technol. 2018, 342, 76–84. [Google Scholar] [CrossRef]
  22. Yang, C.; Cheng, X.; Tang, H.; Tian, X.; Liu, D. Influence of microstructures and wear behaviors of the microalloyed coatings on TC11 alloy surface using laser cladding technique. Surf. Coat. Technol. 2018, 337, 97–103. [Google Scholar] [CrossRef]
  23. Lian, G.; Yao, M.; Zhang, Y.; Huang, X. Analysis and respond surface methodology modeling on property and performance of two-dimensional gradient material laser cladding on die-cutting tool. Materials 2018, 11, 2052. [Google Scholar] [CrossRef]
  24. Muvvala, G.; Karmakar, D.P.; Nath, A.K. Online assessment of TiC decomposition in laser cladding of metal matrix composite coating. Mater. Des. 2017, 121, 310–320. [Google Scholar] [CrossRef]
  25. Zhao, X.; Wei, Q.S.; Gao, N.; Zheng, E.L.; Shi, Y.S.; Yang, S.F. Rapid fabrication of TiN/AISI 420 stainless steel composite by selective laser melting additive manufacturing. J. Mater. Process. Technol. 2019, 270, 8–19. [Google Scholar] [CrossRef]
  26. Amar, A.; Li, J.; Xiang, S.; Liu, X.; Zhou, Y.; Le, G.; Wang, X.; Qu, F.; Ma, S.; Dong, W. Additive manufacturing of high-strength CrMnFeCoNi-based High Entropy Alloys with TiC addition. J. Intermet. 2019, 109, 162–166. [Google Scholar] [CrossRef]
  27. Pan, X.; Niu, Y.; Liu, T.; Zhong, X.; Li, C.; Shi, M.; Zheng, X.; Ding, C. Ablation behaviors of ZrC-TiC coatings prepared by vacuum plasma spray: Above 2000 °C. J. Eur. Ceram. Soc. 2019, 39, 3292–3300. [Google Scholar] [CrossRef]
  28. Ghidell, M.; Sebastiani, M.; Collet, C.; Guillemet, R. Determination of the elastic moduli and residual stresses of freestanding Au-TiW bilayer thin films by nanoindentation. Mater. Des. 2016, 106, 436–445. [Google Scholar] [CrossRef]
  29. Ast, J.; Ghidelli, M.; Durst, K.; Göken, M.; Sebastiani, M.; Korsunsky, A. A review of experimental approaches to fracture toughness evaluation at the micro-scale. Mater. Des. 2019, 173, 107762. [Google Scholar] [CrossRef]
Figure 1. (a) Morphology of 316L powder; (b) Morphology of TiC powder.
Coatings 09 00498 g001
Figure 2. (a) LENS 450 system schematic diagram; (b) Scanning pattern in the laser engineered net shaping (LENS) process.
Coatings 09 00498 g002
Figure 3. (a) Indentation created in the micro-hardness testing; (b) Load–Displacement curve of the sample made with 275 W laser power (LP), 5.5 mm/s scanning speed (SS), 20% powder ratio (PR), and 5 rpm powder feed rate (PF).
Coatings 09 00498 g003
Figure 4. (a) Residual analysis of micro-hardness; (b) Micro-hardness comparison between the predicted and actual.
Coatings 09 00498 g004
Figure 5. (a) Influence on micro-hardness by different LENS process parameters; (b) The plot of micro-hardness to TiC powder ratio.
Coatings 09 00498 g005
Figure 6. (a) Residual analysis of wear volume; (b) Wear volume comparison between the predicted and the actual.
Coatings 09 00498 g006
Figure 7. (a) 3D response surface showing the influence of laser power and scanning speed on wear volume. (b) Contour line of the response surface.
Coatings 09 00498 g007
Figure 8. 3D morphology of wear and microstructure of the sample made with (a,b) LP 275 W, SS 7.20 mm/s, PR 20%, PF 7 rpm; (c,d) LP 300 W, SS 6.35 mm/s, PR 40%, PF 6 rpm, and (e,f) LP 325 W, SS 5.50 mm/s, PR 20%, PF 7 rpm.
Coatings 09 00498 g008
Figure 9. (a) 3D response surface showing the influence of the TiC powder rate and the powder feed rate on the wear volume; (b) Contour line of the response surface.
Coatings 09 00498 g009
Figure 10. Influence on wear volume by the different LENS process parameters.
Coatings 09 00498 g010
Figure 11. (a) Residual analysis of the defect area; (b) Defect area comparison between the predicted and the actual.
Coatings 09 00498 g011
Figure 12. (a) 3D response surface showing the influence of scanning speed and TiC powder ratio on defect area; (b) Contour line of the response surface.
Coatings 09 00498 g012
Figure 13. Sample made with different TiC powder ratios: (a) 0%; (b) 20%; (c) 40%; and (d) 60%.
Coatings 09 00498 g013
Figure 14. Influence on the defect area by different parameters.
Coatings 09 00498 g014
Figure 15. Top cross-section surface morphology of sample made with optimal processing parameters.
Coatings 09 00498 g015
Table 1. Element composition (wt.%) of cladding powder and substrate.
MaterialsElement (wt.%)
CSiONiCrT.CF.CNMnFe
316L0.0310.110–1416–180.1Rest
TiC0.020.5>18.8<0.50.50.08
Substrate0.450.17–0.37<0.25<0.250.5–0.8Rest
Table 2. Parameters setup in the scratch test.
ParametersSpecifications
Friction pair (mm)Cemented Carbide—Φ 6 mm
Force (N)35
Speed (mm/s)10
Distance (mm)2
Duration (min)30
Mode Reciprocating
Temperature (°C)Room temperature
Table 3. The LENS process parameter variables.
VariablesNotationLevels of Input Variables
−2−1012
Laser power (W)LP250275300325350
Scanning speed (mm/s)SS4.665.506.357.208.04
TiC powder ratio (wt.%)PR020406080
Powder feed rate (rpm)PF45678
Table 4. Analysis of variance on micro-hardness.
SourceSum of SquaresMean SquareF Valuep-Value Prob > FComments
Model5220.041704.0189.52<0.0001Significant
LP8.178.170.420.5225
SS2.162.160.110.7415
PR5209.715209.71268.03<0.0001
Residual505.3719.44
Lack of Fit441.1521.011.640.3077Not significant
Adeq. Precision36.608R-Square0.9117
Pred. R-Square0.8810Adj. R-Square0.9015
Table 5. Analysis of variance on wear volume.
SourceSum of SquaresMean SquareF Valuep-Value Prob > FComments
Model7.990.7322.69<0.0001Significant
LP0.0700.0702.200.1552
SS0.390.3912.240.0026
PR5.665.66176.81<0.0001
PF0.0390.0391.230.2825
LP × SS0.230.237.180.0153
SS × PR0.120.123.690.0707
SS × PF0.110.113.520.0770
PR × PF0.190.195.790.0271
LP20.660.6620.650.0003
SS20.230.237.300.0146
PR20.210.216.540.0198
Residual0.58180.032
Lack of Fit0.39130.0300.80Not significant
Adeq. Precision20.550R-square0.9327
Pred. R-square0.7818Adj. R-square0.8916
Table 6. Analysis of variance on defect area.
SourceSum of SquaresMean SquareF Valuep–Value Prob > FComments
Model5.970.6024.92<0.0001Significant
LP0.0150.0150.620.4424
SS0.710.7129.77< 0.0001
PR2.862.86119.40< 0.0001
PF0.0430.0431.810.1948
LP × SS0.0830.0833.460.0783
SS × PR0.960.9640.13<0.0001
PR × PF0.220.229.260.0067
LP20.630.6326.11<0.0001
PR20.0630.0632.620.1222
PF20.280.2811.570.0030
Residual0.460.024
Lack of Fit0.320.0230.820.6510Not significant
Adeq. Precision16.737R-square0.9292
Pred. R-square0.8187Adj. R-square0.8919
Table 7. Optimization criteria and targets.
Variables/ResponsesInput/OutputCriterionLimitImportance
LowerUpper
VariableLaser Power (W)In range2503503
Scanning Speed (mm/s)In range4.668.043
TiC Powder Ratio (%)In range0803
Powder Feed Rate (rpm)In range483
ResponseMicro-hardness (HRC)Maximum24.688.25
Wear Volume (mm3)Minimum0.13322.42495
Defect Area (mm2)Minimum0.01491.75485
Table 8. Comparison between the predicted optimization result and experimental validation.
ComparisonLP (W)SS (mm/s)PR (wt.%)PF (rpm)Micro-Hardness (HRC)Wear Volume (mm3)Defect Area (mm2)Desirability
Prediction325.0527.99979.9866.07588.20.14510.01551.000
Validation325880687.80.15200.0170

