Article

Numerical Simulation of Thermal Evolution and Solidification Behavior of Laser Cladding AlSiTiNi Composite Coatings

1
School of Materials Engineering, Shanghai University of Engineering Science, Shanghai 201620, China
2
Research Center for Advanced Manufacturing, Southern Methodist University, 3101 Dyer Street, Dallas, TX 75205, USA
*
Author to whom correspondence should be addressed.
Coatings 2019, 9(6), 391; https://doi.org/10.3390/coatings9060391
Submission received: 12 May 2019 / Revised: 5 June 2019 / Accepted: 14 June 2019 / Published: 17 June 2019

Abstract

:
In order to better understand how a high energy input and a fast cooling rate affect the geometric morphology and microstructure of laser cladding aluminum composite coatings, a three-dimensional (3D) transient finite element model (FEM) has been established to study the temperature field evolution during laser cladding of AlSiTiNi coatings on a 304 stainless steel substrate. In this model, a planar Gauss heat source and a temperature selection judgment mechanism are used to simulate the melting and solidification process as well as the geometric morphology of the laser cladding coatings. The differences in physical characteristics of the cladding materials before and after melting are considered. The results of thermal simulations, including temperature history, temperature gradient, and solidification rate, of the laser cladding coatings are investigated. Corresponding experiments, conducted using an IPG-YLS-5000 fiber laser, are used to verify the simulation results. The experimental observations agree well with the theoretical predictions, which indicates that the established model is valid.

1. Introduction

As an advanced surface modification technology, laser cladding is used to improve the specific surface properties of a base substrate by adding different coating materials [1,2,3]. The high-power laser beam melts the cladding material and the substrate surface to form a metallurgical bond [4,5]. The protecting layer exhibits excellent corrosion and wear resistance for complex working environments [6,7,8]. Compared with traditional surface modification techniques, such as thermal spraying, physical vapor deposition, and chemical vapor deposition, coatings deposited by laser cladding possess many superior characteristics, such as a lower dilution rate, higher density, and a lower number of pores [9,10]. The chemical composition and microstructure of the layers can be changed due to the characteristics of laser processing [11].
The 304 stainless steel is one of the most widely used metal materials. Corrosion and wear of 304 stainless steel result in heavy resource waste. Aluminum alloys are widely used as a surface protective coating for the 304 stainless steels [12,13]. Among them, AlSiTiNi has good corrosion and wear resistance, and is widely used as a surface coating to protect the steel substrate from corrosion and wear [14]. However, the large difference in thermophysical properties between the aluminum alloy and the 304 stainless steel will lead to defects in the coating during laser cladding [15,16]. These defects, including heat cracks, shrinkage, and residual stress, have negative effects on the performance of the coatings. In addition, the molten pool of aluminum alloys can easily absorb hydrogen and other gases during the cladding process. A large amount of gas is not able to be released during the cooling and solidification process after cladding, and thus more pores would be formed in the coatings [17,18].
AlSiTiNi powders are composed of different alloy powders with different physical properties. This makes the setting of processing conditions more complex. Reasonable processing parameters should be set to make sure that all of the metal components in the mixed powders could be melted without the introduction of excessive stress. Because of the high energy density and the fast heating and cooling speed during laser cladding, it is difficult to measure the temperature field and residual stress by experimental methods. Therefore, finite element analysis has been used to simulate the characteristics of the temperature field and the residual stress [19]. Li et al. [20] investigated the elimination of voids during laser remelting of a Ni-based alloy on gray cast iron by combining a numerical simulation and an experiment. Weingarten et al. [21] studied the formation of and reduction in the hydrogen porosity of AlSi10Mg coatings by a numerical simulation. Li et al. [22] investigated the effect of remelting scanning speeds on the amorphous formation ability of Ni-based coatings fabricated by laser cladding.
To date, numerical simulation has been widely applied to analyze the laser cladding process. However, these studies usually set up the geometry of the melting track before conducting a thermal analysis using a finite element model (FEM). The model’s calculation method is inconsistent with the actual working process of laser cladding. Liu et al. [23] built an FEM for the investigation of the wide-beam laser cladding process, without considering changes in the physical properties of the alloy powders before and after laser cladding. The prediction of melting and solidification phenomena by establishing a finite element model has been widely investigated in recent studies. Chen et al. [24] made a prediction of solidification in nanoparticle TiC ceramic powders by a finite element simulation. Du et al. [25] predicted the evolution of the microstructure of Ni-based materials during the multi-track laser melting process. Chen et al. [26] studied the phase formation of laves during the laser cladding process using different laser models. Hofman et al. [27] established a model for the determination of the clad geometry and dilution in laser cladding. Hao et al. [28] built a three-dimensional (3D) thermal finite element (FE) model for the simulation of the temperature field during laser cladding. The FEM uses an inverse modeling approach that consists of an adaptive cladding layer and a moving heat source model. Parekh et al. [29] studied the deformation of a free surface calculated by the moving element method. Suárez et al. [30] predicted the thermal-stress-initiated formation of cracks by establishing an FE model.
Many studies have combined a microstructure analysis with a numerical simulation. The calculated temperature gradient/solidification rate (G/R) curve could be used to further study the microstructure and its influence on material properties [31]. Several FE models for the laser cladding process have been established to study the thermal evolution of laser cladding; however, the number of models that describe the thermal history of laser cladding with pre-placed powders is limited. In addition, for most of these models, a preset track morphology is usually established to simulate the geometric morphology of a coating, which does not conform to the actual processing conditions of a cladding layer’s formation and also lacks predictability with respect to the geometric size of a cladding coating. In this paper, an FEM that considers material property changes before and after the melting and solidification process is built. The process of a coating’s formation is simulated by using the temperature selection judgment mechanism [32]. This mechanism reflects the change in material properties before and after heat source loading. The microstructure of the laser-cladded AlSiTiNi coatings is investigated, and the G/R curve under different scanning speeds is calculated. The predicted cladding height and width agree well with the experimental results.

2. Materials and Experiment

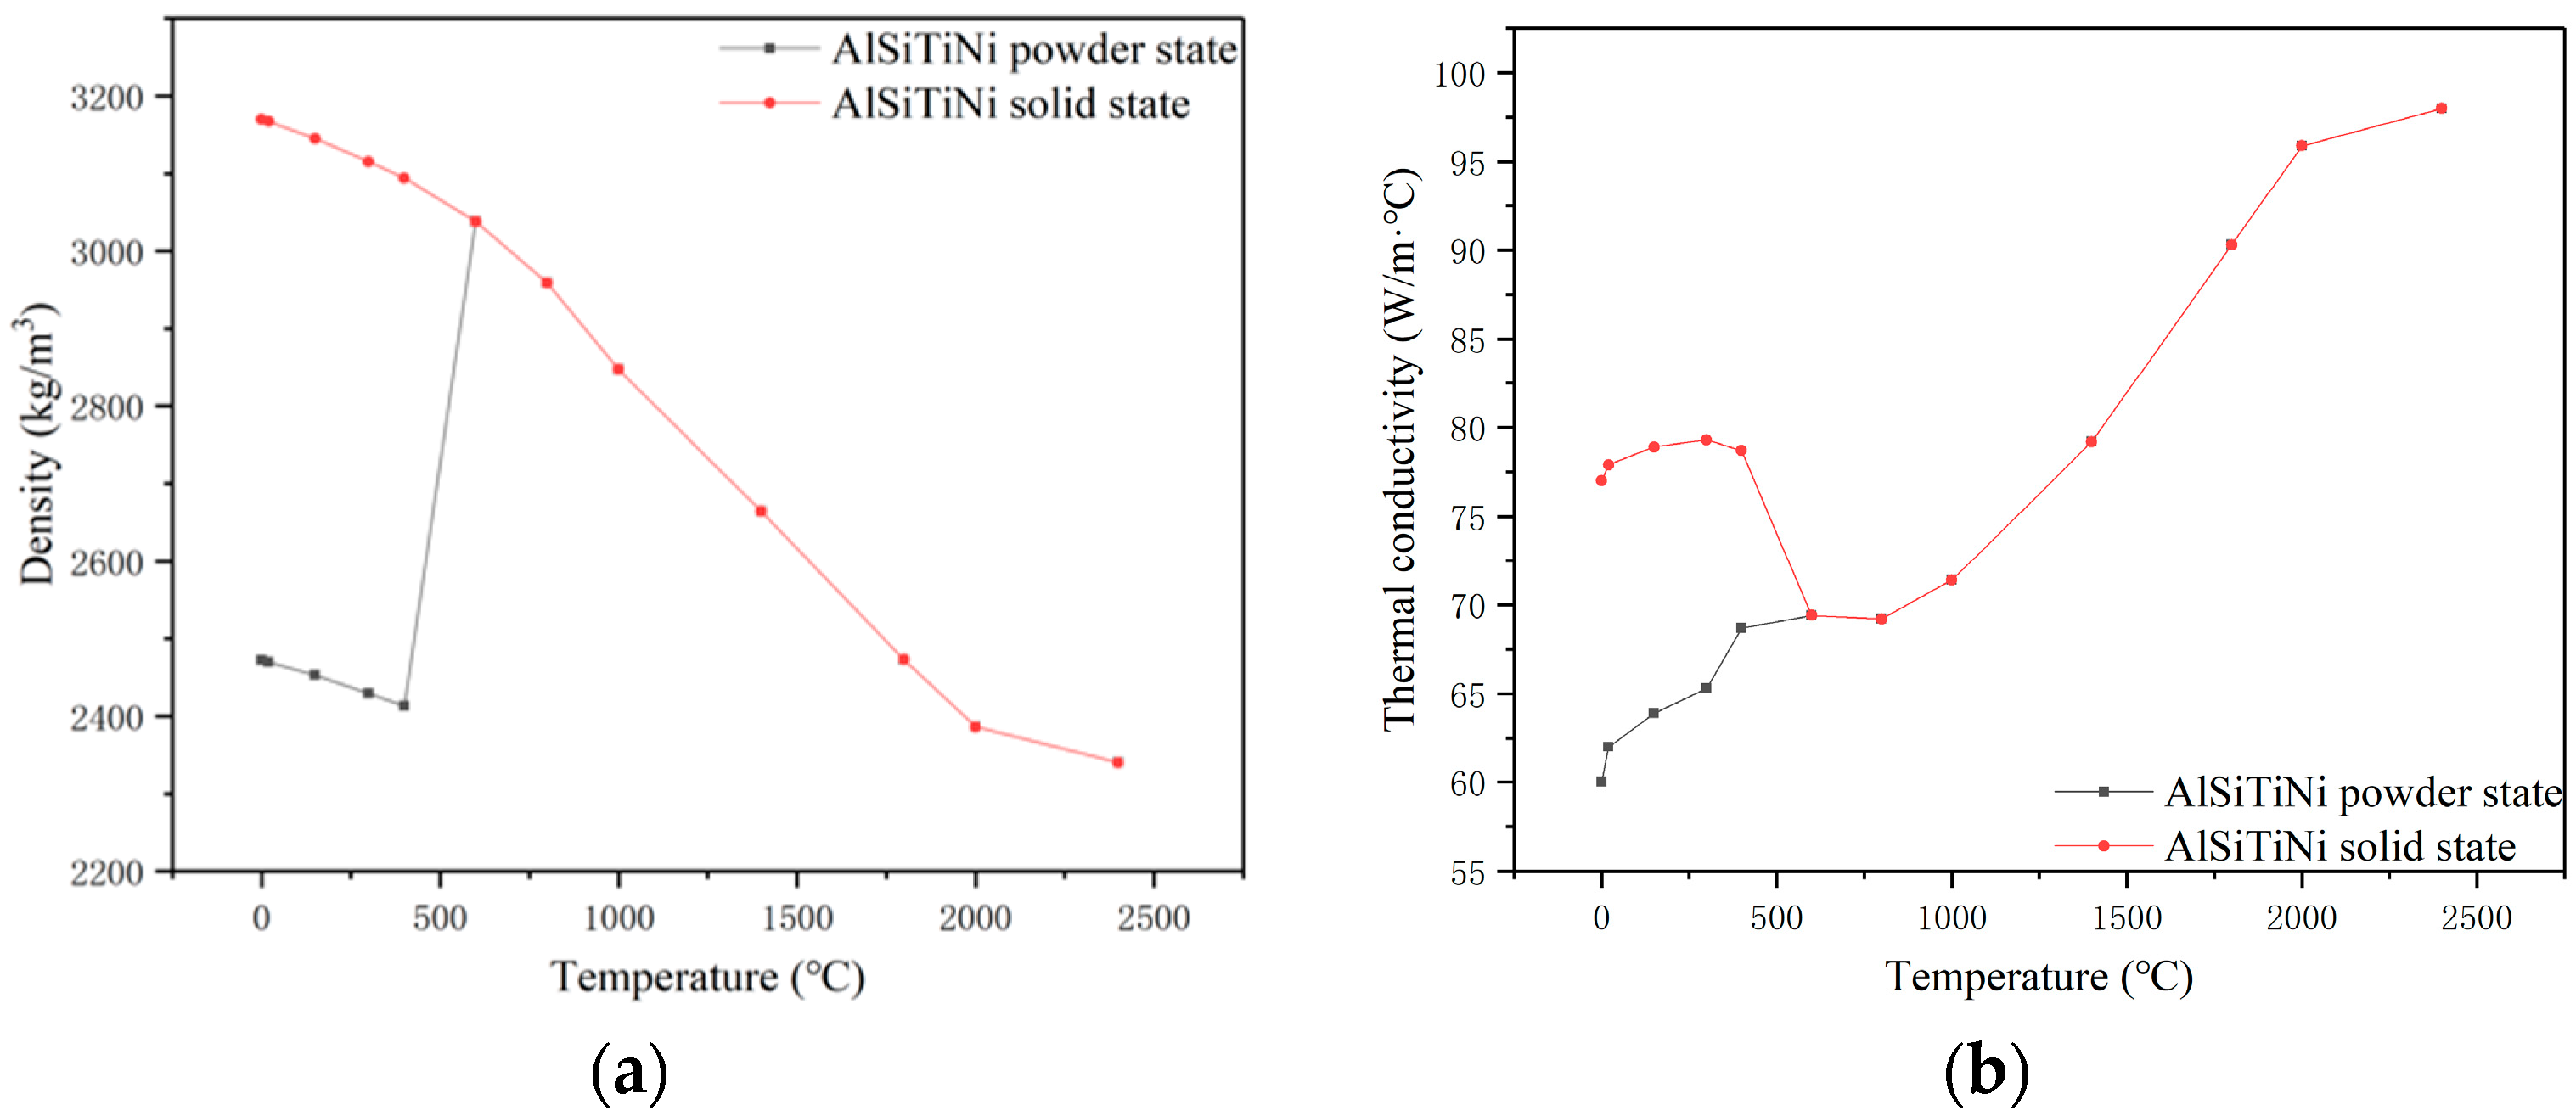
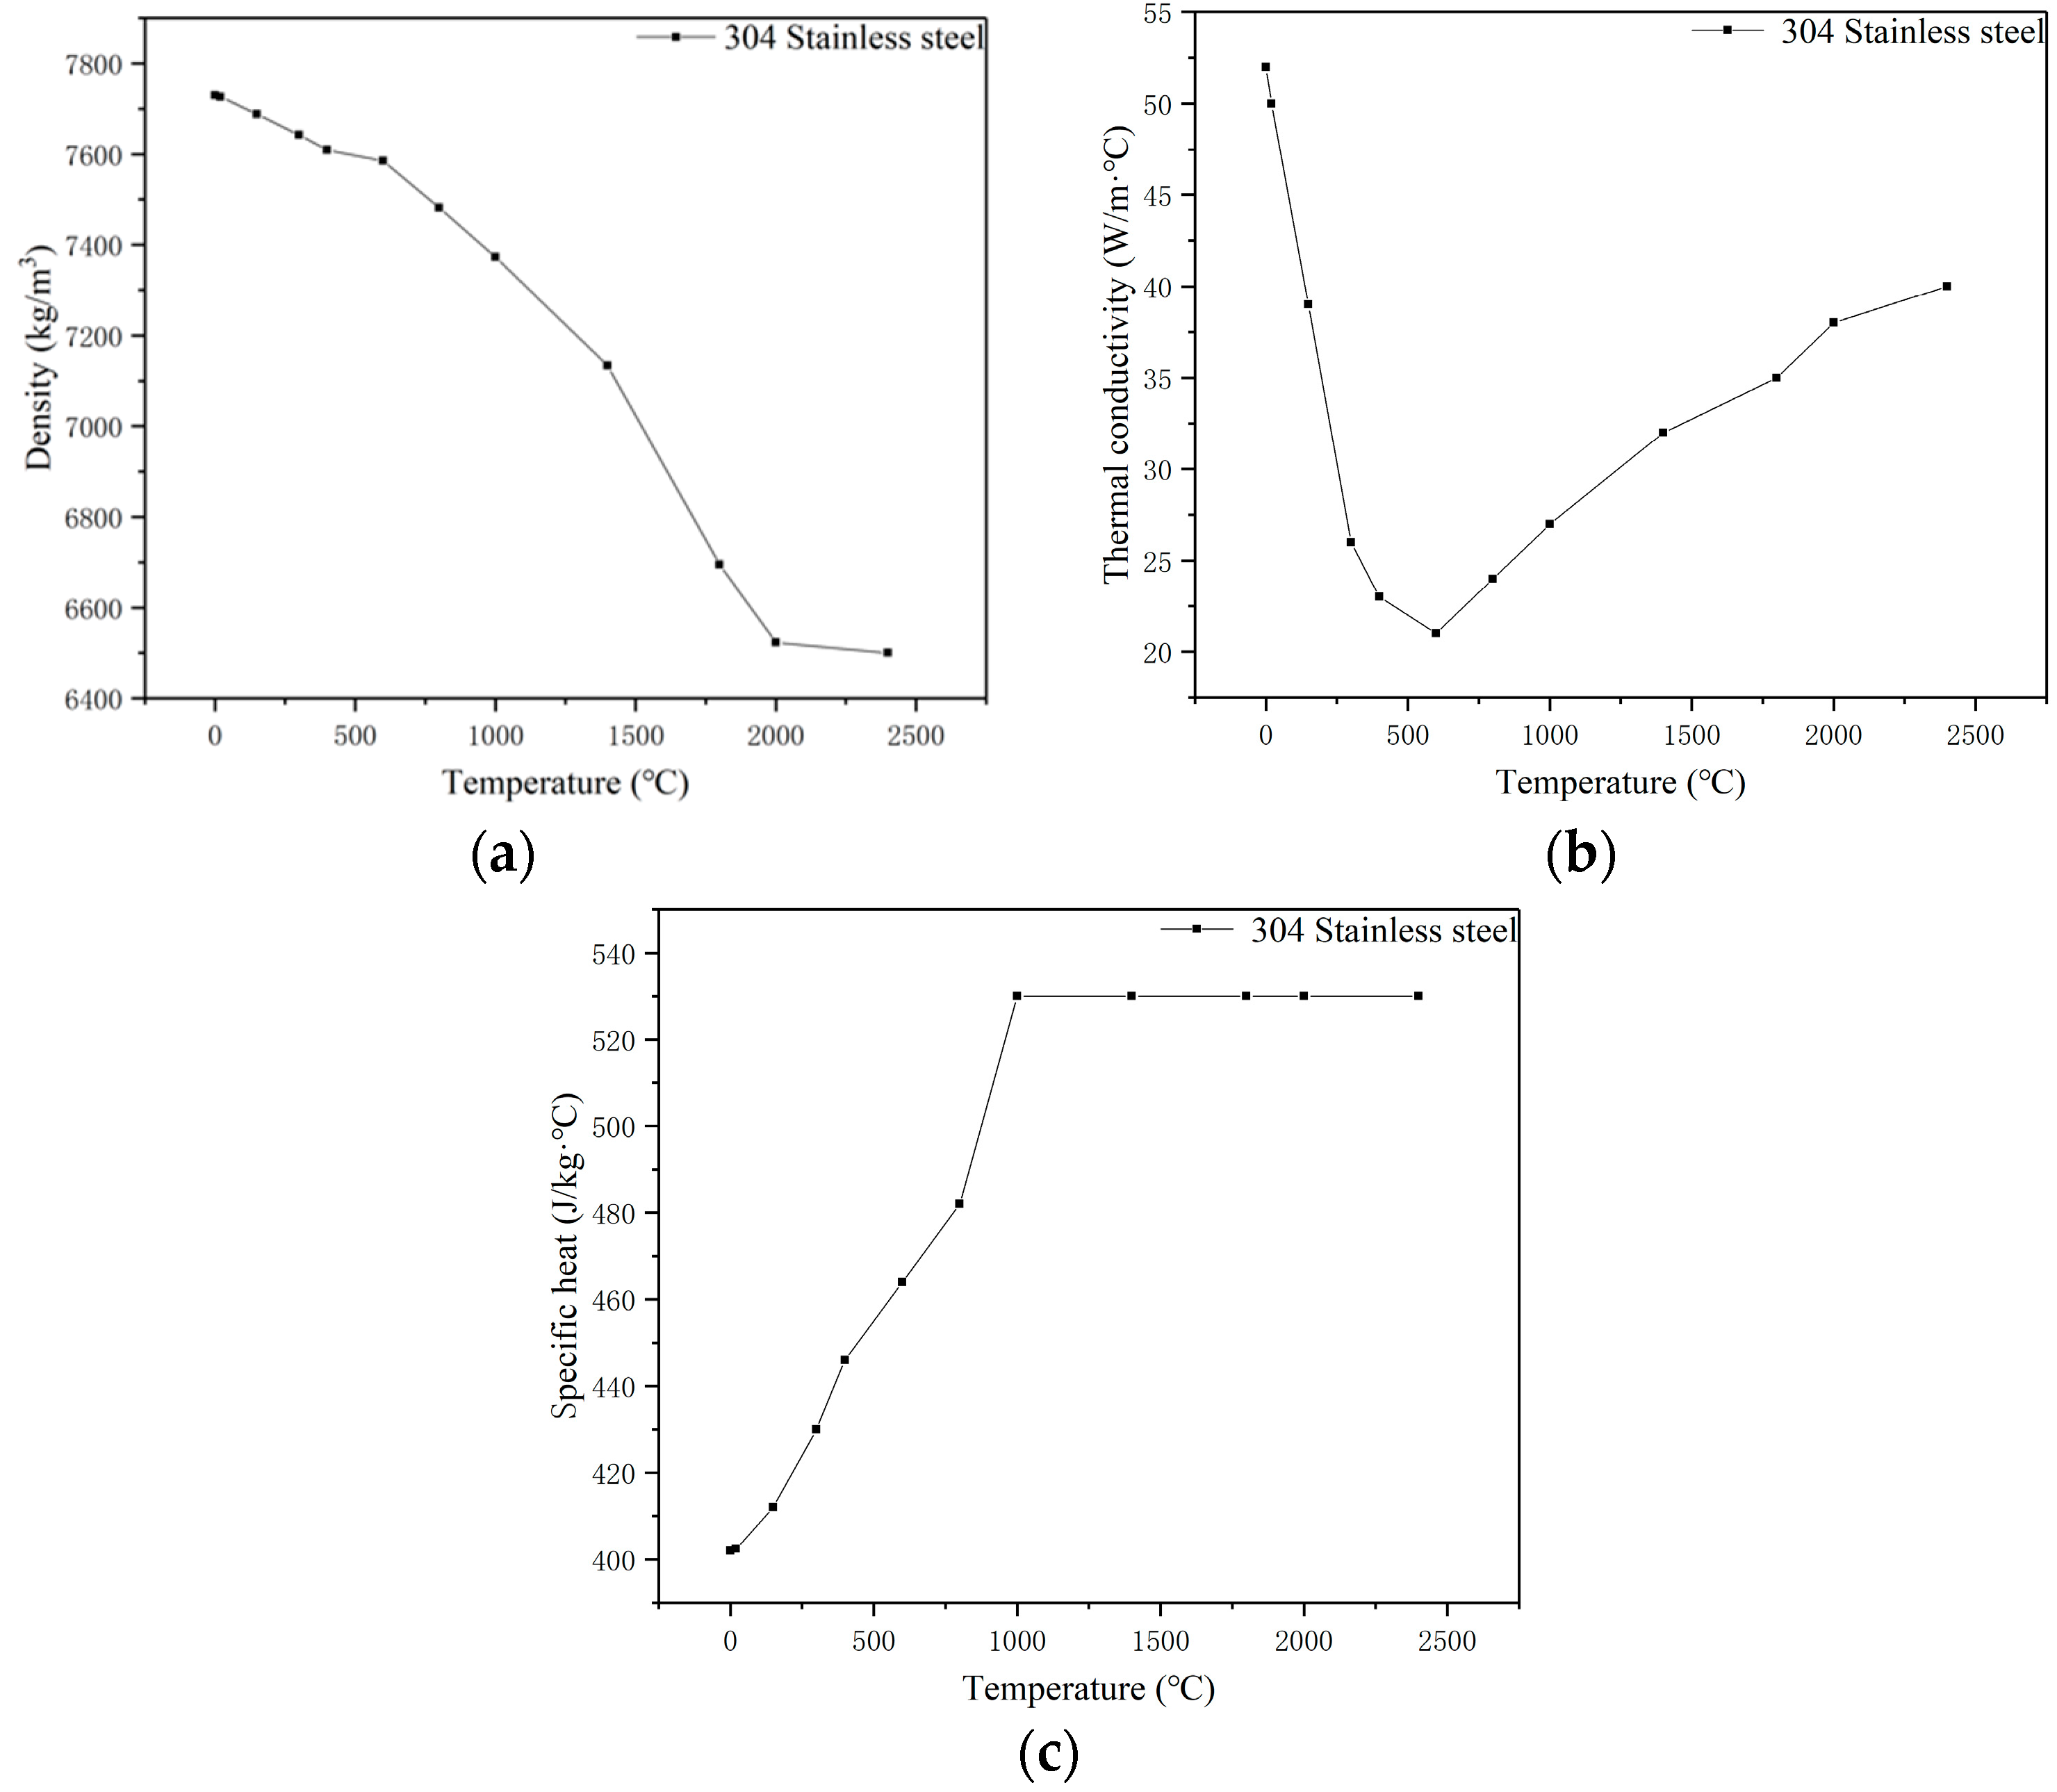
2.1. Material Properties
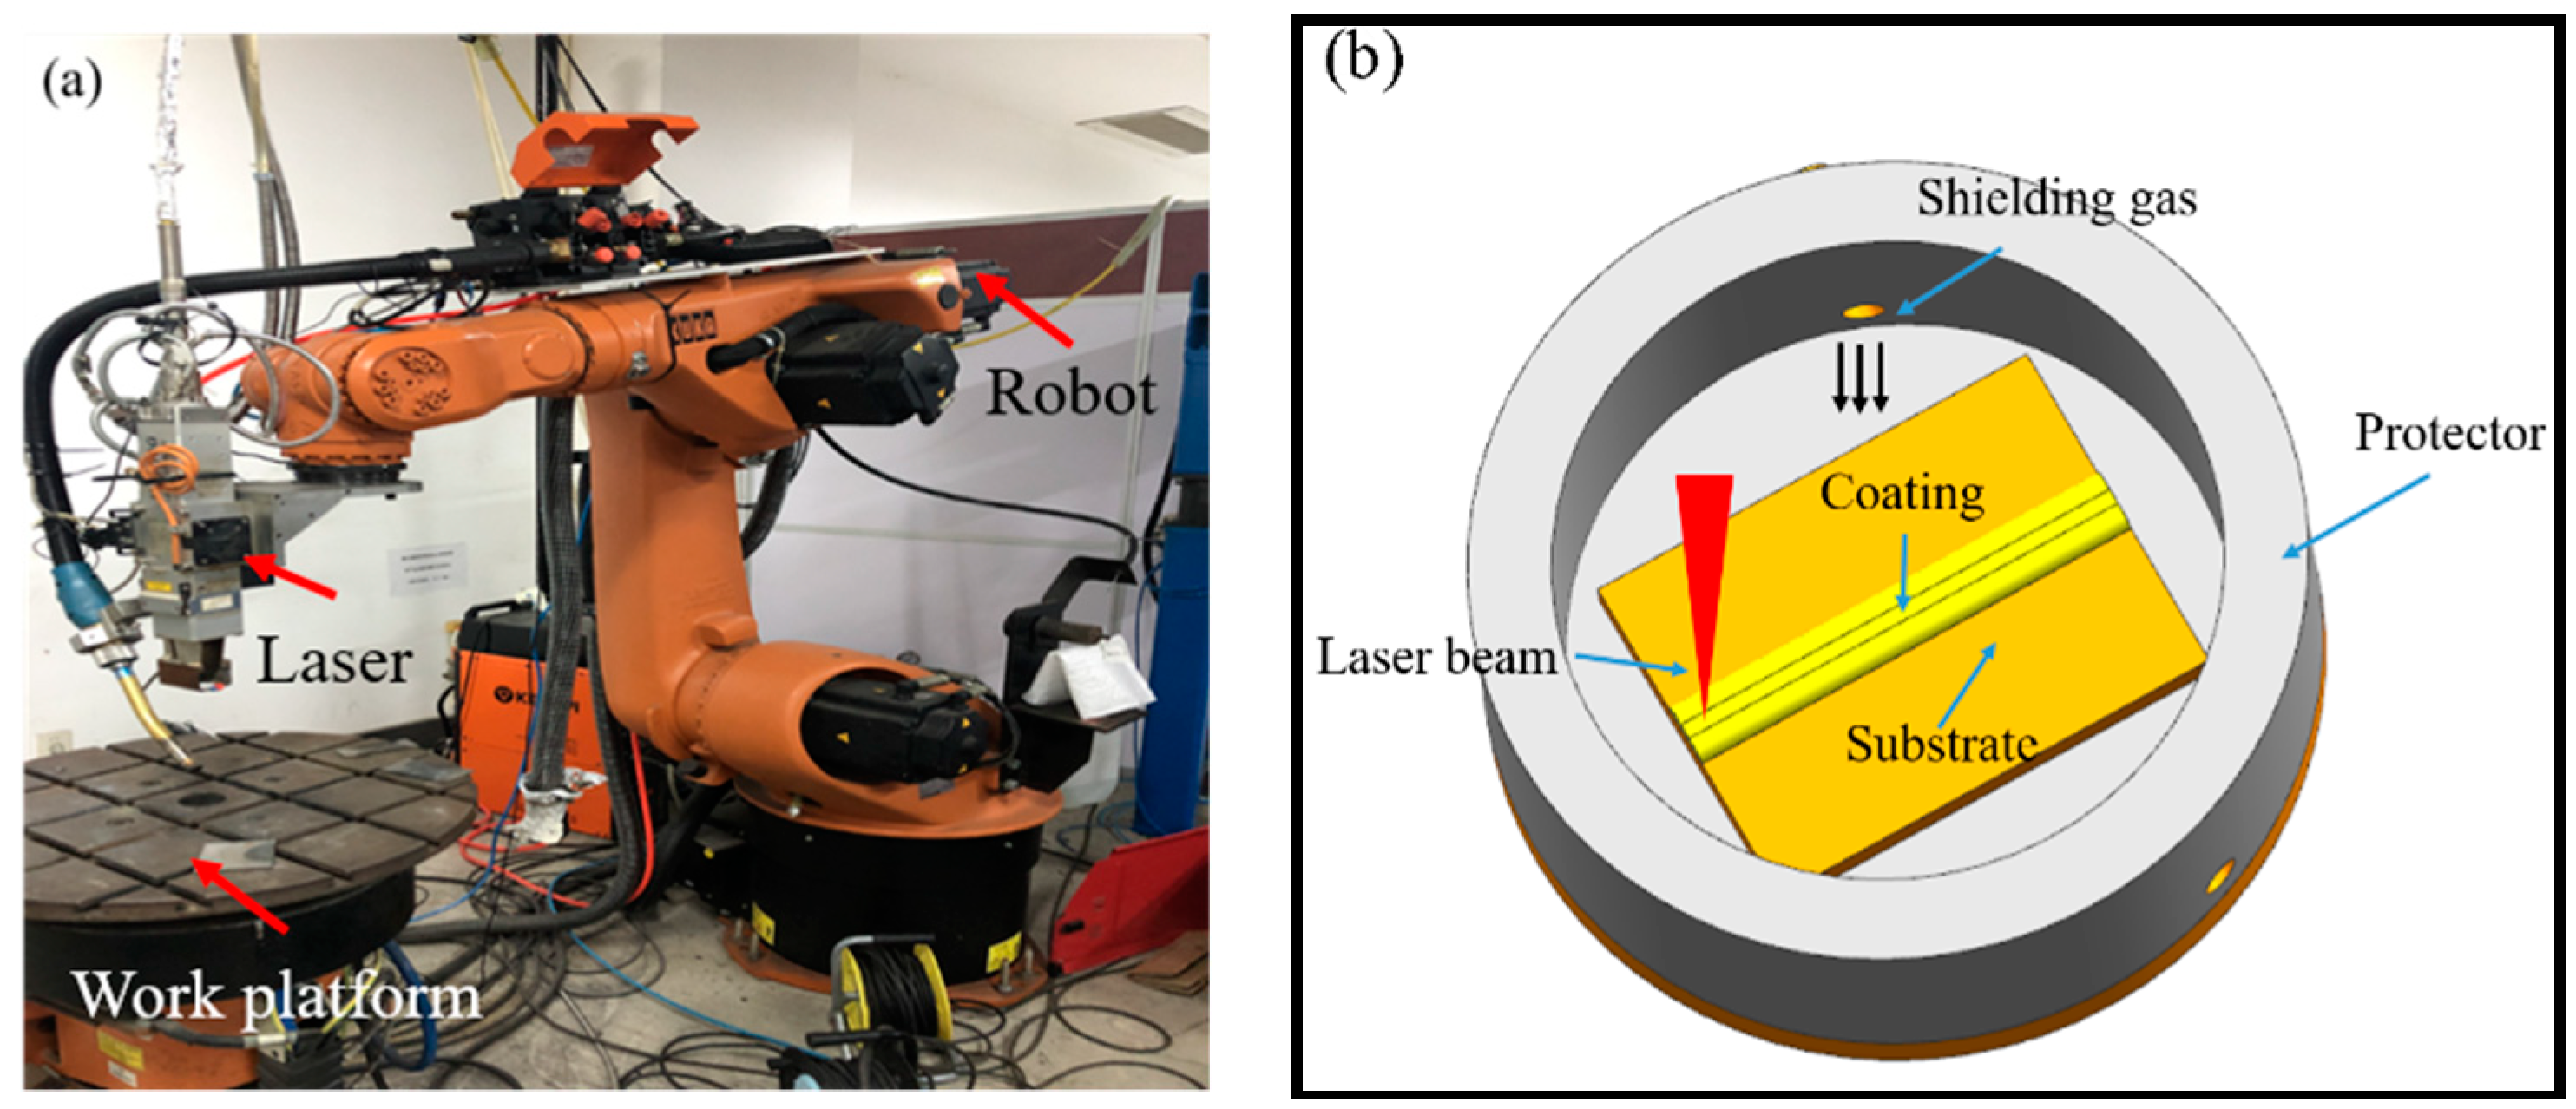
Al (≥99.5%), Si (≥99.5%), Ti (≥99.5%), and Ni (≥99.5%) powders were selected as the cladding materials. The powders were admixed by ball milling. The mixture ratio of the AlSiTiNi powders is shown in Table 1.
The physical properties of AlSiTiNi were calculated by Jmatpro (version 7.0). The material properties change with the variation of temperature during laser processing. The material state of AlSiTiNi powders before and after laser melting is quite different. The physical properties of AlSiTiNi in the powder state are different from those of AlSiTiNi in the solid state. The thermophysical properties of AlSiTiNi may change during its transformation from the powder state to the melted state and the solid state. Therefore, in order to improve the accuracy of the simulation and further study the thermal behavior of laser cladding with preplaced powders, the material properties of AlSi10Mg powders were measured and calculated. The density of the powder can be expressed as [33]:
ρ = φρg + (1 – φ) ρs
where φ is the powder porosity, ρg is the density of the gas, and ρs is the density of the AlSi10Mg alloy.
Therefore, the density of AlSiTiNi powder was measured as 2472 kg/m3 at the room temperature (25 °C) in our experiment. From Equation (1), the calculated porosity of the AlSiTiNi powder is about 23%, which indicates that the density of AlSiTiNi significantly changes during the laser cladding process. The Gusarov model [33] indicates that the thermal conductivity is definitely affected by the porosity of metal powders. The thermal conductivity of powder materials, considering the porosity, could be expressed as:
k e = k ( 1 φ ) n π a R
where k is the thermal conductivity of the AlSiTiNi alloy, φ is the porosity of the AlSiTiNi powder, n is the coordination number, a is the sintering neck radius of the powder, and R is the average radius of the powder. The melting point of AlSiTiNi is about 602 °C. Figure 1 shows the material properties of the AlSiTiNi in the powder state and in the solid state.
The 304 stainless steel was used as the substrate. The chemical composition of the 304 stainless steel is shown in Table 2 [34,35].
The properties of the 304 stainless steel substrate are quite different from those of AlSiTiNi. The melting point of 304 stainless steel is about 1399 °C. Figure 2 shows the material properties of the 304 stainless steel.

2.2. Experimental

An IPG-YLS-5000 fiber laser (IPG Photonics Corporation, Oxford, MS, USA) equipped with a six-axis Kuka robot was used to conduct the laser cladding experiment. A schematic illustration of the laser cladding process is shown in Figure 3. The samples prepared in the experiment were grinded and polished with sandpaper. The microstructure of the samples was observed by an optical microscope and a scanning electron microscope.
In order to study the influence of different processing parameters on the formation quality of the laser cladding coatings, the experiment was designed by controlling variables. Table 3 shows the main processing parameters of the laser cladding experiment. The scanning speed and laser power affect the temperature field of the cladding process and the solidification behavior of the molten pool. The main variable in the study is the laser scanning speed. The other variables, such as defocus, laser power, and material compositions, remained unchanged.

3. FEM Model

3.1. Thermal Analysis

When the laser beam irradiates the surface of the material, the temperature of the specimen begins to increase from the surface to the bottom. Two types of thermal analysis, steady and transient state, should be considered. The steady-state analysis is required to obtain initial boundary conditions before the transient-state analysis [36].
The variable ϕ(x,y,z,t) of the transient temperature field in a Cartesian coordinate system is expressed in Equation (3):
ρ c ϕ t x ( k x ϕ x ) y ( k y ϕ y ) x ( k z ϕ z ) ρ Q = 0
Boundary conditions, including environment temperature, heat source density, convective heat transfer, and heat radiation, are expressed in Equation (4):
T ( x , y , z , t ) = T ¯ ( t ) ( Γ 1 ) k x T x n x + k y T y n y + k Z T y n Z = q ¯ f ( t ) ( Γ 2 ) k x T x n x + k y T y n y + k Z T y n Z = h ¯ c ( T e T ) ( Γ 3 ) k x T x n x + k y T y n y + k Z T y n Z = ε σ ( T e 4 T 4 ) ( Γ 4 )
where T ¯ ( t ) is the given temperature on boundary Γ 1 , q ¯ f ( t ) is the given heat source on boundary Γ 2 , h ¯ c is the heat transfer coefficient between the object and the surrounding environment, ε is the emissivity, and δ is the Stefan–Boltzmann constant.
Metamorphosis is a parameter that reflects the amount of change in an object. It consists of the sensible heat of the substance and the latent heat of fusion.
H ( T ) = H s ( T ) + Δ H
where H s ( T ) is the sensible heat, and Δ H is the latent heat that is released when the material is melting.
H S ( T ) = C d T
where T is the temperature, and C is the specific heat at the current temperature. The sensible heat is the accumulation of energy during the rise in temperature.
The loss of heat on the interface that is caused by the protective gas is considered in our model. The protective gas influences the heat convection on the surface of the molten pool. A lumped heat transfer coefficient that considers convention and radiation is defined as [25]:
h = 24.1 × 10 4 ε T 1.61
where ε is the emissivity of the powder bed.

3.2. Heat Source Model
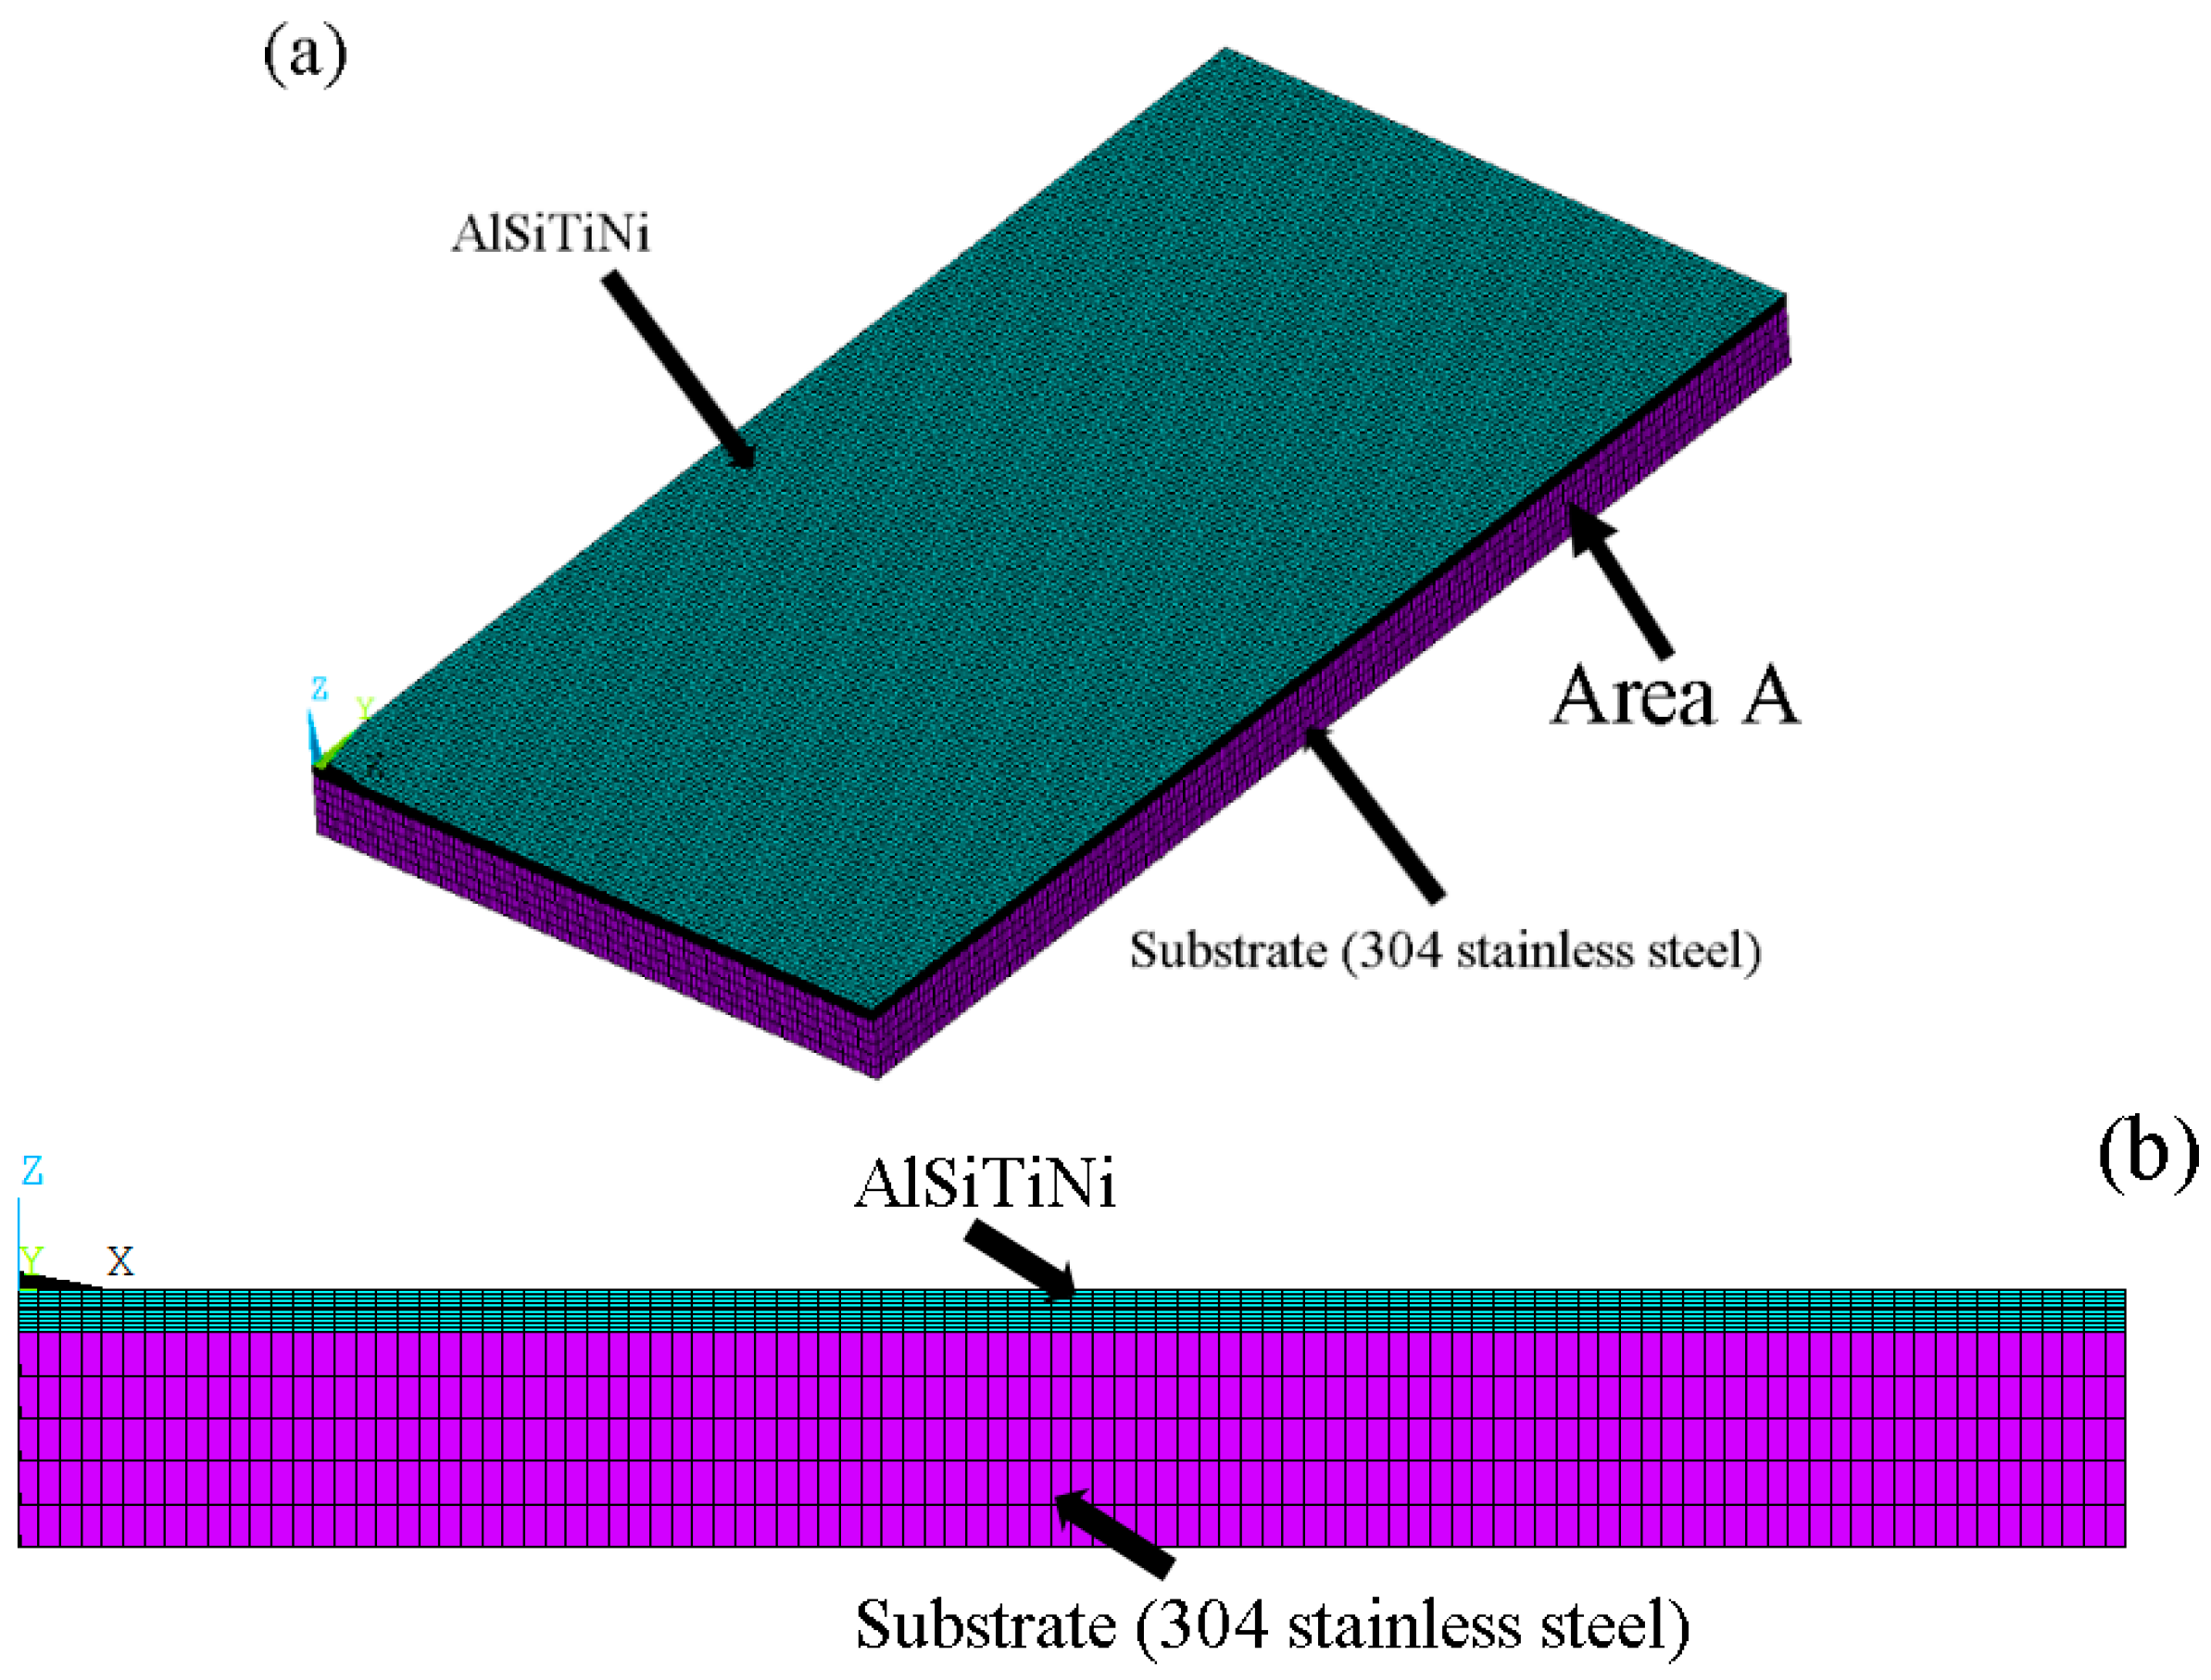
The planar Gaussian heat source model is a typical heat source model for the simulation of the energy distribution of the laser beam. The planar Gauss heat source model reflects the laser energy distribution in the plane. Thermal deformation will change the shape of the model during the cladding process. These changes are different because the temperature field is altered at different times [37].
Figure 4 shows the energy distribution of the Gauss heat source. The heat flux density in the Gauss heat source is written as Equation (8).
Q = 3 A P π R 2 e ( 3 R 2 ) ( x 2 + y 2 )
where P is the power, A is the laser absorptivity, and R is the radius of the laser spot. The planar Gauss heat source model assumes that the distribution of the heat source is symmetrical. This heat source model is suitable for the simulation of low-speed laser cladding.

3.3. Setup of Model

The geometry model is based on the experimental data from our previous study [14]. Figure 5 shows the oblique and cross-sectional drawing of the model.
The model is built to simulate the laser cladding process in Ansys (Pittsburgh, PA, USA). In the simulation of the temperature field, symmetrical constraints are imposed on area A to reduce the calculation time. Different material properties of the AlSiTiNi powder and the 304 stainless steel were assigned to the corresponding elements.
The mesh of the model is shown in Figure 5. As the laser spot radius is about 1.5 mm, the grid size of the cladding coating was set to be about 1/10 of the spot radius (0.2 mm) to make the simulation results more accurate. The mesh size of the AlSiTiNi was set to be finer because the temperature field variations are concentrated in this part (element size of AlSiTiNi powder: 0.2 mm × 0.2 mm × 0.05 mm, element size of 304 stainless steel substrate: 0.2 mm × 0.2 mm × 0.5 mm). This paper focuses on the process of powder melting and solidification. The number of elements of the powder layer is 200,000, which is suitable to simulate the melting and solidification process of the cladding layer by the temperature selection judgment mechanism. Considering the complex thermal behavior in the depth direction of the powder layer, the elements of the powder mesh in the Z-direction are finer.
In order to simulate the material properties of the powders after laser irradiation, the powder element was judged according to the temperature during laser scanning. When the temperature was higher than the melting point of the powder material, the material properties of the corresponding element were immediately changed from the powder’s current state to the solid state. The Solid70 element is usually used as the basic element of the finite element model in a finite element analysis of the heat transfer process. Each Solid70 element has eight nodes. By traversing all of the coating elements and reading the temperature loads of these eight nodes in the corresponding element, the average temperature of the current element can be determined by calculating the average temperature loads of the eight nodes to judge whether the unit has melted or not. Equation (9) shows the average temperature judgment model.
T ( i ) = 1 n T n n ,   for   i   1   to   k ,   if T ( i ) < T melt , set   M a t = 1 , if   T ( i ) T melt ,   set   M a t = 2
where T ( i ) is the average temperature of the element, T n is the temperature load on the node, n is the number of nodes, k is the number of coating elements, T melt is the melting point of the coating material, and Mat is the material attribute number. If the temperature of the monitoring point is near the melting point of the powder material, it can be considered that the boundary of the molten pool is near this monitoring point. By calculating the distance from the surface to the point, the clad heights can be calculated. The temperature selection judgment mechanism was used to introduce and calculate the powder volume during each step. During each calculation step, the elements of AlSiTiNi in the powder state with a temperature above the melting point were selected and transferred into elements of AlSiTiNi in the solid state. By obtaining the number of transformed elements, the powder volume can be calculated.
Some assumptions about ideal conditions were made to simplify the finite element model: (1) the substrate and the powder material were assumed to be continuous, homogeneous, and isotropic; (2) the fluid flow of the molten pool was ignored; and (3) volume loss in the cladding process was not considered. Figure 6 illustrates the laser cladding process and the differences between the experimental process and the simulation. At the initial stage of laser cladding, the laser energy directly loads the surface of the powders with heat. The effective heating radius of the heat source is slightly larger than that of the laser spot and the powders on the surface begin to melt (Figure 6a). The heat transfer of laser energy diffuses from the center of the heat source to the surrounding area in a Gaussian distribution. The heat transfer gradually decreases in the direction of penetration, and only a shallow molten pool is formed when it contacts the substrate.
In addition, the melt flow goes from the low-temperature gradient region to the high-temperature gradient region. The undissolved powders at the edge of the molten pool disperse around the molten pool (Figure 6b). After the laser leaves the current position, the molten pool solidifies rapidly. The melted powder on the surface flows to the bottom of the molten pool along the flow direction and eventually forms a smooth coating after solidification (Figure 6c). The temperature distribution during the laser cladding process and the variation in the geometric morphology of the cladding tracks were simulated by selecting and making a judgment on the temperature elements. Due to a limitation of this model (the fluid flow of the molten pool is not taken into consideration), the simulation result (Figure 6d) is different from the stage shown in Figure 6c.

4. Result and Discussion

The scanning speed significantly affects the laser energy per unit volume. When the laser power and defocus of the beam are set to be unchanged, the energy produced from the center of the heat source is unchanged.
Equation (10) shows the relation between the laser energy per unit volume and the scanning speed. The faster the laser moves, the less energy it produces per unit volume.
Q V = f ( Q ) V V a v , t = V a v
Figure 7 describes the temperature distribution of the laser overlapping process. The overlap ratio is 50% in the experiment. Before laser cladding, the sample was kept at room temperature (20 °C). During the laser cladding process, the AlSiTiNi powders rapidly melt above 602 °C and then solidify to form the cladding layer. In the initial stage (Figure 7a,b), it can be seen that the maximum temperature rapidly rises from the room temperature to 1400 °C. During the cladding process of the first cladding layer (Figure 7c,d), the maximum temperature becomes stable when the temperature reaches 1700 °C. When the second cladding layer is overlapped, the maximum temperature rises to about 1951 °C (Figure 7e). When the laser beam is removed from the coating, the temperature drops rapidly (Figure 7f). This phenomenon is ascribed to the rapid melting and solidification characteristics of laser cladding.
The maximum temperature curve of the multi-track laser cladding process is shown in Figure 8. The monitoring points were set along the scanning path to obtain the temperatures of the molten pool at different scanning time points. They show the temperature variation during the laser overlapping process. Because the laser energy is not completely transferred and absorbed, the maximum temperature at the initial stage of each cladding layer is lower than the temperature at the stable stage. Due to the accumulation of heat from the previous track, the maximum temperature of the second cladding layer (1945 °C) is higher than that of the first layer (1726 °C). The laser cladding process ends after 6 s and the sample enters the cooling stage. After the heat source stops loading the sample, the main source of energy is lost, which makes the unsteady temperature field change more dramatically. The temperature falls at a speed faster than 483 °C/s from 1951 °C to lower than the melting point of AlSiTiNi powders.
In this model, the process of the cladding layer’s formation was simulated by the temperature selection judgment mechanism. Because the temperature at the initial stage was different from the temperature at the stable stage, the width of the cladding layer changed during the cladding process. Figure 9 shows a diagram of the width change in the cladding layer during the multi-track laser cladding process. The front width of the first cladding layer is about 3.2 mm, which corresponds to a temperature of about 1400 °C (Figure 7b). When the temperature became stable (1750 °C), the width was kept at 3.6 mm. The cladding layer was widened by 0.4 mm. The overlapping rate of the cladding layer was maintained at 50%, which means that heat was loaded onto the boundary of the first cladding layer. When the powder undergoes melting and solidification, it changes from the powder state to the solid state. Both the density and the thermal conductivity of AlSiTiNi were improved, which made the shape of the molten pool change asymmetrically during the cladding process. The molten pool inclined to the front cladding layer. It can be seen from Figure 9 that, after the overlapping process ends, the width of the second cladding layer is about 3.8 mm. As the laser processing time increased, the width of the cladding layer increased as the temperature increased. The simulation results show that there is a variation in width of 0.4 mm between the front and rear of the cladding coatings. For the multi-track cladding, a 0.2 mm increase in the width of the second track was observed as compared to the previous track.
Figure 10 shows the temperature field distribution during single-track laser cladding at a laser power of 1500 W and different scanning speeds (0.005, 0.01, and 0.015 m/s). The same distance was scanned at three different laser scanning speeds, which took different amounts of time (6, 3, and 2 s, respectively).
Overall, the laser cladding processes have the following commonalities. At the beginning, the initial temperature was low and the width of the formed cladding layer was narrow because the heat had not been fully transferred. As the scanning process proceeded, the temperature gradually rose and became stable. Because the beam’s center was at a very high temperature, parts of the powders in the direction of laser scanning were preheated and melted even when the laser had not scanned to their location. The laser energy had a Gaussian distribution on the surface of the powder layer and it had very rapid energy attenuation in the depth direction of the molten pool (the Z-axis). These factors lead to a phenomenon in which only the powder on the surface had been melted, while the powder near the substrate may not have been melted if it was in a position that was not close to the center of the heat source.
Powders with the same volume absorb different amounts of energy at different scanning speeds. As shown in Figure 10, the temperatures of the molten pool center at the scanning speeds of 0.005, 0.01, and 0.015 m/s were 2007.54, 1726.78, and 1547.6 °C, respectively. In addition, the lower the scanning speed was, the wider the range of temperature was distributed.
To further study the change in width of the cladding layer at different scanning speeds, three groups of monitoring points were set on the surface of the molten pool to obtain the time-history temperature curves. Figure 11 shows the surface temperature monitoring point of the molten pool at different scanning speeds. Because the temperature of the molten pool differed at different scanning speeds, the width of cladding layer varied in different temperature ranges. The cladding layer element was selected according to the temperature load selection judgment result and the monitoring points were set at different spacings and in different numbers to make the monitoring results more accurate. Each element was 0.2 mm in width in the X-axis direction.
From Figure 12a, it can be seen that the temperatures of points A to G, located in the cladding layer, are all above the melting point of AlSiTiNi powder (602 °C). The temperature at point G is about 602 °C, which means that the boundary of the cladding layer is at point G. Figure 12b,c show that the temperature of the points G and E is on the boundary of the molten pool, respectively. The melting points of the Si, Ti, and Ni powders in the AlSiTiNi powder were found to be higher than that of Al powders. We found that the closer a point was to the center of the molten pool, the higher the temperature at that point, and the easier it was for all of the metal powders in the powder mixture to be fully melted there. In addition, we found that a higher scanning speed led to a reduction in the high-temperature area and consequently insufficient fusion at the edge of the cladding layer.
Table 4 shows the width of the molten pool provided by the simulation result and the experiment result. By calculating the distance between nodes, the width of the cladding layer at different scanning speeds can be simulated.
Because the molten pool flow, volume expansion, and contraction process were not considered in the numerical simulation, the calculated values and the experimental results were different. The error in the planar Gauss heat source was small when calculating the temperature field at a low speed. The error increased as the scanning speed increased. The variation between the numerical simulation and the experimental results is less than 15%.
Similarly, the set of temperature monitoring points and the cross-section of the cladding layer are depicted in Figure 13. The node spacing for the powder and the substrate was 0.05 and 0.5 mm, respectively.
As shown in Figure 14a, there are nine points from the top surface of the cladding coating to the substrate, denoted A–I. The peak temperatures of the nodes A–F are all higher than the melting point (about 602 °C) of the AlSiTiNi powder, indicating that the cladding materials in this region can be fully melted. The node F is located at the interface between the cladding coating and the substrate, and it has a peak temperature of 1500 °C, which is higher than that of the AlSiTiNi powder and the 304 stainless steel (about 1399 °C). The node H is located at the substrate and the temperature is 1100 °C, indicating that only a small fraction of the stainless steel melts in this region. The temperature of the monitoring point below F is lower than that of the melting area of the 304 stainless steel, which means that the boundary of the molten pool is near the point F.
Similarly, in Figure 14b, the temperatures of monitoring points A–F located on the cladding layer are all higher than the melting point of the AlSiTiNi powder. The temperature of point G is lower than that of the melting area of the 304 stainless steel. This indicates that the region between the substrate and the powder remains in a mushy state. Parts of the stainless steel have melted, while other parts remain unmelted. The depth of the molten pool is not deep enough to reach the location of point G, which means that the depth of the molten pool is less than 1 mm.
Compared with the experiment result, the depth of the molten pool simulated by this model is more accurate at a low scanning speed than at a high scanning speed. The main source of error is inaccurate heat transfer from the planar Gauss heat source in the depth direction. Table 5 shows the depth of the molten pool provided by the simulation result and the experiment result. The simulation result agrees well with the experiment result when the scanning speed is 0.005 m/s. However, when the scanning speed is 0.01 m/s, the temperature of the molten pool is lower than the temperature when the scanning speed is 0.005 m/s. The error of the planar Gauss heat source for the penetration simulation increased.
The temperature gradient G and the solidification rate R influence the microstructure and properties of the cladding layer, including the grain size and grain morphology. The morphology of the grains changed after solidification. The G/R ratio determines the grain size. As the value of G/R increases, the grain size becomes finer. Equation (11) shows the calculation equations of [38].
R = V cos θ ,   cos θ = G Y G X + G Y + G Z
where R is the solidification rate, θ is the angle between the normal direction of the solid–liquid interface and the traveling direction, and G X , G Y , and G Z are the temperature gradient in each direction.
Figure 15 shows a schematic illustration of the molten pool boundary. The boundary of the molten pool is located at the interface between the solid and liquid phases. During the movement of the molten pool, the transient solidification processes take place at the boundary line.
The results of calculating G, R, and G/R are shown in Figure 16. The temperature gradient at a scanning speed of 0.005 m/s is lower than that at a scanning speed of 0.01 m/s. The higher scanning speed leads to a nonuniform temperature distribution, which results in a higher temperature gradient in the adjacent areas. The highest temperature gradient is concentrated at the bottom of the molten pool. The heat dissipation is greater in the bottom of molten pool, leading to a higher temperature gradient in this region. The solidification rate indicates the speed of the cladding layer’s growth. A lower scanning speed makes more energy be absorbed in this region. The higher energy leads to a higher temperature, so the molten pool has to take more time to transition into the cooling stage. The above reasons make the solidification rate become slower at a slower scanning speed. The curves of the G/R (cooling rate) along the solidification line are shown in Figure 16e,f. The maximum cooling rate appears at the surface of the molten pool’s boundary, while the minimum value appears at the bottom of the molten pool. Moreover, the cooling rate is increased with an increase in scanning speed.

5. Conclusions

In this paper, a 3D FE model was developed to study the thermal evolution process of laser cladding AlSiTiNi coatings on 304 stainless steel. A temperature selection judgment mechanism was used to simulate the laser cladding process and the geometry morphology of the cladding coatings. The main conclusions of the paper are as follows:
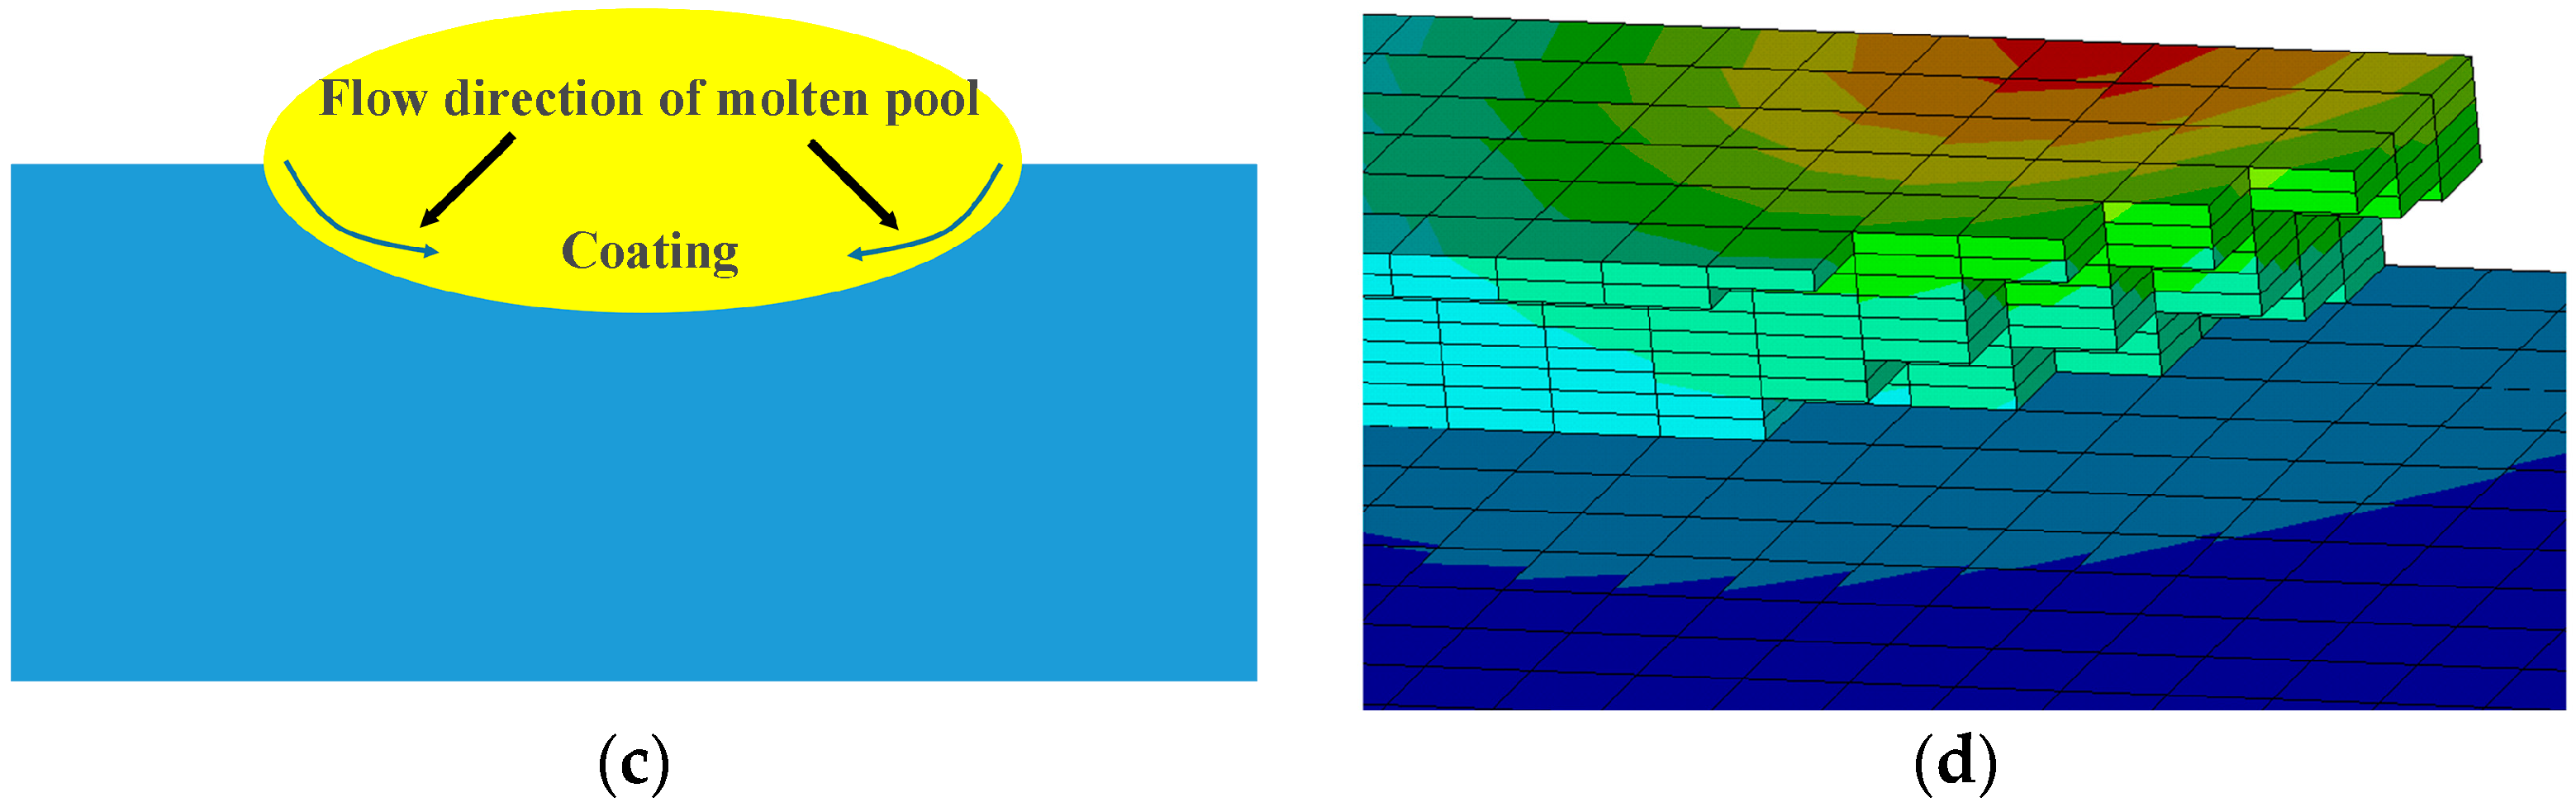
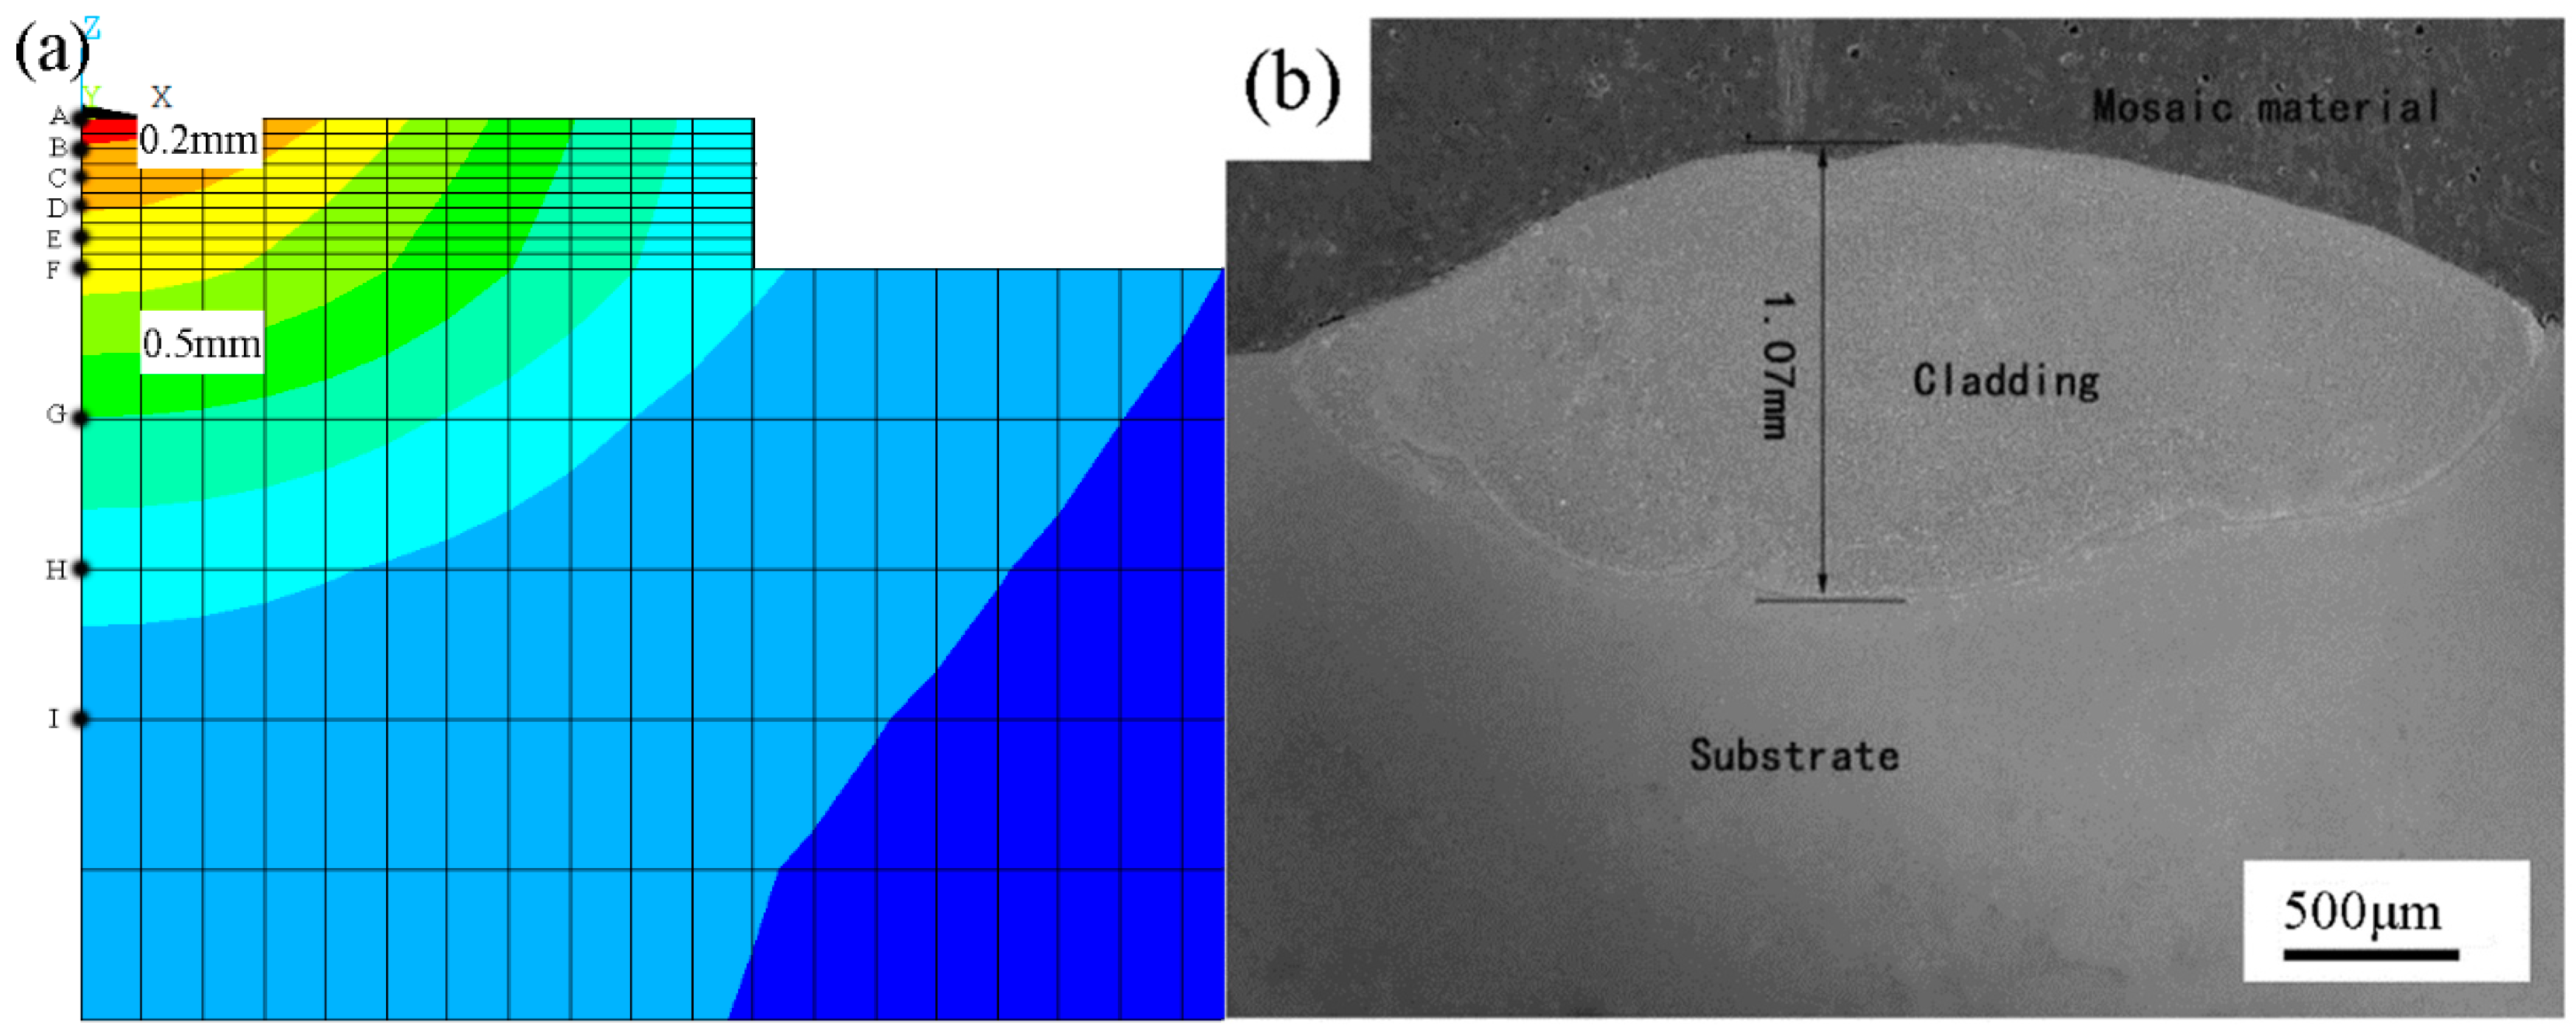
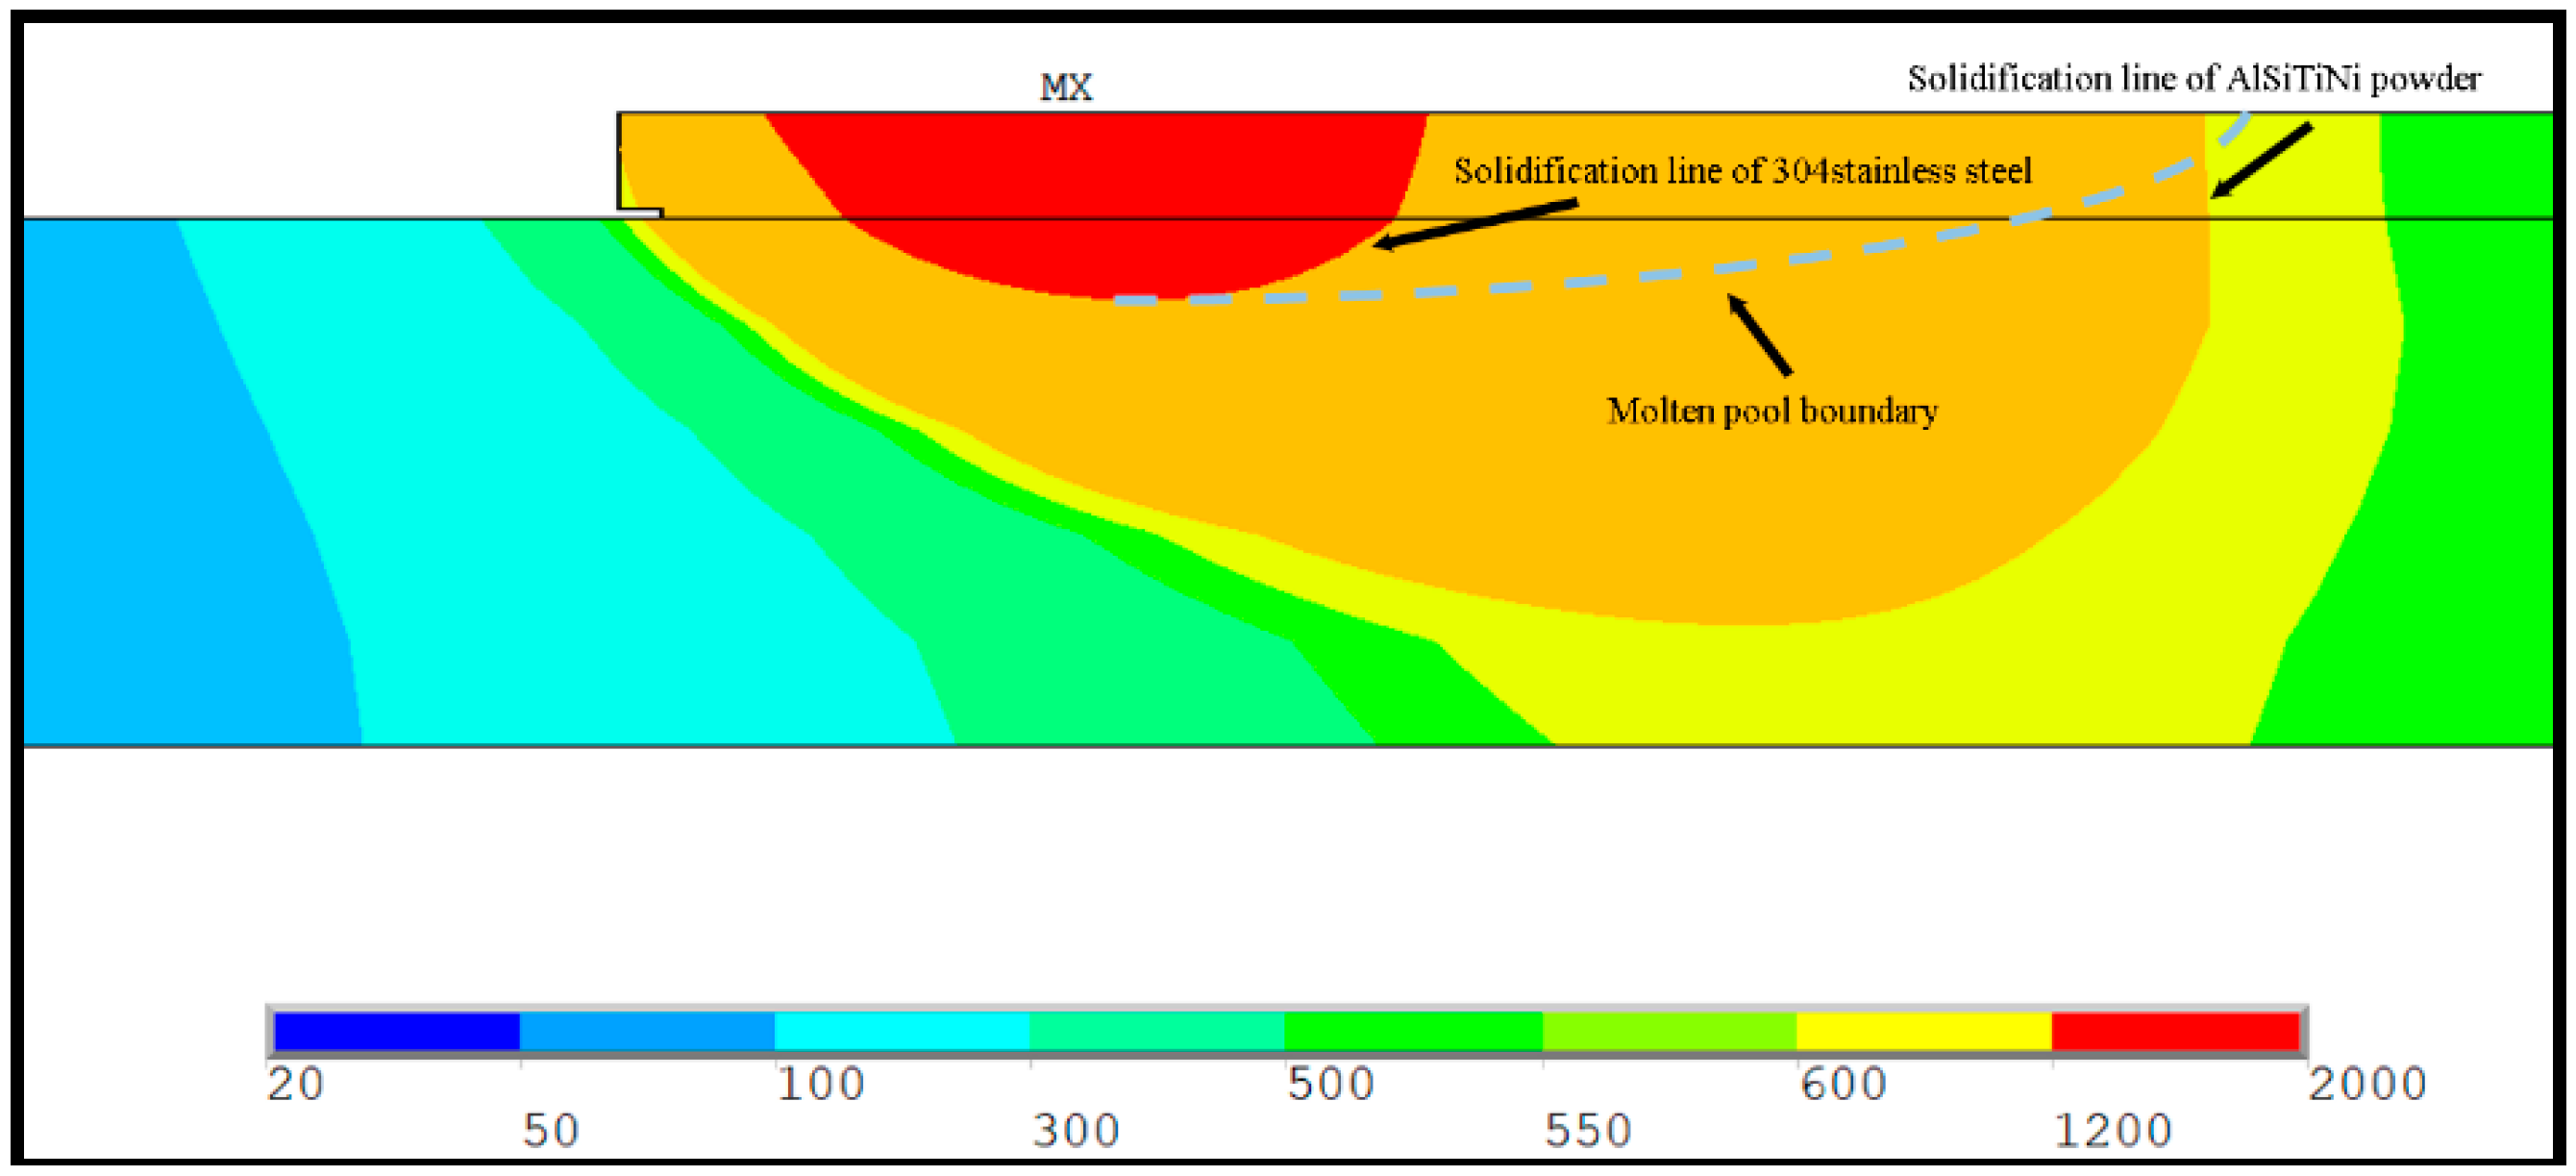
  • By combining the planar Gauss heat source and the temperature selection judgment mechanism, the numerical model built in this paper was used to simulate the melting and solidification process and geometry of the AlSiTiNi coatings during the laser cladding process. The predicted geometry of the cladding coatings basically agrees with the experimental observations.
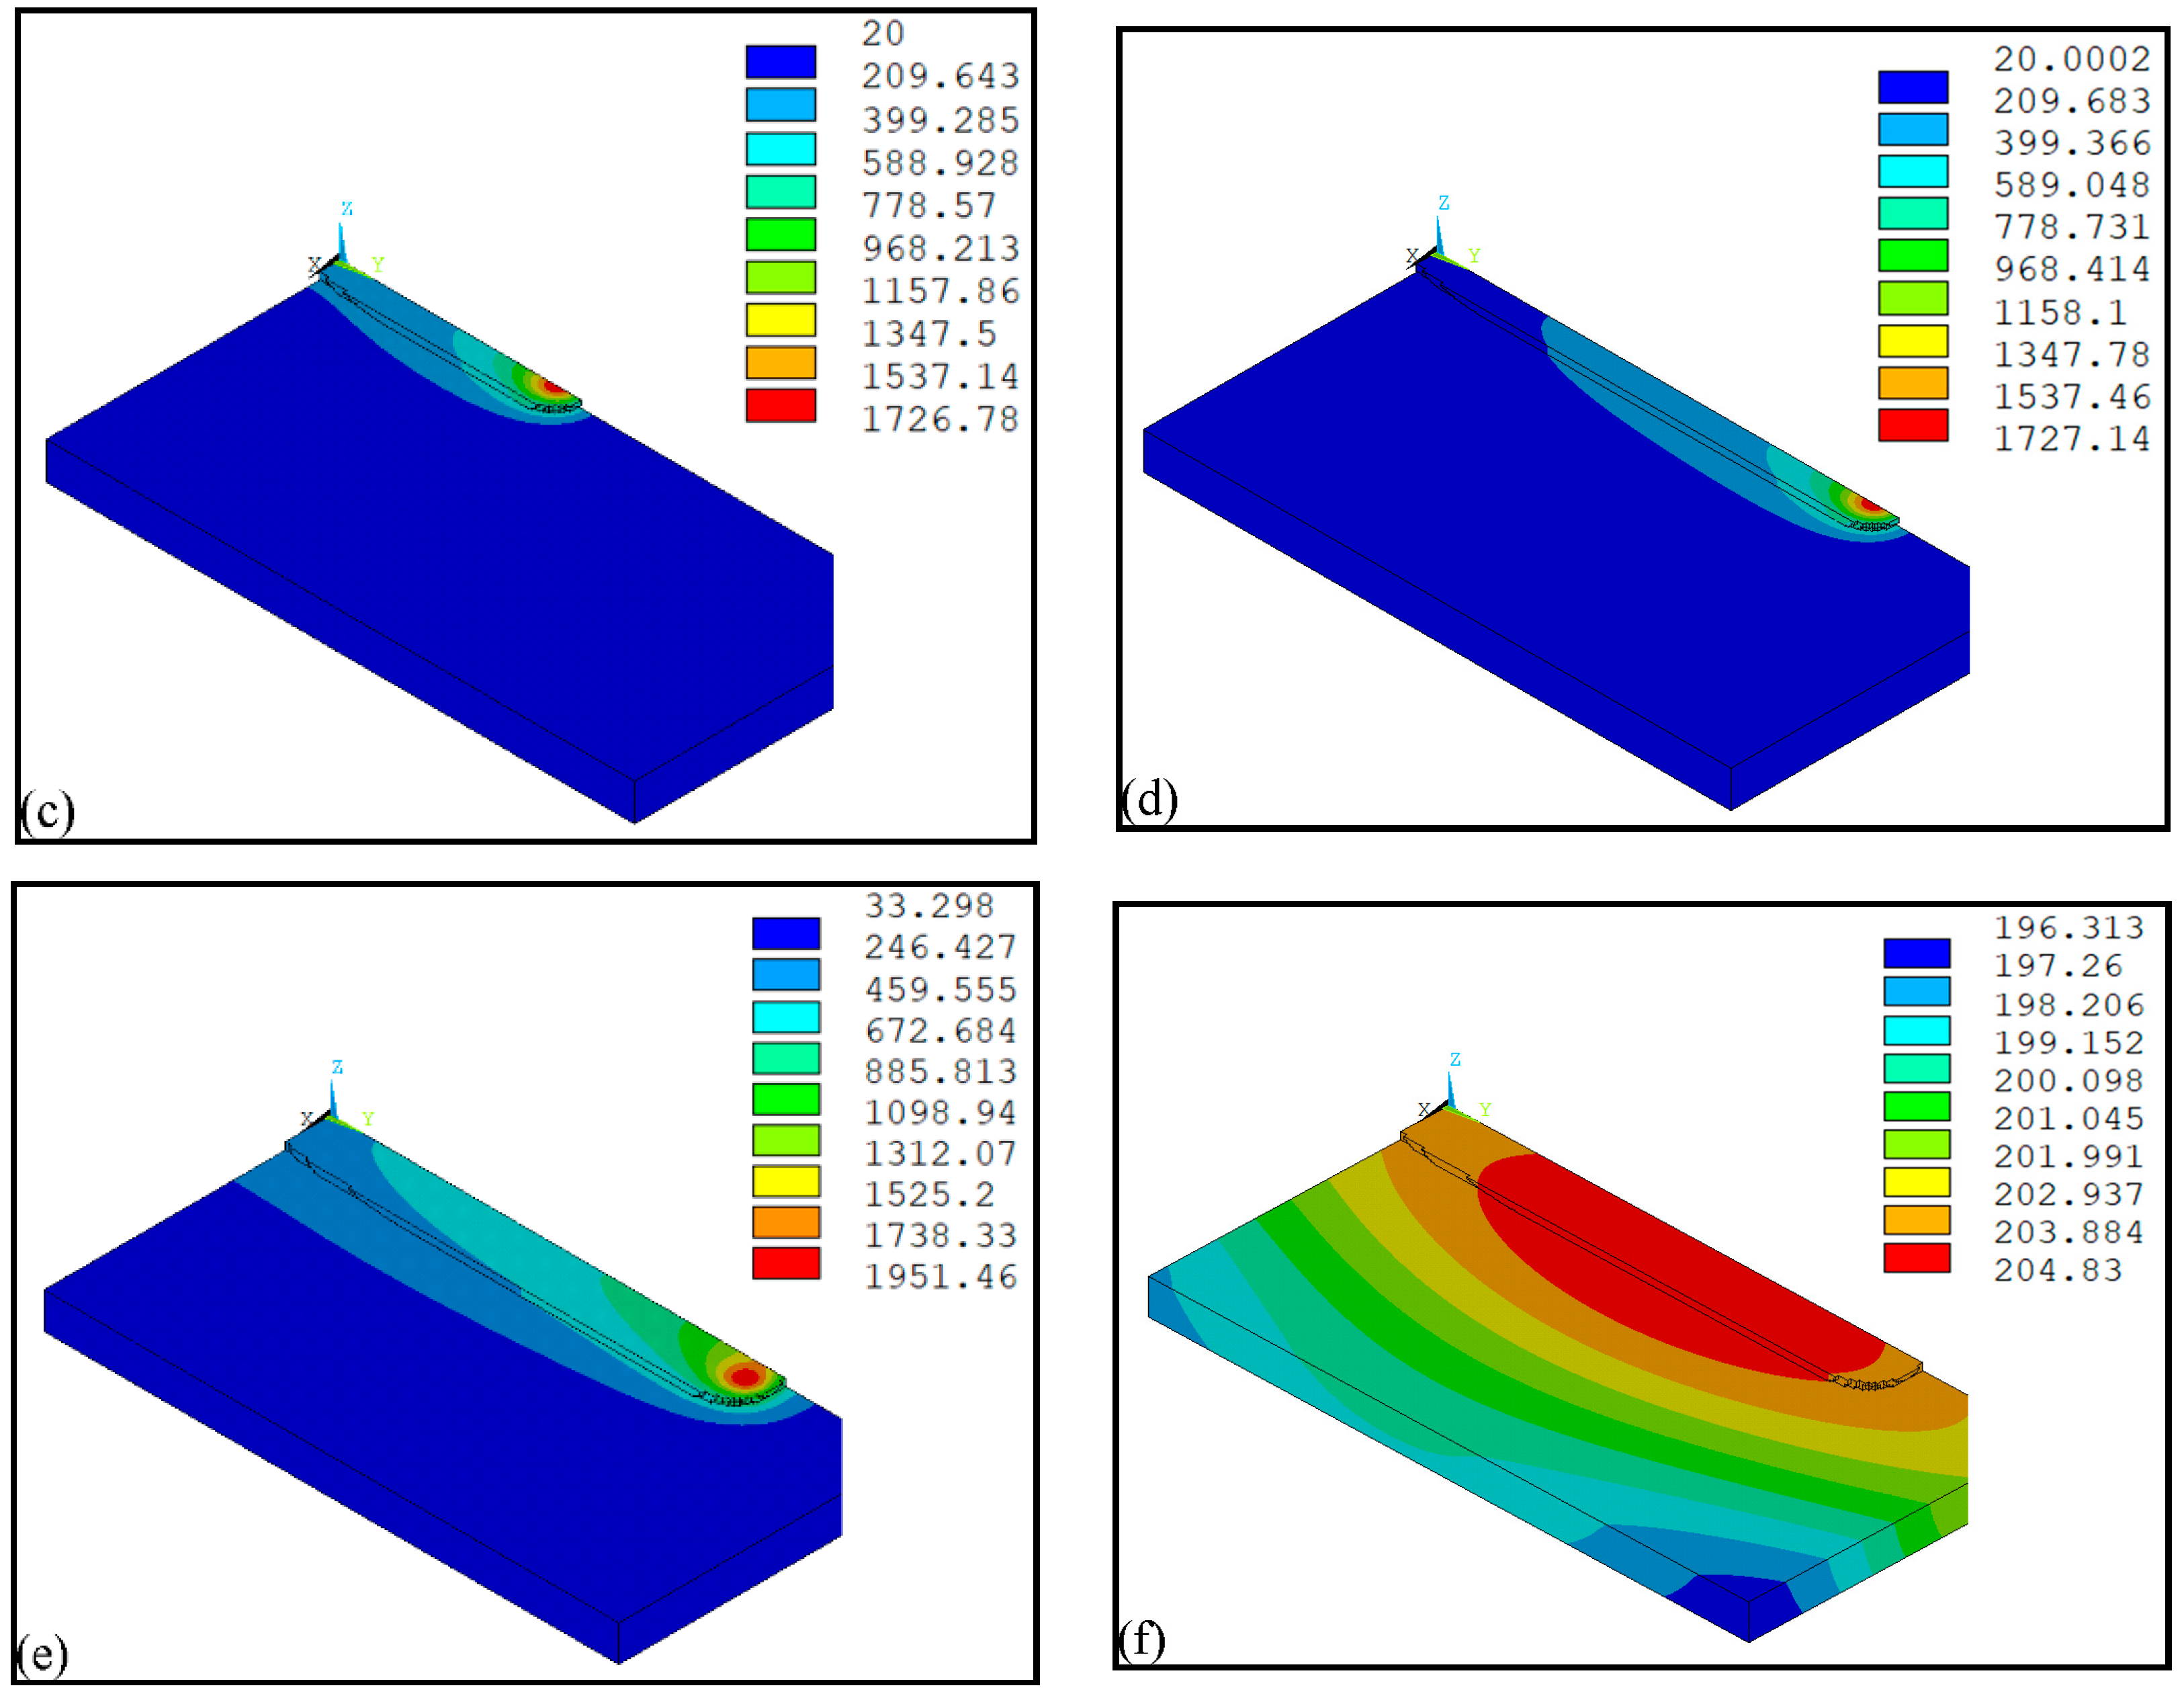
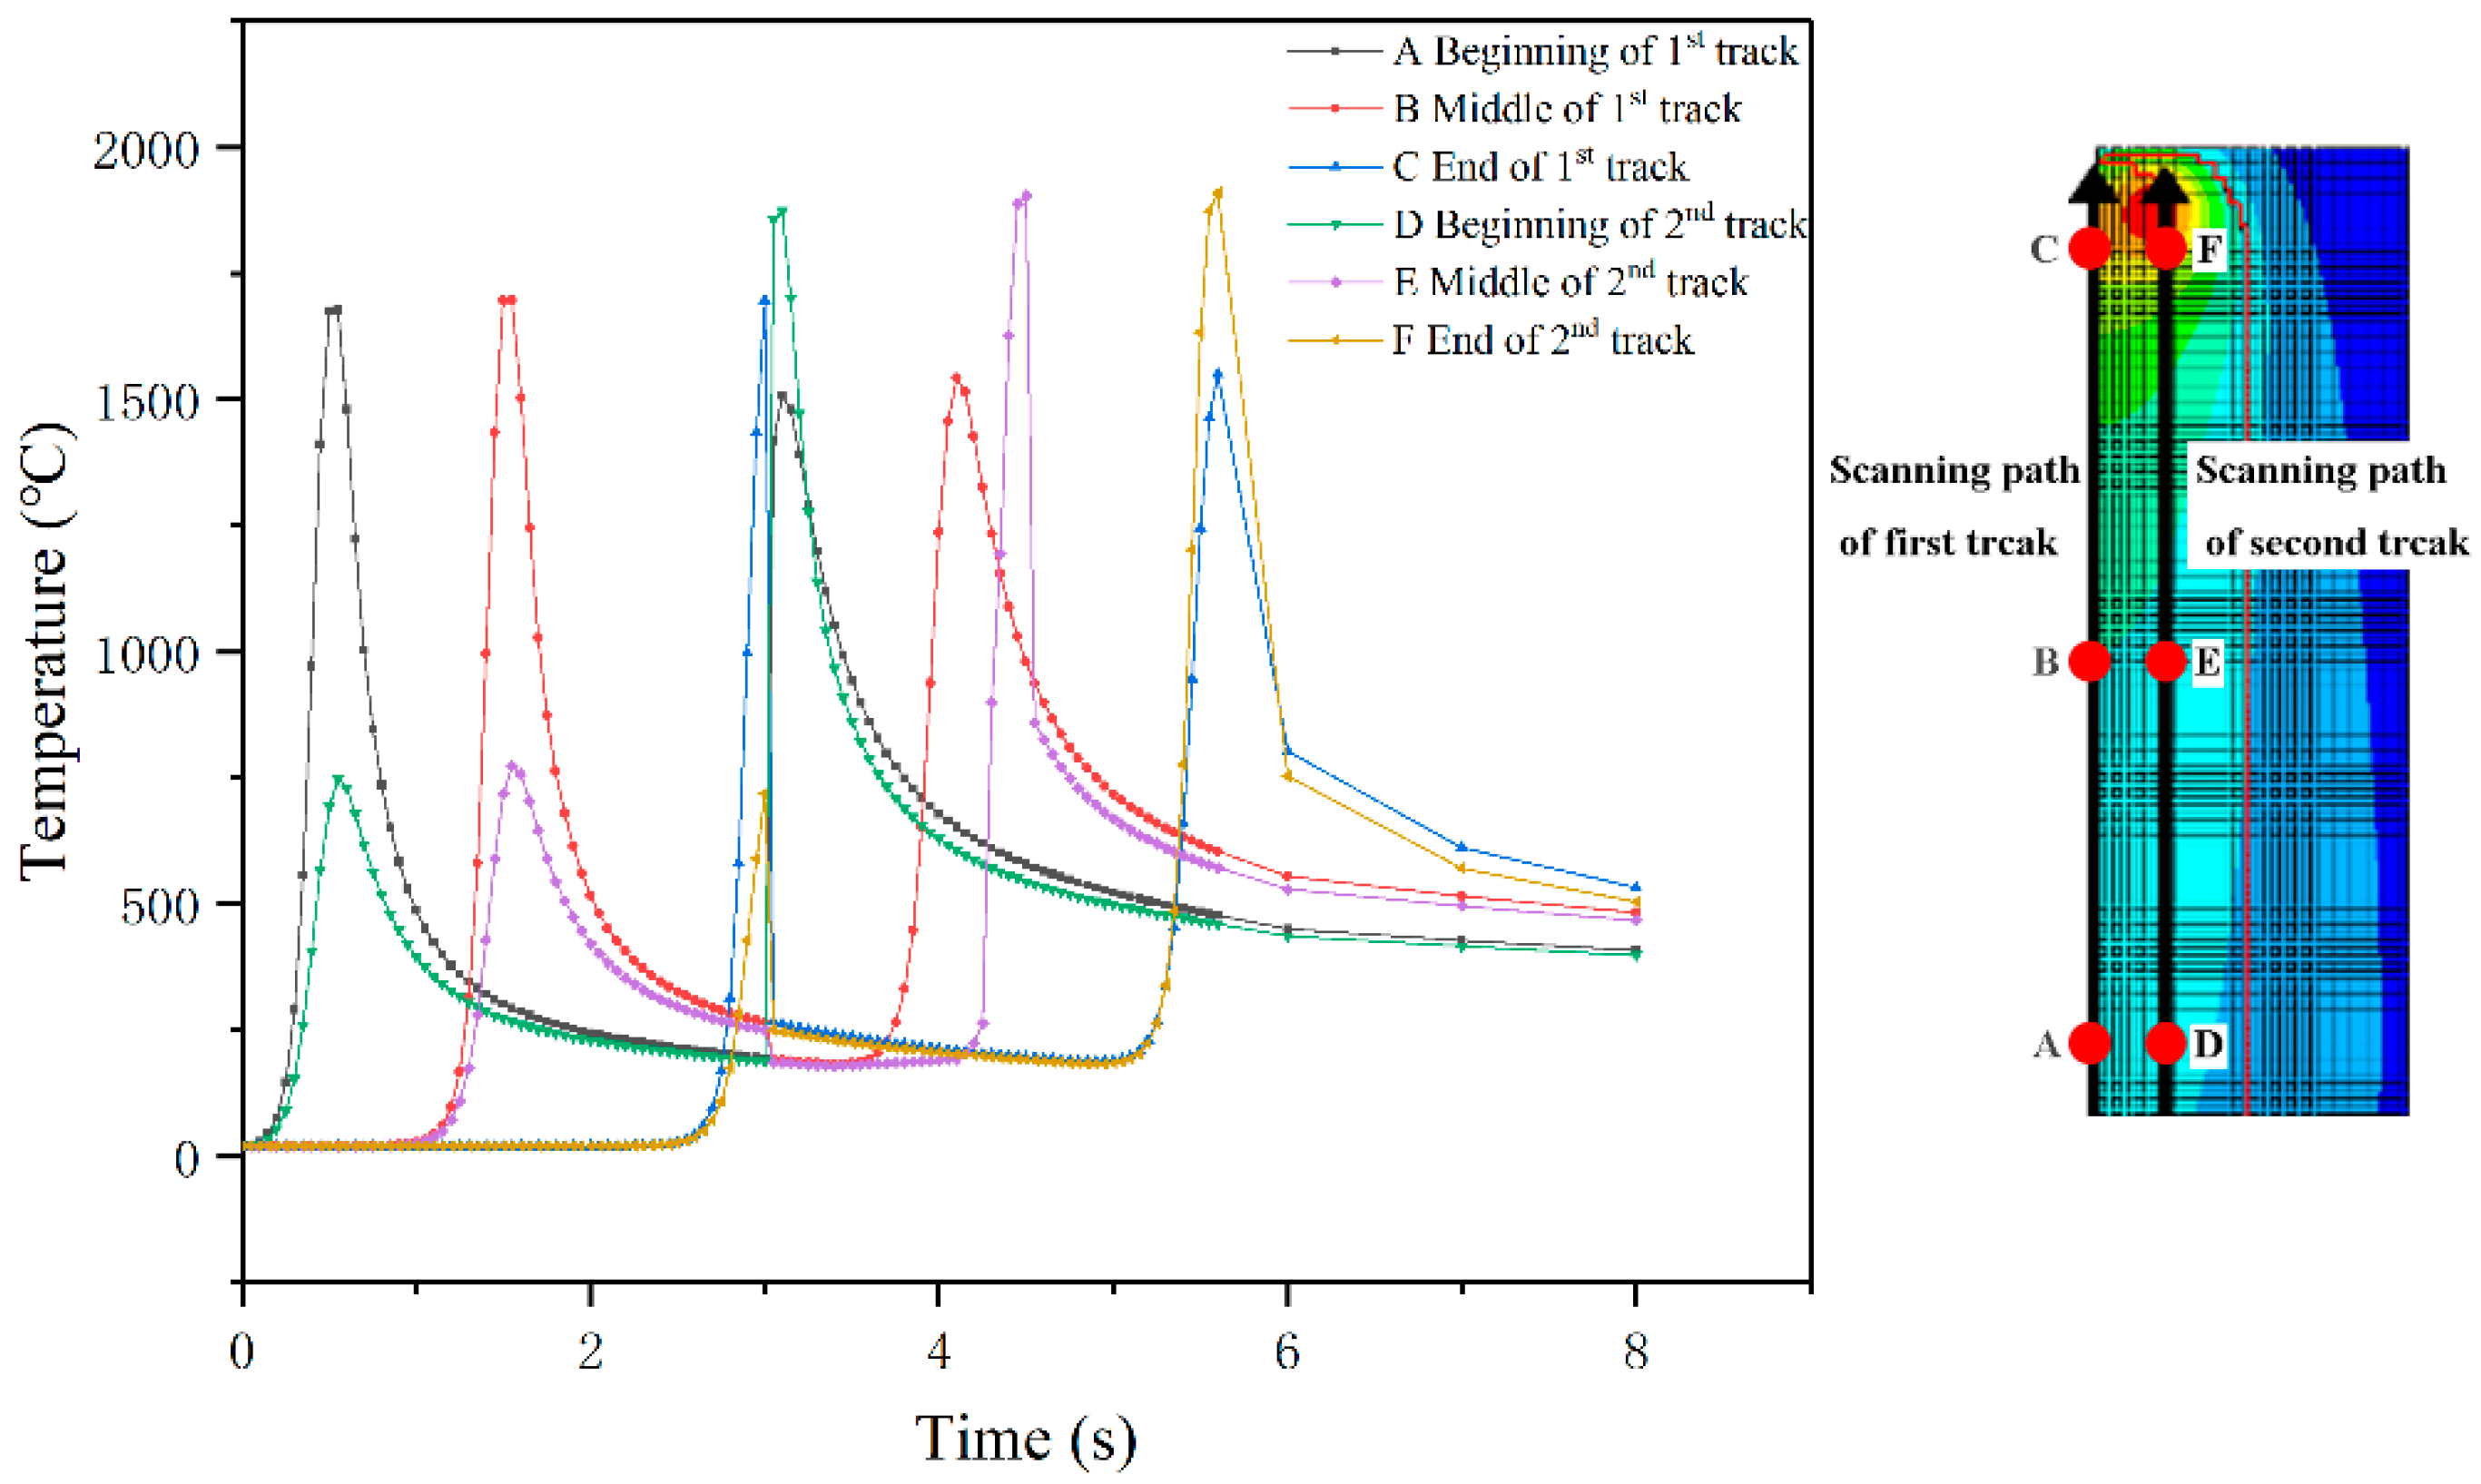
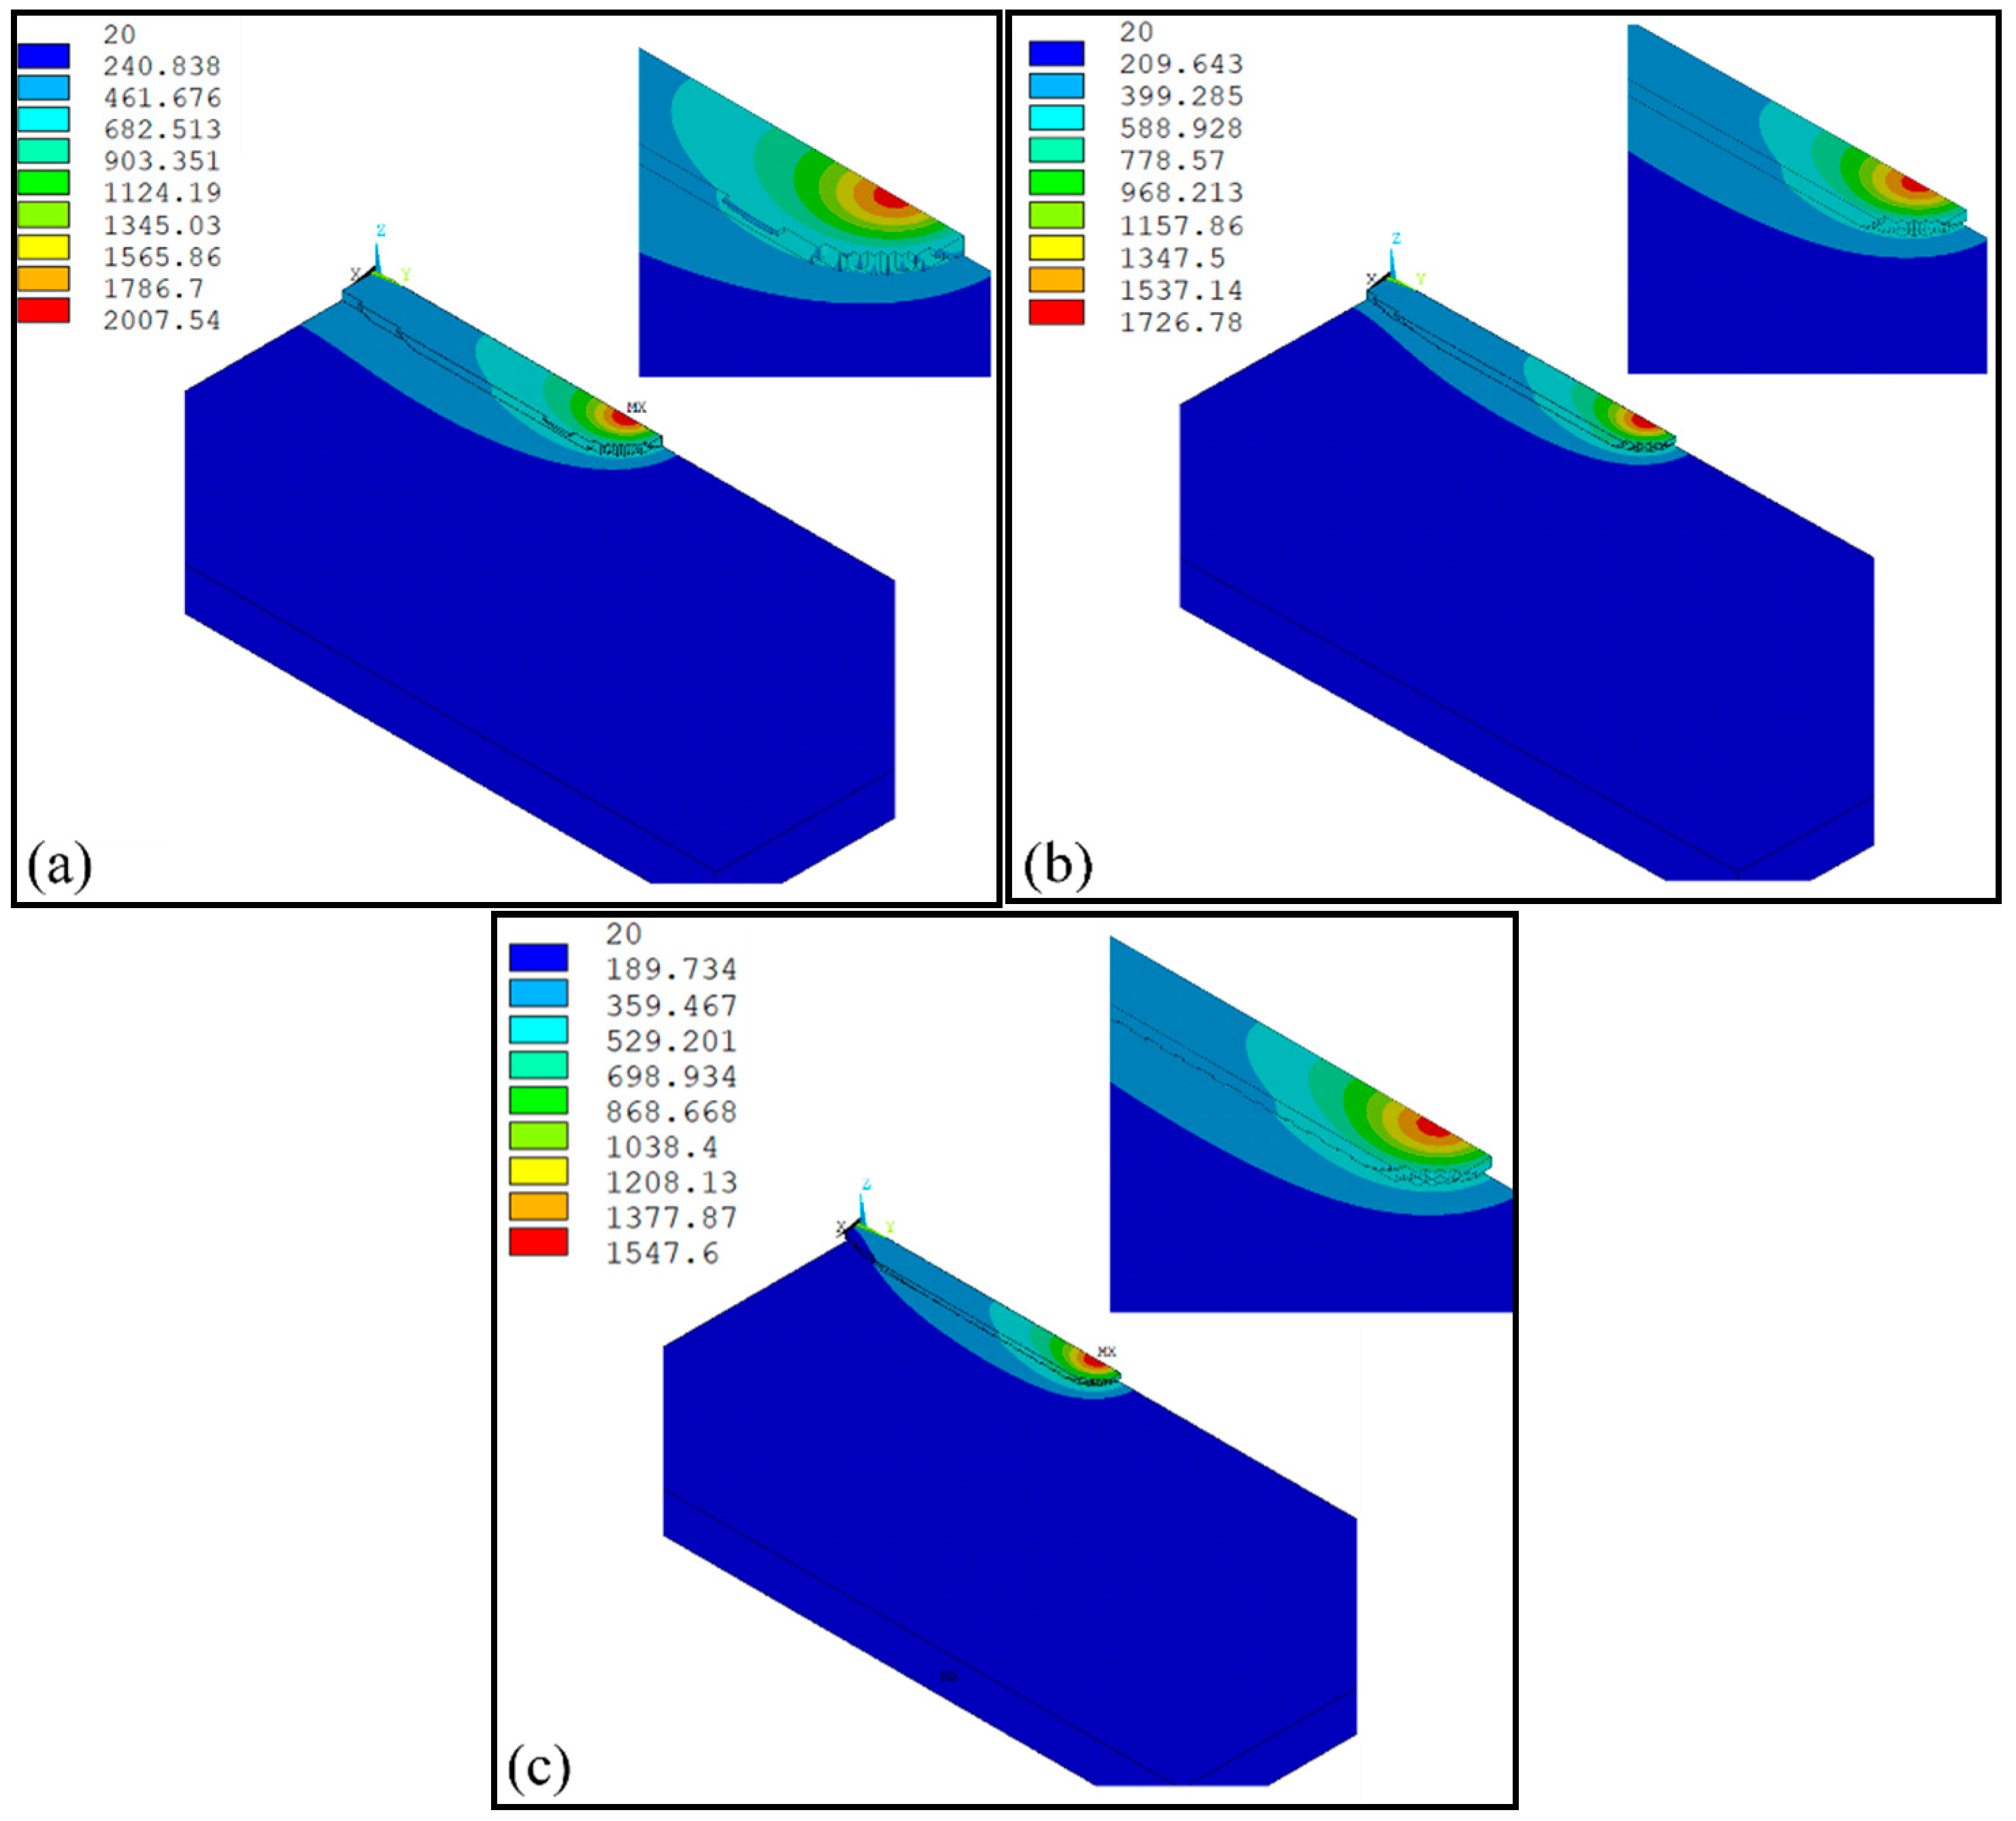
  • The temperature evolution of both single-track and multi-track cladding was simulated using this model. The simulation results show that there is a 0.4 mm variation in width between the front and rear of the cladding coatings. For the multi-track cladding, a 0.2 mm increase in the width of the second track was observed compared with the previous track.
  • The differences between the initial boundary conditions of the first and second cladding tracks were considered using the temperature selection judgment mechanism. During the laser cladding process, the temperature distribution of the remelting zone of the multi-track cladding was found to be asymmetric.
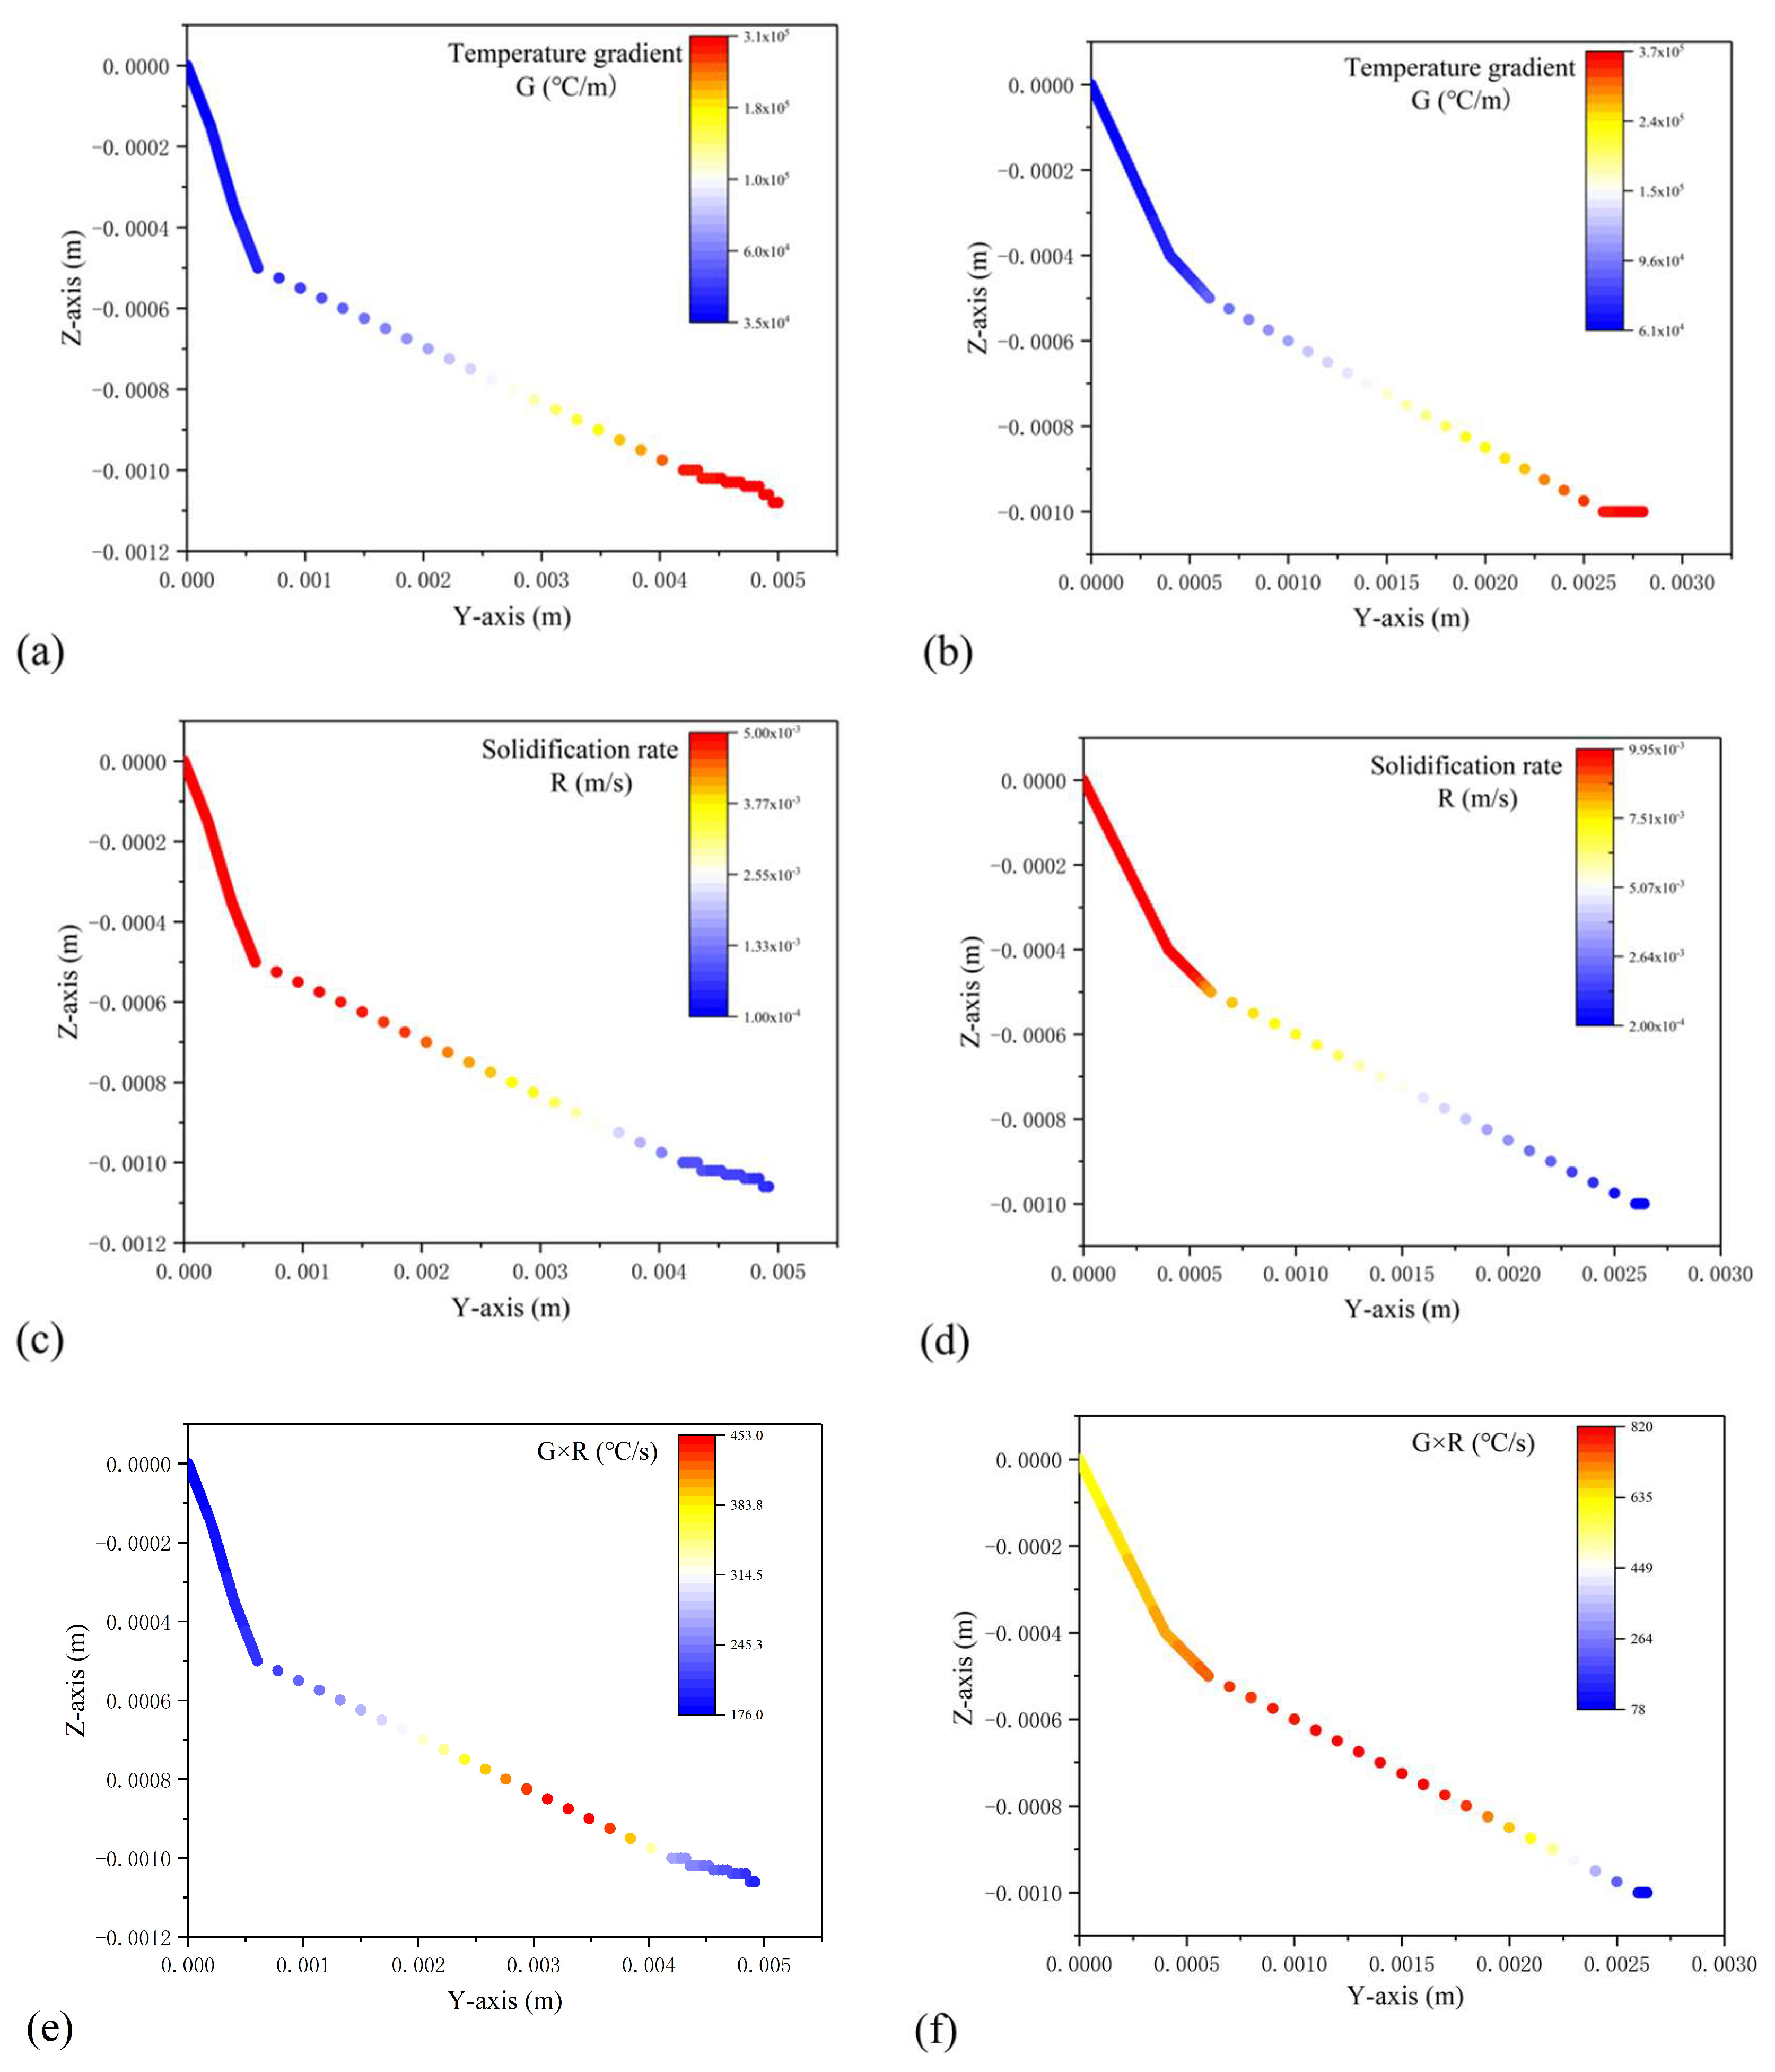
  • The maximum temperature gradient G was found at the bottom of the molten pool, while the minimum value was located at the surface of the cladding coating. The maximum solidification rate R was found at the surface of the cladding coating, and the minimum value was located at the bottom of the molten pool. Both G and R were found to increase as the scanning speed increased.

Author Contributions

Conceptualization, C.L. (Chonggui Li); Data curation, C.L. (Chonggui Li), C.L. (Chuanming Liu), and S.L.; Formal analysis, C.L. (Chuanming Liu); Funding acquisition, C.L. (Chonggui Li); Investigation, C.L. (Chonggui Li), S.L., M.Z., F.W., J.W., and Y.G.; Methodology, C.L. (Chonggui Li), C.L. (Chuanming Liu), and Z.Z.; Supervision, C.L. (Chonggui Li); Writing—original draft, C.L. (Chuanming Liu); Writing—review & editing, C.L. (Chonggui Li).

Funding

This work was funded by the National Natural Science Foundation of China (No. 51402189) and the Shanghai Local Universities Capacity Building Project of Science and Technology Innovation Action Program (No. 16030501100).

Acknowledgments

The authors would like to thank Qunsen Zhang and Shuai Sun from Shanghai University of Engineering Science for helpful discussions.

Conflicts of Interest

The authors declare no conflicts of interest.

References

  1. Liverani, E.; Toschi, S.; Ceschini, L.; Fortunato, A. Effect of selective laser melting (SLM) process parameters on microstructure and mechanical properties of 316L austenitic stainless steel. J. Mater. Process. Technol. 2017, 249, 255–263. [Google Scholar] [CrossRef]
  2. Wang, Y.; Liu, B.; Guo, Z. Wear resistance of machine tools’ bionic linear rolling guides by laser cladding. Opt. Laser Technol. 2017, 91, 55–62. [Google Scholar] [CrossRef]
  3. Ma, M.; Wang, Z.; Zeng, X. A comparison on metallurgical behaviors of 316L stainless steel by selective laser melting and laser cladding deposition. Mater. Sci. Eng. A-Struct. 2017, 685, 265–273. [Google Scholar] [CrossRef]
  4. Ma, Q.; Li, Y.; Wang, J. Effects of Ti addition on microstructure homogenization and wear resistance of wide-band laser clad Ni60/WC composite coatings. Int. J. Refract. Met. Hard Mater. 2017, 64, 225–233. [Google Scholar] [CrossRef]
  5. Huebner, J.; Kata, D.; Kusiński, J.; Rutkowski, P.; Lisa, J. Microstructure of laser cladded carbide reinforced Inconel 625 alloy for turbine blade application. Ceram. Int. 2017, 43, 8677–8684. [Google Scholar] [CrossRef]
  6. Zhai, L.; Ban, C.; Zhang, J. Microstructure, microhardness and corrosion resistance of NiCrBSi coatings under electromagnetic field auxiliary laser cladding. Surf. Coat. Technol. 2019, 358, 531–538. [Google Scholar] [CrossRef]
  7. Heer, B.; Bandyopadhyay, A. Silica coated titanium using laser engineered net shaping for enhanced wear resistance. Addit. Manuf. 2018, 23, 303–311. [Google Scholar] [CrossRef]
  8. Farahmand, P.; Kovacevic, R. Corrosion and wear behavior of laser cladded Ni–WC coatings. Surf. Coat. Technol. 2015, 276, 121–135. [Google Scholar] [CrossRef]
  9. Lv, Y.; Li, J.; Tao, Y.; Hu, L. High-temperature wear and oxidation behaviors of TiNi/Ti2Ni matrix composite coatings with TaC addition prepared on Ti6Al4V by laser cladding. Appl. Surf. Sci. 2017, 402, 478–494. [Google Scholar] [CrossRef]
  10. Wang, C.; Gao, Y.; Zeng, Z.; Fu, Y. Effect of rare-earth on friction and wear properties of laser cladding Ni-based coatings on 6063Al. J. Alloy. Compd. 2017, 727, 278–285. [Google Scholar] [CrossRef]
  11. Tseng, W.C.; Aoh, J.N. Simulation study on laser cladding on preplaced powder layer with a tailored laser heat source. Opt. Laser. Technol. 2013, 48, 141–152. [Google Scholar] [CrossRef]
  12. Gecu, R.; Yurekturk, Y.; Tekoglu, E.; Muhaffel, F.; Karaaslan, A. Improving wear resistance of 304 stainless steel reinforced AA7075 aluminum matrix composite by micro-arc oxidation. Surf. Coat. Technol. 2019, 368, 15–24. [Google Scholar] [CrossRef]
  13. Riveiro, A.; Mejías, A.; Lusquiños, F.; Val, J.D.; Comesaña, R.; Pardo, J.; Pou, J. Laser cladding of aluminium on AISI 304 stainless steel with high-power diode lasers. Surf. Coat. Technol. 2014, 253, 214–220. [Google Scholar] [CrossRef]
  14. Li, S.; Li, C.; Deng, P.; Zhang, Y.; Zhang, Q.; Sun, S.; Yan, H.; Ma, P.; Wang, Y. Microstructure and properties of laser-cladded bimodal composite coatings derived by composition design. J. Alloy. Compd. 2018, 745, 483–489. [Google Scholar] [CrossRef]
  15. Liu, S.; Zhu, H.; Peng, G.; Yin, J.; Zeng, X. Microstructure prediction of selective laser melting AlSi10Mg using finite element analysis. Mater. Des. 2018, 142, 319–328. [Google Scholar] [CrossRef]
  16. Fu, Y.; Hu, J.; Huo, W.; Cao, X.; Zhang, R.; Zhao, W. Characterization of high-current pulsed electron beam interaction with AISI 1045 Steel and the microstructure evolution. Procedia CIRP 2018, 68, 196–199. [Google Scholar] [CrossRef]
  17. Zhang, N.; Liu, W.; Deng, D.; Tang, Z.; Liu, X.; Yan, Z.; Zhang, H. Effect of electric-magnetic compound field on the pore distribution in laser cladding process. Opt. Laser Technol. 2018, 108, 247–254. [Google Scholar] [CrossRef]
  18. He, X.; Song, R.; Kong, D. Effects of TiC on the microstructure and properties of TiC/TiAl composite coating prepared by laser cladding. Opt. Laser Technol. 2019, 112, 339–348. [Google Scholar] [CrossRef]
  19. Ren, K.; Chew, Y.; Zhang, Y.; Bi, G.; Fuh, J.Y.H. Thermal analyses for optimal scanning pattern evaluation in laser aided additive manufacturing. J. Mater. Process. Technol. 2019, 271, 178–188. [Google Scholar] [CrossRef]
  20. Li, Y.; Dong, S.; Yan, S.; Liu, X.; Li, E.; He, P.; Xu, B. Elimination of voids by laser remelting during laser cladding Ni based alloy on gray cast iron. Opt. Laser Technol. 2019, 112, 30–38. [Google Scholar] [CrossRef]
  21. Weingarten, C.; Buchbinder, D.; Pirch, N.; Meiners, W.; Wissenbach, K.; Poprawe, R. Formation and reduction of hydrogen porosity during selective laser melting of AlSi10Mg. J. Mater. Process. Technol. 2015, 221, 112–120. [Google Scholar] [CrossRef]
  22. Li, R.; Jin, Y.; Li, Z.; Zhu, Y.; Wu, M. Effect of the remelting scanning speed on the amorphous forming ability of Ni-based alloy using laser cladding plus a laser remelting process. Surf. Coat. Technol. 2014, 259, 725–731. [Google Scholar] [CrossRef]
  23. Liu, H.; Li, M.; Qin, X.; Huang, S.; Hong, F. Numerical simulation and experimental analysis of wide-beam laser cladding. Int. J. Adv. Manuf. Technol. 2019, 100, 237–249. [Google Scholar] [CrossRef]
  24. Chen, T.; Wu, W.; Li, W.; Liu, D. Laser cladding of nanoparticle TiC ceramic powder: Effects of process parameters on the quality characteristics of the coatings and its prediction model. Opt. Laser Technol. 2019, 116, 345–355. [Google Scholar] [CrossRef]
  25. Du, L.; Gu, D.; Dai, D.; Shi, Q.; Ma, C.; Xia, M. Relation of thermal behavior and microstructure evolution during multi-track laser melting deposition of Ni-based material. Opt. Laser Technol. 2018, 108, 207–217. [Google Scholar] [CrossRef]
  26. Chen, Y.; Guo, Y.; Xu, M.; Ma, C.; Zhang, Q.; Wang, L.; Yao, J.; Li, Z. Study on the element segregation and Laves phase formation in the laser metal deposited IN718 superalloy by flat top laser and gaussian distribution laser. Mater. Sci. Eng. A-Struct. 2014, 759, 339–347. [Google Scholar] [CrossRef]
  27. Hofman, J.T.; Lange, D.F.; Pathiraj, B.; Meijer, J. FEM modeling and experimental verification for dilution control in laser cladding. J. Mater. Process. Technol. 2011, 211, 187–196. [Google Scholar] [CrossRef]
  28. Hao, M.; Sun, Y. A FEM model for simulating temperature field in coaxial laser cladding of Ti6Al4V alloy using an inverse modeling approach. Int. J. Heat Mass Transf. 2013, 64, 352–360. [Google Scholar] [CrossRef]
  29. Parekh, R.; Buddu, R.K.; Patel, R.I. Multiphysics simulation of laser cladding process to study the effect of process parameters on clad geometry. Procedia Technol. 2016, 23, 529–536. [Google Scholar] [CrossRef]
  30. Suárez, A.; Amado, J.M.; Tobar, M.J.; Yáñez, A.; Fraga, E.; Peel, M.J. Study of residual stresses generated inside laser cladded plates using FEM and diffraction of synchrotron radiation. Surf. Coat. Technol. 2010, 204, 1983–1988. [Google Scholar] [CrossRef]
  31. Gedda, H.; Kaplan, A.; Powell, J. Melt-solid interactions in laser cladding and laser casting. Metall. Mater. Trans. B 2005, 36, 683–689. [Google Scholar] [CrossRef]
  32. Contuzzi, N.; Campanelli, S.L.; Ludovico, A.D. 3D finite element analysis in the selective laser melting process. Int. J. Simul. Model. 2011, 3, 113–121. [Google Scholar] [CrossRef]
  33. Gusarov, A.V.; Laoui, T.; Froyen, L.; Titov, V.I. Contact thermal conductivity of a powder bed in selective laser sintering. Int. J. Heat Mass Transf. 2003, 46, 1103–1109. [Google Scholar] [CrossRef]
  34. Velaga, S.K.; Ravisankar, A. Finite element based parametric study on the characterization of weld process moving heat source parameters in austenitic stainless steel. Int. J. Press. Vessel. Pip. 2017, 157, 63–73. [Google Scholar] [CrossRef]
  35. Li, C.; Li, S.; Liu, C.; Zhang, Y.; Deng, P.; Guo, Y.; Wang, J.; Wang, Y. Effect of WC addition on microstructure and tribological properties of bimodal aluminum composite coatings fabricated by laser surface alloying. Mater. Chem. Phys. 2019, 234, 9–15. [Google Scholar] [CrossRef]
  36. Goldak, J.; Chakravarti, A.; Bibby, M. A new finite element model for welding heat sources. Metall. Mater. Trans. B 1984, 15, 299–305. [Google Scholar] [CrossRef]
  37. Amine, T.; Newkirk, J.W.; Liou, F. Numerical simulation of the thermal history multiple laser deposited layers. Int. J. Adv. Manuf. Technol. 2014, 73, 1625–1631. [Google Scholar] [CrossRef]
  38. Zhang, Z.; Farahmand, P.; Kovacevic, R. Laser cladding of 420 stainless steel with molybdenum on mild steel A36 by a high power direct diode laser. Mater. Des. 2016, 109, 686–699. [Google Scholar] [CrossRef] [Green Version]
Figure 1. Material properties of the AlSiTiNi in the powder state and in the solid state: (a) density; (b) thermal conductivity; and (c) specific heat.
Coatings 09 00391 g001aCoatings 09 00391 g001b
Figure 2. Material properties of the 304 stainless steel: (a) density; (b) thermal conductivity; and (c) specific heat.
Coatings 09 00391 g002
Figure 3. Laser processing system for laser cladding: (a) experimental equipment; (b) schematic illustration of the laser cladding process.
Coatings 09 00391 g003
Figure 4. Schematic illustration of the planar Gauss heat source model.
Coatings 09 00391 g004
Figure 5. The mesh of the finite element (FE) model: (a) overall view of the model; (b) cross-sectional view of the model.
Coatings 09 00391 g005
Figure 6. A schematic illustration of the laser cladding process: (a) initial stage of laser cladding; (b) the molten pool formation and temperature transfer stage; (c) the molten pool solidification and coating formation stage; and (d) the laser cladding process in the numerical simulation.
Coatings 09 00391 g006aCoatings 09 00391 g006b
Figure 7. The temperature distribution of the laser overlapping process at a laser power of 1500 W and a scanning speed of 0.01 m/s: (a) 0 s; (b) 0.1 s; (c) 1.5 s; (d) 3 s; (e) 6 s; and (f) 56 s.
Coatings 09 00391 g007aCoatings 09 00391 g007b
Figure 8. Time-history temperature curves of the multi-track laser cladding process at a laser power of 1500 W and a scanning speed of 0.01 m/s.
Coatings 09 00391 g008
Figure 9. Diagram of the change in width of the cladding layer during the multi-track laser cladding process: (a) the overall morphology of multi-track laser cladding; (b) the rear of the first cladding layer; (c) the front of the first cladding layer; (d) the rear of the second cladding layer; and (e) the front of the second cladding layer.
Coatings 09 00391 g009
Figure 10. The temperature field distribution of single-track laser cladding at a laser power of 1500 W: (a) 0.005 m/s, 3 s; (b) 0.01 m/s, 1.5 s; and (c) 0.015 m/s, 1 s.
Coatings 09 00391 g010
Figure 11. The surface temperature monitoring point of the molten pool at different scanning speeds: (a) 0.005 m/s, 1500 W, 3 s; (b) 0.01 m/s, 1500 W, 1.5 s; (c) 0.015 m/s, 1500 W, 1 s; and (d) the experimental result.
Coatings 09 00391 g011
Figure 12. Time-history temperature curves of the monitoring point in the width direction of the molten pool: (a) 0.005 m/s, 1500 W, 6 s; (b) 0.01 m/s, 1500 W, 3 s; and (c) 0.015 m/s, 1500 W, 2 s.
Coatings 09 00391 g012
Figure 13. A comparison of the cross-sections between (a) the simulation result and the location of the monitoring points and (b) the experimental result. Reprinted with permission from [14]; Copyright 2018 Elsevier.
Coatings 09 00391 g013
Figure 14. The time-history curves of the monitoring point in the depth direction of the molten pool: (a) 0.005 m/s, 1500 W; (b) 0.01 m/s, 1500 W.
Coatings 09 00391 g014
Figure 15. A schematic illustration of the molten pool boundary.
Coatings 09 00391 g015
Figure 16. The distribution of G, R, and G/R: (a) G (0.005 m/s); (b) G (0.01 m/s); (c) R (0.005 m/s); (d) R (0.01 m/s); (e) G/R (0.005 m/s); and (f) G/R (0.01 m/s).
Coatings 09 00391 g016
Table 1. Chemical composition of the AlSiTiNi powders.
MaterialElement (wt %)
AlSiTiNi
AlSiTiNi60201010
Table 2. Chemical composition of the 304 stainless steel.
MaterialElement (wt %)
CSiMnCrNiSPFe
304 stainless steel≤0.08≤1.00≤2.0018–208–10≤0.03≤0.045Balance
Table 3. Experimental parameters of laser cladding.
Sample NumberLaser Power (W)Scanning Speed (m/s)Laser Spot Diameter (mm)Defocus of Laser Beam (mm)
115000.005340
215000.01340
315000.015340
Table 4. The width of the molten pool provided by the simulation result and the experiment result.
Scanning Speed
(m/s)
Width of Simulation Result
(mm)
Width of Experiment Result
(mm)
0.0054.64.82
0.013.73.93
0.0152.82.42
Table 5. The depth of the molten pool provided by the simulation result and the experiment result.
Scanning Speed (m/s)Simulation Result
(mm)
Experiment Result
(mm)
0.0051.41.35
0.010.751.07

