Article

Effect of Heating Treatment on the Microstructure and Properties of Cr–Mo Duplex-Alloyed Coating Prepared by Double Glow Plasma Surface Alloying

1
College of Material Science and Engineering, Chongqing University of Technology, Chongqing 400054, China
2
Chongqing Municipal Key Laboratory of Institutions of Higher Education for Mould Technology, Chongqing 400054, China
3
School of Material Science and Energy, Southwest University, Chongqing 400715, China
*
Authors to whom correspondence should be addressed.
Coatings 2019, 9(5), 336; https://doi.org/10.3390/coatings9050336
Submission received: 18 May 2019 / Revised: 23 May 2019 / Accepted: 23 May 2019 / Published: 25 May 2019

Abstract

:
In this study, Cr–Mo duplex-alloyed coating was prepared on carbon steel by double glow plasma surface alloying (DGPSA). The effect of annealing and quenching and tempering (Q&T) treatments on the microstructure and performance of the coating was investigated by X-ray diffraction (XRD), energy dispersive spectrometry (EDS), backscattering electron imaging (BSEI) and electron backscattering diffraction (EBSD) techniques. The results show that a gradient structured coating composed of an Fe–Cr–Mo solid solution (Fe–Cr–Mo SS) layer and an alloyed pearlite layer was obtained on the steel surface. The affected layer was adjacent to the coating. After annealing or Q&T, more carbides precipitated in the Fe–Cr–Mo SS layer and alloyed pearlite layer. Most of the C atoms in the subsurface were dragged into the coating to form carbides in the Fe–Cr–Mo SS and alloyed pearlite layers of the coating, transforming the affected layers into a carbon-poor zone. Annealing and Q&T hardly modified the thickness of the coating, but greatly changed the hardness and corrosion resistance of the coating. The Q&T treated samples had higher hardness and better corrosion resistance than the as-DGPSA treated and the annealed samples.

Graphical Abstract

1. Introduction

AISI 5140 steel is widely used as gear and bearing material due to its excellent comprehensive properties (good strength and toughness) [1]. However, in most cases, its hardness and corrosion resistance cannot meet the requirements of gears [2,3]. Surface strengthening methods such as carburizing [4,5], nitriding [6,7], and carbonitriding [8,9] are commonly used to improve the performance of the steel surface. Additionally, traditional surface strengthening techniques can only improve single performance, i.e., hardness. In the face of complex service environments, traditional surface strengthening techniques have been unable to meet the requirements of gears. Therefore, the development of new surface strengthening technology and innovative materials will become key to the application of lightweight, high load, high-temperature and low-temperature gears.
Double glow plasma surface alloying (DGPSA) is a relatively new surface strengthening technology used mainly to prepare various metal alloying layers [10,11,12]. The ions operating under abnormal glow discharge conditions are accelerated by an electric field, producing a strong bombardment effect on the cathode and target. This ion bombardment causes sputtering of the target, and the sputtered alloy atoms move toward the surface of the workpiece under the action of the electric field, magnetic field, and gravity, resulting in the formation of coatings. Moreover, DGPSA is carried out at high temperatures, and the atoms between the coating and matrix diffuse mutually, resulting in metallurgical bonding between the coating and the substrate and thereby improving the adhesion of the coating [10]. Compared with thermal spraying, magnetron sputtering, chemical vapor deposition (CVD), and physical vapor deposition (PVD), DGPSA has the advantages of controllable thickness, strong bonding force, and few defects such as voids and cracks [12,13,14].
Cr and Mo are two important strengthening elements of steels. Cr can improve the corrosion resistance of steels due to the formation of protective passivation films on the steel surface [15,16,17]. In addition, Cr has a high hardness at room temperature and Cr coating can significantly improve the surface hardness of carbon steels [16,18]. Mo also has high hardness and good wear resistance in addition to its high melting point [19]. Ren et al. [20] have successfully prepared Cr–Mo coating on the Ti6Al4V alloy by DGPSA, and found that Mo–Cr duplex alloying can dramatically improve the tribological properties of the titanium alloys. Multi-element surface alloyed coatings prepared by DGPSA have been widely reported [11,12,21], but most articles focus on the corrosion resistance and/or tribological behavior of the coatings. There are very few reports on the detailed characterization of the DGPSA treated coatings. In this study, a Cr–Mo duplex-alloyed coating was prepared on AISI 5140 by DGPSA to improve its properties. Not only was the microstructure of the Cr–Mo coating studied but so was the effect of different heat treatments on the microstructure and properties of the coating.

2. Materials and Methods

A commercially available AISI 5140 steel with a chemical composition (wt.%) of 0.40 C, 0.23 Si, 0.7 Mn, 0.8 Cr, 0.03 Ni and Fe in balance was selected as the raw material. The raw material was cut into rectangular specimens with a gauge dimension of 20 × 15 × 3 mm3 for DGPSA treatment (LDMC-10A, Ande Heat Treatment Technology Co., Ltd, Wuhan, China). A commercial Cr–Mo (50 wt.% Cr and 50 wt.% Mo) plate having a size of 55 × 50 × 3 mm3 was selected as the source electrode for supplying alloying elements. Prior to DGPSA treatment, the samples were mechanically polished (800 mesh SiC paper) and then ultrasonically cleaned in absolute ethanol. The processing parameters of the DGPSA treatment in this study are listed in Table 1. The coatings were prepared at 920 °C for 6 h and then naturally cooled to room temperature (denoted as CrMo-6). In addition, some CrMo-6 samples were annealed at 850 °C for 0.5 h and then cooled to room temperature in a vacuum furnace (denoted as CrMo-6-A). Some were quenched at 850 °C and tempered at 580 °C for 1 h and then air cooled to room temperature (marked as CrMo-6-QT).
Electron backscattering diffraction (EBSD, AZtech Max2, Oxford Instruments, London, UK), backscattered electron imaging (BSEI), secondary electron imaging (SEI), and energy dispersive spectrometry (EDS, AZtech Max2, Oxford Instruments, London, UK) equipped in a field emission scanning electron microscope (FE-SEM, Zeiss Sigma HD, Zeiss, Dresden, Germany) were applied to characterize the microstructure and elemental distribution. The X-ray diffraction (XRD) patterns of the samples were obtained by a diffractometer (Empyrean Series 2, PANalytical, Almelo, The Netherlands) with the Cu-Kα radiation at 40 kV. The wavelength of the applied X-ray was 1.540598 Å. The XRD curves of the samples were measured with a step size of 0.01° (2θ) and a counting time of 8 s. Microhardness was measured by a microhardness tester (HVS-1000Z, Shanghai CSOIF Co., Ltd, Shanghai, China) with a load of 2 N and loading time of 10 s. Prior to microstructure and microhardness examinations, the samples were polished down to a 3000-grit SiC paper and then electropolished with an electrolyte of perchloric acid (10%) and ethanol (90%) at 30 V and −30 °C. Polarization curve testing was performed on a Gamry instrument (Reference 3000, Warminster, PA, USA) in a 3.5% NaCl aqueous solution. The electrochemical parameters were as follows: the dynamic potential range was −1 to 3.5 V and the scanning speed was 2 mV/s.

3. Results and Discussion

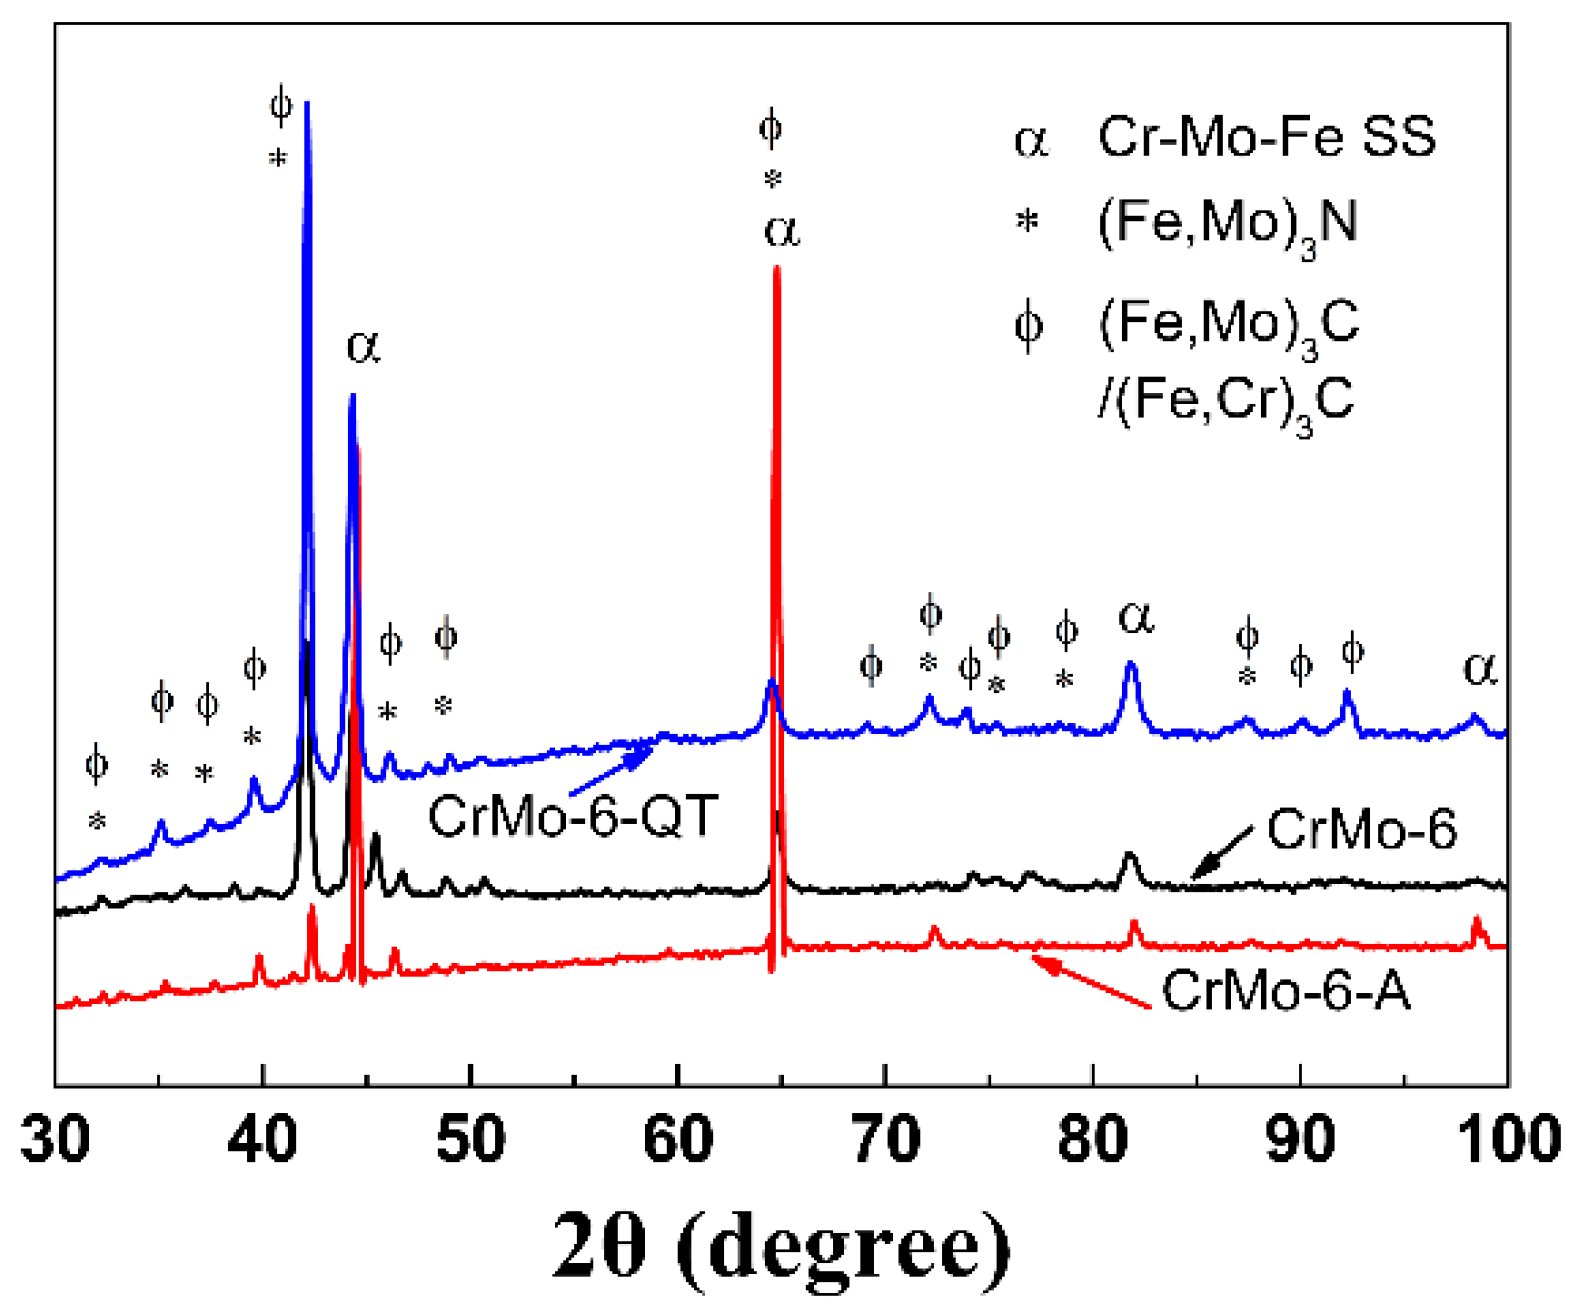
3.1. Phase Composition of the Coating

Figure 1 shows the XRD patterns of the samples before and after different heat treatments. Phases are identified from the XRD patterns using the International Center for Diffraction Data (ICDD) database. After DGPSA treatment, the coatings in the CrMo-6 sample consist mainly of an α-Fe solid solution (Fe–Cr–Mo SS) containing Cr and Mo atoms and a small amount of nitride ((Fe,Mo)3N). The DGPSA chamber is filled with high-purity nitrogen gas. It is easy to generate nitrogen ions under the action of glow discharge. The nitrogen ions then react with the Mo atoms and Fe atoms from the source target and the matrix at high temperature, thereby forming the nitride. After annealing, the coatings consist mainly of Fe–Cr–Mo SS (see CrMo-6-A in Fig. 1), but the intensity of the peak is significantly enhanced owing to the coarsening and preferred orientation of the coating grains during annealing. It is known that the grain growth and formation of crystallographic texture will enhance the XRD peak intensity [22,23]. It is well known that Cr and Mo elements act as medium carbide-forming elements, and carbides are easily formed at high temperature [15,16]. The indexing of carbides is very difficult because of their wide range of stoichiometry and the ICDD database is not sufficient to clearly identify all peaks [24]. Nevertheless, after Q&T, in addition to the two phases of Cr–Mo SS and nitride, the presence of carbide ((Fe,Mo)3C or (Fe,Mo)3C) is also detected in the CrMo-6-QT sample. This is because the Cr and Mo elements are medium carbide-forming elements and easily form carbides at high temperatures [15,16].
Figure 2 shows the cross-sectional views of the microstructure at various scales of the CrMo-6 sample. The gradient microstructure consisting of the coatings, affected layer, and the normal matrix is clearly visible in the depth direction. The coating thickness is measured as about 180 μm. The enlarged view shows that the coatings are composed of a coarse columnar grain and pearlite structure. The EDS line scanning spectrum shows that the outermost layer of the coating has high Fe, Cr, and Mo, and the Fe/Cr/Mo atomic ratio is linear, indicating that the outermost layer is the Fe–Cr–Mo SS layer, as shown in Figure 2f. Irregular pearlites are observed at the bottom of the columnar grains (near the affected layer). It has been reported that strong carbide-forming elements can drag out C atoms from the steel substrate and form into alloyed cementite at high temperatures [16,25]. The EDS line scanning spectrum clearly shows that these regions contain higher Cr and Mo (between the two dashed lines in Figure 2f) than the normal steel matrix. That is, this region is alloyed pearlite composed of a ferrite phase and cementite containing Cr and Mo, as shown in Figure 2c. However, due to the limited depth of X-ray penetration, these alloy cementites are not detected in the XRD pattern. Owing to the diffusion of carbon atoms into the outer layer of the coating to form an alloy cementite, the carbon content of the subsurface of the original steel matrix is significantly reduced, forming the affected layer with a thickness of approx. 52 μm. Compared to the normal matrix with normal pearlite morphology, the affected layer has less cementite distribution and almost no lamellar cementite (see Figure 2d,e).

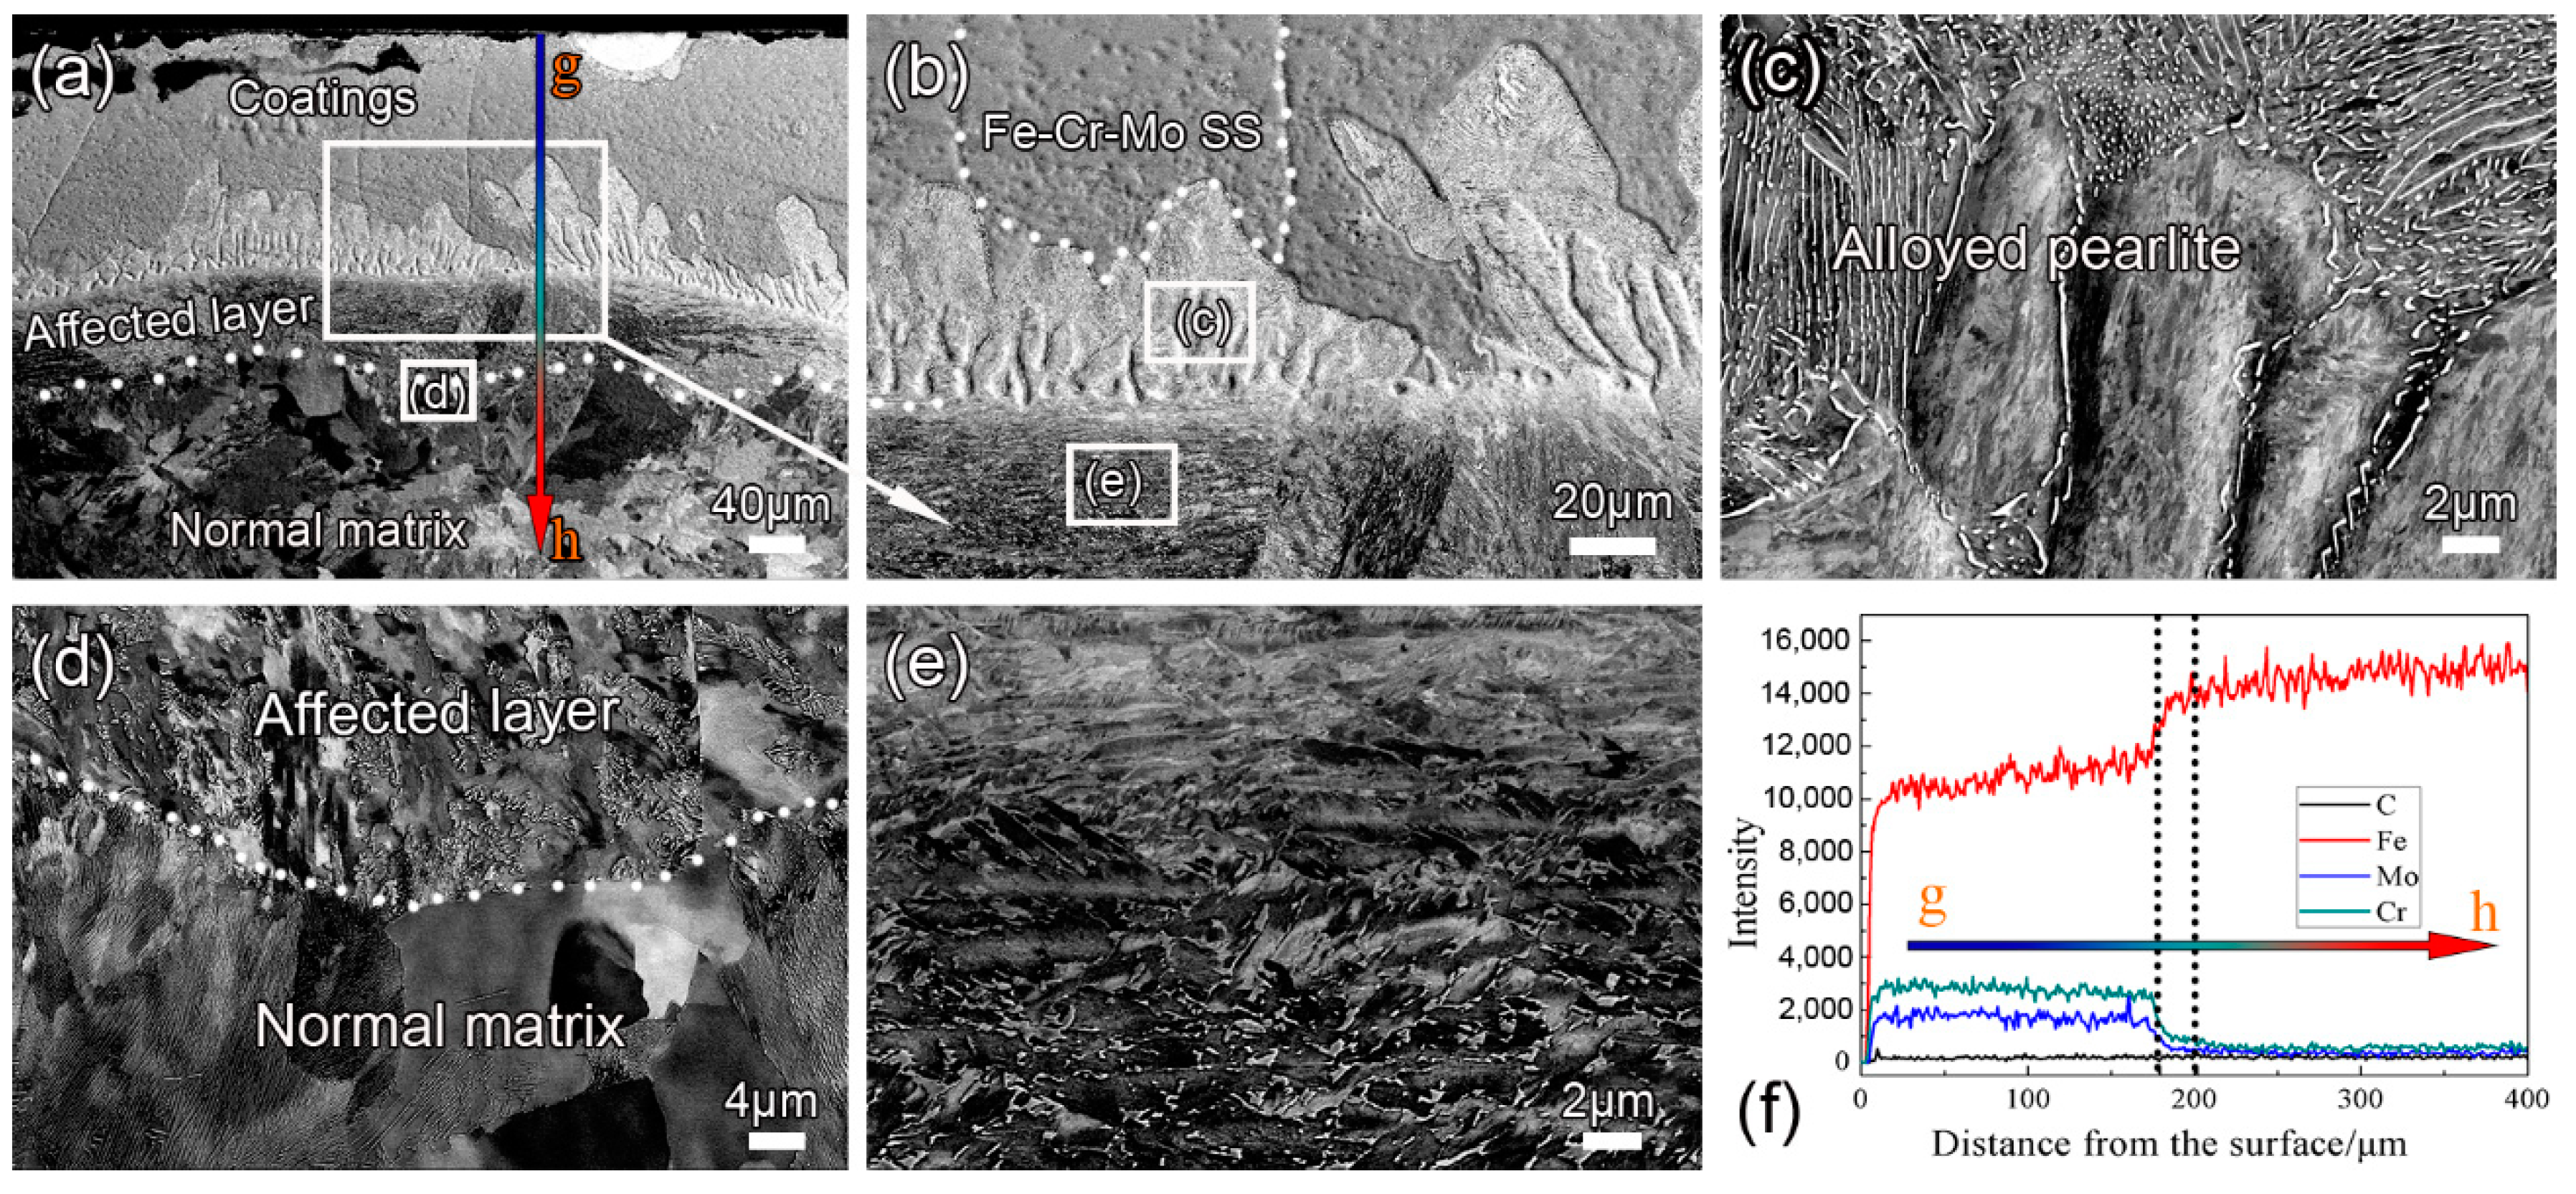
3.2. Effect of Annealing on Coating Microstructure

Traditionally, annealing treatment can eliminate residual thermal stress, reduce microcracks, increase the compactness of the coating, and harden the coating via precipitation, thereby improving the coating performance [18,26,27,28]. High-temperature annealing is used here to obtain more carbides because Cr and Mo are strong carbide forming elements.
Figure 3 shows BESI of the CrMo-6-A sample. As can be seen, after annealing, the gradient microstructure consisting of the coating, the affected layer, and the normal matrix is still visible. In the coating layer, more nitride and carbide particles are observed in the Fe–Cr–Mo SS region (Figure 3b), and the lamellar alloyed pearlite changes to a granular morphology (Figure 3d). Shtansky et al. [29] reported that M23C6 carbide decomposes into (Fe,Mo)3C+γ in Fe–Mo–C steels, showing a rod-like or lamellar structure. Comparing Figure 3c with Figure 2f, it can be seen that after annealing, on the side of the coating, the element distribution curve is sawtoothed, indicating the formation of carbide precipitation. This is because the precipitates are randomly distributed in the Fe–Cr–Mo SS and the EDS scanning line can only pass several precipitates. The element content is high when the EDS scanning line passes through the precipitates and results in a zigzag distribution of the Cr, Mo, Fe, and C in the EDS line scanning spectra.
During annealing, the C atoms in the subsurface continue to be dragged into the coating due to the presence of strong carbonization elements of Cr and Mo in the outermost surface layer, resulting in the formation of a carbon-poor zone without cementite in the affected layer (Figure 3b). Such a phenomenon of subsurface decarburization in the chromized steel has been observed in the literature [16,18]. Additionally, no significant changes are observed in the thickness of the coating layer and the affected layer.

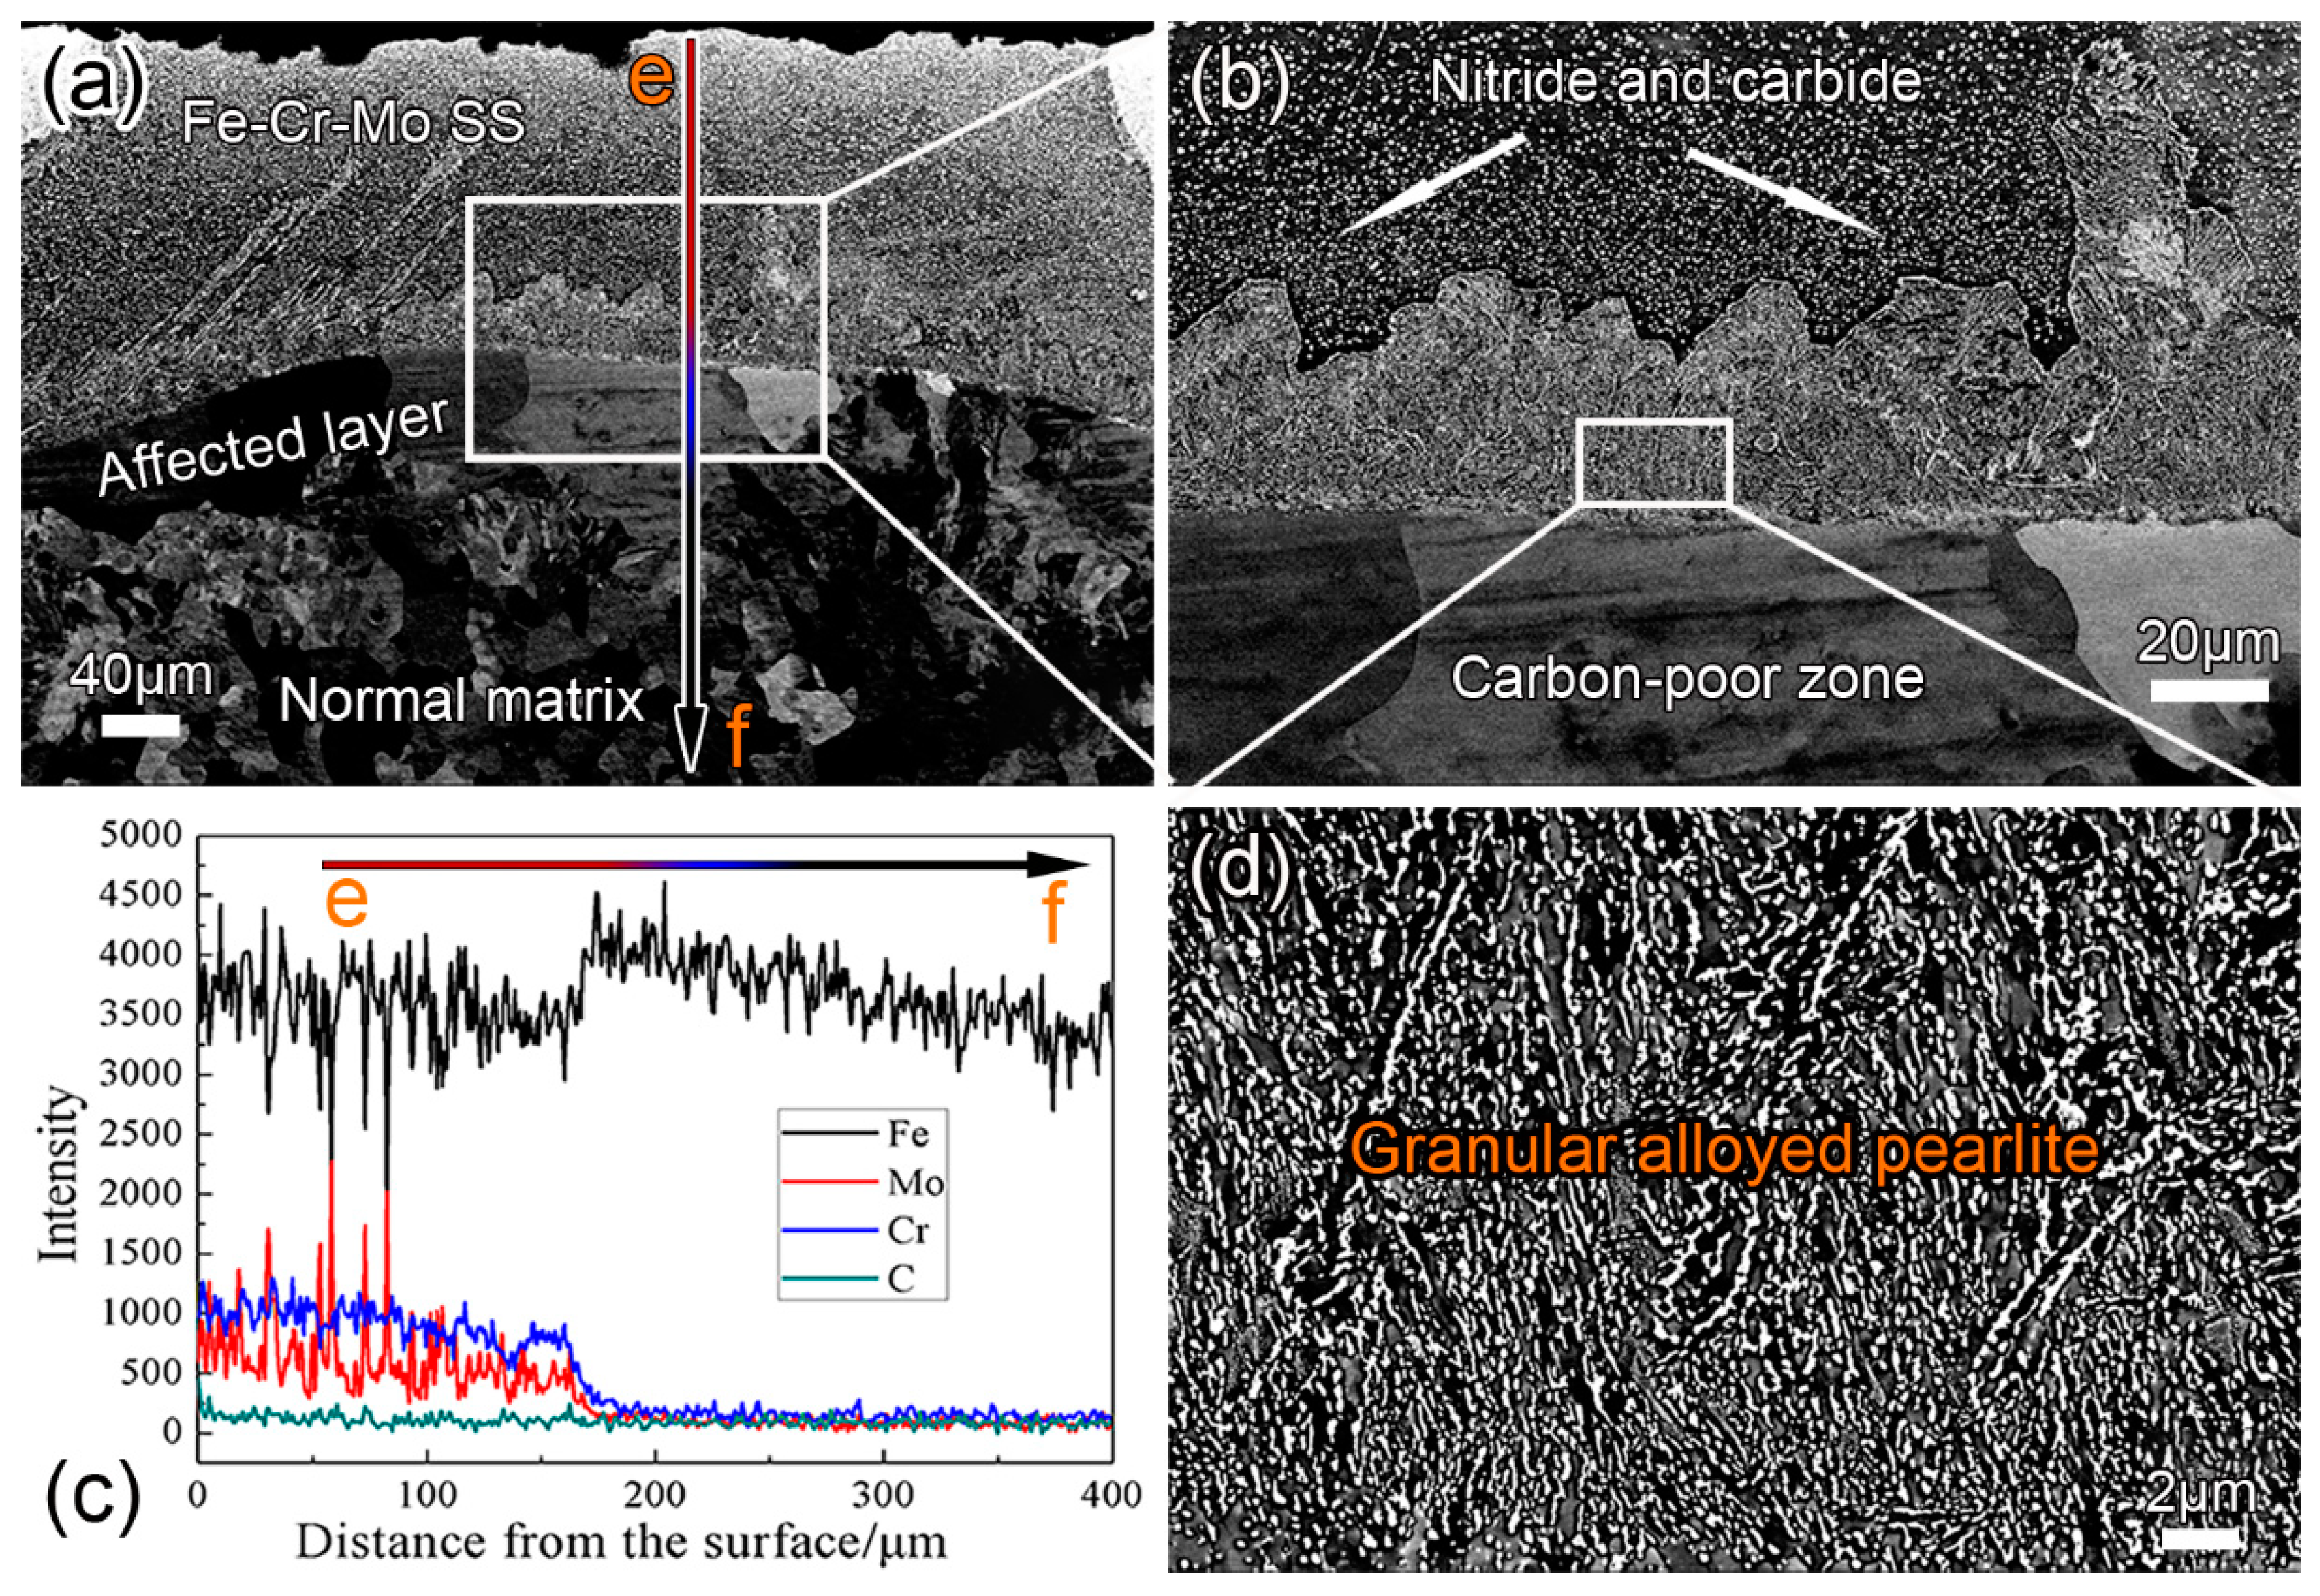
3.3. Effect of Q&T on the Coating Microstructure

DGPSA is carried out at a high temperature and naturally cooled within the furnace, resulting in a decrease in strength and hardness of the steel substrate. Quenching combined with tempering is employed here to tailor the microstructure and enhance the strength and toughness of the steel substrate.
Figure 4 shows the cross-sectional microstructure and EDS pattern of the CrMo-6-QT sample. The three-layer structure of the coating layer, affected layer, and normal matrix can be identified in the sample after Q&T, as shown in Figure 4a. Fe–Cr–Mo SS with a large amount of dispersed particles is observed at the outmost surface of the coating (Figure 4b). According to the XRD analysis, such second phases are composed of nitride and carbide phases. As shown in Figure 4d, more granular particles are observed in the original alloyed pearlite region. The BSEI image indicates that such granular particles are high in the Mo element (high atomic number reflects more electrons, i.e., Z-contrast of BSEI image [30]). The EDS results confirm that the granular particles contain more Cr, Mo, and C, indicating chromium carbides and/or molybdenum carbides (Figure 4c,f). This is because during the reheating of Q&T, the alloyed cementite decomposes and the C atoms diffuse sufficiently and react with Cr and Mo to form granular carbides rather than lamellar ones (Figure 4d). Similar to the annealed state, a carbon-poor zone is observed in the affected layer, and no significant changes are observed in the thickness of the coating and the affected layer after Q&T. Additionally, after Q&T treatment, the microstructure of the matrix is transformed from normal pearlite (with lamellar cementite) into tempered sorbite (with granular cementite).
EDS and EBSD maps showing the coating microstructure of the CrMo-6-QT sample are displayed in Figure 5. Figure 5a shows that after Q&T, the coating is very dense and free of microcracks. A large number of particles with an average size of about 200 nm are uniformly distributed in the coating. The EDS results show that such particles are high in Mo and Cr (see Figure 5b,c). Combined with XRD analysis, such granular particles are nitride ((Fe,Mo)3N) and carbide ((Fe,Mo)3C/(Fe,Cr)3C). As discussed above, nitrides are formed during DGPSA treatment, while the carbides with a granular morphology mainly precipitate in the subsequent Q&T. As can be seen from Figure 5f, most nitrides have a rod-like shape with an average diameter of about 350 nm. In addition to (Fe,Mo)3C with a relatively large size (see white arrows in Figure 5d), some (Fe,Cr)3C carbides with a smaller size (see dark arrows in Figure 5c) are formed in the coating. Due to the limitation of the spatial resolution of the EBSD, such (Fe,Cr)3C carbides with a small size cannot be identified by the EBSD mapping.

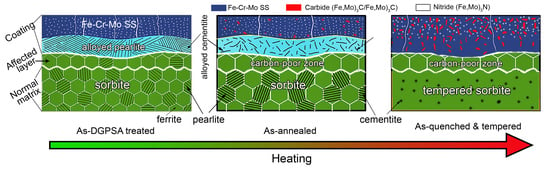
3.4. Microstructure Evolution during Heating

Figure 6 illustrates the microstructure evolution of the as-DGPSA treated samples during different treatments. After DGPSA, a three-layer structure consisting of the coating layer, the affected layer, and the normal matrix is established on the steel surface. The gradient three-layer structure is still clearly visible in the subsequent different heat treatments. The thickness of the coating layer and the affected layer does not change significantly. However, after annealing, more carbides precipitate from the Fe–Cr–Mo SS and the alloyed pearlite region of the coating, and most lamellar alloyed cementite (within the alloyed pearlite) change to a rod-like shape. At the same time, the carbon atoms in the affected layer decrease remarkably, creating a carbon-poor zone composed of pure ferrite. After Q&T, the atoms in the coating are completely diffused, the Fe–Cr–Mo SS region and the alloy pearlite region in the coating combine, and new alloyed nanocarbides form in the previous alloy pearlite region. Moreover, owing to prolonged tempering, the size of the nitrides and carbides is slightly larger than that of the as-DGPSA treated state and annealed state. The steel substrate is transformed into a tempered sorbite composed of ferrite and spherical cementite, which tends to have good toughness.

3.5. Hardness

Figure 7 shows the microhardness distribution along the depth direction of various samples. It can be seen that the hardness distribution of the three different samples follows almost the same change, and the hardest position (about 500 HV0.2) is located at the subsurface of the coating. That is because in the coating, Cr and Mo are dissolved in the α-Fe solid solution to cause solution strengthening, and the distributed carbide and nitride particles can cause dispersion strengthening. Moreover, the subsurface layers of the three samples contain the highest carbides (alloy cementite) (see Figure 2c, Figure 3c, and Figure 4d, respectively), resulting in the greatest dispersion strengthening effect. Compared to the as-DGPSA treated state (about 350 HV0.2), the hardness of the outermost layer does not change significantly after annealing or Q&T. The hardness of the subsurface layer decreases to about 400 HV0.2 after annealing but increases to about 580 HV0.2 after Q&T. It is apparent that annealing results in grain and second phase coarsening, while Q&T can precipitate more alloyed carbides and refine the grain size, resulting in annealing softening and hardening of Q&T. Moreover, owing to the presence of tempered sorbite, the hardness of the steel substrate is greatly increased after Q&T in comparison with the as-DGPSA treated state and the annealed state.
Unfortunately, all the samples have a thin decarburized layer (affected layer/carbon-poor zone, see Figure 2a, Figure 3a, and Figure 4a), resulting in a lower hardness. Such phenomena have been reported in thermal chromized steels or annealing of Cr-coated steels [16,18]. In this study, it was considered that prior to DGPSA treatment, increasing the carbon content of the surface and subsurface of the steel substrate could solve this problem.

3.6. Polarization Test

The polarization curve reflects the relationship between the electrode potential and polarization current and is an important method for studying the electrode process dynamics and electrochemical corrosion principles [31]. The anodic polarization curve is a relationship between the anode potential and the current when the metal anode is dissolved. A large number of studies [32,33,34] have shown that Cr-coated or Mo-coated steels have excellent corrosion resistance. Figure 8 shows the polarization curves of different samples. The corrosion parameters are shown in Table 2, where the corrosion rate was calculated by the Faraday Equation [35]:
CR ( mm / y ) = 3.27 × 10 3 × I corr × E W ρ
where Icorr is the corrosion current density (μA/cm2), EW is the equivalent weight (about 28), and ρ is the density (about 7.85 g/cm3).
After DGPSA treatment, combining Figure 8 with Table 2, the corrosion potential of the CrMo-6 sample—although it has a similar corrosion current to AISI 5140 steel (before DGPSA treatment) or the 304 stainless steel—is obviously higher than that of AISI 5140 steel and 304 stainless steel. That is, the CrMo-6 sample has a higher breakdown potential in a 3.5% NaCl aqueous solution, indicating better corrosion resistance. After annealing or Q&T, the corrosion current decreases to 1.00 × 10⁻⁷ A and 4.79 × 10⁻⁸ A, respectively, but the corrosion potential does not vary significantly. Compared to the CrMo-6 sample, the corrosion rates of the CrMo-6-A and CrMo-6-QT samples decrease by 22 times and 43 times, respectively. Such improvement in corrosion resistance can be attributed to the formation of Fe–Cr–Mo SS on the steel surface and the elimination of pores and microcracks during reheating, resulting in the formation of dense passivation film that slows the coating corrosion rate.

4. Conclusions

In this study, Cr–Mo duplex-alloyed coating was prepared on AISI 5140 steel by double glow plasma surface alloying (DGPSA). The effect of annealing and quenching and tempering (Q&T) treatments on the microstructure and properties of the coating was studied. The main conclusions are as follows:
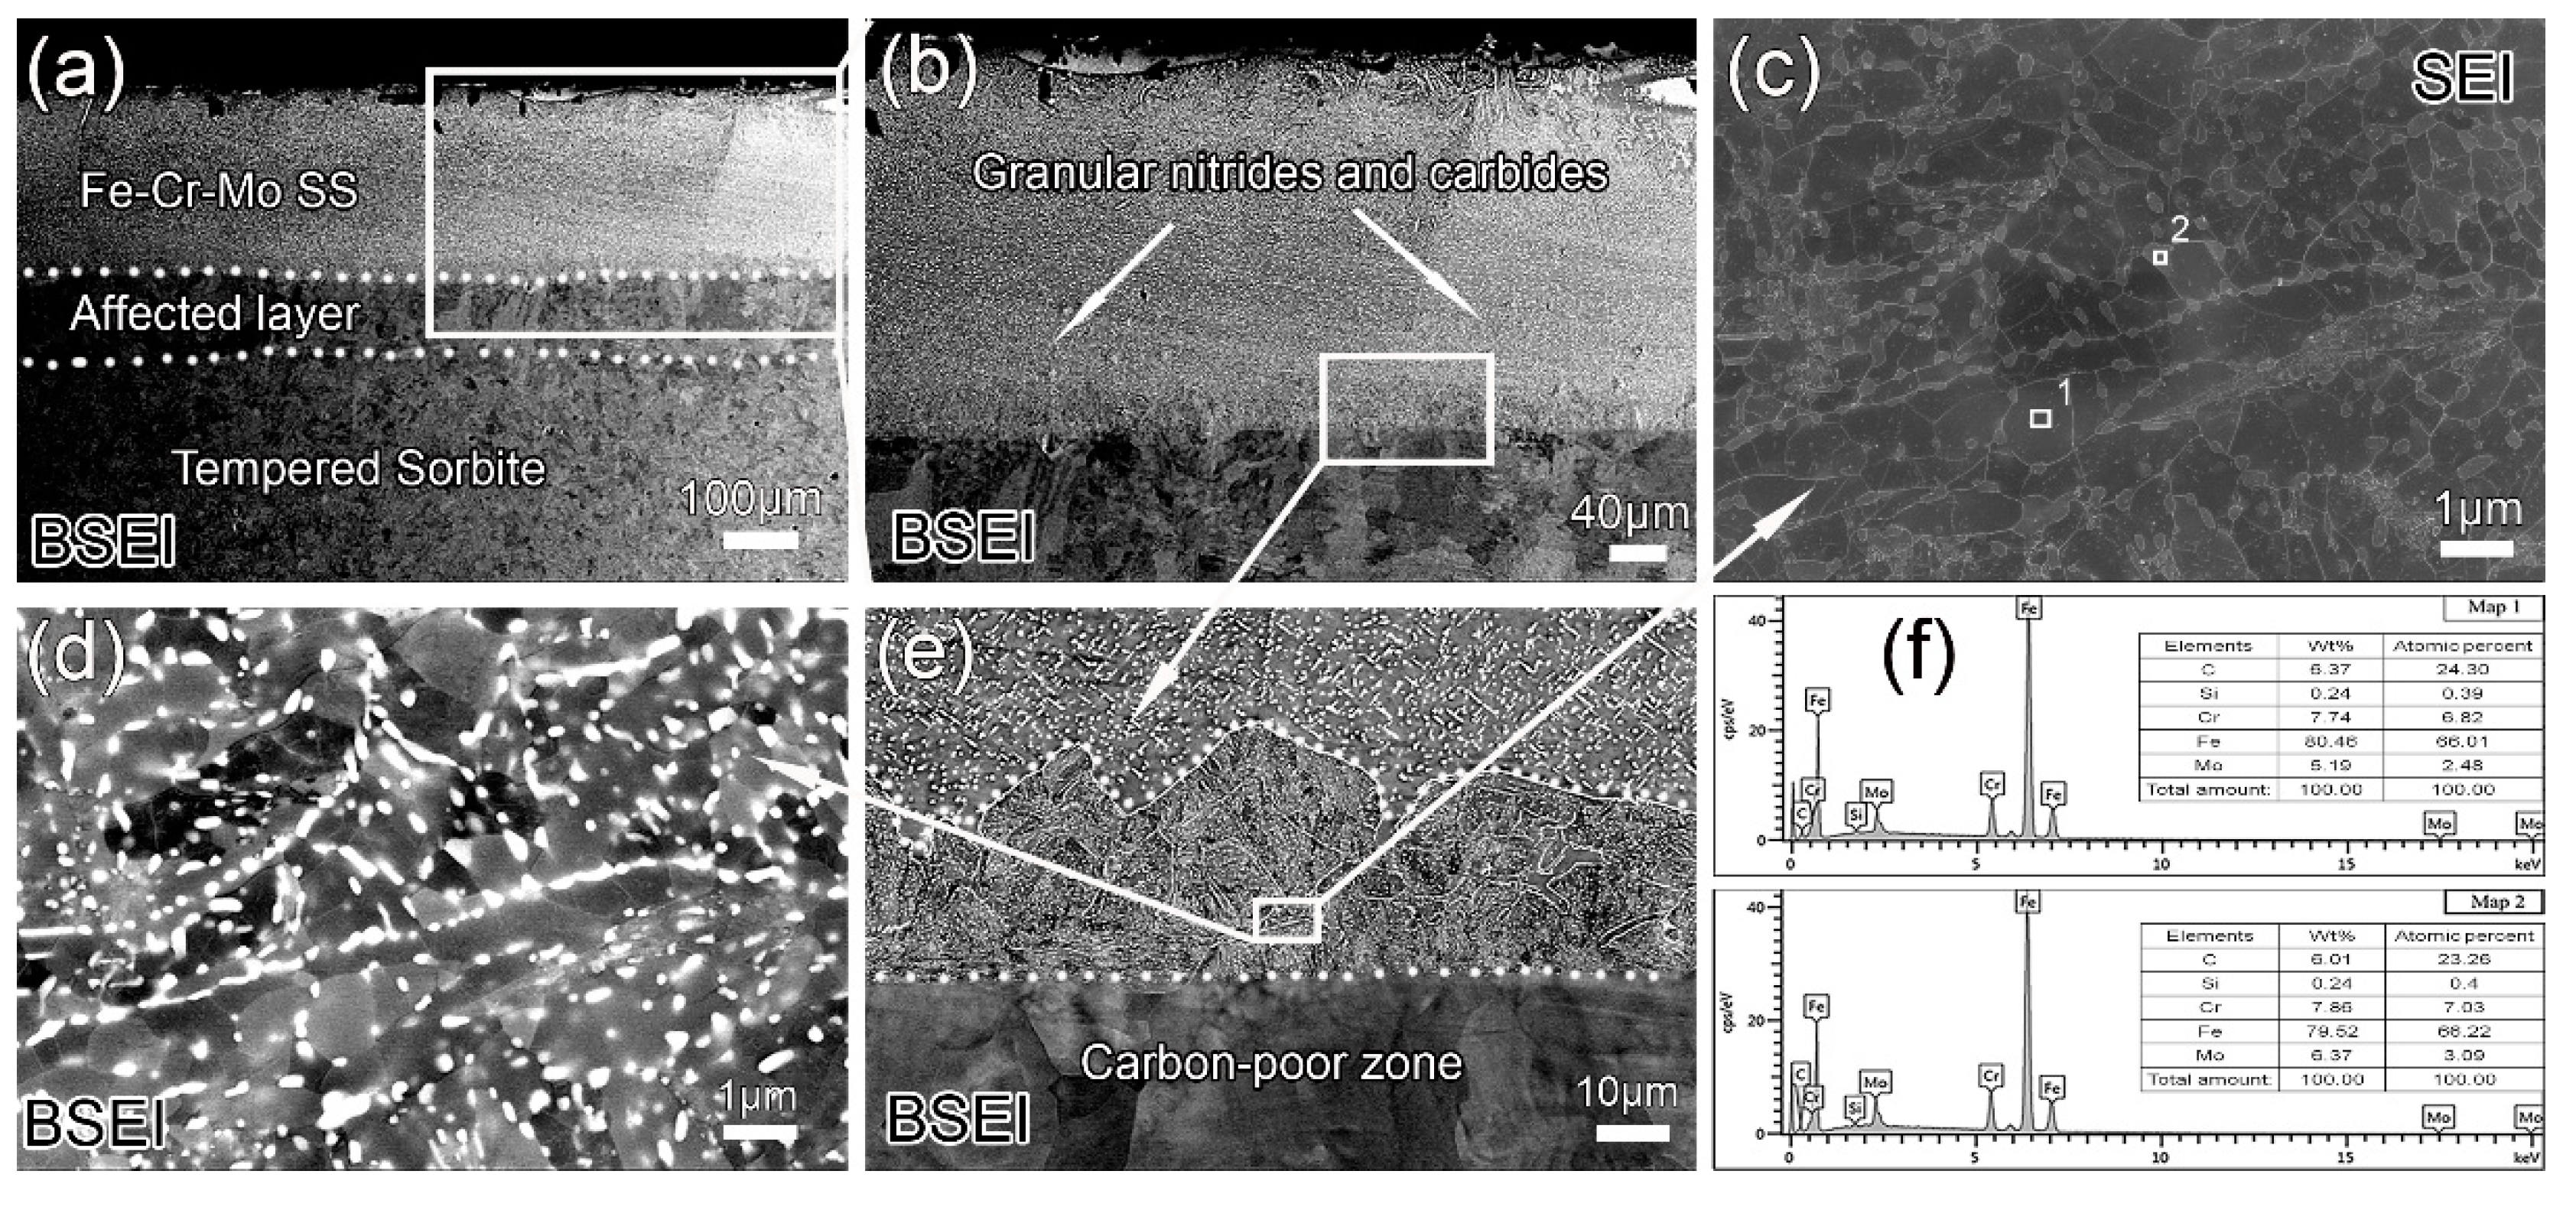
  • A structured gradient coating (about 180 μm) composed of an Fe–Cr–Mo SS layer and an alloyed pearlite layer is obtained on the steel surface after DGPSA treatment. As carbon atoms diffuse to form alloy cementite in the coating, the carbon content in the subsurface is significantly reduced, forming an affected layer (about 52 μm).
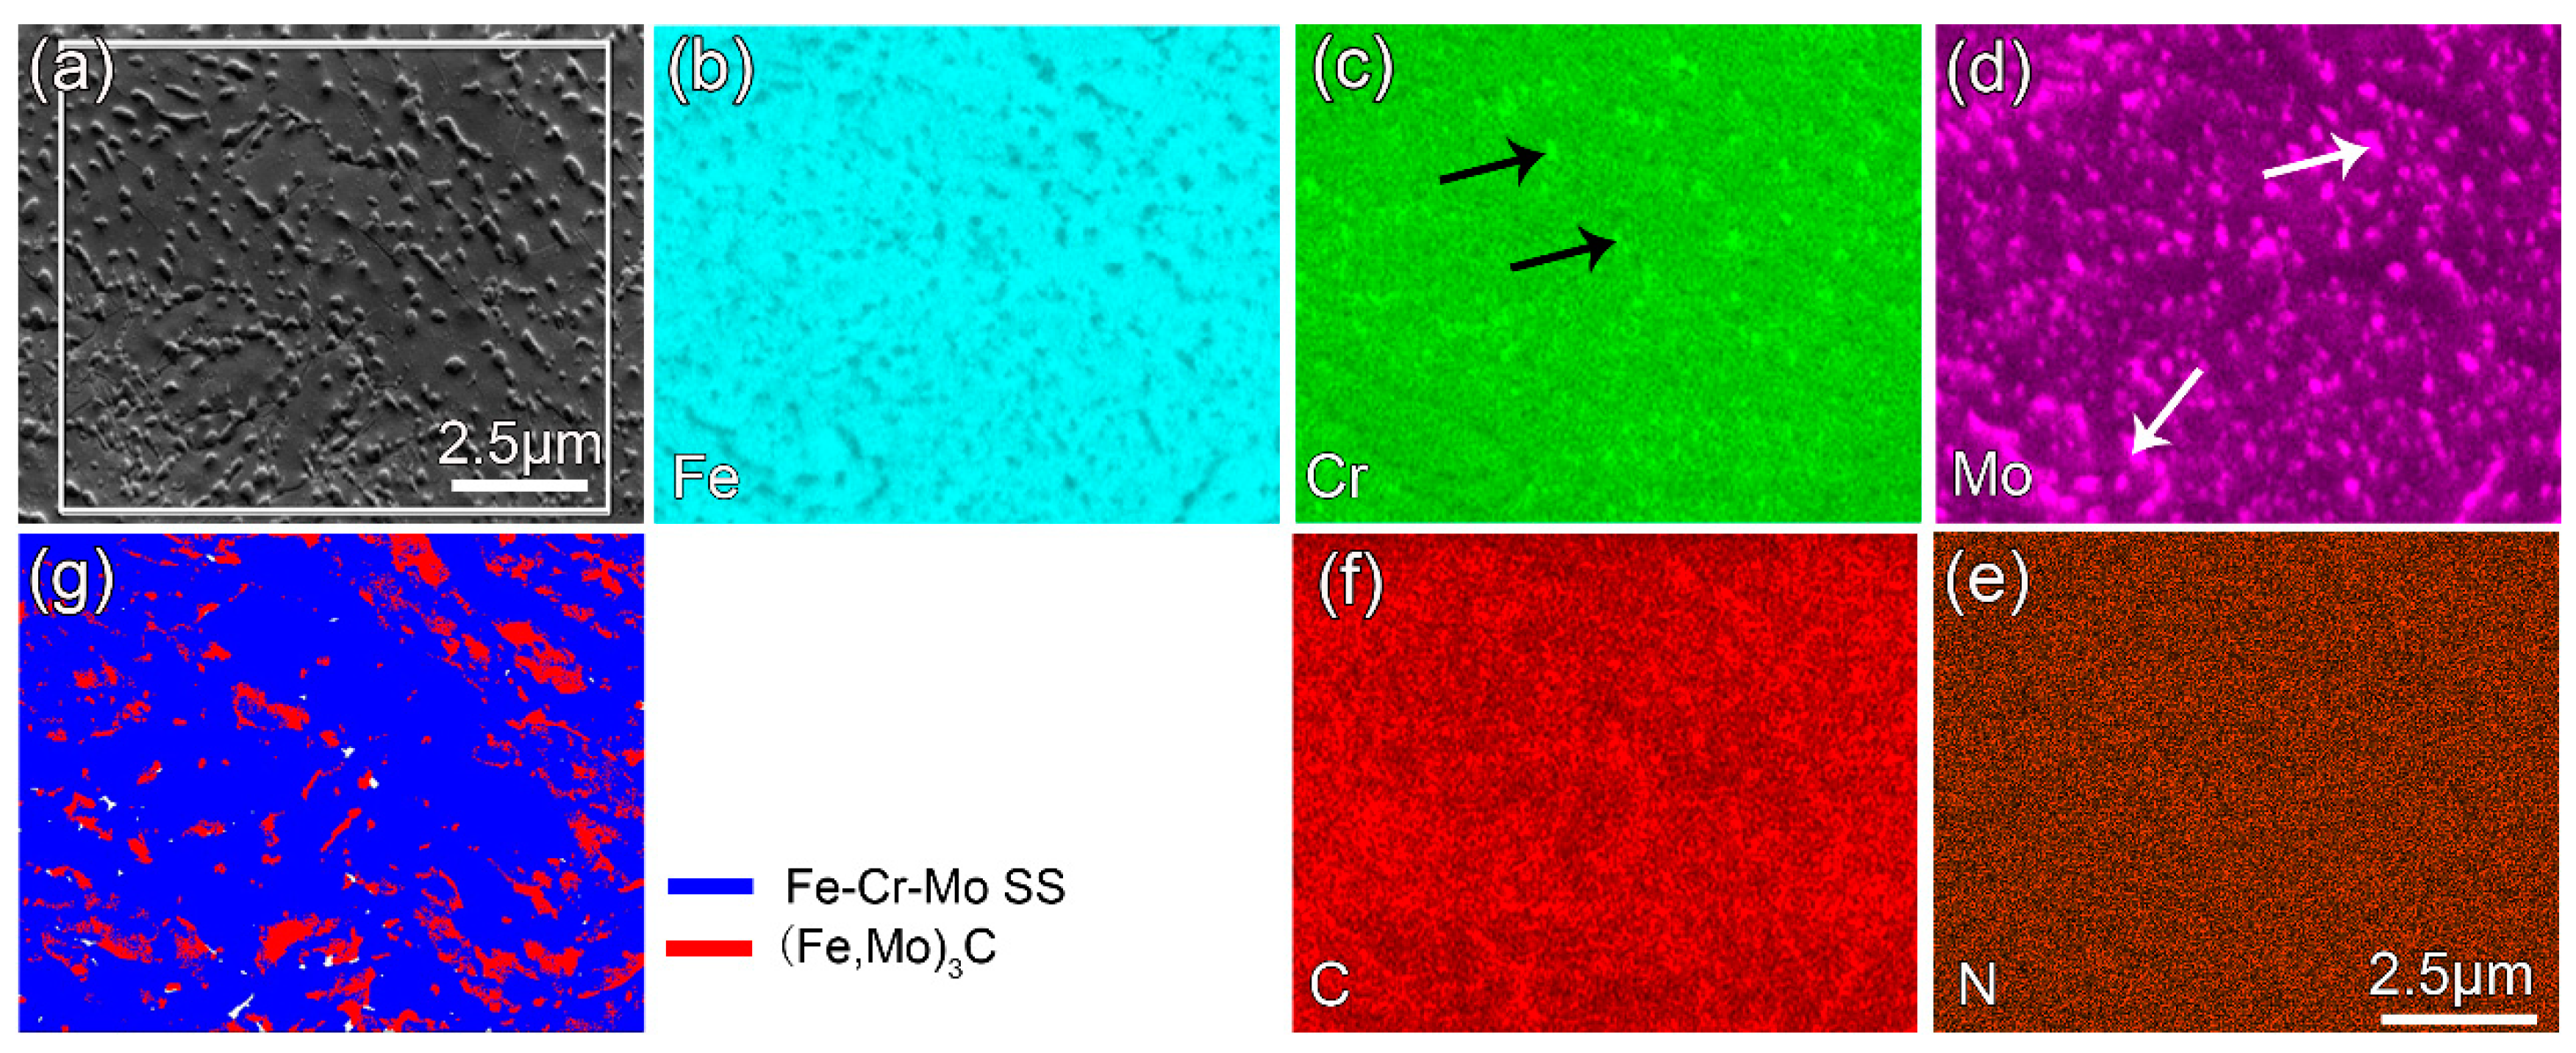
  • After annealing or Q&T, more carbides precipitate in both the Fe–Cr–Mo SS layer and the alloyed pearlite layer. All the C atoms in the subsurface are dragged into the coating to form the carbides in the Fe–Cr–Mo SS and the alloyed pearlite layers of the coating, resulting in the conversion of the affected layer into a carbon-poor zone.
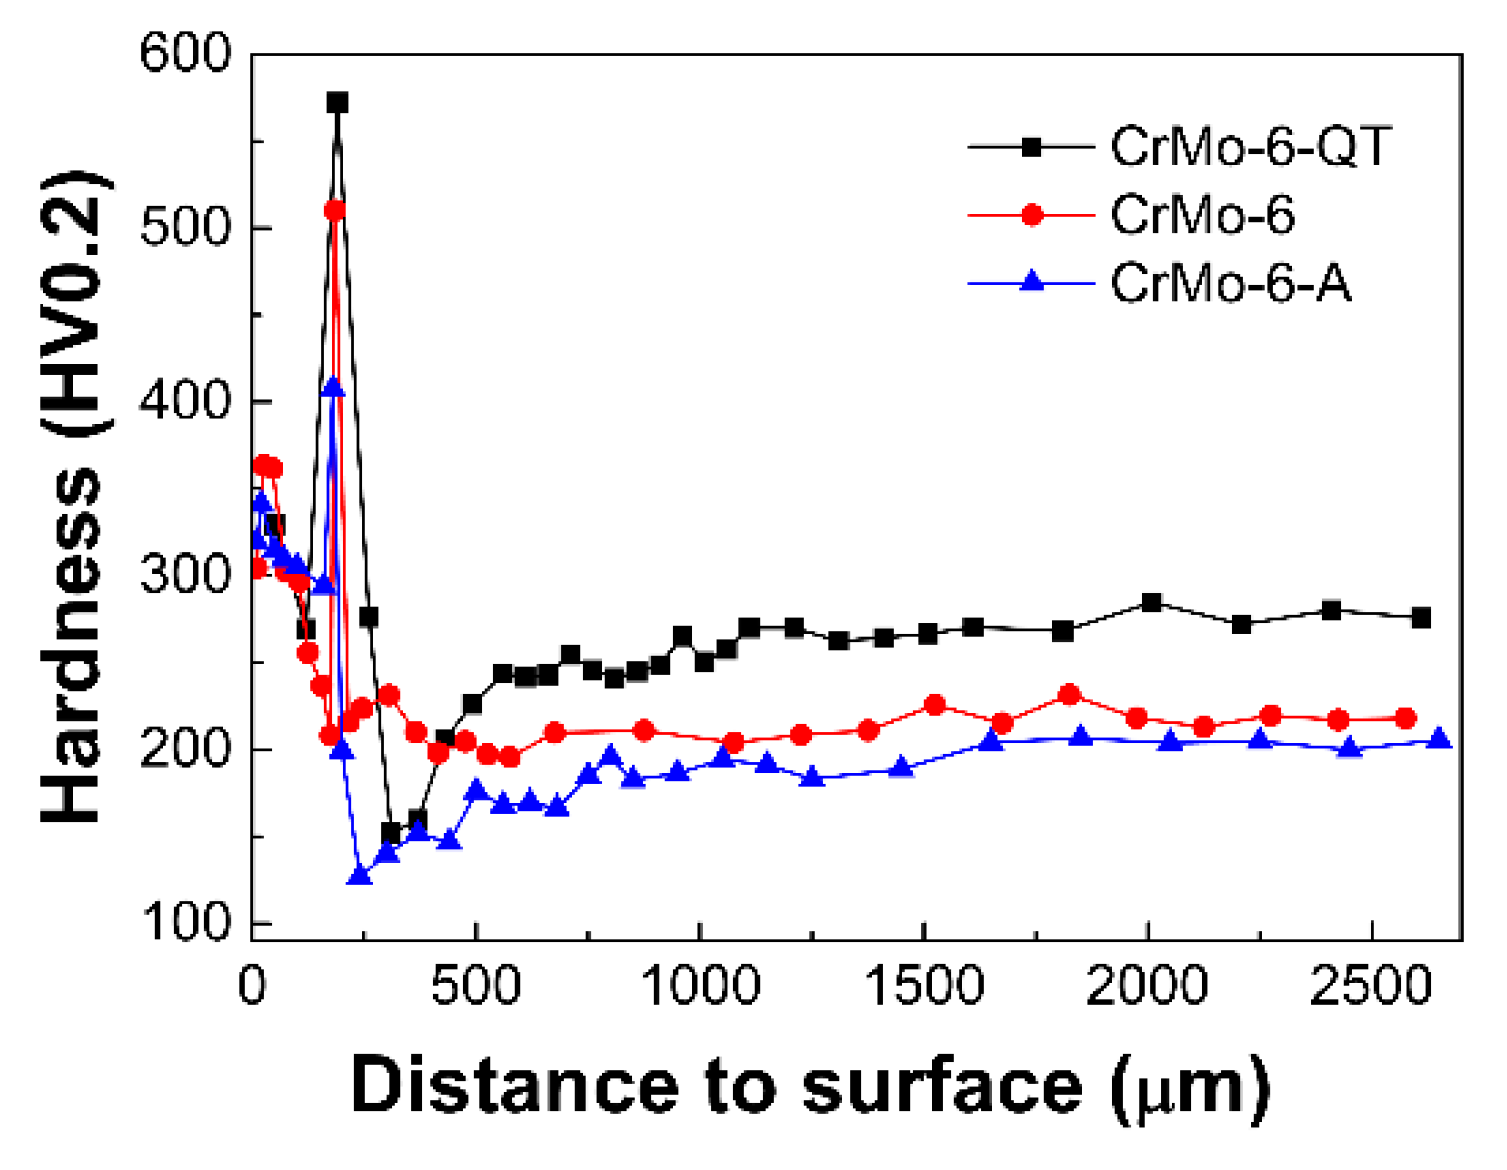
  • Annealing and Q&T hardly change the thickness of the coating but the hardness of both the coating and steel substrate varies greatly by tailoring the microstructure. Annealing results in grain and second phase coarsening, while Q&T refines the second phase size, resulting in annealing softening and Q&T hardening. Both the coatings and substrate of the Q&T treated samples have higher hardness than that of the as-DGPSA treated and annealed samples.
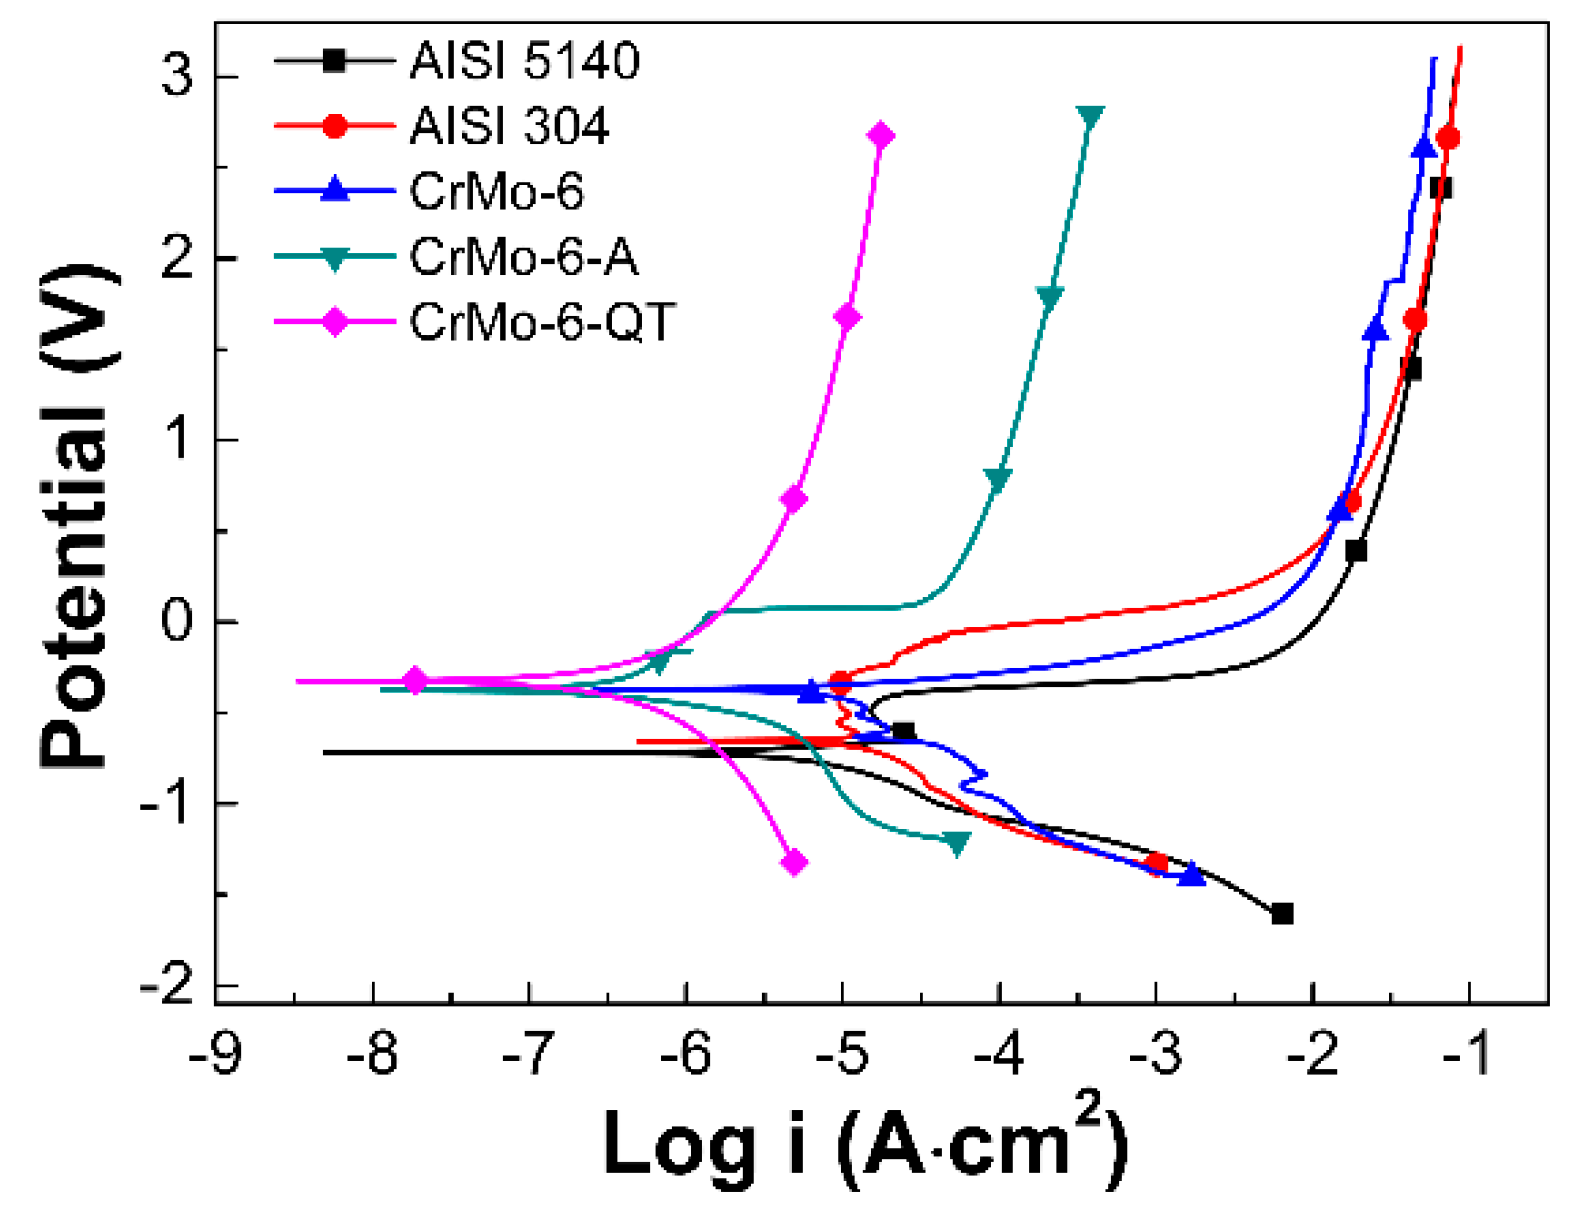
  • After annealing or Q&T, the corrosion potential does not vary dramatically, but the corrosion current decreases. Compared with the as-DGPSA treated state, the corrosion rates of the as-annealed state and the Q&T treated state are reduced by 22 times and 43 times, respectively.

Author Contributions

Conceptualization, J.H. and H.X.; methodology, J.W. and J.J.; software, N.G.; validation, X.Y., H.L. and J.H.; formal analysis, J.H. and N.G.; investigation, J.H. and N.G.; resources, J.H.; data curation, J.H. and N.G.; writing—original draft preparation, J.H., J.J. and N.G.; writing—review and editing, N.G.; supervision, N.G. and H.X.; project administration, J.H. and H.X.; funding acquisition, J.H. and H.X.

Funding

This work was co-supported by the Natural Science Foundation of China (51575073), Scientific and Technological Research Program of Chongqing (cstc2017jcyjBX0031 and cstc2018jszx-cyzdX0126), Scientific and Technological Research Program of Banan District of Chongqing (2018TJ06), and the Program for Innovation Team Building at Institutions of Higher Education in Chongqing (CXTDG20162017).

Conflicts of Interest

The authors declare no conflict of interest.

References

  1. Behrens, B.-A.; Chugreev, A.; Matthias, T.; Poll, G.; Pape, F.; Coors, T.; Hassel, T.; Maier, H.J.; Mildebrath, M. Manufacturing and evaluation of multi-material axial-bearing washers by tailored forming. Metals 2019, 9, 232. [Google Scholar] [CrossRef]
  2. Zong, L.; Guo, N.; Li, R.; Yu, H. Effect of B content on microstructure and wear resistance of Fe-3Ti-4C hardfacing alloys produced by plasma-transferred arc welding. Coatings 2019, 9, 265. [Google Scholar] [CrossRef]
  3. Sun, J.; Yao, Q. Fabrication of microalloy nitrided layer on low carbon steel by nitriding combined with surface nano-alloying pretreatment. Coatings 2016, 6, 63. [Google Scholar] [CrossRef]
  4. Tao, Q.; Jian, W.; Fu, L.; Zheng, C.; Shen, C.; Zhang, D.; Zhi, S. Ultrahigh hardness of carbon steel surface realized by novel solid carburizing with rapid diffusion of carbon nanostructures. J. Mater. Sci. Technol. 2017, 33, 146–154. [Google Scholar] [CrossRef]
  5. Pertek, A.; Kulka, M. Two-step treatment carburizing followed by boriding on medium-carbon steel. Surf. Coat. Technol. 2003, 173, 309–314. [Google Scholar] [CrossRef]
  6. Mishra, S.C.; Mohanty, B.C.; Nayak, B.B. Arc plasma nitriding of low carbon steel. Surf. Coat. Technol. 2001, 145, 24–30. [Google Scholar] [CrossRef]
  7. Basu, A.; Majumdar, J.D.; Alphonsa, J.; Mukherjee, S.; Manna, I. Corrosion resistance improvement of high carbon low alloy steel by plasma nitriding. Mater. Lett. 2008, 62, 3117–3120. [Google Scholar] [CrossRef]
  8. Wu, J.; Wang, K.; Fan, L.; Dong, L.; Deng, J.; Li, D.; Xue, W. Investigation of anodic plasma electrolytic carbonitriding on medium carbon steel. Surf. Coat. Technol. 2017, 313, 288–293. [Google Scholar] [CrossRef]
  9. Kulka, M.; Pertek, A. Characterization of complex (B + C) diffusion layers formed on chromium and nickel-based low-carbon steel. Appl. Surf. Sci. 2003, 218, 114–123. [Google Scholar] [CrossRef]
  10. Ding, F.; Zhang, P.; Wei, D.; Chen, X.; Wang, S.; Wang, Z.; Zhu, Y. Isothermal oxidation behavior of Zr-Y coating on γ-TiAl by Double glow plasma surface metal alloying Technique. Coatings 2018, 8, 361. [Google Scholar] [CrossRef]
  11. Xu, Z.; Liu, X.; Zhang, P.; Zhang, Y.; Zhang, G.; He, Z. Double glow plasma surface alloying and plasma nitriding. Surf. Coat. Technol. 2007, 201, 4822–4825. [Google Scholar] [CrossRef]
  12. Yuan, S.; Lin, N.; Zou, J.; Liu, Z.; Wang, Z.; Tian, L.; Qin, L.; Zhang, H.; Wang, Z.; Tang, B.; et al. Effect of laser surface texturing (LST) on tribological behavior of double glow plasma surface zirconizing coating on Ti6Al4V alloy. Surf. Coat. Technol. 2019, 368, 97–109. [Google Scholar] [CrossRef]
  13. Cong, W.; Yao, Z.; Zhu, X. Sliding wear of low carbon steel modified by double-glow plasma surface alloying with nickel and chromium at various temperatures. Wear 2010, 268, 790–796. [Google Scholar] [CrossRef]
  14. Ai, X.Y.; Lin, H.L.; Zhang, B.; Lv, J.W.; Jing, Q.; Liu, R.P. Hydrogen-free nitriding of ZrTiAlV by double glow plasma discharge improving the wear resistance. Mater. Sci. Technol. 2018, 34, 1303–1308. [Google Scholar] [CrossRef]
  15. Hu, J.; Ma, C.; Yang, X.; Xu, H.; Guo, N.; Yu, H. Microstructure Evolution During Continuous Cooling in AISI 5140 Steel Processed by Induction Heating Chromizing. J. Mater. Eng. Perform. 2017, 26, 5530–5537. [Google Scholar] [CrossRef]
  16. Hu, J.; Zhang, Y.; Yang, X.; Li, H.; Xu, H.; Ma, C.; Dong, Q.; Guo, N.; Yao, Z. Effect of pack-chromizing temperature on microstructure and performance of AISI 5140 steel with Cr-coatings. Surf. Coat. Technol. 2018, 344, 656–663. [Google Scholar] [CrossRef]
  17. Hu, J.; Ma, C.; Xu, H.; Guo, N.; Hou, T. Development of a composite technique for preconditioning of 41Cr4 Steel Used as gear material: examination of its microstructural characteristics and properties. Sci. Technol. Nucl. Ins. 2016, 2016, 6. [Google Scholar] [CrossRef]
  18. Hu, J.; Jiang, J.; Li, H.; Yang, X.; Xu, H.; Jin, Y.; Ma, C.; Dong, Q.; Guo, N. Effect of annealing treatment on microstructure and properties of cr-coatings deposited on aisi 5140 steel by brush-plating. Coatings 2018, 8, 193. [Google Scholar] [CrossRef]
  19. Zhang, B.; Cheng, J.; Liang, X. Effects of Cr and Mo additions on formation and mechanical properties of Arc-sprayed FeBSiNb-based glassy coatings. J. Non-Cryst. Solids 2018, 499, 245–251. [Google Scholar] [CrossRef]
  20. Ren, B.; Miao, Q.; Liang, W.; Yao, Z.; Zhang, P. Characteristics of Mo–Cr duplex-alloyed layer on Ti 6 Al 4 V by double glow plasma surface metallurgy. Surf. Coat. Technol. 2013, 228, S206–S209. [Google Scholar] [CrossRef]
  21. Fei, C.; Yulin, Z.; Weiguang, L.; Wenran, F.; Yingge, Y. Corrosion behavior of W-Mo Co-penetrated layer produced by glow discharge plasma technique in acid solution. Rare Metal Mat. Eng. 2018, 47, 723–728. [Google Scholar] [CrossRef]
  22. Koller, C.M.; Dalbauer, V.; Kirnbauer, A.; Löffler, S.; Kolozsvári, S.; Ramm, J.; Mayrhofer, P.H. Selective phase formation in substoichiometric Al-Cr-based oxides. Scripta Mater. 2017, 139, 144–147. [Google Scholar] [CrossRef]
  23. Dalbauer, V.; Kolozsvári, S.; Ramm, J.; Koller, C.M.; Mayrhofer, P.H. In-situ XRD studies of arc evaporated Al-Cr-O coatings during oxidation. Surf. Coat. Technol. 2019, 358, 934–941. [Google Scholar] [CrossRef]
  24. Wieczerzak, K.; Bala, P.; Stepien, M.; Cios, G.; Koziel, T. Formation of eutectic carbides in Fe–Cr–Mo–C alloy during non-equilibrium crystallization. Mater. Des. 2016, 94, 61–68. [Google Scholar] [CrossRef]
  25. Hu, J.; Shi, Y.N.; Sauvage, X.; Sha, G.; Lu, K. Grain boundary stability governs hardening and softening in extremely fine nanograined metals. Science 2017, 355, 1292. [Google Scholar] [CrossRef] [PubMed]
  26. Zeng, Z.; Wang, L.; Liang, A.; Zhang, J. Tribological and electrochemical behavior of thick Cr–C alloy coatings electrodeposited in trivalent chromium bath as an alternative to conventional Cr coatings. Electrochim. Acta 2006, 52, 1366–1373. [Google Scholar] [CrossRef]
  27. Martinschitz, K.J.; Daniel, R.; Mitterer, C.; Keckes, J. Stress evolution in CrN/Cr coating systems during thermal straining. Thin Solid Films 2008, 516, 1972–1976. [Google Scholar] [CrossRef]
  28. Dai, Q.-L.; Luo, C.-b.; You, F.-y. Crack restraining methods and their effects on the microstructures and properties of laser cladded WC/Fe coatings. Materials 2018, 11, 2541. [Google Scholar] [CrossRef]
  29. Shtansky, D.V.G. Phase Transformation in Fe-Mo-C and Fe-W-C Steels—II. Eutectoid Reaction of M23C6 Carbide Decomposition during Austenitization. Acta Mater. 1997, 45, 2879–2895. [Google Scholar] [CrossRef]
  30. Guo, N.; Liu, Q.; Xin, Y.; Luan, B.; Zhou, Z. The application of back-scattered electron imaging for characterization of pearlitic steels. Sci. China Technol. Sci. 2011, 54, 2368. [Google Scholar] [CrossRef]
  31. Wang, Z.M.; Lun, Q.Y.; Wang, J.; Han, X.; Zhu, W.; Zhang, J.; Song, L.G. Corrosion mitigation behavior of an alternately wetted steel electrode in oil/water media. Corros. Sci. 2019, 152, 140–152. [Google Scholar] [CrossRef]
  32. Kikuchi, S.; Iwamae, S.; Akebono, H.; Komotori, J.; Misaka, Y. Improvement of the electrochemical characteristics of medium carbon steel using atmospheric-controlled induction-heating fine particle peening. Surf. Coat. Technol. 2018, 354, 76–82. [Google Scholar] [CrossRef]
  33. Ueda, M.; Oliveira, R.M.; Rossi, J.O.; Mello, C.B.; Rangel, R.C.C.; Vieira, M.S. Improvements of plasma immersion ion implantation (PIII) and deposition (PIII&D) processing for materials surface modification. Surf. Coat. Technol. 2013, 229, 97–104. [Google Scholar]
  34. Mello, C.B.; Ueda, M.; Oliveira, R.M.; Garcia, J.A. Corrosion effects of plasma immersion ion implantation-enhanced Cr deposition on SAE 1070 carbon steel. Surf. Coat. Technol. 2011, 205, S151–S156. [Google Scholar] [CrossRef]
  35. Khara, S.; Choudhary, S.; Sangal, S.; Mondal, K. Corrosion resistant Cr-coating on mild steel by powder roll bonding. Surf. Coat. Technol. 2016, 296, 203–210. [Google Scholar] [CrossRef]
Figure 1. X-ray diffraction (XRD) profiles of different samples.
Coatings 09 00336 g001
Figure 2. Backscattering electron imaging (BSEI) images and energy dispersive spectrometry (EDS) patterns of the CrMo-6 sample: (a) cross-sectional view showing the coating; (b) and (d) partial enlarged view of the corresponding part in (a); (c) and (e) are enlarged views of the white boxes in (b); (f) EDS line scanning spectra.
Coatings 09 00336 g002
Figure 3. BSEI images and EDS patterns of the CrMo-6-A sample: (a) cross-sectional view showing the coatings; (b) is an enlarged view of the corresponding white box in (a); (c) EDS line scanning spectra; (d) is the corresponding part in the white box in (b).
Coatings 09 00336 g003
Figure 4. BSEI images, secondary electron imaging (SEI) images, and EDS patterns of the CrMo-6-QT sample: (a) cross-sectional view; (b) partially enlarged view; (c) and (d) are enlarged views of the white boxes in (e); (e) is an enlarged view of the white box in (b); (f) EDS patterns of the points in (c).
Coatings 09 00336 g004
Figure 5. EDS and electron backscattering diffraction (EBSD) mapping showing the coating microstructure of the CrMo-6-QT sample: (a) SEI image; (bf) EDS maps of the white box in (a); (g) EBSD phase composition map. All the images/maps were observed from the cross-sectional view of the sample.
Coatings 09 00336 g005
Figure 6. Schematic diagram illustrating the microstructure evolution during different treatments.
Coatings 09 00336 g006
Figure 7. Microhardness distribution along the depth direction of various samples.
Coatings 09 00336 g007
Figure 8. Polarization curves of different samples.
Coatings 09 00336 g008
Table 1. The processing parameters of double glow plasma surface alloying (DGPSA) treatment.
Processing ParametersValues
Spacing between source electrode and cathode (mm)10
Voltage of the source electrode (V)900
Voltage of the cathode (V)800
Working pressure (nitrogen/Pa)204
Duty ratio of the source electrode73.9
Duty ratio of the cathode78.3
Table 2. Corrosion parameters of different samples in a 3.5% NaCl aqueous solution.
SamplesCorrosion Potential
Eccor (v)
Corrosion Current
Iccor (A)
Corrosion Rate
(mm/y)
AISI 5140−0.72.29 × 10−60.026
AISI 304−0.652.25 × 10−60.025
CrMo-6−0.372.28 × 10−60.026
CrMo-6-A−0.381.00 × 10−70.0012
CrMo-6-QT−0.334.79 × 10−80.0006

