Communication

Differentiating Generic versus Branded Pharmaceutical Tablets Using Ultra-High-Resolution Optical Coherence Tomography

1
Department of Electrical Engineering and Electronics, University of Liverpool, Liverpool L69 3GJ, UK
2
Department of Eye and Vision Science, University of Liverpool, Liverpool L7 8TX, UK
3
Department of Engineering, Lancaster University, Lancaster LA1 4YW, UK
*
Author to whom correspondence should be addressed.
Coatings 2019, 9(5), 326; https://doi.org/10.3390/coatings9050326
Submission received: 7 April 2019 / Revised: 14 May 2019 / Accepted: 15 May 2019 / Published: 17 May 2019

Abstract

:
Optical coherence tomography (OCT) has recently been demonstrated as a powerful tool to image through pharmaceutical film coatings. Majority of the existing systems can, however, resolve film coatings for thickness greater than 10 µm. Here we report on an ultra-high-resolution (UHR) OCT system, with 1 µm axial and 1.6 µm lateral resolutions, which can resolve thin coatings at approximately 4 µm. We further demonstrate a novel application of the system for differentiating generic and branded suppliers of paracetamol tablets.

1. Introduction

Pharmaceutical film coatings are polymeric films formed from an aqueous latex dispersion, that are applied for various purposes such as protecting the active pharmaceutical ingredients (APIs) from light and moisture, improving the visual appearance, taste masking, and in some cases, brand differentiation. More advanced coatings serve a functional purpose such as controlling the release rate of the APIs [1]. To assess the coating quality (thickness uniformity, roughness, defects), various analytical techniques have been proposed. Examples of these techniques include vibrational spectroscopic methods like near-infrared (NIR) [2] and Raman spectroscopy [3] as well as imaging methods such as nuclear magnetic resonance imaging (NMR) [4], X-ray micro-tomography (XµCT) [5], terahertz pulsed imaging (TPI) [6] and optical coherence tomography (OCT) [7]. Amongst all these methods, TPI and OCT are attractive because coating thickness can be measured directly where the only unknown is coating refractive index (RI), as opposed to spectroscopic methods that require calibration against a priori developed chemometric models. The XµCT requires time-consuming three-dimensional scanning and reconstruction. The TPI technique determines coating thickness by measuring the time delay between successive reflected THz pulses arising from neighboring interfaces and scales it by the RI of the coating material. The achievable resolutions of TPI are 150–250 µm in the lateral direction and 30–40 µm in the axial direction [6,8,9]. In contrast, OCT is based on low-coherence interferometry, typically achieved with a Michelson interferometer, and exploits the NIR or visible frequencies. Furthermore, OCT decouples axial resolution and lateral resolution, where the former is ultimately limited by the temporal coherence of the illumination source, while the latter is primarily determined by the numerical aperture (NA) of the objective [10]. Several contributions have been made on the characterization of pharmaceutical coatings with OCT in the thickness range 10–100 µm. In particular, Lin et al reported a spectral-domain OCT (SD-OCT) system with a 16 µm × 5.7 µm (lateral × axial) resolution for quantifying tablet coatings [11,12,13]. Markl et al reported a SD-OCT system with an improved resolution of about 10 µm × 4.9 µm for in-line monitoring of both tablet and pellet coating processes [14,15]. Li et al demonstrated the use of a full-field OCT (FF-OCT) system for the first time with a resolution performance of 11 µm × 3.6 µm to evaluate coating structures on small pellets (diameter < 1 mm) [16]. To date, the highest axial resolution achieved was 0.9 µm by using a broadband halogen lamp as the light source [17]. However, the system used a halogen lamp that renders the system bulky, energy inefficient and difficult to align.
In this study, we report on a compact Linnik-typed OCT imaging system for imaging thin film coatings. The proposed system is driven by a broadband light-emitting diode (LED) source, which achieves an ultra-high-resolution (UHR) performance (approximately 1-µm lateral and axial resolution). We demonstrate, for the first time, the applicability of using an UHR OCT system to differentiate branded pharmaceutical tablets from generic suppliers in terms of coating structures. Specifically, thin coating structures of approximately 4 µm could be resolved in GlaxoSmithKline (GSK) Panadol tablets but not present in the generics. To determine the coating thickness, the coating structures were automatically detected by a fast graph-based segmentation algorithm.

2. Materials and Methods

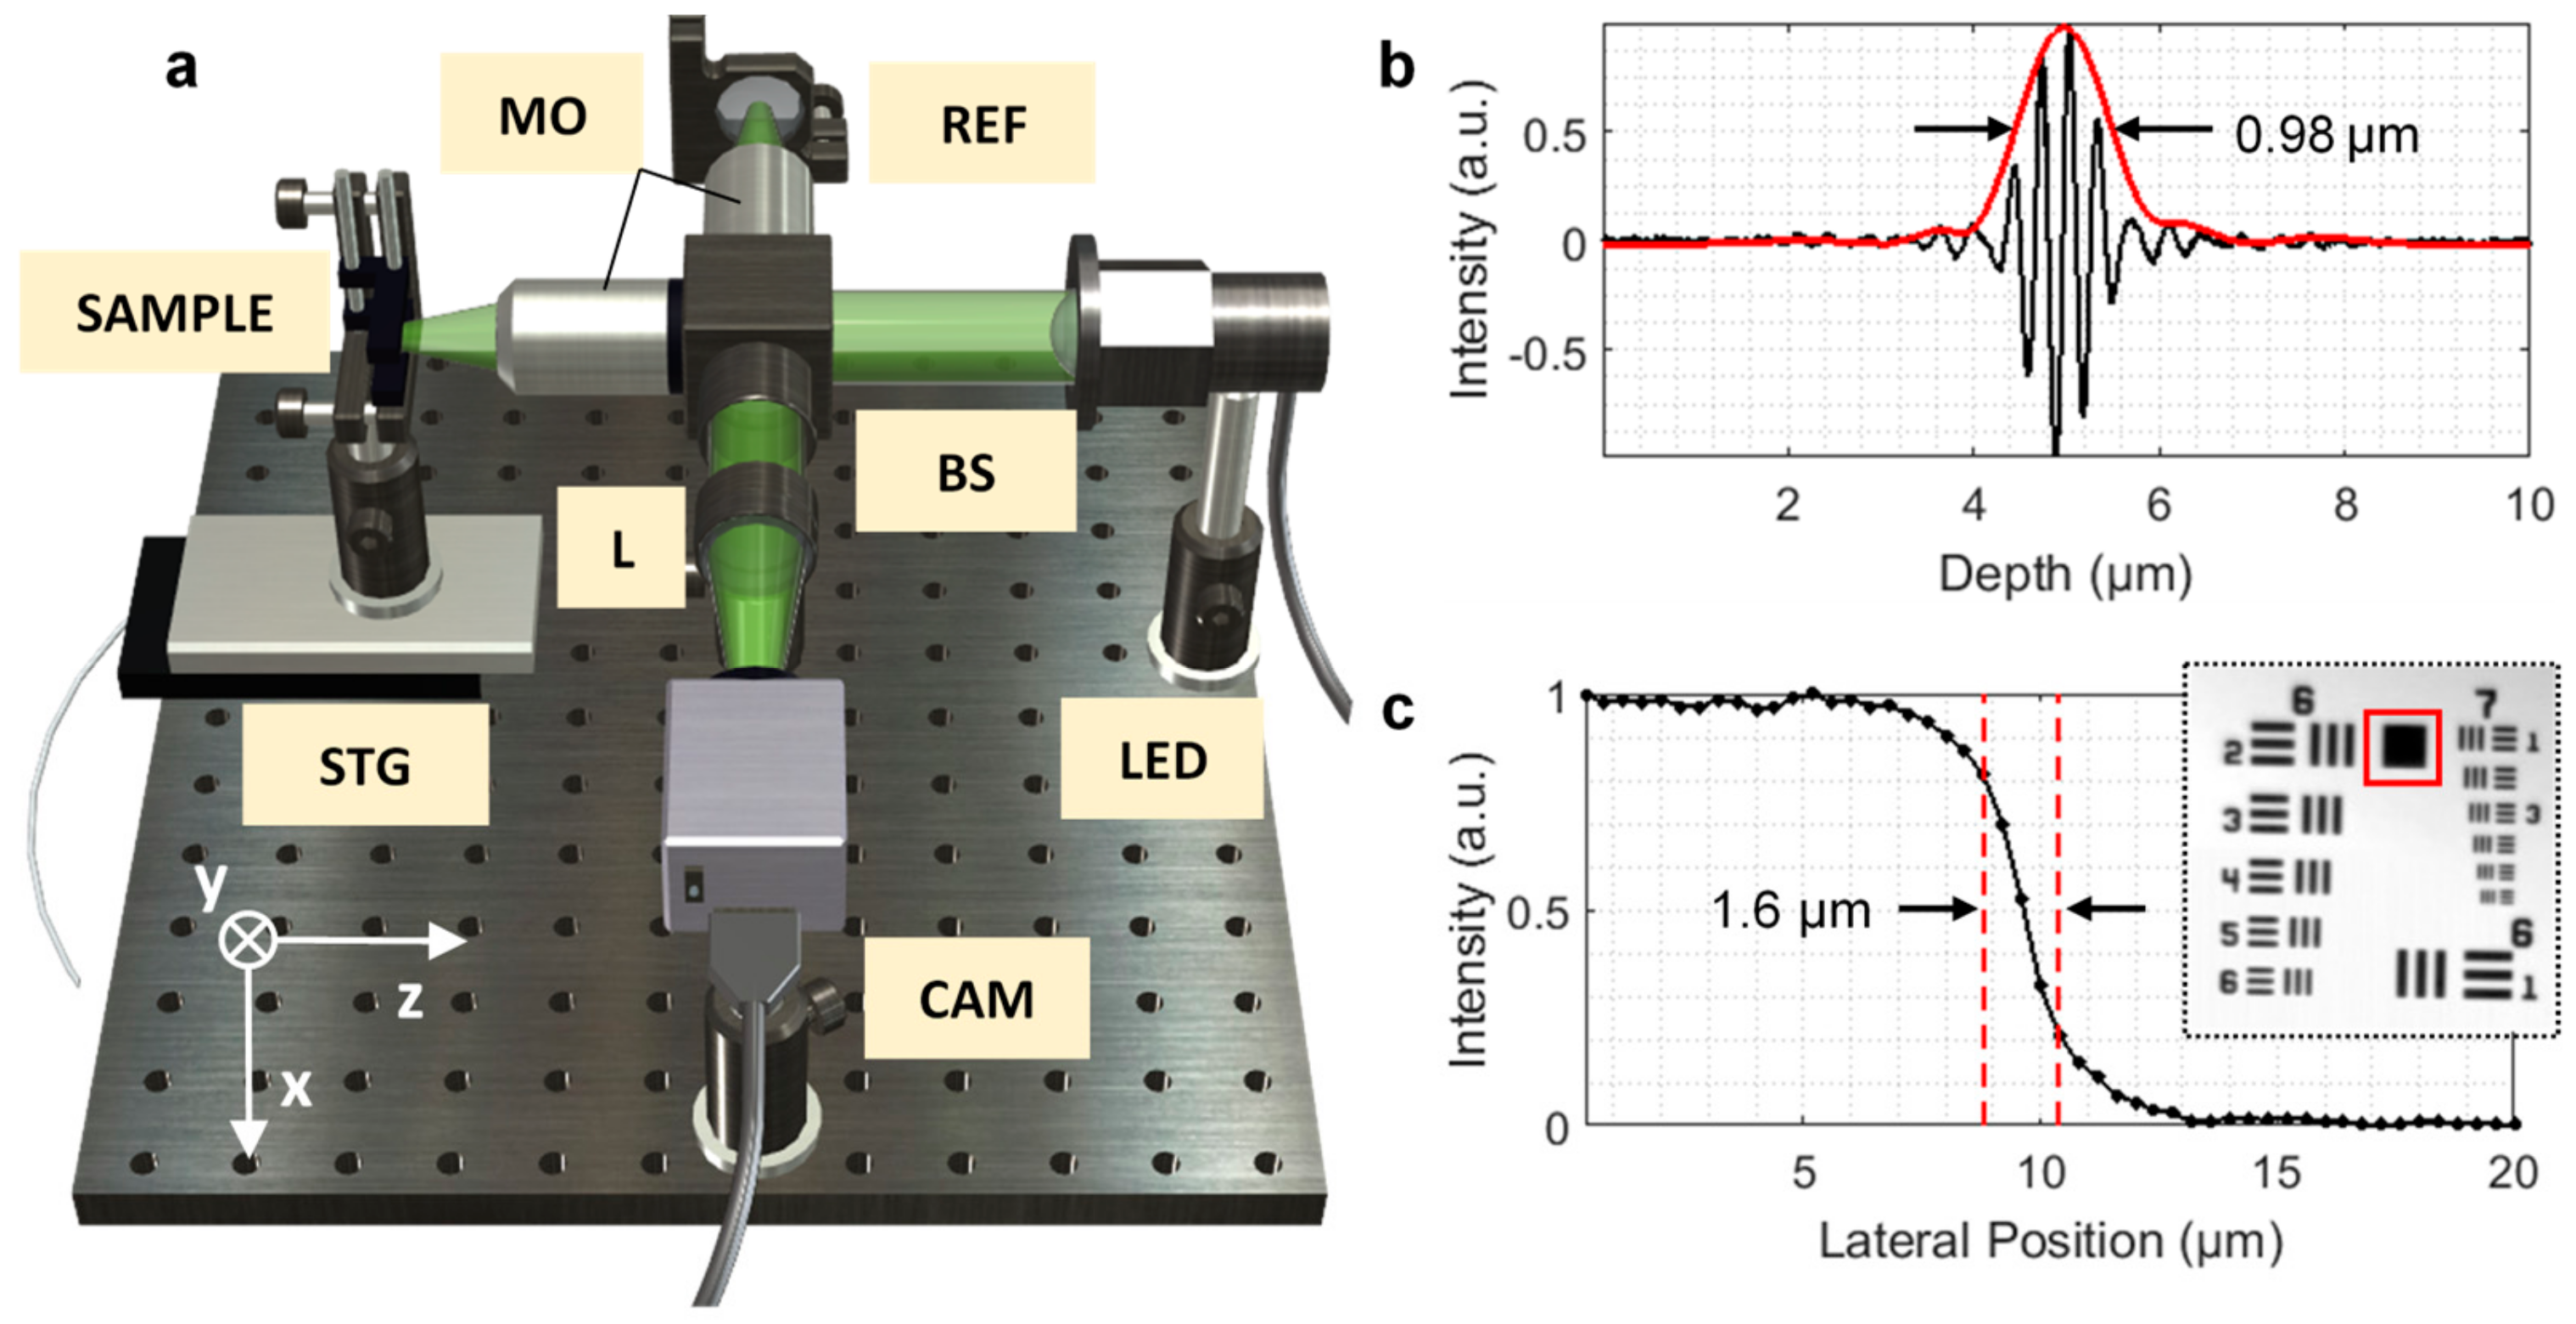
2.1. System Setup and Performance

Figure 1 shows the schematic diagram of the proposed OCT system. Two identical microscope objectives are used in both the sample and reference arms, consisting of Linnik-typed OCT system design. The light from broadband LED light source (Thorlabs) centers at 590 nm and has a full-width at half-maximum (FWHM) of 200 nm, is split into the two interferometric arms by a non-polarizing 50/50 beamsplitter. The back-reflected/scattered light from both the reference and the sample are recombined at the beamsplitter for imaging by an sCMOS camera (Andor Technology) after being focused by a plano-convex lens (100-mm focal length). Due to the low temporal coherence of the broadband LED source, interference will only occur when the optical path lengths between the two interferometric arms are within the coherence length. By translating the sample along the z-axis with a motorized stage (PI MICOS), a train of raw two-dimensional (2D) interferograms at various scanning depths are acquired, yielding a raw three-dimensional (3D) datacube. The theoretical axial resolution is calculated to be approximately 0.77 µm in the air, using Gaussian approximation and practically by measuring a mirror reflection. The intensity profile after normalization is shown in Figure 1b. The achieved axial resolution is approximately 1 µm that is measured from the demodulated envelope signal (red solid line in Figure 1b). The lateral resolution is determined by performing a knife-edge profile. The FWHM taken as the 20%–80% width gives the lateral resolution of 1.6 µm as opposed to 1.25 µm theoretically on a test target (Figure 1c). In comparison with typical superluminescent diode (SLD) sources in the OCT system, LED sources take advantage of broader spectral power distribution. This leads to a higher axial resolution due to its narrower temporal coherence with no difference to the achievable lateral resolution in FF-OCT. In addition, in comparison with thermal sources, LED sources have high energy efficiency and emit light over a limited solid angle, it is, therefore, possible to collect most of the light they emit for illumination [18].
In contrast to the standard time-domain FF-OCT systems where measurements were done using phase stepping and shifting methods [19,20,21,22] that may be affected by environment variations such as vibrations, we used a continuous measurement approach [23]. In this way, the measurement can continuously operate without employing any component to generate phase information for retrieving tomography images. The whole system configuration is therefore similar to the compact arrangement of “vertical scanning interferometer” widely used for measuring surface profiles with demonstrated flexibility in industrial environments [24].

2.2. Paracetamol Tablet Samples

Paracetamol is the most common group of drugs known as simple non-opioid analgesics [25]. In the UK, many pharmaceutical companies manufacture 500-mg paracetamol tablets, which are sold over the counter. In this study, we measured the coating thickness, using the proposed system, of two randomly selected Panadol tablets (denoted by P-S1 and P-S2), two generic paracetamol tablets from Aspar Pharmaceuticals (St Albans, UK) (denoted by A-S1 and A-S2) and Boots Pharmaceuticals (Nottingham, UK) (denoted by B-S1 and B-S2). It should be noted that all the measured paracetamol tablets are sourced directly from over-the-counter UK pharmacy stores. The main API of the three product is 500-mg paracetamol. Opadry white and carnauba wax are used for tablet coating of GSK’s Panadol. We anticipate that the coating serves the purpose of protecting the API against light and moisture.
Table 1 lists the photographs taken from different suppliers’ paracetamol tablet products on 1 × 1 mm2 grid background. Aside from minor physical differences, such as shape, marking, there are no visible differences such as colour or embossing thus making product differentiation difficult. As OCT technique has already shown the capability of analysing pharmaceutical film coatings, it can also be extended to the detection of thin coatings (e.g., coating thickness of less than ten microns), which may aid in product differentiation.

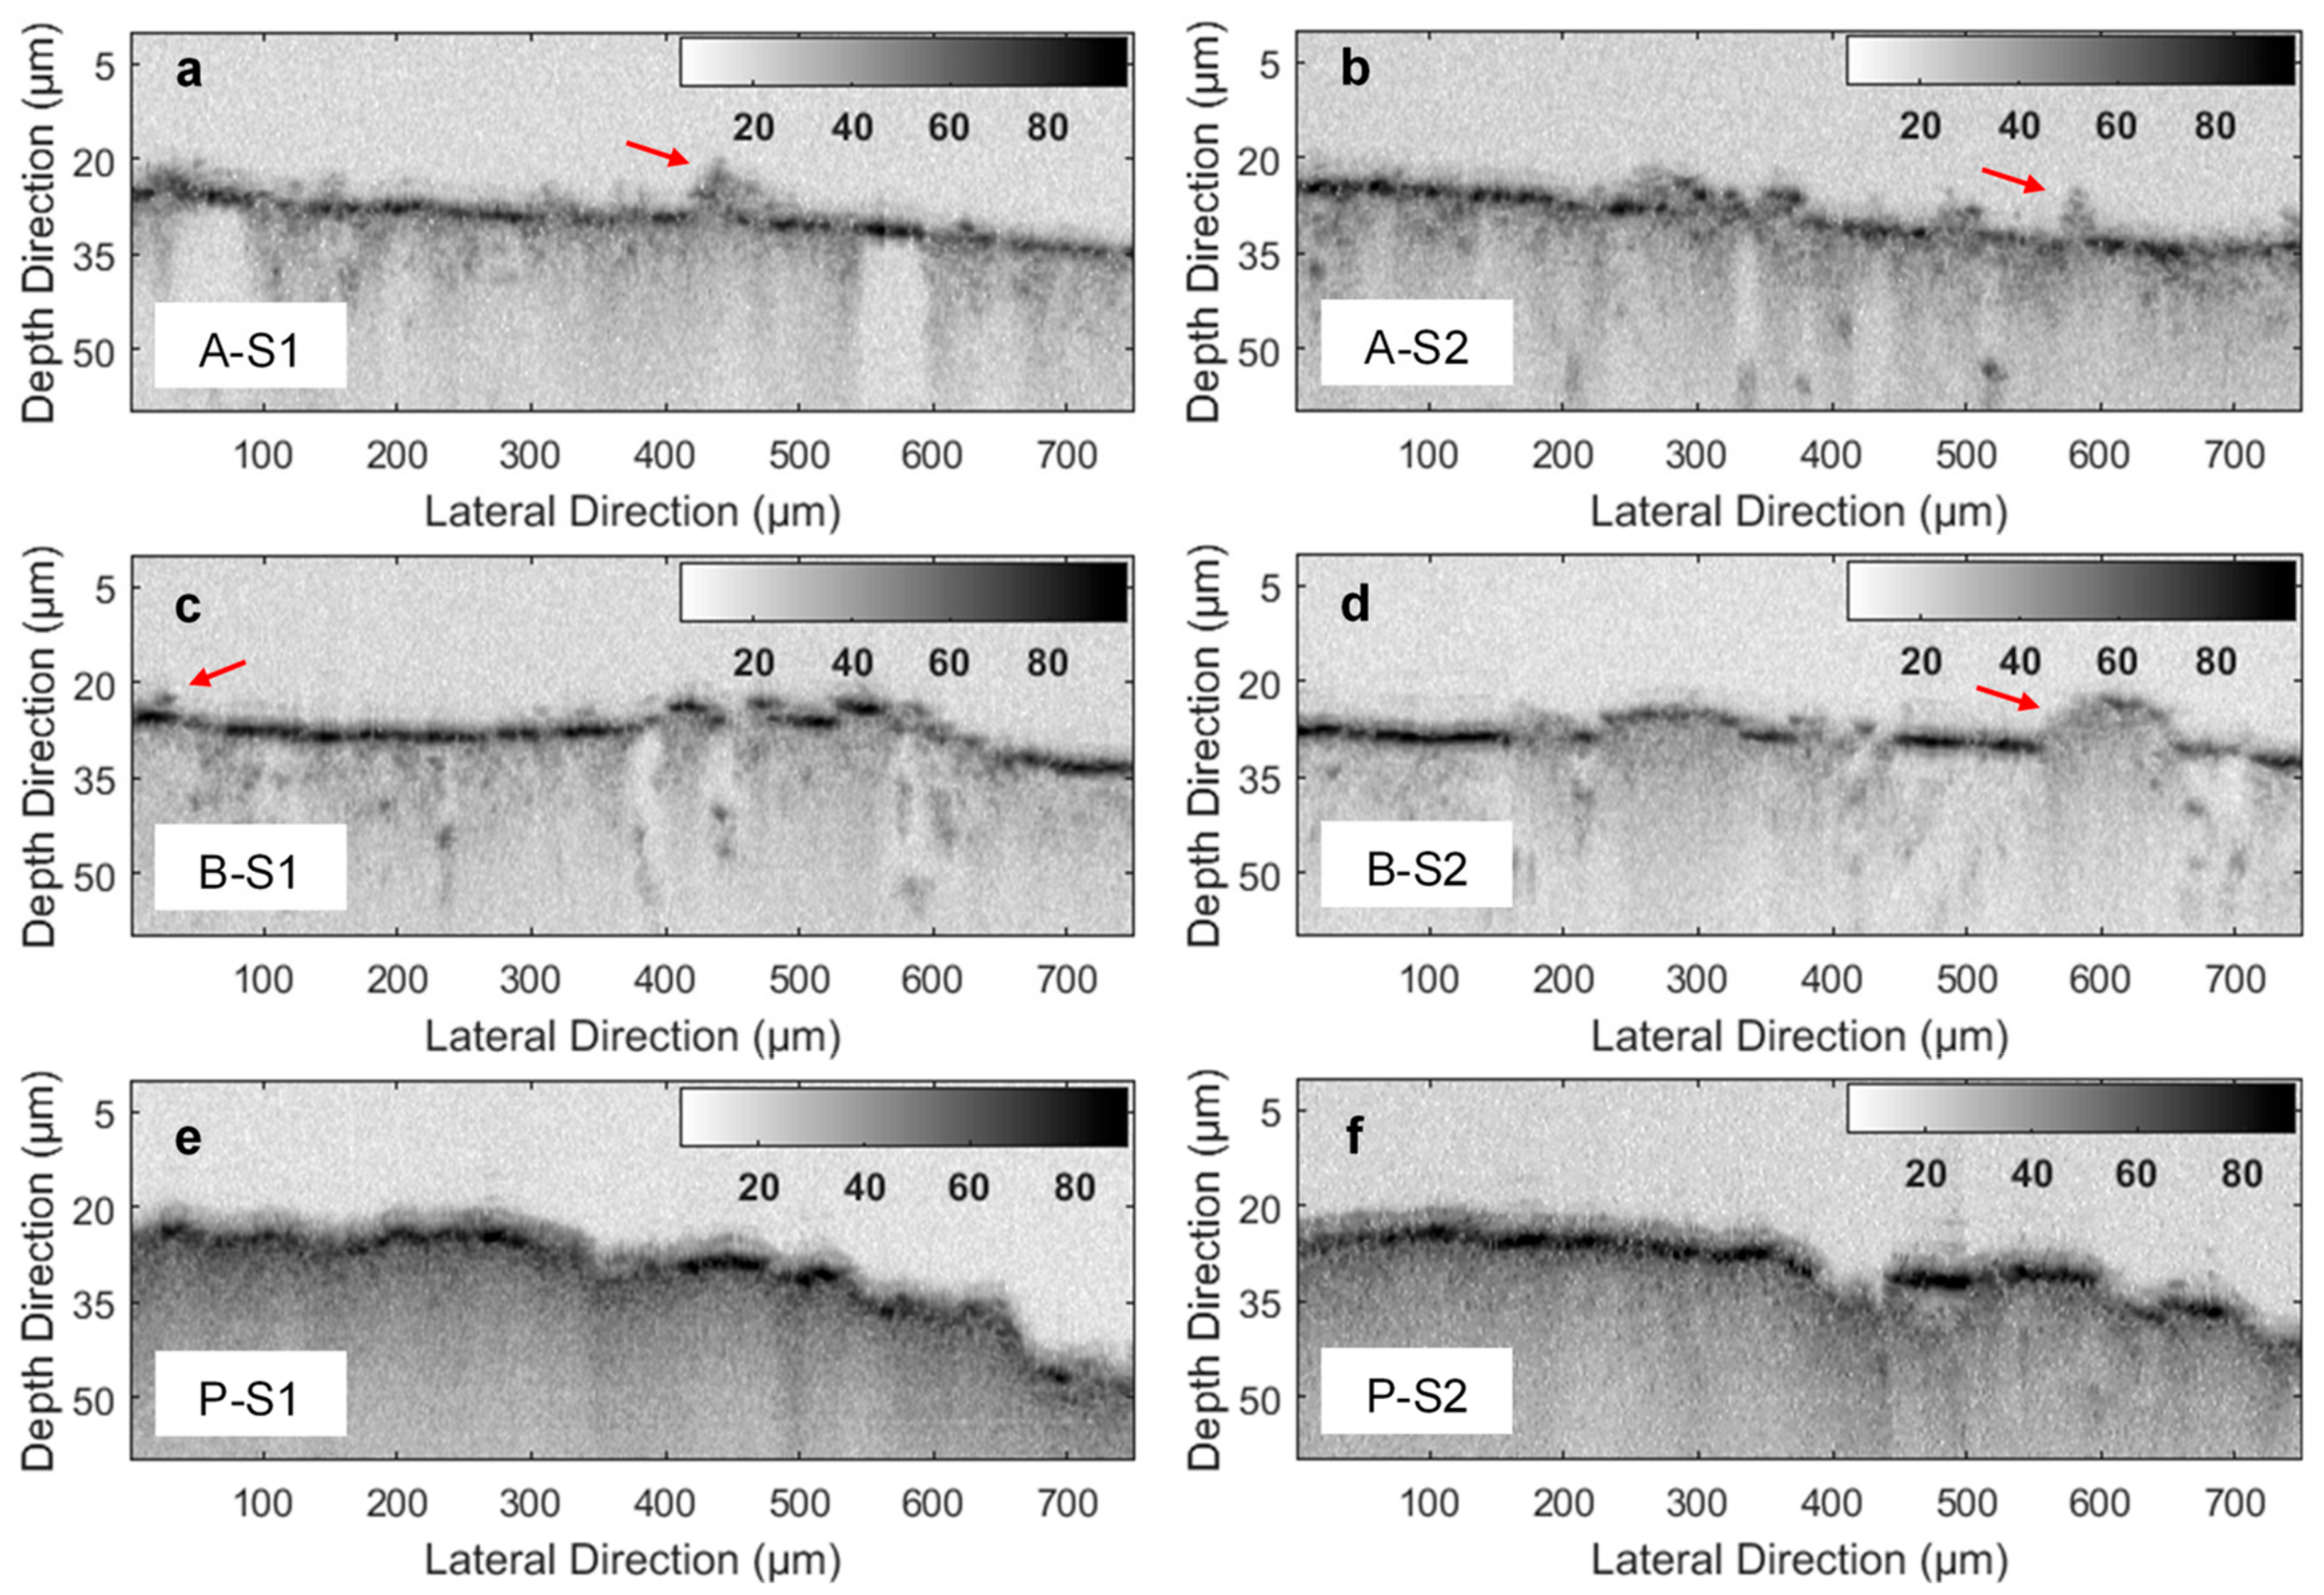
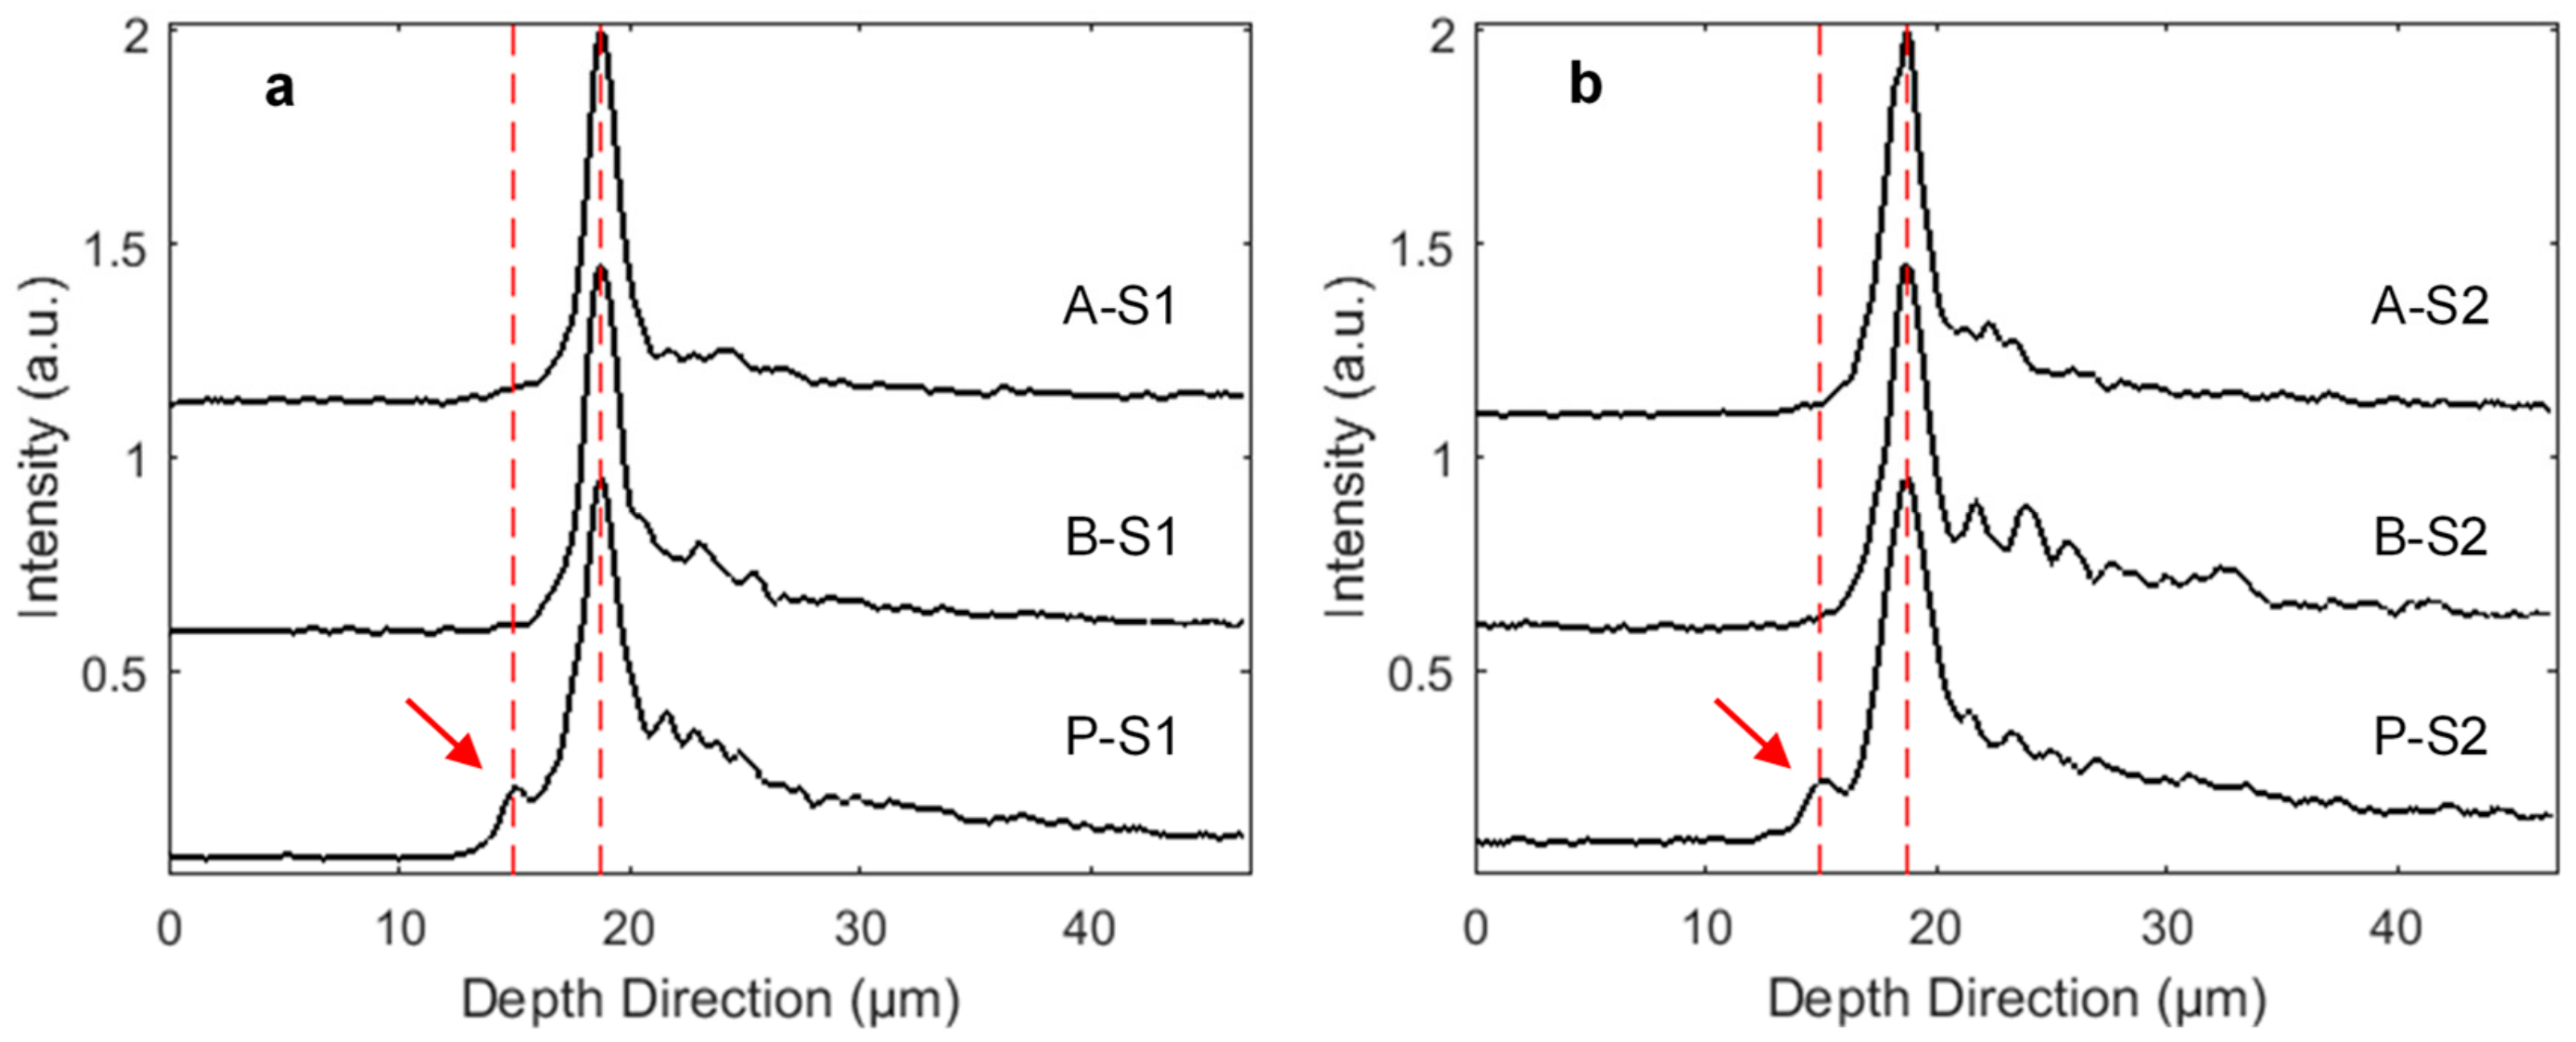
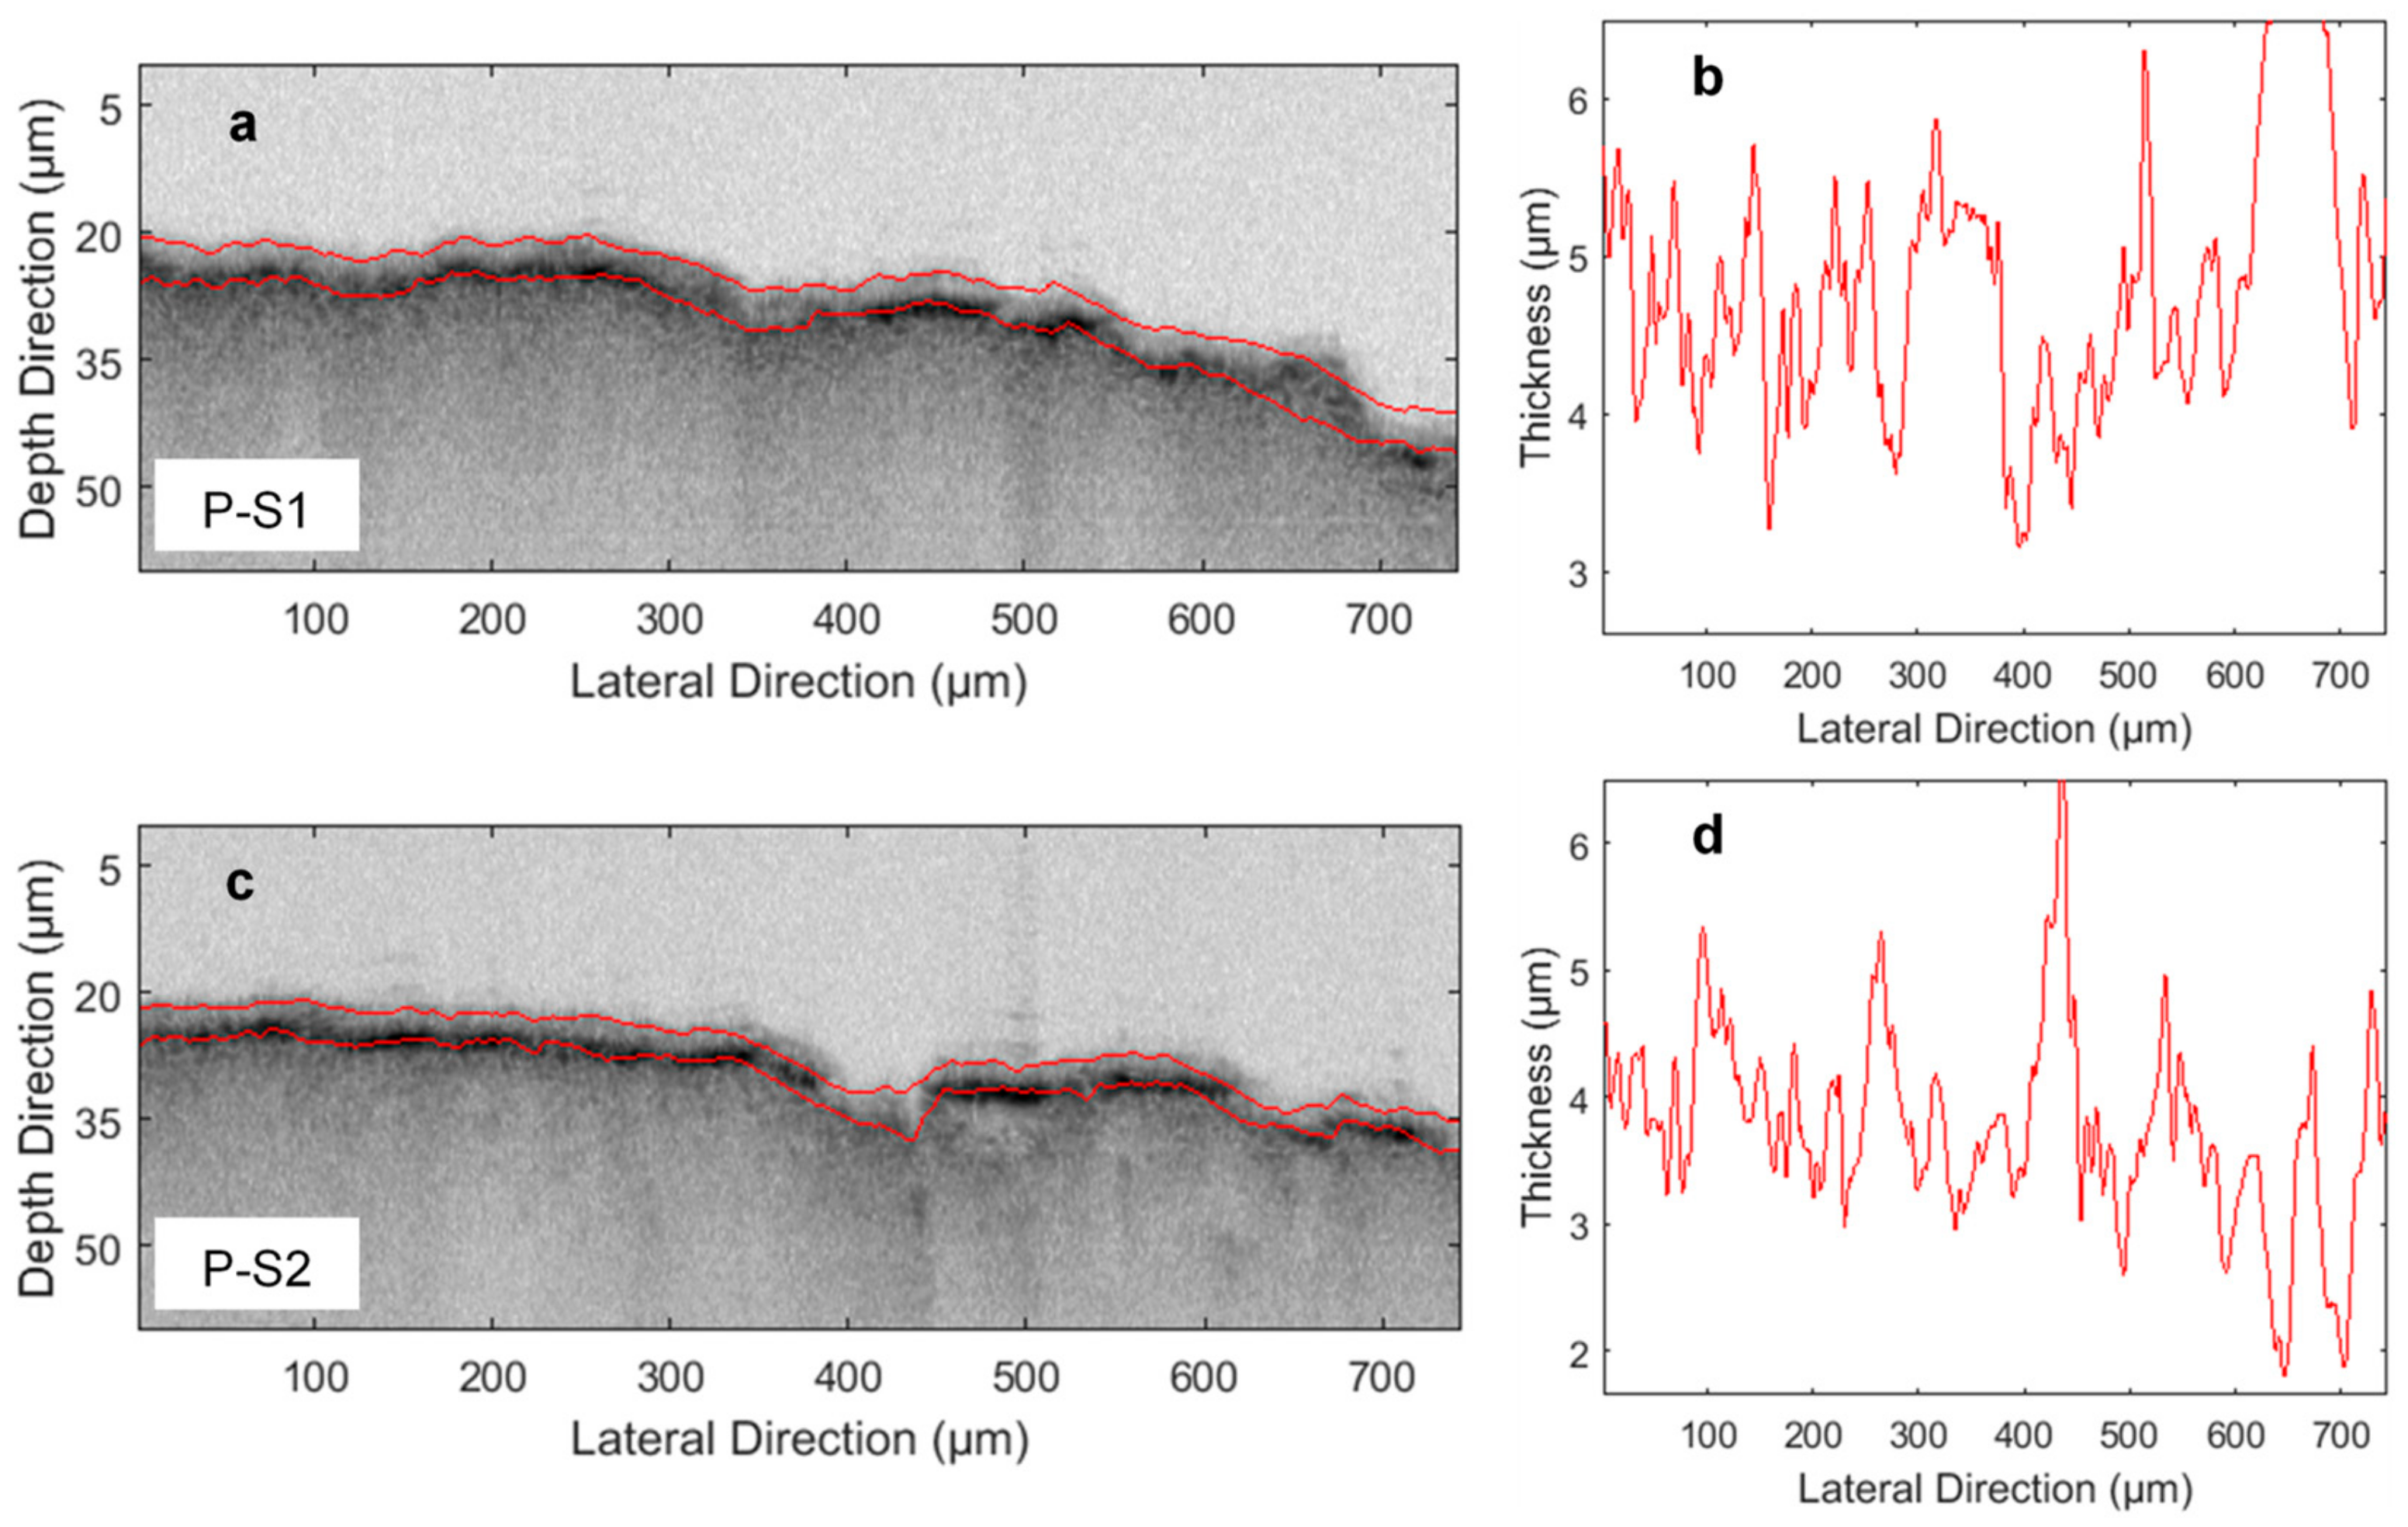
3. Results and Discussion

Measurements on the tablet samples were performed using the proposed UHR OCT system with a scanning distance of 100 µm in air. It should be noted that even though cross-sectional images (B-scans) at the center of the tablets are shown, the system can, in principle, achieve an illumination area of approximately 1-mm diameter. A 3D datacube (size: 10 µm × 750 µm × 100 µm) consisting of 8 raw B-scan data were acquired for each measured tablet. To set a narrow rectangular imaging area, a frame rate of 1000 fps was achieved by the camera, and the total acquisition time for the volumetric data was approximately 10 s. Figure 2 shows the representative B-scan images over the depth range of up to 60 µm for an estimated coating RI of 1.5 when assuming polyvinyl alcohol (PVA) as the coating polymer. From the B-scan images of the generic suppliers shown in Figure 2a–d, there are no resolvable coating structures as opposed to a thin coating layer in the B-scan images of the branded Panadol tablets, shown in Figure 2e,f. The corresponding A-scan waveforms (shown in Figure 3) confirm a weak air/coating interface for branded Panadol but not for generic products. The first peak, in this case, represents air/coating interface followed by a major peak for the coating/tablet core interface. The high lateral resolution of the system can additionally resolve particulates adsorbed to the tablet surface on generics, which are notably absent on the branded product, thus, implying branded products have a smoother surface finish. These observable physical differences, therefore, suggest the presence of a thin coating layer could be used as an indicator to discriminate branded Panadol tablet from generics.
It can be found that the B-scan images (Figure 2) taken from the Panadol tablets show one very weak RI change along the surface, followed by a rather stronger one. The corresponding A-scan waveforms (Figure 3) of going into the tablets confirm the weak air/coating interface as a comparison to the non-coating results from the generic tablets. We speculate that the first peak represents the beginning of the coating, although we currently do not understand why this contrast at the proposed air/coating interface is relatively weak as we would have expected a stronger RI change at this interface. The A-scan waveform, either from generic or branded tablet, demonstrate a similar decay within the tablet core. In addition to scattering encountered, this is also due to the absorption of the imaging beam in accordance with Beer-Lambert law. In contrast, there is no significant decay within the region between the first two peaks in the A-scan waveforms of the Panadol tablets, thus supporting the observed coating structure. As for the imaged coating, a possible reason is that the ingredient/s of the coating material may make it translucent to the imaging beam. In a previous study [12], it has been found that coating semi-transparent for OCT measurement is very much dependent on the pigment type, coating formulation and tablet core properties, as well as the coating process. The coating can become marginally visible to OCT if the coating material only contains talc and pigment. Note that a similar result on coating was also reported previously by Mauritz et al. [7], and further study is still needed to fully explore the underlying mechanism.
As a more thorough illustration of determining tablet coating thickness, we aim to find the boundaries using an automated image segmentation approach. If we restrict our analysis to a single example, we might try methods such as Otsu thresholding. However, such approaches are not reliable for OCT segmentation due to their lack of robustness to noise or variation of contrast within and between images. We, thus, define a fast graph-based image segmentation algorithm to automatically obtain the coating thickness from B-scan images of the Panadol tablets. Here, to detect the weak signal from the air/coating interface, we determine a suitable parametric energy function to describe the edges of the tablet and coating material, taking scattering into account. This energy function calculates a trade-off between gradients and intensity, determined by parameters α i and β . The function is given by
E u x = β i = 1 3 α i α 1 u x x 1 α 2 u x x 2 α 3 u x , x = x 1 , x 2 , x 3
where u x denotes the spatial intensity function, x 1 denotes the depth direction, x 2 and x 3 denote the lateral directions. Two collections of parameters were used to determine the different boundaries; we found α 1 , α 2 , α 3 , β = 10 2 , 10 2 ,   1 , 1 were suitable for finding the tablet-coating interface due to the strong scattering signal found there, and α 1 , α 2 , α 3 , β = 1 , 4 × 10 1 ,   10 2 , 0 for the outer surface of the tablet coating. The image was pre-smoothed with a median filter of window pixel size 7 × 7 0.07 × 5.6   μ m . We then minimized the energy function using a graph-search approach with dynamic programming using a 7 × 7 search region in order to obtain contours across the image which best fit the air/coating and coating/tablet core interfaces. Using this method and the estimated RI (RI = 1.5), mean coating thicknesses of 4.6 µm and 3.5 µm, respectively, were calculated from the B-scans (shown in Figure 4) of the two tablets (PS-1 and PS-2). This is in close agreement with the estimated thickness of approximate 4 µm by using A-scan signal based method [11]. While the results achieved here are excellent, it should be noted that there is potential for future refinement of the approach by extending to three-dimensions or developing an optimisation approach for the trade-off parameters, but that is beyond the scope of this work.

4. Conclusions

In this study, we have developed an UHR OCT system, together with the automatic segmentation and analysis algorithms for imaging pharmaceutical tablet with a thin coating. We have demonstrated the ability and effectiveness of this system, exploiting its 0.98-µm axial resolution to resolve tablet coatings approximately 4-µm thick, thus, allowing us to differentiate GSK’s branded Panadol tablets from generic paracetamol.

Author Contributions

Conceptualization, Y.S.; Methodology, Z.Z. and Y.S.; Software, Z.Z. and B.W.; Validation, Z.Z.; Formal analysis, Z.Z., B.W. and H.L.; Investigation, Z.Z. and B.W.; Resources, Z.Z., B.W., Y.Z. and Y.S.; Data curation, Z.Z. and B.W.; Writing—original draft preparation, Z.Z. and H.L.; Writing—review and editing, Z.Z., H.L., B.W., Y.Z. and Y.S.; Visualization, Z.Z. and B.W.; Supervision, Y.S., Y.Z. and H.L.; Project administration, Y.S.; Funding acquisition, Y.S. and Y.Z.

Funding

This work is partly supported by the UK EPSRC Research Grant No. EP/L019787/1 and EP/R014094/1.

Acknowledgments

H.L. also acknowledges financial support from EP/R019460/1.

Conflicts of Interest

The authors declare no conflict of interest.

References

  1. Jantzen, G.M.; Robinson, J.R. Sustained-and controlled-release drug delivery systems. In Modern Pharmaceutics, 4th ed.; Banker, G.S., Rhodes, C.T., Eds.; Marcel Dekker: New York, NY, USA, 2002; pp. 501–528. [Google Scholar]
  2. Kirsch, J.D.; Drennen, J.K. Near-infrared spectroscopic monitoring of the film coating process. Pharm. Res. 1996, 13, 234–237. [Google Scholar] [CrossRef]
  3. Romero-Torres, S.; Pérez-Ramos, J.D.; Morris, K.R.; Grant, E.R. Raman spectroscopic measurement of tablet-to-tablet coating variability. J. Pharm. Biomed. Anal. 2005, 38, 270–274. [Google Scholar] [CrossRef]
  4. Djemai, A.; Sinka, I. NMR imaging of density distributions in tablets. Int. J. Pharm. 2006, 319, 55–62. [Google Scholar] [CrossRef] [PubMed]
  5. Wray, P.; Chan, K.L.; Kimber, J.; Kazarian, S.G. Compaction of pharmaceutical tablets with different polymer matrices studied by FTIR imaging and X-ray microtomography. J. Pharm. Sci. 2008, 97, 4269–4277. [Google Scholar] [CrossRef]
  6. Shen, Y.C.; Taday, P.F. Development and application of terahertz pulsed imaging for nondestructive inspection of pharmaceutical tablet. IEEE J. Sel. Top. Quantum Electron. 2008, 14, 407–415. [Google Scholar] [CrossRef]
  7. Mauritz, J.M.; Morrisby, R.S.; Hutton, R.S.; Legge, C.H.; Kaminski, C.F. Imaging pharmaceutical tablets with optical coherence tomography. J. Pharm. Sci. 2010, 99, 385–391. [Google Scholar] [CrossRef]
  8. Ho, L.; Müller, R.; Gordon, K.C.; Kleinebudde, P.; Pepper, M.; Rades, T.; Shen, Y.C.; Taday, P.F.; Zeitler, J.A. Terahertz pulsed imaging as an analytical tool for sustained-release tablet film coating. Eur. J. Pharm. Biopharm. 2009, 71, 117–123. [Google Scholar] [CrossRef] [PubMed]
  9. Zeitler, J.A.; Shen, Y.C.; Baker, C.; Taday, P.F.; Pepper, M.; Rades, T. Analysis of coating structures and interfaces in solid oral dosage forms by three dimensional terahertz pulsed imaging. J. Pharm. Sci. 2007, 96, 330–340. [Google Scholar] [CrossRef]
  10. Huang, D.; Swanson, E.A.; Lin, C.P.; Schuman, J.S.; Stinson, W.G.; Chang, W.; Hee, M.R.; Flotte, T.; Gregory, K.; Puliafito, C.A. Optical coherence tomography. Science 1991, 254, 1178–1181. [Google Scholar] [CrossRef] [PubMed] [Green Version]
  11. Lin, H.; Dong, Y.; Shen, Y.C.; Zeitler, J.A. Quantifying pharmaceutical film coating with optical coherence tomography and terahertz pulsed imaging: an evaluation. J. Pharm. Sci. 2015, 104, 3377–3385. [Google Scholar] [CrossRef]
  12. Lin, H.; Dong, Y.; Markl, D.; Zhang, Z.J.; Shen, Y.C.; Zeitler, J.A. Pharmaceutical film coating catalog for spectral domain optical coherence tomography. J. Pharm. Sci. 2017, 106, 3171–3176. [Google Scholar] [CrossRef] [PubMed]
  13. Lin, H.; Dong, Y.; Markl, D.; Williams, B.M.; Zheng, Y.L.; Shen, Y.C.; Zeitler, J.A. Measurement of the intertablet coating uniformity of a pharmaceutical pan coating process with combined terahertz and optical coherence tomography in-line sensing. J. Pharm. Sci. 2017, 106, 1075–1084. [Google Scholar] [CrossRef]
  14. Markl, D.; Hannesschläger, G.; Sacher, S.; Leitner, M.; Khinast, J.G. Optical coherence tomography as a novel tool for in-line monitoring of a pharmaceutical film-coating process. Eur. J. Pharm. Sci. 2014, 55, 58–67. [Google Scholar] [CrossRef]
  15. Markl, D.; Zettl, M.; Hannesschläger, G.; Sacher, S.; Leitner, M.; Buchsbaum, A.; Khinast, J.G. Calibration-free in-line monitoring of pellet coating processes via optical coherence tomography. Chem. Eng. Sci. 2015, 125, 200–208. [Google Scholar] [CrossRef]
  16. Li, C.; Zeitler, J.A.; Dong, Y.; Shen, Y.C. Non-destructive evaluation of polymer coating structures on pharmaceutical pellets using full-field optical coherence tomography. J. Pharm. Sci. 2014, 103, 161–166. [Google Scholar] [CrossRef] [PubMed]
  17. Zhong, S.C.; Shen, Y.C.; Ho, L.; May, R.K.; Zeitler, J.A.; Evans, M.; Taday, P.F.; Pepper, M.; Rades, T.; Gordon, K.C. Non-destructive quantification of pharmaceutical tablet coatings using terahertz pulsed imaging and optical coherence tomography. Opt. Lasers Eng. 2011, 49, 361–365. [Google Scholar] [CrossRef] [Green Version]
  18. Ogien, J.; Dubios, A. High-resolution full-field optical coherence microscopy using a broadband light-emitting diode. Opt. Express 2016, 24, 9922–9931. [Google Scholar] [CrossRef] [PubMed]
  19. Dubois, A.; Grieve, K.; Moneron, G.; Lecaque, R.; Vabre, L.; Boccara, A.C. Ultrahigh-resolution full-field optical coherence tomography. Appl. Opt. 2004, 43, 2874–2883. [Google Scholar] [CrossRef]
  20. Dubois, A.; Vabre, L.; Boccara, A.C.; Beaurepaire, E. High-resolution full-field optical coherence tomography with a Linnik microscope. Appl. Opt. 2002, 41, 805–812. [Google Scholar] [CrossRef] [PubMed]
  21. Akiba, M.; Chan, K.; Tanno, N. Full-field optical coherence tomography by two-dimensional heterodyne detection with a pair of CCD cameras. Opt. Lett. 2003, 28, 816–818. [Google Scholar] [CrossRef]
  22. Sato, M.; Nagata, T.; Niizuma, T.; Neagu, L.; Dabu, R.; Watanabe, Y. Quadrature fringes wide-field optical coherence tomography and its applications to biological tissues. Opt. Commun. 2007, 271, 573–580. [Google Scholar] [CrossRef]
  23. Zhang, Z.J.; Ikpatt, U.; Lawman, S.; Williams, B.; Zheng, Y.L.; Lin, H.; Shen, Y.C. Sub-surface imaging of soiled cotton fabric using full-field optical coherence tomography. Opt. Express 2019, 27, 13951–13964. [Google Scholar] [CrossRef]
  24. Tay, C.; Quan, C.; Li, M. Investigation of a dual-layer structure using vertical scanning interferometry. Opt. Lasers Eng. 2007, 45, 907–913. [Google Scholar] [CrossRef]
  25. Prescott, L.F. Paracetamol: Past, present, and future. Am. J. Ther. 2000, 7, 143–147. [Google Scholar] [CrossRef]
Figure 1. Ultra-high-resolution (UHR) optical coherence tomography (OCT) imaging system. (a) Schematic diagram: LED—broadband light-emitting diode (LED) light source; BS—beamsplitter; MOs—microscope objectives; Ref—reference mirror; L—plano-convex lens; STG—translation stage; CAM—sCMOS camera; (b) Measured axial response (black solid line) and its corresponding tomography signal (red solid line), the achieved axial resolution is 0.98 µm. (c) Edge response of the square test pattern between target 6th and 7th group of a standard test target USAF 1951 (insert picture), the achieved lateral resolution is 1.6 µm
Coatings 09 00326 g001
Figure 2. Representative OCT cross-sectional images (B-scan). (a) & (b), (c) & (d) B-scan images of two generic paracetamol tablets from Aspar (A-S1 and A-S2) and Boots (B-S1 and B-S2), respectively. Red arrows denote particulates on the tablet surface. (e) & (f) B-scan images of two GlaxoSmithKline (GSK) branded Panadol tablets (P-S1 and P-S2), where a thin ghostly layer can be resolved.
Coatings 09 00326 g002
Figure 3. Representative tomography signals (A-scans). (a) A-scan waveforms of generic paracetamol samples (A-S1 and B-S1) and GSK’s Panadol sample (P-S1). (b) A-scan waveforms of paracetamol samples (A-S2 and B-S2) and GSK’s Panadol sample (P-S2). The red dotted lines denote the characteristic peaks, and the distance between them is proportional to coating thickness.
Coatings 09 00326 g003
Figure 4. Coating thickness analysis using segmentation on the B-scan images of the GSK’s Panadol tablet samples, P-S1 (a) and P-S2 (c). The detected air/coating and coating/tablet core interfaces are highlighted in red. (b) and (d) are their corresponding coating thickness distribution histograms.
Coatings 09 00326 g004
Table 1. Paracetamol tablets from different suppliers.
Paracetamol SuppliersFront SideBack Side
ASPAR Coatings 09 00326 i001 Coatings 09 00326 i002
Boots Coatings 09 00326 i003 Coatings 09 00326 i004
GSK (branded) Coatings 09 00326 i005 Coatings 09 00326 i006

