Article

Structure and Conductivity Studies of Scandia and Alumina Doped Zirconia Thin Films

by
Mantas Sriubas
1,
Nursultan Kainbayev
1,2,
Darius Virbukas
1,
Kristina Bočkutė
1,*,
Živilė Rutkūnienė
1 and
Giedrius Laukaitis
1
1
Physics Department, Kaunas University of Technology, Studentu str. 50, LT-51368 Kaunas, Lithuania
2
Department of Thermal Physics and Technical Physics, Al-Farabi Kazakh National University, 71 Al-Farabi Ave., 050040 Almaty, Kazakhstan
*
Author to whom correspondence should be addressed.
Coatings 2019, 9(5), 317; https://doi.org/10.3390/coatings9050317
Submission received: 22 March 2019 / Revised: 2 May 2019 / Accepted: 8 May 2019 / Published: 12 May 2019

Abstract

:
In this work, scandia-doped zirconia (ScSZ) and scandia–alumina co-doped zirconia (ScSZAl) thin films were prepared by electron beam vapor deposition. X-ray diffraction (XRD) results indicated a presence of ZrO2 cubic phase structure, yet Raman analysis revealed the existence of secondary tetragonal and rhombohedral phases. Thus, XRD measurements were supported by Raman spectroscopy in order to comprehensively analyze the structure of formed ScSZ and ScSZAl thin films. It was also found that Al dopant slows down the formation of the cubic phase. The impedance measurements affirmed the correlation of the amount of secondary phases with the conductivity results and nonlinear crystallite size dependence.

1. Introduction

Zirconium oxide-based materials have been extensively studied for a few decades as electrolytes and fulfill almost all requirements: high oxide ion conductivity (0.1–0.01 S/cm), low electronic conductivity, chemical stability, mechanical strength, and low cost [1].
Pure ZrO2, due to its low number of vacancies, has a low specific ionic conductivity and has a monoclinic structure, and up to 1170 °C does not exhibit high ionic conductivity. The highly-conductive cubic phase forms only at 2370 °C [2]. A tetragonal phase exists in the middle-temperature range (1170–2370 °C). The monoclinic–tetragonal (m → t) phase transition is produced by a condensation of two phonons at point M of the Brillouin zone of the tetragonal phase (P42/nmc) and the tetragonal–cubic (t → c) phase transition is produced by a condensation of phonons at point X of the Brillouin zone of the cubic phase (Fm3m) [3,4].
To improve ionic conductivity and stabilize the cubic lattice at low temperatures, zirconia is doped with trivalent or bivalent elements, such as Ca, Mg, Y, and Sc, etc. [5,6]. The stabilization process can be explained by crystal chemistry, i.e., oxygen vacancies associated with Zr can provide stability for cubic zirconia. Vacancies introduced by the oversized dopants are located as the nearest neighbors to the Zr atoms, leaving the eightfold coordination to dopant cations. Undersized dopants compete with Zr ions for oxygen vacancies in zirconia, resulting in six-fold oxygen coordination and a large disturbance to the surrounding next nearest neighbors [7,8,9].
Scandia-doped zirconia (ScSZ) is considered the most suitable material at intermediate temperatures because it has much higher ionic conductivity than yttria-doped zirconia [10]. However, four different phases can be observed below 600 °C for ScSZ systems depending on the concentration of Sc2O3, i.e., cubic-tetragonal (5–7 mol %), cubic (8–9 mol %), and rhombohedral (10–15 mol %) [7,11]. Transitions between the highly conductive cubic phase and tetragonal or rhombohedral phases cause an abrupt decrease in ionic conductivity and suspend the application of ScSZ for intermediate temperature solid oxide fuel cells (IT-SOFC) [7,12]. Co-doping can be a possible solution. Adding dopants like CeO2, Bi2O3, Al2O3, and etc., has already been attempted [13,14,15]. Results vary for different dopants. Mostly, the cubic phase has been mixed with other phases (rhombohedral, monoclinic, or tetragonal) except for co-doping 0.5 mol % of Al2O3. It has been demonstrated that 0.5 mol % of Al2O3 stabilizes the cubic phase of ScSZ to room temperature [13]. The mechanism of cubic phase stabilization is not well known. It has been suggested that the strain in the crystalline, which is induced by adding a secondary dopant with a different radius to the Sc3+, is involved [13,16]. However, this research was based only on the X-ray diffraction (XRD) method, which cannot fully prove the existence of a fully stabilized cubic structure. In a mixture of phases, XRD peaks of the main cubic phase and secondary phases (tetragonal and rhombohedral phases) can overlap and the presence of secondary phases is not reflected ine XRD analysis [17], indicating that XRD analysis should be supported by an additional characterization method, e.g., Raman spectroscopy. Raman spectroscopy is a powerful analysis tool used to study the fundamental vibrational characteristics of molecules and is very sensitive to phase changes in the material. It can provide information about the phase, the chemical composition of the material, and oxygen vacancies [18,19]. Light scattering occurs and a small percentage of the scattered light may be shifted in frequency when monochromatic light is incident on the material. This frequency shift of the Raman scattered light is directly related to the structural properties of the material. The change in the phonon frequency of the vibrational mode will be produced in the presence of discontinuation of translational symmetry in the crystalline material due to the doping and secondary phases. It is known that the wavenumber of the vibrational modes follows a linear relationship with chemical composition as well as with strain induced in the crystalline lattice [20]. In the case of phase transformation of ZrO2, Raman spectroscopy can determine the change of the bond length and the angle between cation and anion [21]. Based on the reports of other authors, monoclinic [12,18,22], tetragonal [15,21,22,23,24], rhombohedral [12,24], and cubic [12,15,18,24] phases can be identified from Raman spectra for ZrO2. Moreover, the great majority of investigations analyzing co-doping of ScSZ have been focused on the powders and pellets. The properties and phase transitions of co-doped ScSZ thin films have not been studied enough. Thin films can be formed using a variety of deposition techniques, such as screen printing [25], wet powder spraying [26], and electrostatic spray deposition [27], etc. Electron beam vapor deposition allows producing a dense and homogenous thin film with a strictly controllable thin film growing process during the deposition [28]. Furthermore, it is a particularly appropriate formation method for ceramic thin films, which are distinguished by their high melting temperature. In e-beam evaporation, Sc-doped and Sc and Al co-doped ZrO2 evaporate by partial dissociation [29,30,31], causing the different structure and crystallographic phases of the formed thin films than powders. In this paper, the structure and ionic conductivity of thin ScSZ and scandium alumina stabilized zirconia films (ScAlSZ) are analyzed using XRD, energy dispersive X-ray spectrsoscopy (EDS), Raman, and electrochemical impedance spectroscopy (EIS) methods.

2. Materials and Methods

ScSZ and ScAlSZ thin films were formed using an e-beam physical vapor deposition system (Kurt J. Lesker EB-PVD 75, Hastings, UK). The formation was carried out on crystalline Alloy 600 (Fe-Ni-Cr) and polycrystalline Al2O3 substrates using deposition rates from 0.2 to 1.6 nm/s in steps of 0.2 nm/s. The thickness (~1500 nm) and deposition rate were controlled with an INFICON (Inficon, Bad Ragaz, Switzerland) crystal sensor. The temperature of substrates was changed from room temperature (20 °C) to 600 °C temperature. In order to get a homogenous thin film, substrates were rotated at 8 rpm speed. The acceleration voltage of the electron gun was kept at a constant of 7.9 kV and the required deposition rate was achieved by adjusting the e-beam current in the range of 60–100 mA. An initial pressure of ~2.0 × 10⁻⁴ Pa and working pressure of ~2.0 × 10⁻² Pa was used in the vacuum chamber during the experiments. The substrates were cleaned in an ultrasonic bath and treated in Ar+ ion plasma for 10 min before deposition. The powders of (Sc2O3)0.10(ZrO2)0.90 (ScSZ) and (Sc2O3)0.10(Al2O3)0.01(ZrO2)0.89 (ScSZAl) (Nexceris, LLC, Fuelcellmaterials, Lewis Center, OH, USA) were pressed into pellets and used as evaporating material. Pellets were evaporated using a single e-beam configuration. Elemental analysis was performed using energy-dispersive X-ray spectroscopy (EDS, BrukerXFlash QUAD 5040, Bruker AXS GmbH, Karlsruhe, Germany) and the atomic ratios of Sc, Al, and Zr are presented in Table 1.
The crystallographic nature of the formed thin films was determined using XRD (D8 Discover (Bruker AXS GmbH, Billerica, MA, USA) standard Bragg focusing geometry with Cu Kα1 (λ = 0.154059 nm) radiation, 0.01° step, and Lynx eye PSD detector). Rietveld analysis was performed to calculate ratios of cubic and rhombohedral phases in the ScSZAl thin films. The refinement was conducted with isotropic atomic thermal parameters [32]. The size of the crystallites and lattice constants were estimated with the software Topas 4-1. The Pawley method was used to fit XRD patterns and the crystallite size was estimated using the Scherrer equation [33].
Raman scattering measurements were performed using the Raman microscope inVia (Renishaw, Gloucestershire, UK). The excitation beam from a diode laser of 532 nm wavelength was focused on the sample using a 50× objective (NA = 0.75, Leica, Wetzlar, Germany) and the diameter of the laser spot was 4 μm. Laser power at the sample surface varied from 1.75 to 3.5 mW. The integration time was 15–30 s and the signal was accumulated five times and then averaged. The Raman Stokes signal was dispersed with a diffraction grating (2400 grooves/mm) and data was recorded using a Peltier cooled charge-coupled device (CCD) detector (Renishaw, Gloucestershire, UK) (1024 × 256 pixels). This system yields a spectral resolution of about 1 cm−1. Silicon was used to calibrate the Raman setup for both the Raman wavenumber and spectral intensity. Positions of Raman peaks were determined by fitting the data to the Lorentz line shape using a peak fit option in OriginPro 2016 software. The phase ratio was calculated using the formula [18]
ϑ C = I C I C + I t + I β
where Ic, It, and Iβ are the scattering intensity of cubic (~620 cm−1), tetragonal (~473 cm−1), and rhombohedral (~557 cm−1) Raman modes, respectively.
Electrical characterization and impedance spectroscopy measurements were performed using a Probostat® (NorECs AS, Oslo, Norway) measurement cell in the frequency range 1–106 Hz and a 200–1000 °C temperature interval. Electrodes of the geometry 3 mm × 10 mm (L × B) were made of Pt ink and applied on top of the thin films using a mask reproducing the geometry of the electrodes (the two-probe method). The total conductivity was calculated according to:
σ = L e R s A = L e R s h l e
where Le is the distance between the Pt electrodes, Rs is the resistance obtained from the impedance spectra, A is the cross-sectional area, h is the thickness of the thin films, and le is the length of the electrodes.

3. Results

XRD measurements revealed that ScSZ and ScSZAl powders have a mixture of ZrO2 rhombohedral (JCPSD No. 01-089-5482) and monoclinic (JCPSD No. 01-089-5474) phases (Figure 1a). It can be seen that the prevailing phase is rhombohedral, showing sharp (003), (101), (012), (104), (110), (015), (11-3), (021), (006), and (202) peaks. Raman spectra of investigated powders are in good agreement with the XRD results (Figure 1b). The peaks detected at 147, 148, 176, 190, 191, 259, 260, 315, 321, 384, 386, 422, 471, 473, 507, 517, 552, 554, 585, 597, and 640 cm−1, and around 800–1100 cm−1 showing a polymorphism of ZrO2, can be assigned to monoclinic, tetragonal, and rhombohedral phases. The peaks at 507–517, 552–554, 585, and 597 cm−1 belong to the β-rhombohedral phase [12], the peaks at 147–148, 259–260, 315–321, 384–386, 422, 547, 551, and 640 cm−1 are indicative of the tetragonal phase and the peaks at 176, 190, 191, and 469–473 cm−1 belong to the monoclinic phase [18,22]. Peaks observed above 800 cm−1 correspond to the second-order active Raman modes wave numbers combination [34]. The Raman spectra of cubic zirconia should consist of a weak broad line peak assigned to a single Raman mode F2g symmetry centered between 605 and 630 cm−1. Peaks corresponding to the cubic phase of ZrO2 were not observed in Raman spectra of the powders [12,15,18,21,24]. The obtained results agree with the results of other authors [24,35]. The material should have a rhombohedral structure if the Sc2O3 concentration is above 9% [5,11]. Raman peaks corresponding to the tetragonal phase (Figure 1b) indicate that the tetragonal structure is deformed and is predominant mostly at the grain boundary [15].
It is known that ZrO2 evaporates by partial decomposition during e-beam evaporation process [29,31]:
ZrO2(s) = ZrO2(g)
ZrO2(s) = ZrO(g) + O(g)
ZrO2(s) = Zr(g) + O2(g)
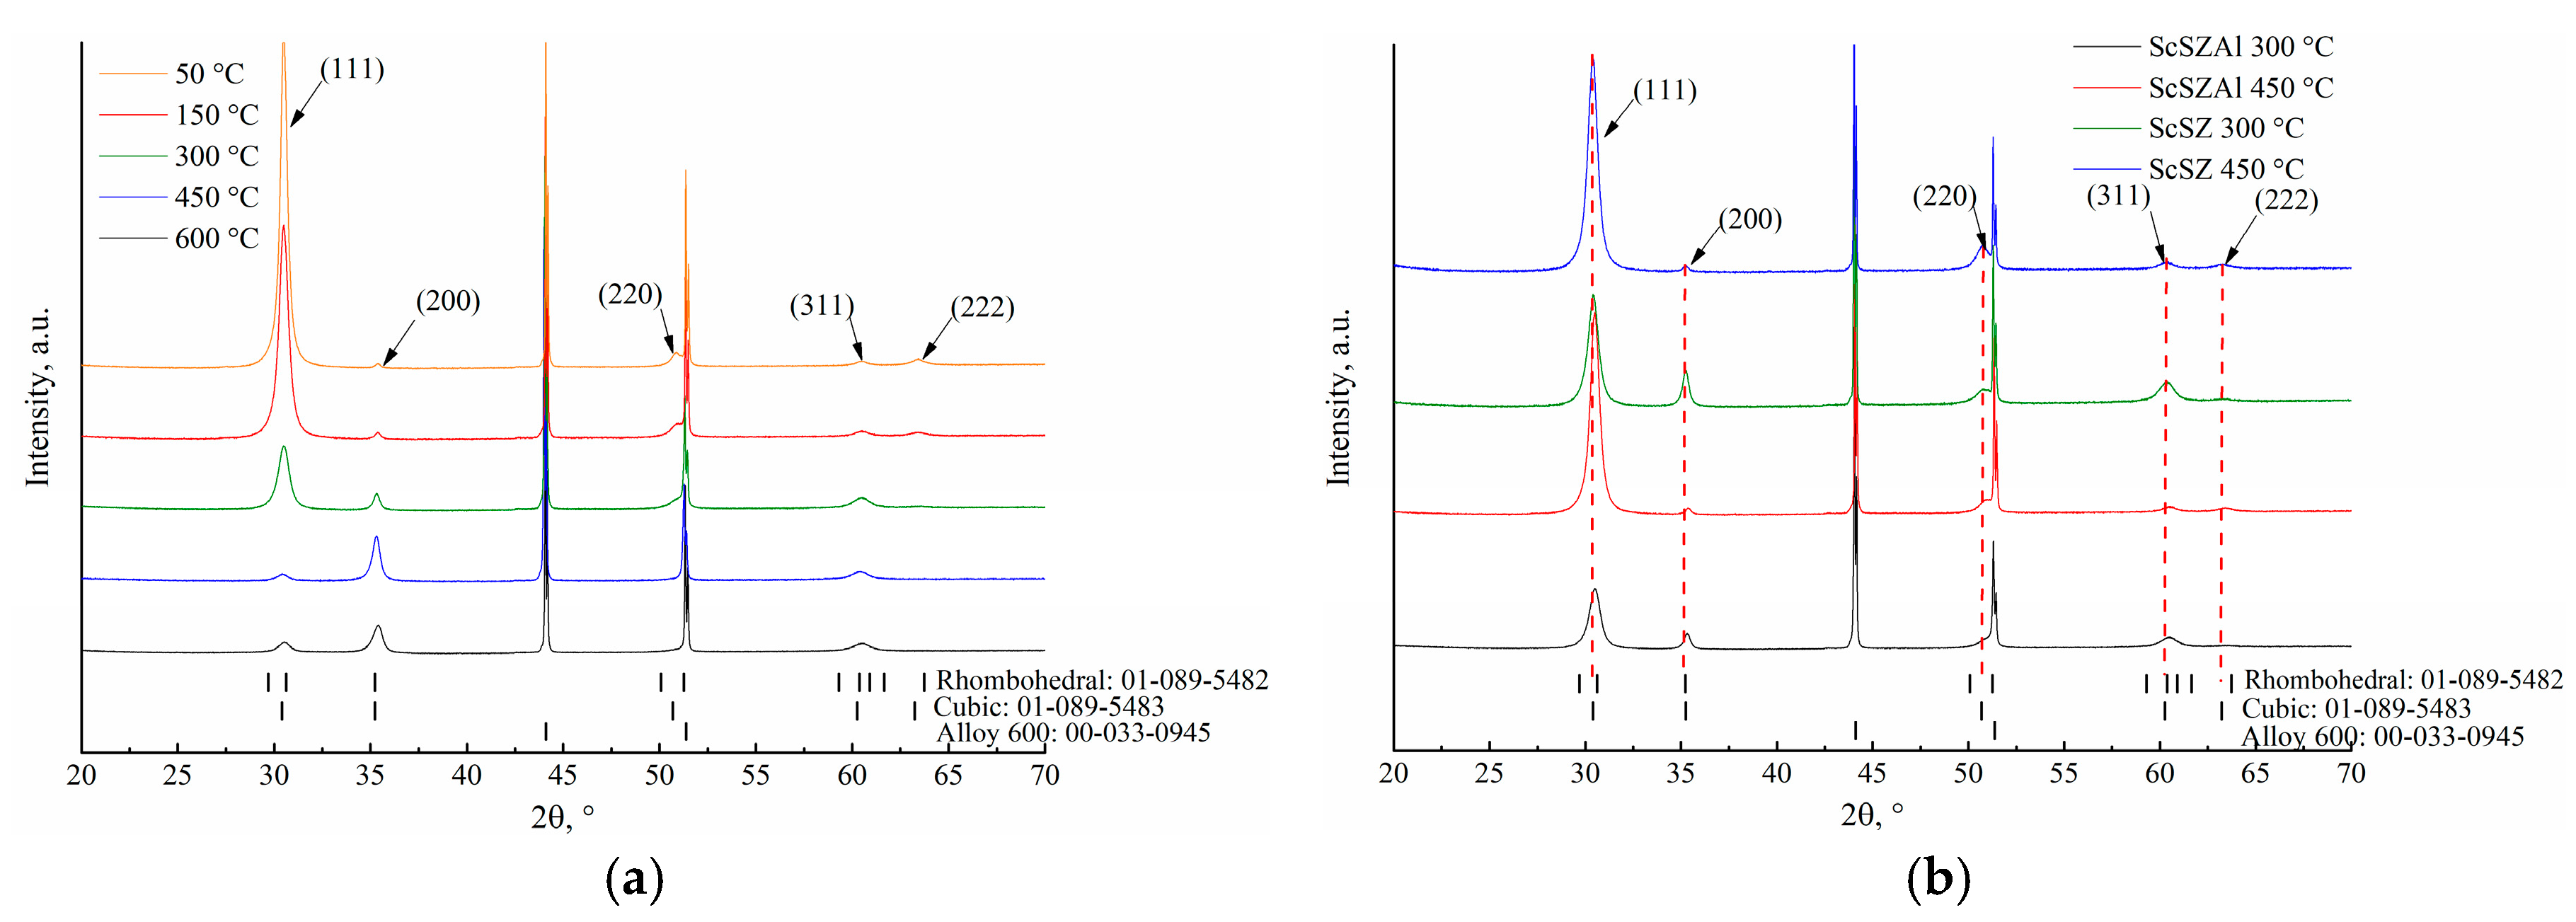
Therefore, the vapor phase of ScSZ and ScSZAl powders could consist of ZrO2, ZrO, O2, O, Sc2O3, Sc2O2, ScO, Sc, Al2O3, Al2O2, AlO, Al atoms, molecules, and molecule fragments. The atoms and molecule fragments landed on the surface of the substrate migrate and form grains. The grains with the densest planes are selected, e.g., (111) for face-centered cubic. However, surface diffusivity plays an important role in the formation of textured thin films. Adatoms deposited near grain boundaries have a higher probability of becoming incorporated at a low diffusivity surface in comparison to adatoms at high diffusivity planes having longer mean free paths with correspondingly higher probabilities of moving off the plane and becoming trapped on the adjacent grains [36]. Therefore, grains with low surface diffusivities grow faster. A similar growth mechanism was observed in the ScSZ and ScSZAl thin films. The thin films have a cubic structure (Figure 2a) and the positions of (111), (200), (220), (311), and (222) orientation peaks in the XRD patterns (measured at room temperature) confirm this (JCPSD No. 01-089-5483). The preferential orientation is (200) at low temperature (up to 450 °C) and preferential orientation is (111) at high temperatures because adatoms have high enough diffusion energy to move on the surface and become trapped on the high diffusivity surfaces. Moreover, the positions of the peaks of the ScSZAl thin films are shifted to higher angles by 0.2° in comparison to the positions of the peaks of the ScSZ thin films (Figure 2b) due to distortions in the crystal lattice. The ion of Al (~0.53 Å) is smaller than the ion of zirconium (0.84 Å).
However, Rietveld analysis showed that a mixture of cubic (87.8%) and rhombohedral (12.2%) phases can be found in the ScSZAl thin films (Figure 3) with equal probability as a pure cubic phase. The weighted profile R-factors (Rwp) are almost the same for pure cubic (1.45) and the mixture of cubic and rhombohedral (1.35). Therefore, the peaks of cubic and rhombohedral phases can be overlapped [17,35]. In this case, XRD patterns require a complimentary analysis and Raman spectroscopy can be a quick solution [15,21].
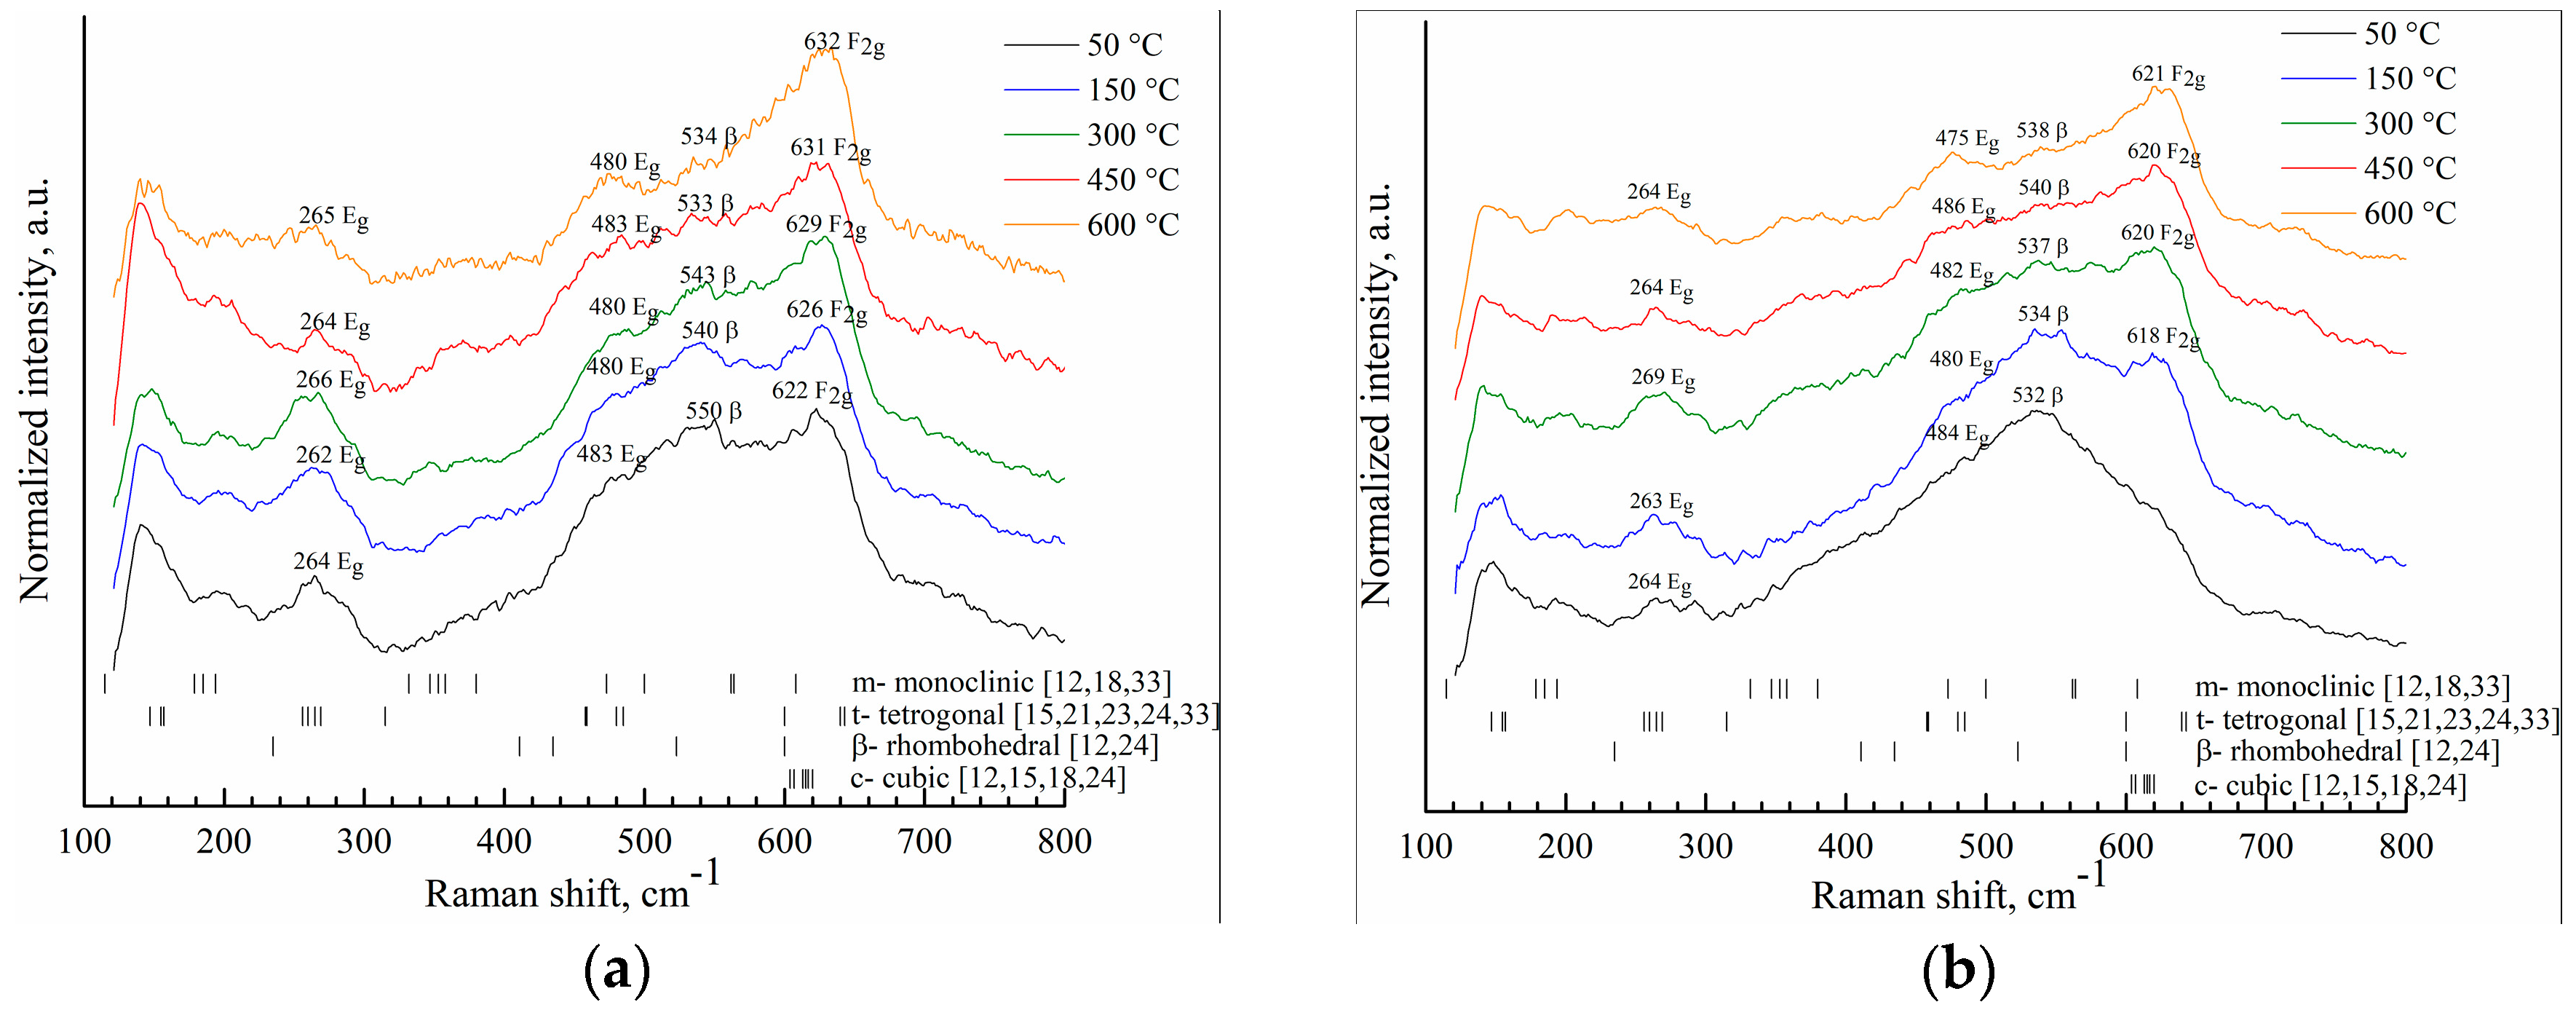
The Raman spectra of ScSZ and ScSZAl thin films indicate mixed phases (Figure 4). Raman peaks are detected around 140, 262, 354, 382, 475, 540, 618, 726, 954, and 1000 cm−1. The broad peak observed between 100 and 200 cm−1 consists of several peaks, indicating different ZrO2 phases. The peaks at 354 and 382 cm−1 belong to the monoclinic phase [12,18,22], peaks detected at 147, 260, and 475 cm−1 belong to the tetragonal phase [15,21,22,23,24], and peaks detected around 540 cm−1 belong to the rhombohedral phase [12,24]. The broad peak expressed around 620 cm−1 consists of several peaks indicating the presence of cubic (c), tetragonal (t), and monoclinic (m) phases. On the other hand, Raman peaks near 620 cm−1 can be shifted due to a disordered oxygen sublattice after doping and co-doping by Sc and Al. Substitution of Zr4+ by Sc3+ results in the formation of high quantities of oxygen vacancies [37] and such a high defect concentration can lead to a violation of the selection rules and the appearance of additional modes that are forbidden for the cubic fluorite structure [38].
The Raman spectra of ScSZ and ScSZAl are of a similar shape; however, the intensities of peaks at 620 cm−1 are lower for the ScSZAl thin films (Figure 4). In the case of thin films with an Al dopant (Figure 4b), the cubic phase begins to form at a temperature higher than 50 °C and further increase of the temperature does not significantly influence the amount of the cubic phase. This means that Al slows down the cubic phase formation and stabilizes it at higher than 300 °C substrate temperatures. Quantitative calculations give the same substantiation (Table 2). The ratios of the cubic phase to the tetragonal and rhombohedral phases are from 42% to 53% for ScSZ and around 42% for ScSZAl. Calculations reveal that the amount of cubic phase increases by 10% for ScSZ and by 2% for ScSZAl with increasing substrate temperature. Finally, Raman analysis shows that thin films have a mixture of cubic (~44%), tetragonal (~18%), and rhombohedral (~38%) phases (Table 2). The obtained results demonstrat that a polymorphous transition from rhombohedral to cubic phase occurred in the formed thin films, indicating a typical behavior for the doped ZrO2 [39]. According to the XRD spectra, the ZrO2 rhombohedral phase is not significantly expressed and the tetragonal phase is not observed, while Raman spectra show large amounts of these phases, meaning that both phases could be located in the grain boundaries [15,39].
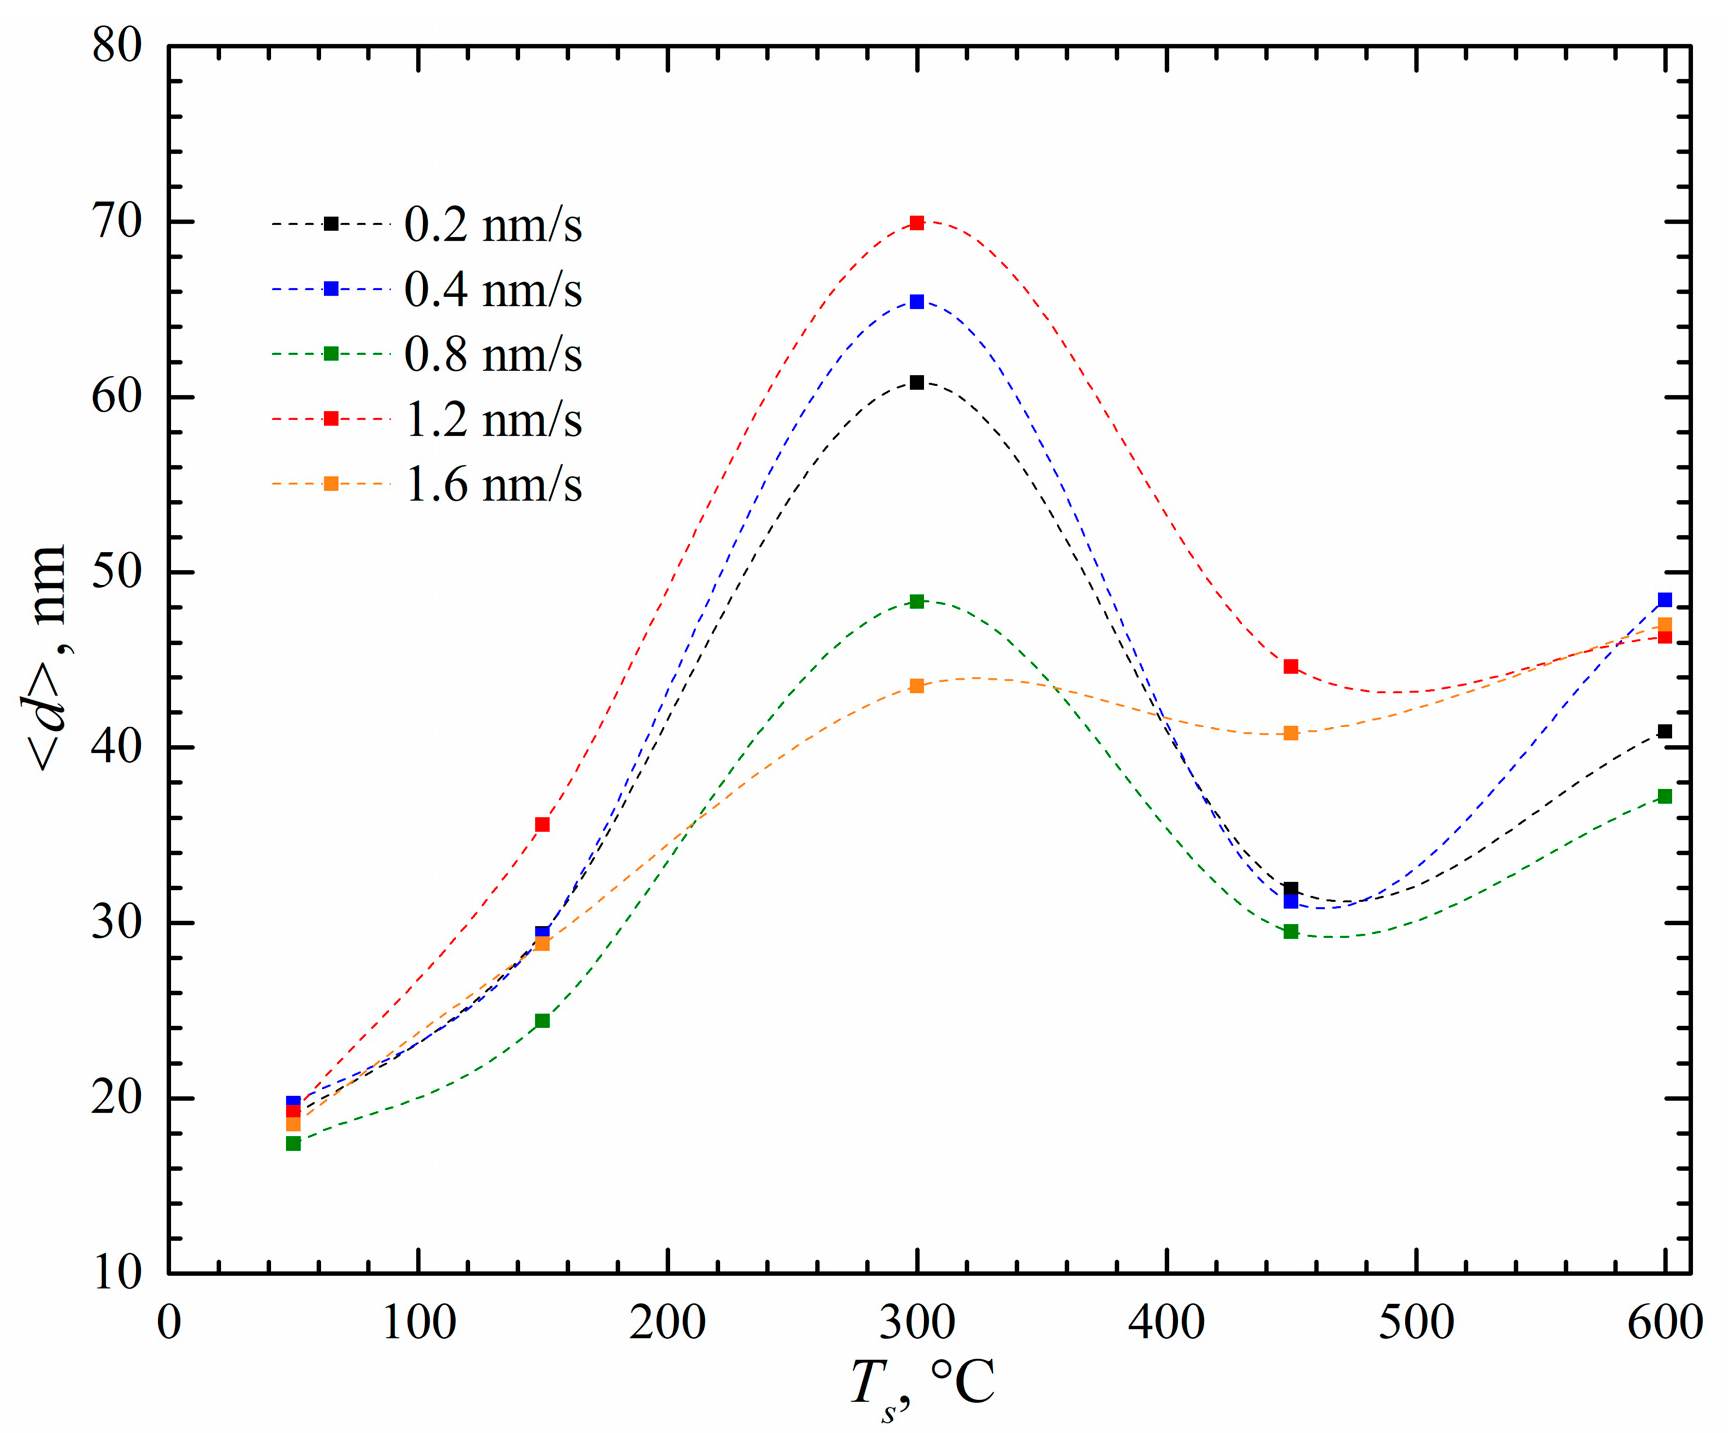
The average crystallite size dependence on the substrate temperature shows a nonlinear behavior (Figure 5). Crystallites grow larger (17.4–69.9 nm) with increasing substrate temperature (50–300 °C) during deposition. At 450 °C temperature, a sudden decrease of crystallite size occurs (~45–30 nm). This can be related to the changes in preferential orientation and to the changes in the ratio of phases. The preferential orientation changes from (200) at the temperatures up to 450 °C to (111) at high temperatures due to the higher diffusion energy of adatoms which allows them to move on the surface and become trapped on the high diffusivity surfaces.
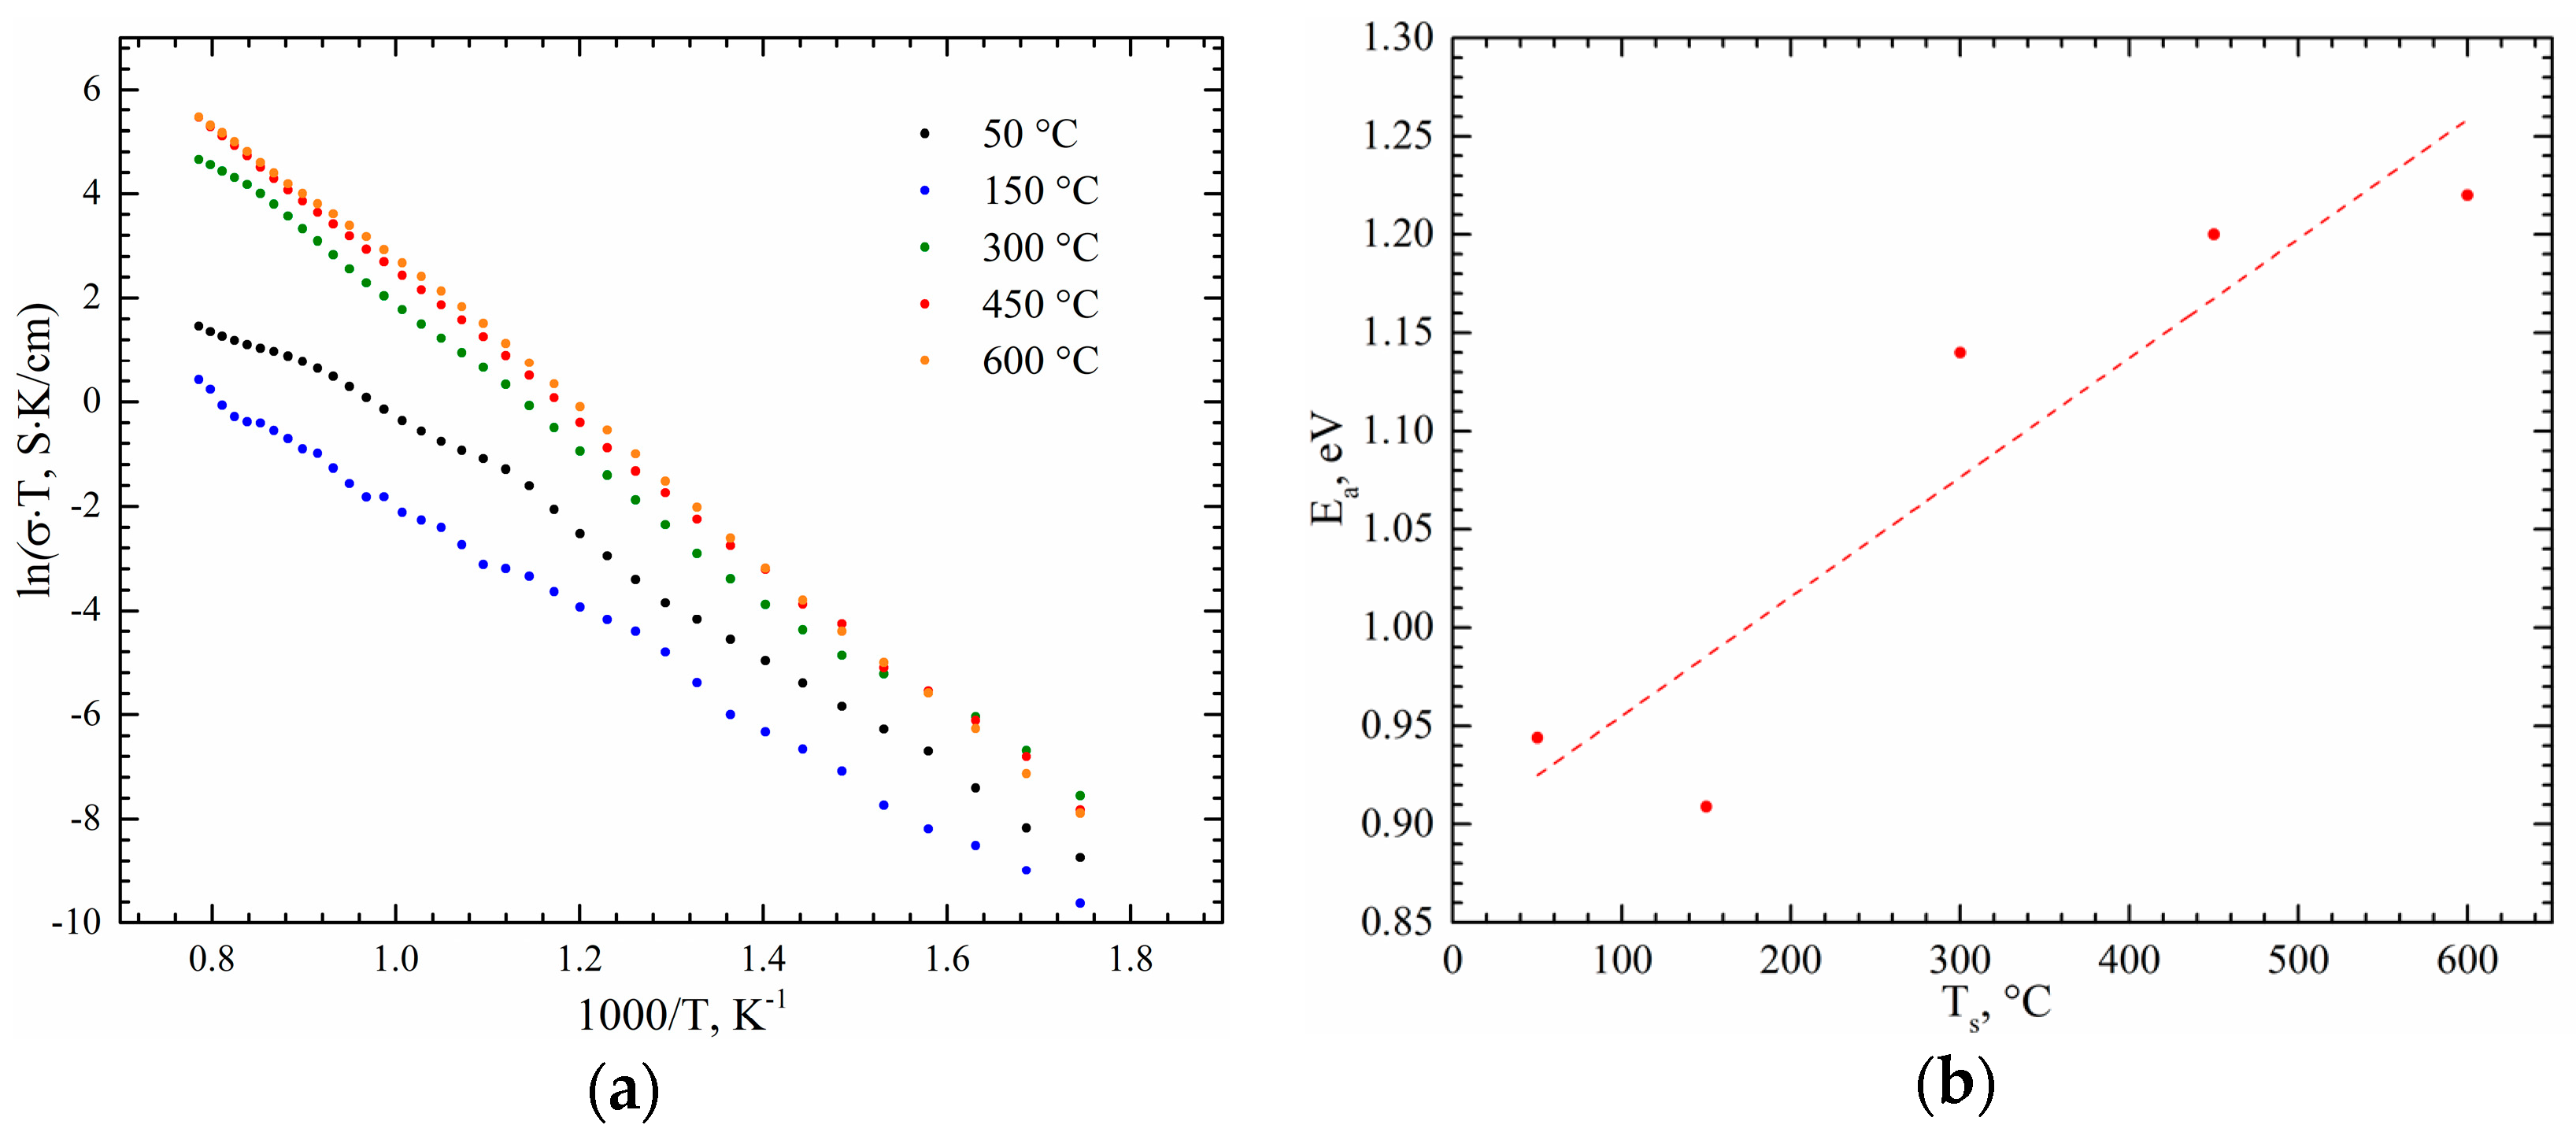
Arrhenius plots show linear dependences (Figure 6a). No obvious breaking or bending points were observed. This means that no phase transitions occurred during the measurements. Moreover, ionic conductivity (600 °C measurement temperature) is observed to be related to the substrate temperature (Table 3). Ionic conductivity is higher for the thin films deposited on higher temperature substrates. The highest value of ionic conductivity of 4.2 × 10⁻³ S/cm (substrate temperature 600 °C and deposition rate 0.4 nm/s) is similar to other authors’ results (~7 × 10⁻³ S/cm) [13,16,24]. Crystallite size has a similar dependence on temperature. Crystallites were observed to grow larger (17.4–69.9 nm) with increasing substrate temperature (50–300 °C) during deposition. At 450 °C, a sudden decrease of crystallite size occurs (~45–30 nm). This may be related to the changes in preferential orientation and to the changes in the ratio of phases. It is known that ionic conductivity is strongly related to crystallite size. According to the brick layer model, materials consisting of larger crystallites exhibit higher ionic conductivity because grain boundaries slow down oxygen ion diffusion [40,41,42].
Co-doping of aluminum was observed to have a minor effect on the ionic conductivity of thin films, although conductivity is slightly lower for the ScSZAl thin films deposited on higher temperature substrates. The lower ionic conductivity is a result of a lower amount of cubic phase and a higher amount of tetragonal phase (Table 2).
It was noticed that vacancy activation energy increased from 0.91 to 1.22 eV using higher temperature substrates (Figure 6b). This increase also occurred due to the higher amount of tetragonal phase in those thin films (Table 3).

4. Conclusions

In this work, thin films of ScSZ and ScSZAl were deposited using electron beam vapor deposition, which allows the production of a dense and homogenous thin film. Structure and conductivity studies of the formed thin films were performed. It was found that the structure of the formed thin films does not repeat the structure of the initial evaporated material. Analysis of XRD patterns and Raman spectra of the initial evaporated powders of ScSZ and ScSZAl shows that they exhibit a polymorphism of ZrO2 monoclinic, tetragonal (in Raman spectroscopy), and rhombohedral phases. Contrarily to the structure of evaporating material, XRD of ScSZ and ScSZAl thin films depict only a pure ZrO2 face-centered cubic phase of a preferential orientation (200) at temperatures up to 450 °C, with a change in preferential orientation (100) at higher temperatures. In order to investigate the influence of an Al dopant, Rietveld analysis was performed, demonstrating that a pure cubic phase can be found in the ScSZAl thin films with equal probability as a mixture of cubic (87.8%) and rhombohedral (12.2%) phases. Raman spectra of ScSZ and ScSZAl thin films also indicate a polymorphism of ZrO2 phases. Raman peaks detected around 140, 262, 354, 382, 475, 540, 618, 726, 954, and 1000 cm−1 indicate the presence of cubic (~44%), tetragonal (~18%) and rhombohedral (~38%) phases, showing a transition from a rhombohedral to a cubic phase. In ScSZAl thin films, co-doping with Al delays and slows down the formation of a cubic phase and stabilizes it at higher than 300 °C substrate temperatures. The ratios of the cubic phase to the tetragonal and rhombohedral phases are from 42% to 53% for ScSZ and around 42% for ScSZAl. It was found that the crystallite size depends on substrate temperature, demonstrating a nonlinear behavior. Crystallites grew larger (17.4–69.9 nm) with increasing substrate temperature (50–300 °C) and a sudden decrease of their size occurred (~45–30 nm) at a 450 °C deposition temperature due to the changes in preferential orientation and phase ratio. On the other hand, Arrhenius plots showed linear dependences and exhibited the highest value of ionic conductivity of 4.2 × 10⁻³ S/cm for thin films deposited on 600 °C temperature substrates using a 0.4 nm/s deposition rate. The increase in the amount of tetragonal phase in the formed thin films influences the vacancy activation energy which increases from 0.91 to 1.22 eV using higher temperature substrates.

Author Contributions

Conceptualization, M.S., G.L, and N.K.; methodology, K.B. and Ž.R.; formal analysis, D.V., M.S., and K.B.; investigation, D.V., N.K., M.S., and Ž.R.; writing—original draft preparation, M.S., N.K., K.B., Ž.R., D.V., and G.L.; writing—review and editing, M.S., N.K., K.B., Ž.R., D.V., and G.L.; visualization, N.K.; supervision, G.L.; project administration, K.B.; funding acquisition, G.L.

Funding

This research was funded by the European Regional Development Fund according to the supported activity “Research Projects Implemented by World-class Researcher Groups” under Measure No. 01.2.2-LMT-K-718.

Acknowledgments

Authors would like to express their gratitude for the following individuals for their expertise and contribution to the manuscript: Arvaidas Galdikas, Teresa Moskalioviene, Gediminas Kairaitis, and Matas Galdikas.

Conflicts of Interest

The authors declare no conflict of interest.

References

  1. Kawada, T.; Mizusaki, J. Current electrolytes and catalysts. In Handbook of Fuel Cells—Fundamentals, Technology and Applications; Vielstich, W., Lamm, A., Eds.; John Wiley & Sons: Hoboken, NJ, USA, 2010. [Google Scholar]
  2. Jung, W.C.; Hertz, J.L.; Tuller, H.L. Enhanced ionic conductivity and phase meta-stability of nano-sized thin film yttria-doped zirconia (YDZ). Acta Mater. 2009, 57, 1399–1404. [Google Scholar] [CrossRef]
  3. Sternik, M.; Parlinski, K. Lattice vibrations in cubic, tetragonal, and monoclinic phases of ZrO2. J. Chem. Phys. 2005, 122, 064707. [Google Scholar] [CrossRef] [PubMed]
  4. Simeone, D.; Gosset, D.; Bechade, J.L.; Chevarier, A. Analysis of the monoclinic–tetragonal phase transition of zirconia under irradiation. J. Nucl. Mater. 2002, 300, 27–38. [Google Scholar] [CrossRef]
  5. Liu, T.; Zhang, X.; Wang, X.; Yu, J.; Li, L. A review of zirconia-based solid electrolytes. Ionics 2016, 22, 2249–2262. [Google Scholar] [CrossRef]
  6. Xue, Q.N.; Wang, L.G.; Huang, X.W.; Zhang, J.X.; Zhang, H. Influence of codoping on the conductivity of Sc-doped zirconia by first-principles calculations and experiments. Mater. Des. 2018, 160, 131–137. [Google Scholar] [CrossRef]
  7. Agarkov, D.A.; Borik, M.A.; Bredikhin, S.I.; Burmistrov, I.N.; Eliseeva, G.M.; Kolotygin, V.A.; Kulebyakin, A.V.; Kuritsyna, I.E.; Lomonova, E.E.; Milovich, F.O.; et al. Structure and transport properties of zirconia crystals co-doped by scandia, ceria and yttria. J. Mater. 2019. [Google Scholar] [CrossRef]
  8. Taylor, M.A.; Argirusis, C.; Kilo, M.; Borchardt, G.; Luther, K.-D.; Assmus, W. Correlation between ionic radius and cation diffusion in stabilised zirconia. Solid State Ion. 2004, 173, 51–56. [Google Scholar] [CrossRef]
  9. Mago, S.; Sharma, C.; Mehra, R.; Pandey, O.P.; Singh, K.L.; Singh, A.P. Preparation of YZT a mixed conductor by microwave processing: A different mechanism in the solid state thermochemical reaction. Mater. Chem. Phys. 2018, 216, 372–379. [Google Scholar] [CrossRef]
  10. Mahato, N.; Gupta, A.; Balani, K. Doped zirconia and ceria-based electrolytes for solid oxide fuel cells: A review. Nanomater. Energy 2012, 1, 27–45. [Google Scholar] [CrossRef]
  11. Arachi, Y.; Sakai, H.; Yamamoto, O.; Takeda, Y.; Imanishai, N. Electrical conductivity of the ZrO2–Ln2O3 (Ln = lanthanides) system. Solid State Ion. 1999, 121, 133–139. [Google Scholar] [CrossRef]
  12. Dasari, H.P.; Ahn, J.S.; Ahn, K.; Park, S.-Y.; Hong, J.; Kim, H.; Yoon, K.J.; Son, J.-W.; Lee, H.-W.; Lee, J.-H. Synthesis, sintering and conductivity behavior of ceria-doped Scandia-stabilized zirconia. Solid State Ion. 2014, 263, 103–109. [Google Scholar] [CrossRef]
  13. Ishii, T. Structural phase transition and ionic conductivity in 0.88ZrO2–(0.12 − x)Sc2O3xAl2O3. Solid State Ion. 1995, 78, 333–338. [Google Scholar] [CrossRef]
  14. Sarat, S.; Sammes, N.; Smirnova, A. Bismuth oxide doped scandia-stabilized zirconia electrolyte for the intermediate temperature solid oxide fuel cells. J. Power Sources 2006, 160, 892–896. [Google Scholar] [CrossRef]
  15. Wang, Z.; Cheng, M.; Bi, Z.; Dong, Y.; Zhang, H.; Zhang, J.; Feng, Z.; Li, C. Structure and impedance of ZrO2 doped with Sc2O3 and CeO2. Mater. Lett. 2005, 59, 2579–2582. [Google Scholar] [CrossRef]
  16. Ota, Y.; Ikeda, M.; Sakuragi, S.; Iwama, Y.; Sonoyama, N.; Ikeda, S.; Hirano, A.; Imanishi, N.; Takeda, Y.; Yamamoto, O. Crystal structure and oxygen ion conductivity of Ga3+ Co-doped scandia-stabilized zirconia. J. Electrochem. Soc. 2010, 157, B1707–B1712. [Google Scholar] [CrossRef]
  17. Yarmolenko, S.; Sankar, J.; Bernier, N.; Klimov, M.; Kapat, J.; Orlovskaya, N. Phase stability and sintering behavior of 10 mol % Sc2O3–1 mol % CeO2–ZrO2 ceramics. J. Fuel Cell Sci. Technol. 2009, 6, 21007–21008. [Google Scholar] [CrossRef]
  18. Hirata, T.; Asari, E.; Kitajima, M. Infrared and Raman spectroscopic studies of ZrO2 polymorphs doped with Y2O3 or CeO2. J. Solid State Chem. 1994, 110, 201–207. [Google Scholar] [CrossRef]
  19. Feinberg, A.; Perry, C.H. Structural disorder and phase transitions in ZrO2–Y2O3 system. J. Phys. Chem. Solids 1981, 42, 513–518. [Google Scholar] [CrossRef]
  20. Jawhari, T. Micro-Raman spectroscopy of the solid state: Applications to semiconductors and thin films. Analusis 2000, 28, 15–21. [Google Scholar] [CrossRef]
  21. Nomura, K.; Mizutani, Y.; Kawai, M.; Nakamura, Y.; Yamamoto, O. Aging and Raman scattering study of scandia and yttria doped zirconia. Solid State Ion. 2000, 132, 235–239. [Google Scholar] [CrossRef]
  22. Li, L.; Wang, W. Synthesis and characterization of monoclinic ZrO2 nanorods by a novel and simple precursor thermal decomposition approach. Solid State Commun. 2003, 127, 639–643. [Google Scholar] [CrossRef]
  23. Xue, Q.; Huang, X.; Zhang, H.; Xu, H.; Zhang, J.; Wang, L. Synthesis and characterization of high ionic conductivity ScSZ core/shell nanocomposites. J. Rare Earths 2017, 35, 567–573. [Google Scholar] [CrossRef]
  24. Kumar, A.; Jaiswal, A.; Sanbui, M.; Omar, S. Scandia stabilized zirconia-ceria solid electrolyte (xSc1CeSZ, 5 < x < 11) for IT-SOFCs: Structure and conductivity studies. Scr. Mater. 2016, 121, 10–13. [Google Scholar] [CrossRef]
  25. Jamil, Z.; Ruiz-Trejo, E.; Boldrin, P.; Brandon, N.P. Anode fabrication for solid oxide fuel cells: Electroless and electrodeposition of nickel and silver into doped ceria scaffolds. Int. J. Hydrogen Energy 2016, 41, 9627–9637. [Google Scholar] [CrossRef] [Green Version]
  26. Shi, H.; Ran, R.; Shao, Z. Wet powder spraying fabrication and performance optimization of IT-SOFCs with thin-film ScSZ electrolyte. Int. J. Hydrogen Energy 2012, 37, 1125–1132. [Google Scholar] [CrossRef]
  27. Ksapabutr, B.; Chalermkiti, T.; Wongkasemjit, S.; Panapoy, M. Fabrication of scandium stabilized zirconia thin film by electrostatic spray deposition technique for solid oxide fuel cell electrolyte. Thin Solid Films 2010, 518, 6518–6521. [Google Scholar] [CrossRef]
  28. Pshyk, A.V.; Coy, E.; Kempiński, M.; Scheibe, B.; Jurga, S. Low-temperature growth of epitaxial Ti2AlC MAX phase thin films by low-rate layer-by-layer PVD. Mater. Res. Lett. 2019, 7, 244–250. [Google Scholar] [CrossRef]
  29. Xu, Z.; He, S.; He, L.; Mu, R.; Huang, G.; Cao, X. Novel thermal barrier coatings based on La2(Zr0.7Ce0.3)2O7/8YSZ double-ceramic-layer systems deposited by electron beam physical vapor deposition. J. Alloy. Compd. 2011, 509, 4273–4283. [Google Scholar] [CrossRef]
  30. Lopatin, S.I.; Shugurov, S.M. Thermodynamic properties of the Lu2O3–ZrO2 solid solutions by Knudsen effusion mass spectrometry at high temperature. J. Chem. Thermodyn. 2014, 72, 85–88. [Google Scholar] [CrossRef]
  31. Jacobson, N.S. Thermodynamic properties of some metal oxide-zirconia systems (No. NASA-E-5060). In NASA Technical Memorandum 102351; NASA: Cleveland, OH, USA, 1989. [Google Scholar]
  32. Fujimori, H.; Yashima, M.; Kakihana, M.; Yoshimura, M. Structural changes of Scandia-doped zirconia solid solutions: rietveld analysis and Raman scattering. J. Am. Ceram. Soc. 2005, 81, 2885–2893. [Google Scholar] [CrossRef]
  33. Le Bail, A. The profile of a Bragg reflection for extracting intensities. In Powder Diffraction: Theory and Practice; Dinnebier, R.E., Billinge, S.J.L., Eds.; The Royal Society of Chemistry: London, UK, 2008; pp. 134–165. [Google Scholar]
  34. Siu, G.G.; Stokes, M.J.; Liu, Y. Variation of fundamental and higher-order Raman spectra of ZrO2 nanograins with annealing temperature. Phys. Rev. B 1999, 59, 3173–3179. [Google Scholar] [CrossRef]
  35. Garvie, R.C. The occurrence of metastable tetragonal zirconia as a crystallite size effect. J. Phys. Chem. 1965, 69, 1238–1243. [Google Scholar] [CrossRef]
  36. Petrov, I.; Barna, P.B.; Hultman, L.; Greene, J.E. Microstructural evolution during film growth. J. Vac. Sci. Technol. A 2003, 21, S117–S128. [Google Scholar] [CrossRef]
  37. Marrocchelli, D.; Madden, P.A.; Norberg, S.T.; Hull, S. Structural disorder in doped zirconias, Part II: Vacancy ordering effects and the conductivity maximum. Chem. Mater. 2011, 23, 1365–1373. [Google Scholar] [CrossRef]
  38. Kosacki, I.; Suzuki, T.; Anderson, H.U.; Colomban, P. Raman scattering and lattice defects in nanocrystalline CeO2 thin films. Solid State Ion. 2002, 149, 99–105. [Google Scholar] [CrossRef]
  39. Spirin, A.; Ivanov, V.; Nikonov, A.; Lipilin, A.; Paranin, S.; Khrustov, V.; Spirina, A. Scandia-stabilized zirconia doped with yttria: Synthesis, properties, and ageing behavior. Solid State Ion. 2012, 225, 448–452. [Google Scholar] [CrossRef]
  40. Maier, J. On the conductivity of polycrystalline materials. Berichte der Bunsengesellschaft für Physikalische Chemie 1986, 90, 26–33. [Google Scholar] [CrossRef]
  41. Tschöpe, A.; Sommer, E.; Birringer, R. Grain size-dependent electrical conductivity of polycrystalline cerium oxide: I. Experiments. Solid State Ion. 2001, 139, 255–265. [Google Scholar] [CrossRef]
  42. Tao, J.; Dong, A.; Wang, J. The influence of microstructure and grain boundary on the electrical properties of scandia stabilized zirconia. Mater. Trans. 2013, 54, 825–832. [Google Scholar] [CrossRef]
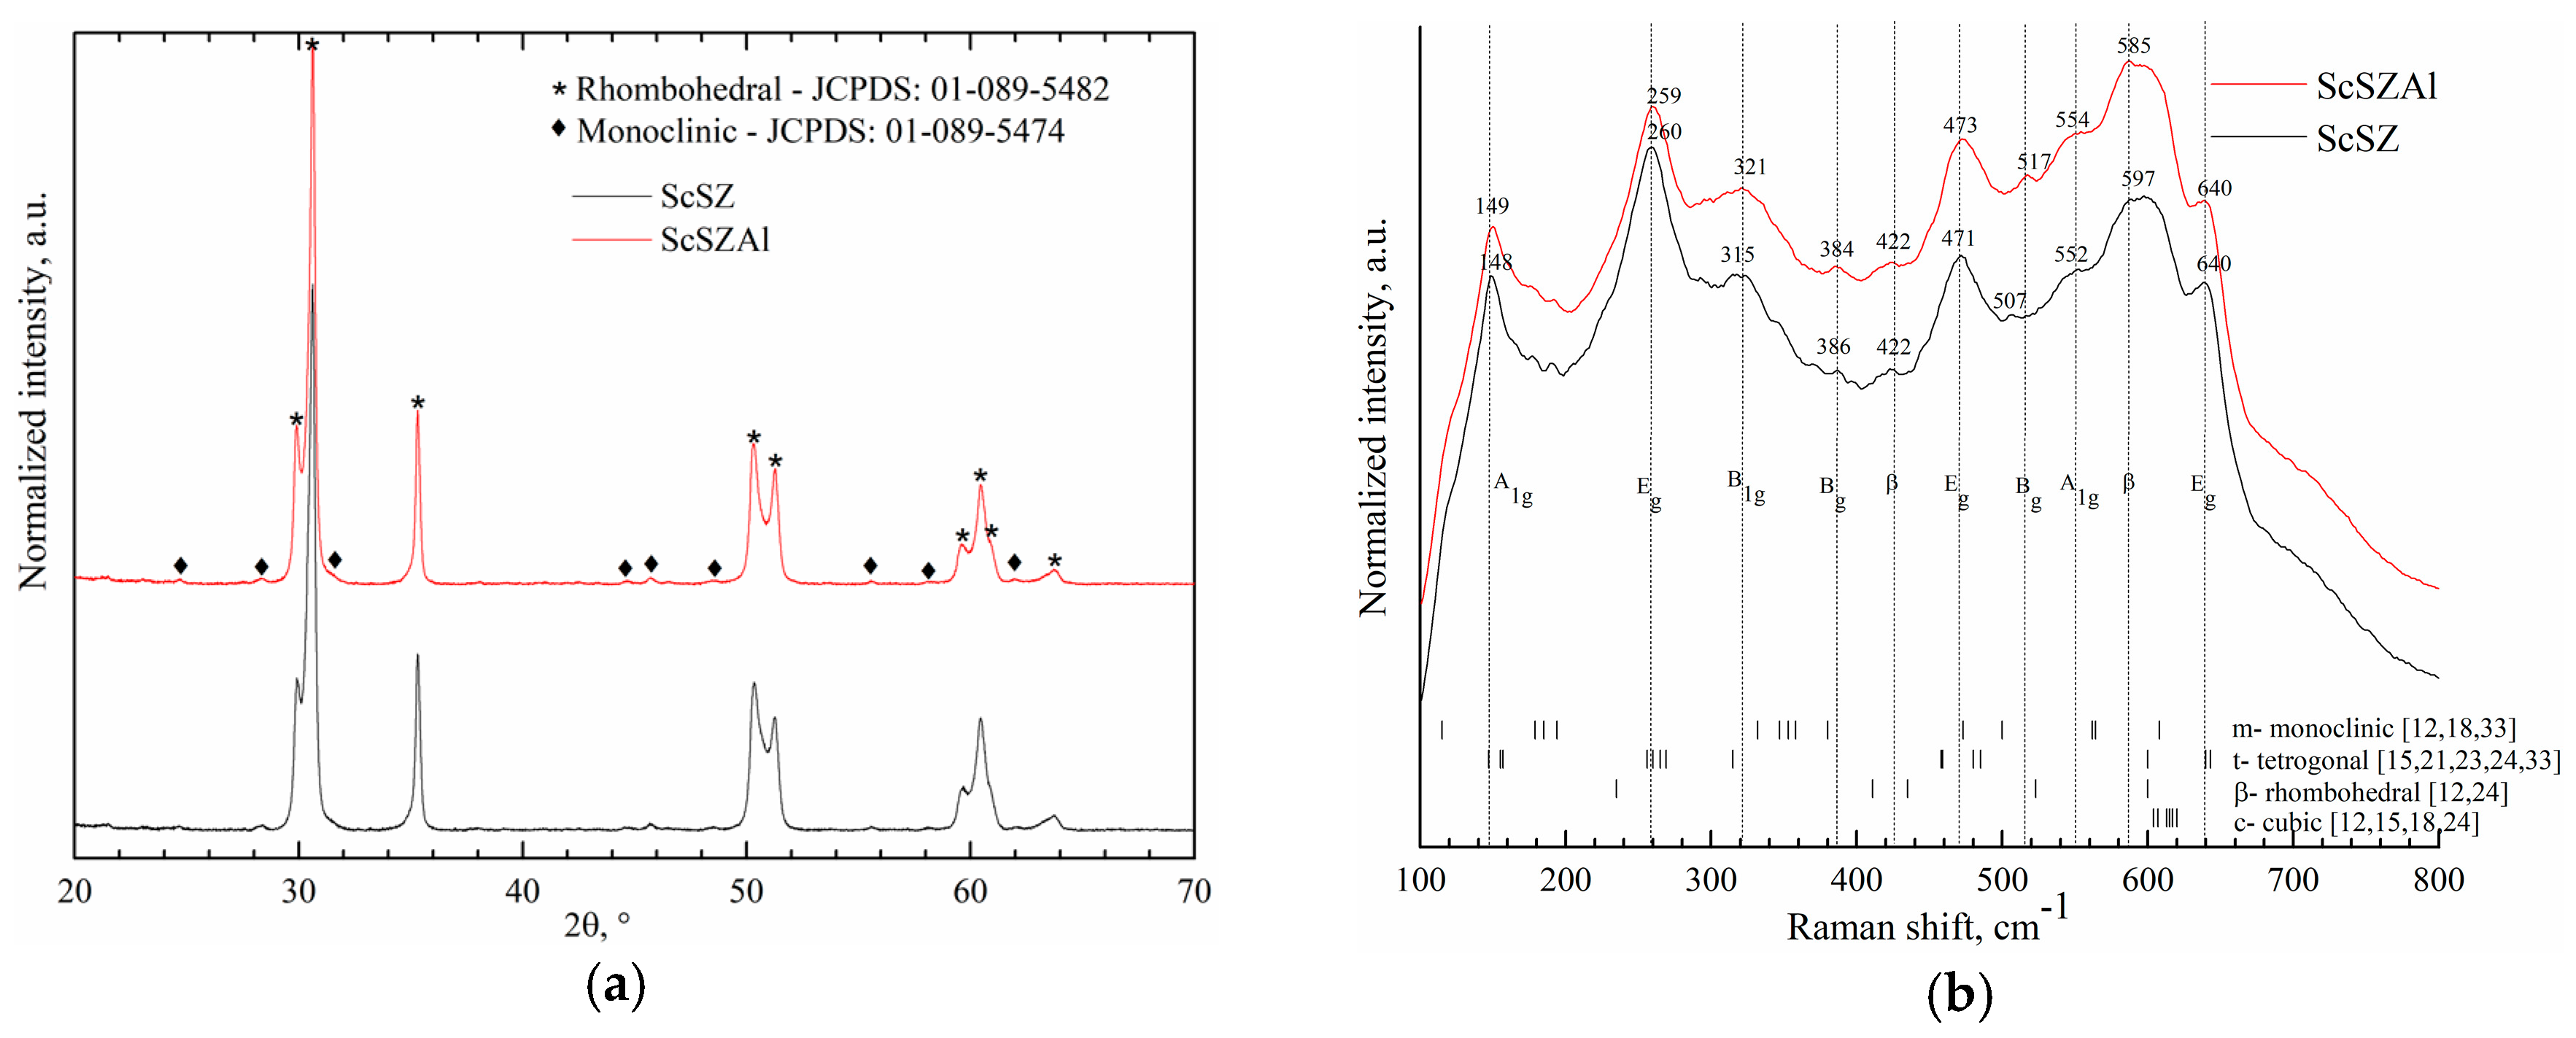
Figure 1. ScSZ and ScSZAl powders: (a) X-ray diffraction (XRD) patterns and (b) Raman shifts.
Coatings 09 00317 g001
Figure 2. XRD patterns (measured at room temperature) of (a) ScSZAl thin films and (b) ScSZ and ScSZAl thin films deposited on Alloy 600 substrates using a 0.4 nm/s deposition rate.
Coatings 09 00317 g002
Figure 3. Rietveld analysis of XRD patterns of ScSZAl thin films deposited on Alloy 600 substrates using a 0.4 nm/s deposition rate.
Coatings 09 00317 g003
Figure 4. Raman spectra of (a) ScSZ and (b) ScSZAl thin films deposited on Alloy 600 substrates using a 0.4 nm/s deposition rate.
Coatings 09 00317 g004
Figure 5. Crystallite size dependence on substrate temperature of ScSZAl thin films deposited on Alloy 600 substrates using different deposition rates.
Coatings 09 00317 g005
Figure 6. (a) Arrhenius plots of ScSZAl thin films deposited on Al2O3 substrates using a 0.4 nm/s deposition rate and (b) vacancy activation energy dependence on the substrate temperature of ScSZAl thin films deposited on Al2O3 substrates using a 0.4 nm/s deposition rate.
Coatings 09 00317 g006
Table 1. Atomic ratios of Sc, Al, and Zr in the initial powders.
Initial PowderscSc, %cAl, %cZr, %
ScSZ0.190.81
ScAlSZ0.190.020.79
Table 2. The ratio of cubic, tetragonal, and rhombohedral phases in the ScSZ and ScSZAl thin films.
Substrate Temperature (°C)CubicTetragonalRhombohedral
ScSZ
5043%15%42%
15042%19%39%
30045%18%37%
45046%17%37%
60053%17%30%
ScAlSZ
5022%78%
15041%13%46%
30042%19%39%
45043%20%37%
60043%23%34%
Table 3. Ionic conductivity (S/cm) of ScSZ and ScSZAl thin films deposited using different substrate temperature and a 0.4 nm/s deposition rate.
Thin FilmsSubstrate Temperature
50 °C150 °C300 °C450 °C600 °C
ScSZ1.7 × 10−52.5 × 10−57.4 × 10−43.6 × 10−34.2 × 10−3
ScAlSZ4.1 × 10−52.3 × 10−41.1 × 10−31.9 × 10−32.4 × 10−3