All articles published by MDPI are made immediately available worldwide under an open access license. No special
permission is required to reuse all or part of the article published by MDPI, including figures and tables. For
articles published under an open access Creative Common CC BY license, any part of the article may be reused without
permission provided that the original article is clearly cited. For more information, please refer to
https://www.mdpi.com/openaccess.
Feature papers represent the most advanced research with significant potential for high impact in the field. A Feature
Paper should be a substantial original Article that involves several techniques or approaches, provides an outlook for
future research directions and describes possible research applications.
Feature papers are submitted upon individual invitation or recommendation by the scientific editors and must receive
positive feedback from the reviewers.
Editor’s Choice articles are based on recommendations by the scientific editors of MDPI journals from around the world.
Editors select a small number of articles recently published in the journal that they believe will be particularly
interesting to readers, or important in the respective research area. The aim is to provide a snapshot of some of the
most exciting work published in the various research areas of the journal.
The electrostatic spray deposition (ESD) is a method of coating thin films based on electrostatic atomization. This paper proposes a method of quantifying the transport of droplets using images of spray patterns measured by the vision system during the ESD process, and verifies by experiment the correlation between the quantified parameters for the dispersion shape of the spray and the thickness of the deposited thin film. When using the proposed method, the ESD process can be optimized simply by monitoring variations of the spray shapes caused by the process conditions. In addition, the proposed method can be applicable to the in-line monitoring method of the variation in the transport of droplets during the ESD process.
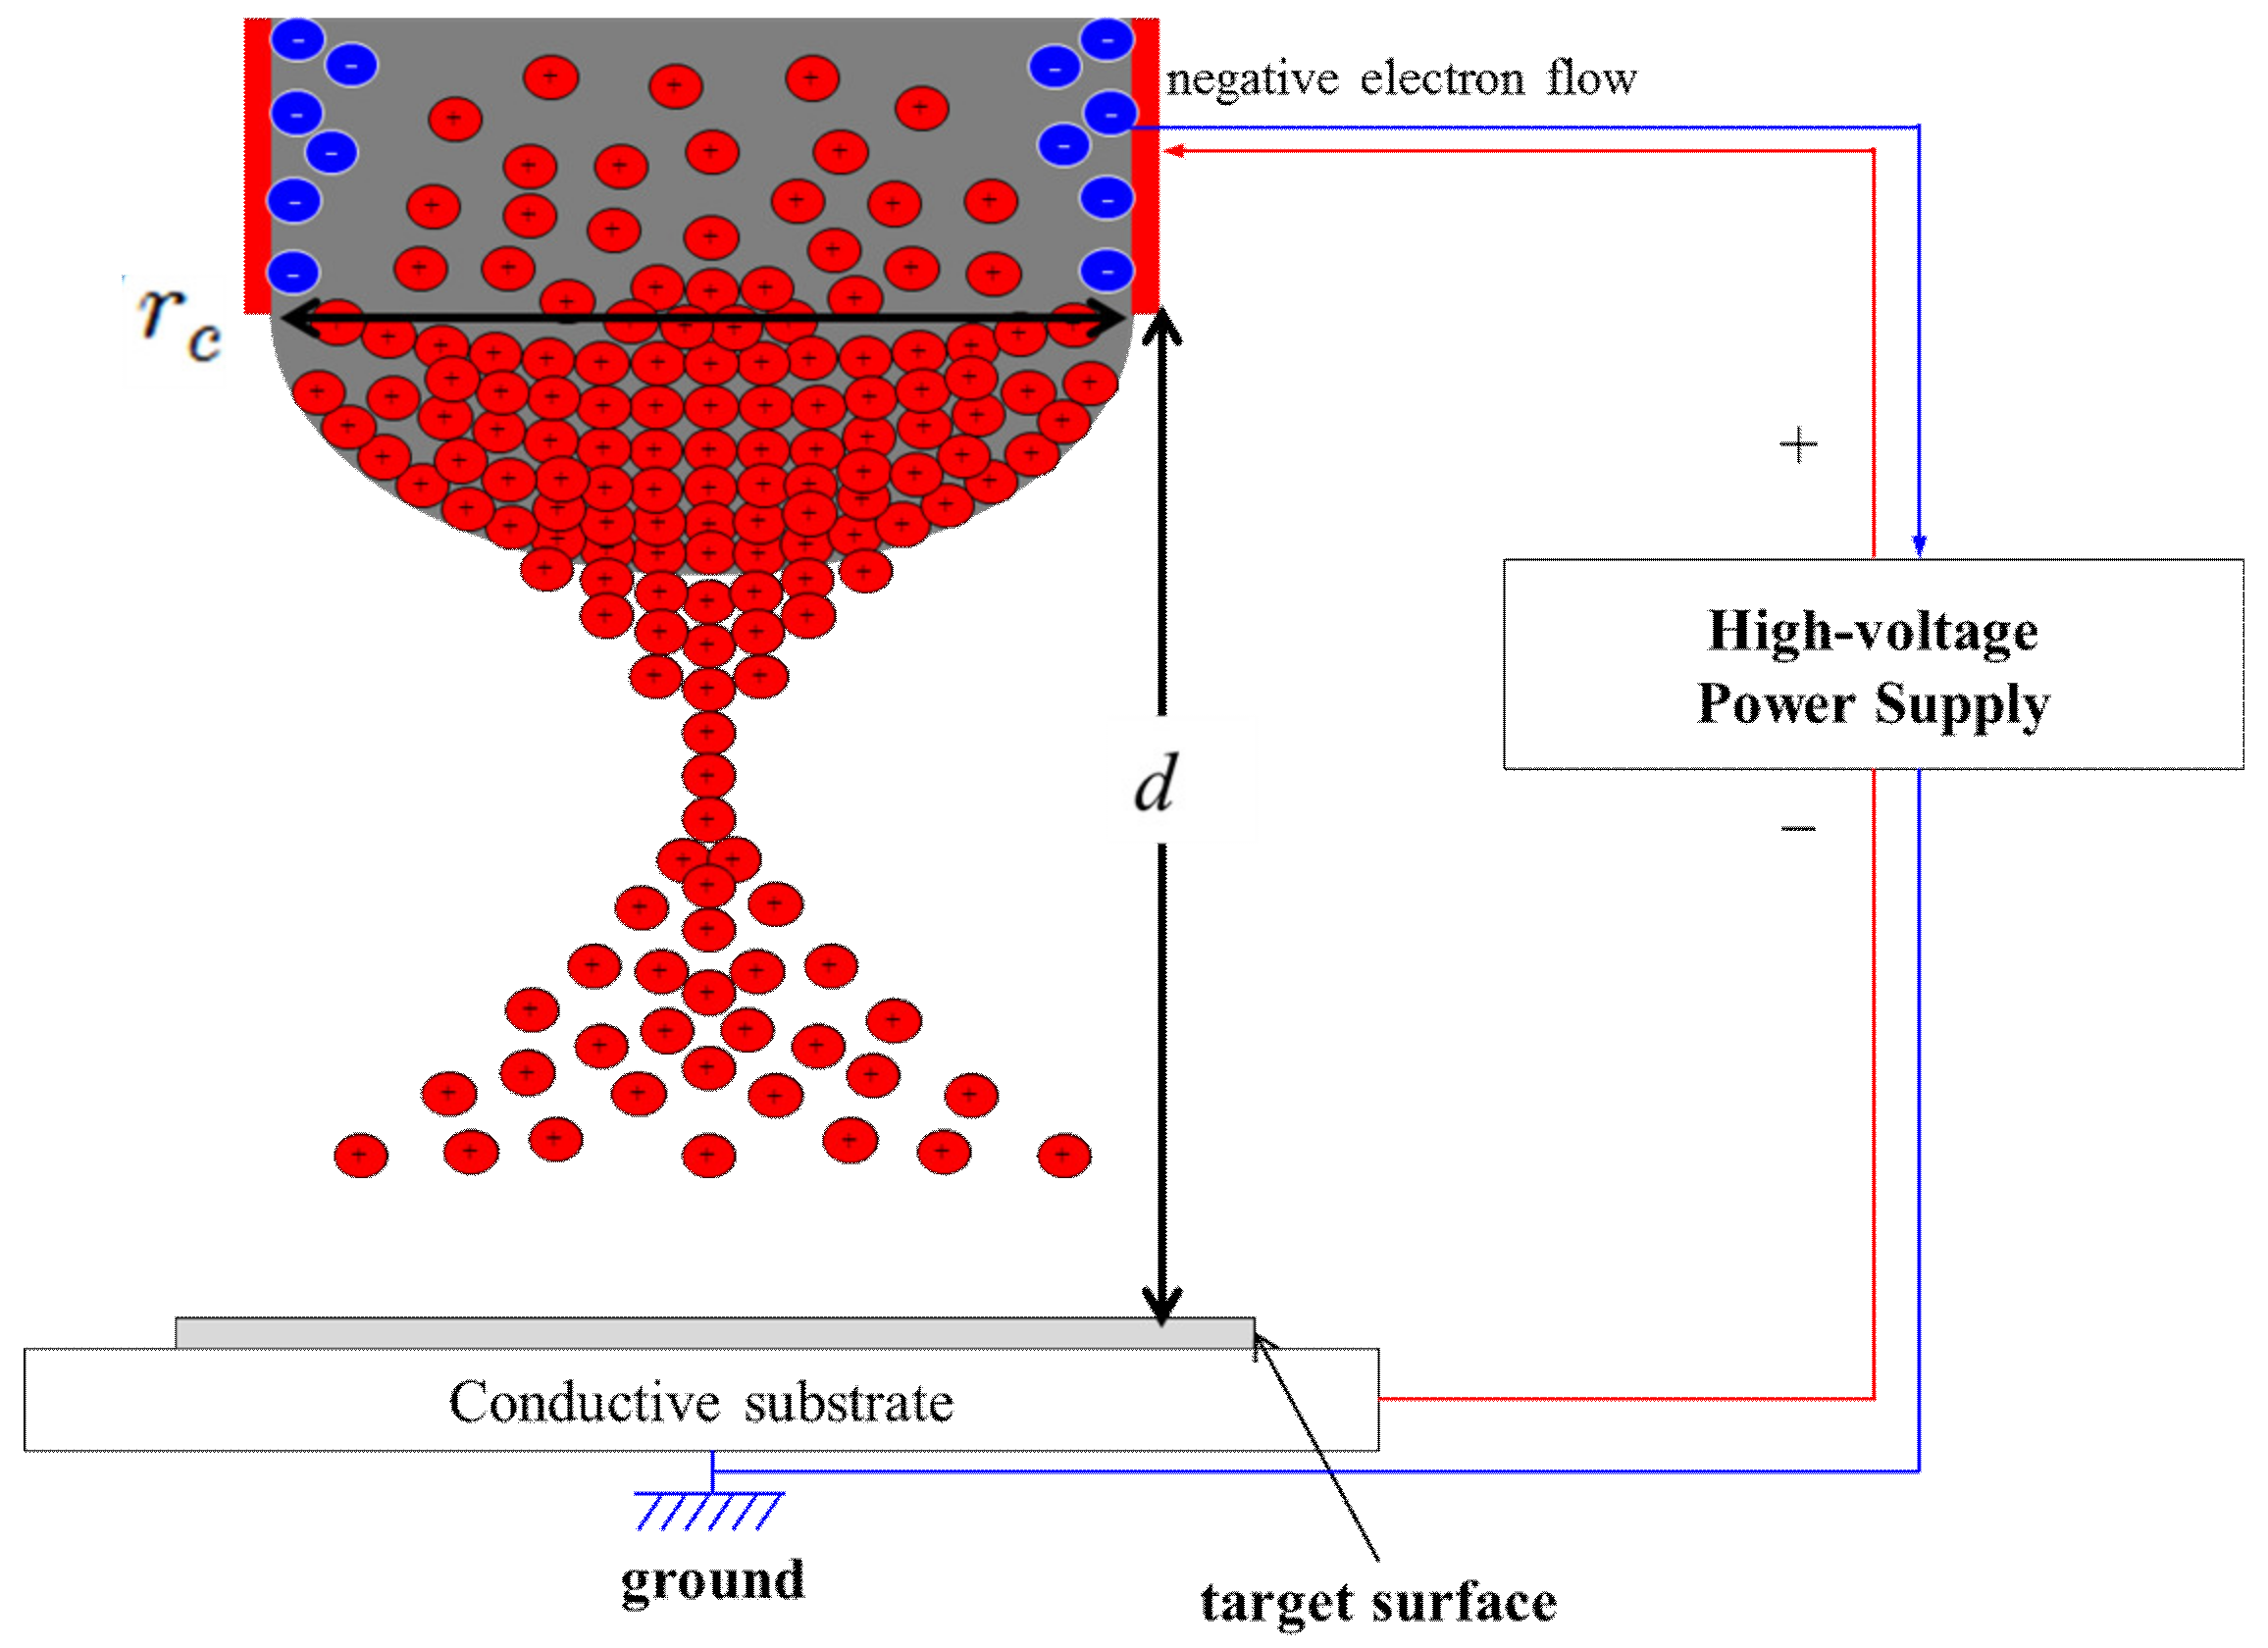
The electrostatic spray deposition (ESD) is a method of coating thin films based on the principle of electrostatic atomization. As shown in Figure 1, droplets are sprayed from the tip of the capillary tube in the ESD process when the strong electric field applied between the capillary tube and the conductive substrate reaches a critical value at which point the electrostatic force overcomes the surface tension of the coating solution [1,2,3,4,5]. Then, the sprayed droplets are evaporated, disrupted and collected on the substrate by the electric field. Electrostatic atomization was used in the fabrication of thin uniform radioactive sources from the 1950s to the 1970s [6], and in the painting industry for many years [7]. Recently, the scope of its application (i.e., of thin film deposited by electrostatic atomization) has expanded to include the fabrication of electronic devices, such as a variety of function metal oxides in solid oxide fuel cells and solid-state rechargeable lithium-ion batteries [7,8], thin film transistors [9], transparent conductive film using silver nanowires [10], organic light emitting diodes [11] and organic solar cells [12] because the ESD process offers such advantages as its simple set-up, a wide choice of precursors, a relatively large film growth rate, ambient atmosphere operation, good control over the morphology of the deposited layers, and excellent control of stoichiometry compared to other CVDs [7].
When applying thin films to electronic devices, the uniformity of thickness and morphology of the deposited thin film should be considered. Generally, during the ESD process, the thin film is deposited via the following five steps: (i) Spray formation, (ii) droplet transport, evaporation and disruption, (iii) preferential landing, (iv) discharge, droplet spreading, penetration and drying, and (v) surface diffusion and reaction [5]. The deposition conditions in each step of the ESD process determine the uniformity and morphology of the thin film fabricated by the ESD process. Actually, the first two steps are more closely related to the uniformity of the thin film and the deposition conditions in the latter three steps are generally crucial to the morphology of the thin film. Numerous researches related to the spray formation have been conducted [1,2,3,4]. Spray formation is classified into several modes, such as dripping, spindle, cone-jet, oscillating-jet and multi-jet, whose operating ranges are determined by the physical properties of the liquid and the spraying condition, because a different spatial distribution of the spray patterns is obtained in a different mode [1,4]. Among these various modes, the cone-jet mode has been most frequently analyzed due to its capability for generating mono-dispersed droplets of micron-size [2,3]. The correlation between the morphology and the spray conditions, such as deposition time, deposition temperature, precursor solution concentration, electric field strength, substrate and solvent was investigated experimentally and the mechanism was discussed in view of the latter three steps of the ESD process [5]. There are lots of works to visualize the spray and the planar laser imaging is one of the most popular methods. In those methods, laser sheet beam having a small thickness is illuminated to spray jet and side scattering images are recorded by CCD. Depending on the physical quantities measured, a number of planar laser imaging techniques have been developed during the past three decades. The most common ones are Particle Imaging Velocimetry [12], Planar Laser Induce Fluorescence [13] and Laser sheet dropsizing [14]. The accuracy of the visualization can be improved by applying structured illumination [15], which can efficiently remove the blurring effects from the multiple light scattering. The laser attenuation in optically dense sprays can be also compensated [16]. In addition, the infrared thermography-based visualization method [17] can be applied because it has the advantage that the infrared wavelengths are attenuated less than the visible wavelengths by the spray. To the best of our knowledge, no researches have been conducted on the correlation between the droplet transport and the thickness of the deposited thin film even though the droplet transport has a considerable impact on the spray conditions [18,19].
This paper focuses on the droplet transport step in order to investigate the correlation between the dispersion shape of the spray during the droplet transport and the thickness of the deposited thin film. The hybrid electrostatic atomization process, which was developed to increase the deposition rate by using the pressure of pneumatic air (0~5 bar) supplied from outside the coating solution in the nozzle, while allowing a slight increase in size of the droplets, was used for the investigation [18,19]. Thus, this study proposes a method of quantifying the droplet transport by using images of the spray patterns measured by the vision system during the ESD process, and verifies by experiment the correlation between the uniformity for the dispersion shape of the spray and the thickness of the deposited thin film. As a result, the proposed method can be applicable to the in-line optimization and monitoring of the ESD process in view of the transport of droplets.
2. Method of Quantifying Droplet Transport
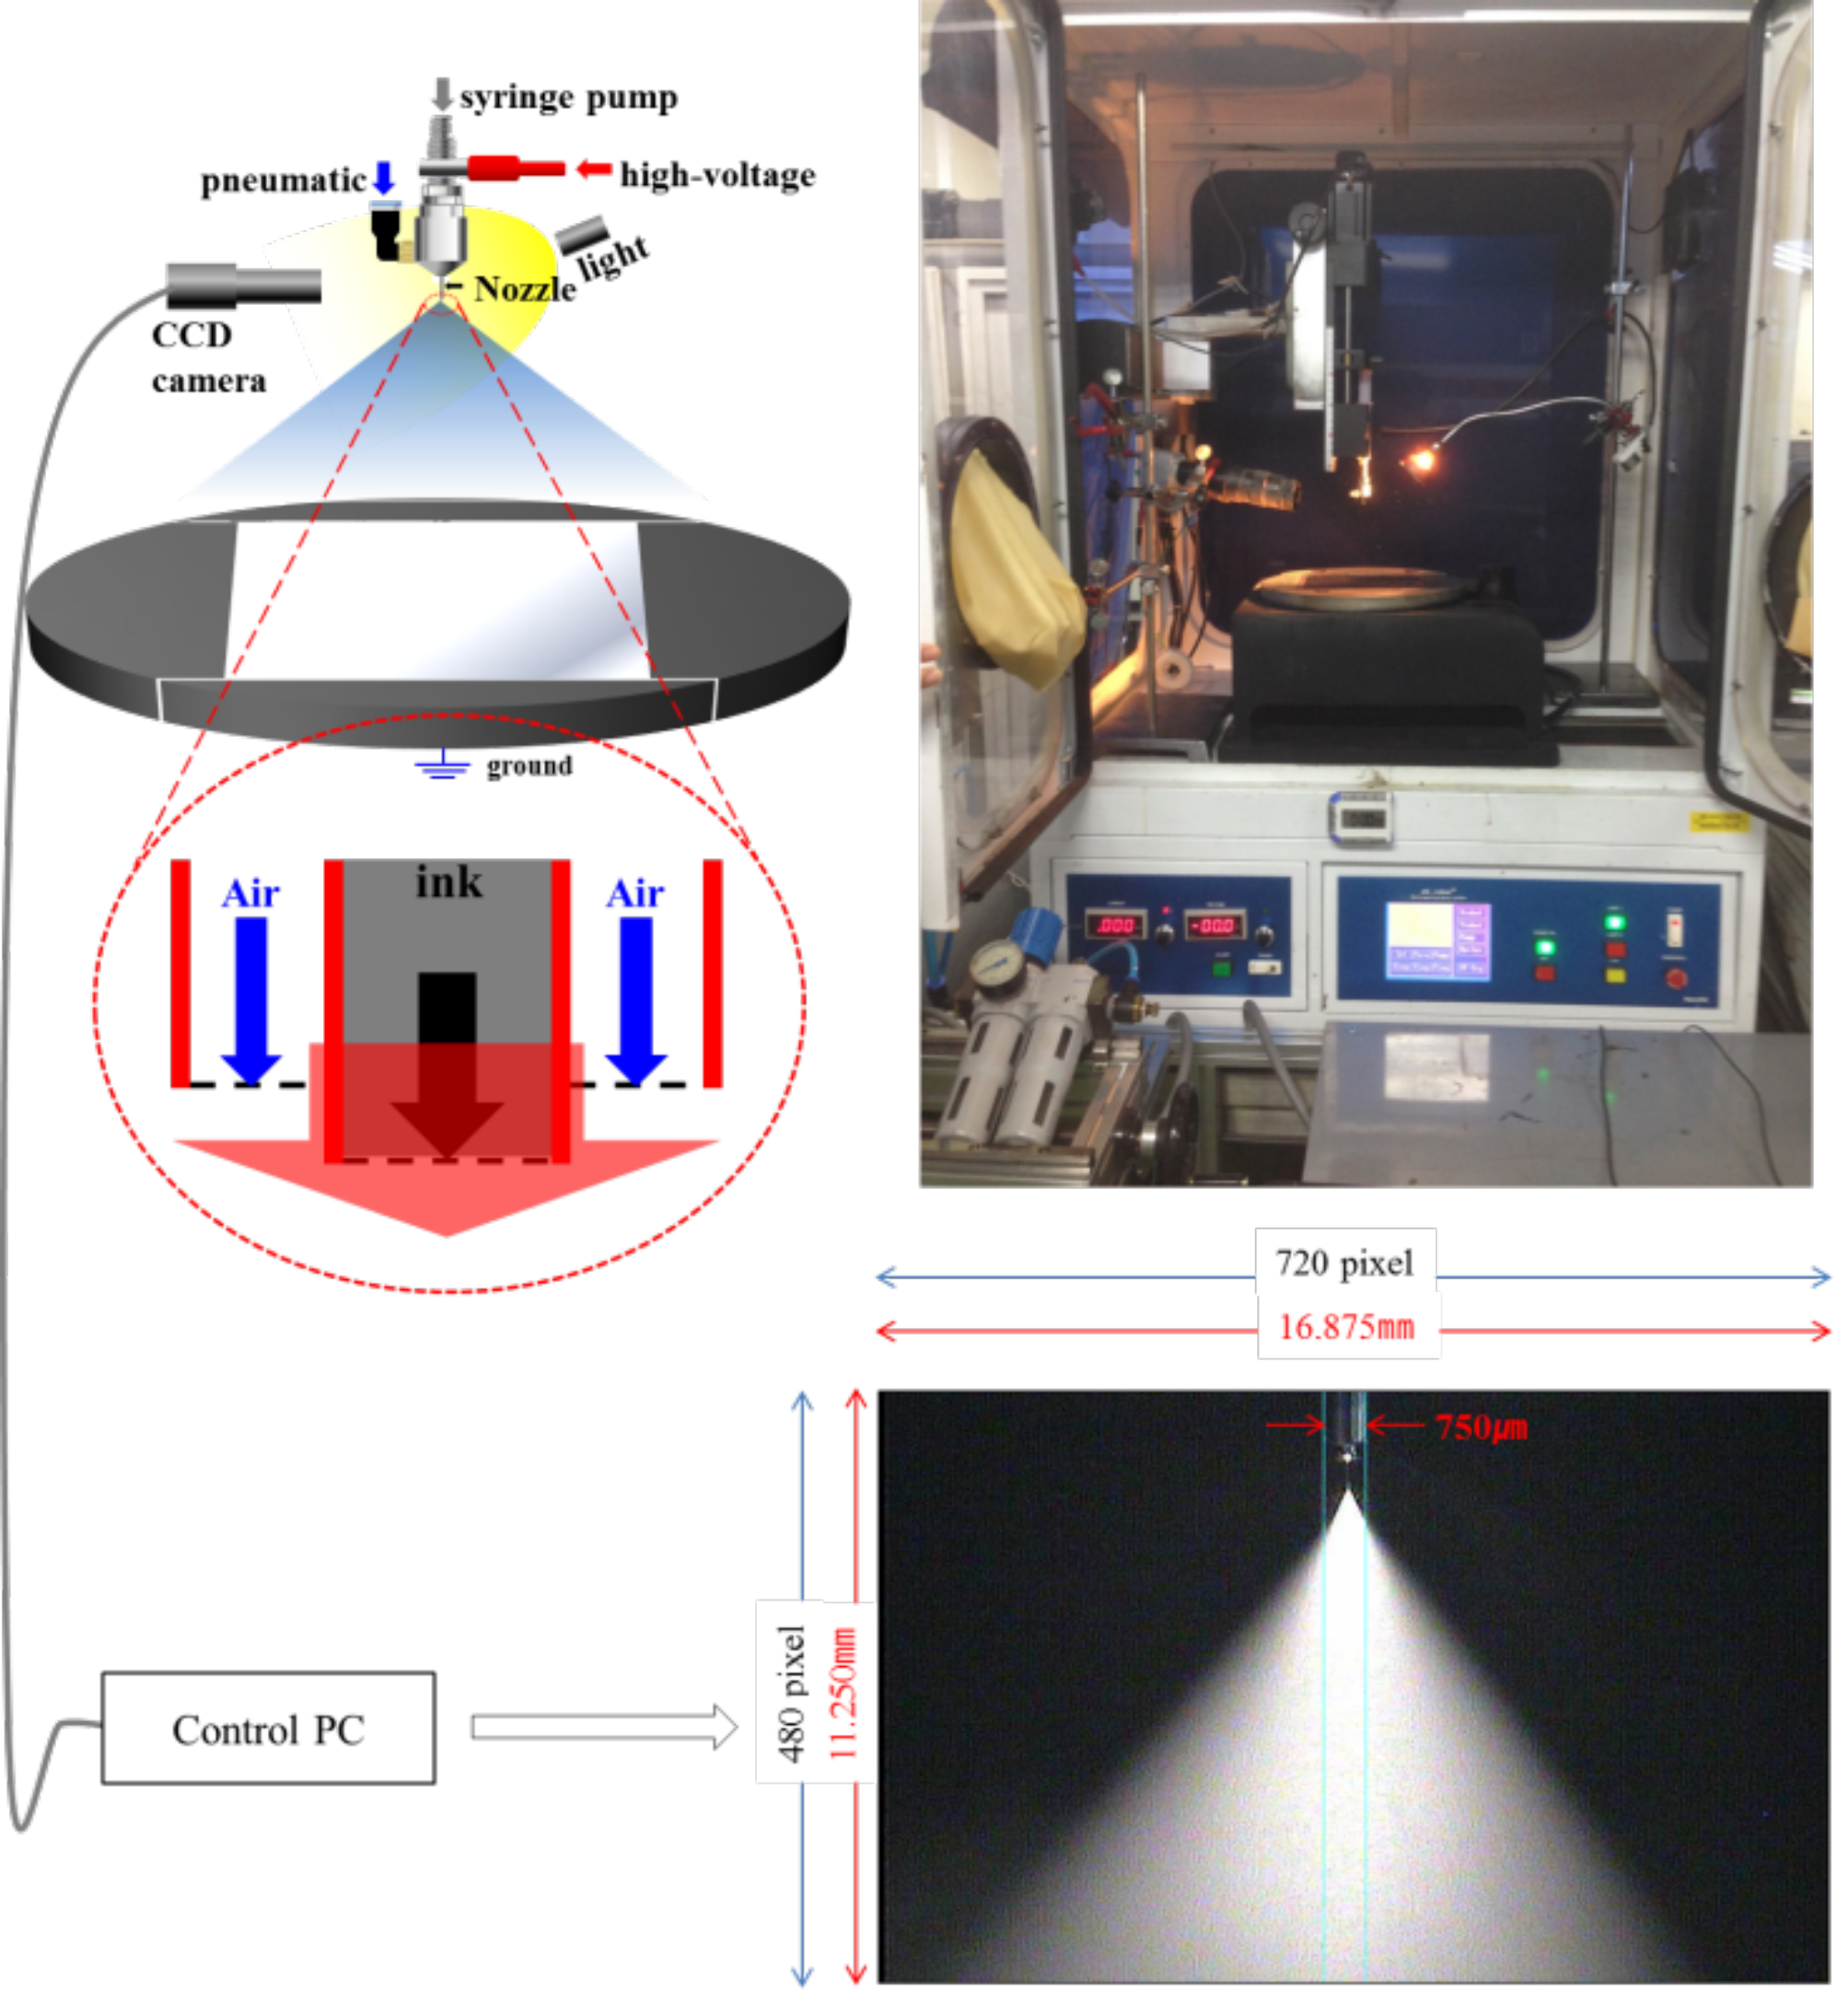
The system setup for hybrid electrostatic atomization is shown in Figure 2. A metallic nozzle with an internal diameter of 100 μm was placed in such a way as to spray the droplets in a downward direction. The theoretical model of the droplet transport in ESD is presented in O. Wilhelm et al. [20] and A. M. Gañán-Calvo et al. [21]. The droplet transport is mainly affected by the drag force by the surrounding gas, the force on the droplets by the external electric field between nozzle and substrate and the mutual electric forces between the charged droplets and induced charge on the conductive substrate by the charged droplets. The gravity force is negligible compared with those forces. Thus, in principle, the similar results would be observed and suggested even if the spray was conducted upwards. In our experiment, we used the substrate with a size of 150 × 150 mm2. For the convenience of substrate loading without sagging flexible films, we used the upward ESD. The coating solution was supplied to the nozzle by a syringe pump. Droplet atomization was induced by the electric field between the metallic nozzle and the substrate though the high-voltage power supply (0~21 kV), and the pressure of pneumatic air (0~5 bar) supplied from outside the coating solution in the nozzle. The dispersion shape of the spray was monitored in real time by a CCD camera interfaced with a PC. The CCD camera could measure images with a pixel resolution of 23.4 μm and a field of view of 16.875 mm × 11.25 mm. The images of spray patterns were gathered at the frame rate of 30 frames/s and the exposure time of 1/60 s. To investigate the method of quantifying the droplet transport, a model-fluid (a solution of blue dye dispersed in ethanol) generally used in evaluating the inkjet printing process was used as the coating solution. Ethanol is sprayed generally in the ESD process [2,3,4], and the thickness variation of the deposited thin film can be monitored easily by evaluating the contrast in the color of the dye. Assuming that the blue dye was well dispersed in the ethanol solution, the concentration of blue dye per unit area will be linearly correlated with the thickness of solution in the same unit area. The blue dye mainly absorbs light whose wavelength is in the range of the orange color, which is complementary to the blue color. As the absorbance is linearly correlated to the dye concentration under Beer’s law, the contrast of the blue color would increase with the concentration of the blue dye. As a result, the thickness variation of the coated solution can be monitored by examining the contrast of the blue color in the coated thin film. An inkjet photo paper with dimensions of 150 mm × 150 mm was used as the substrate.
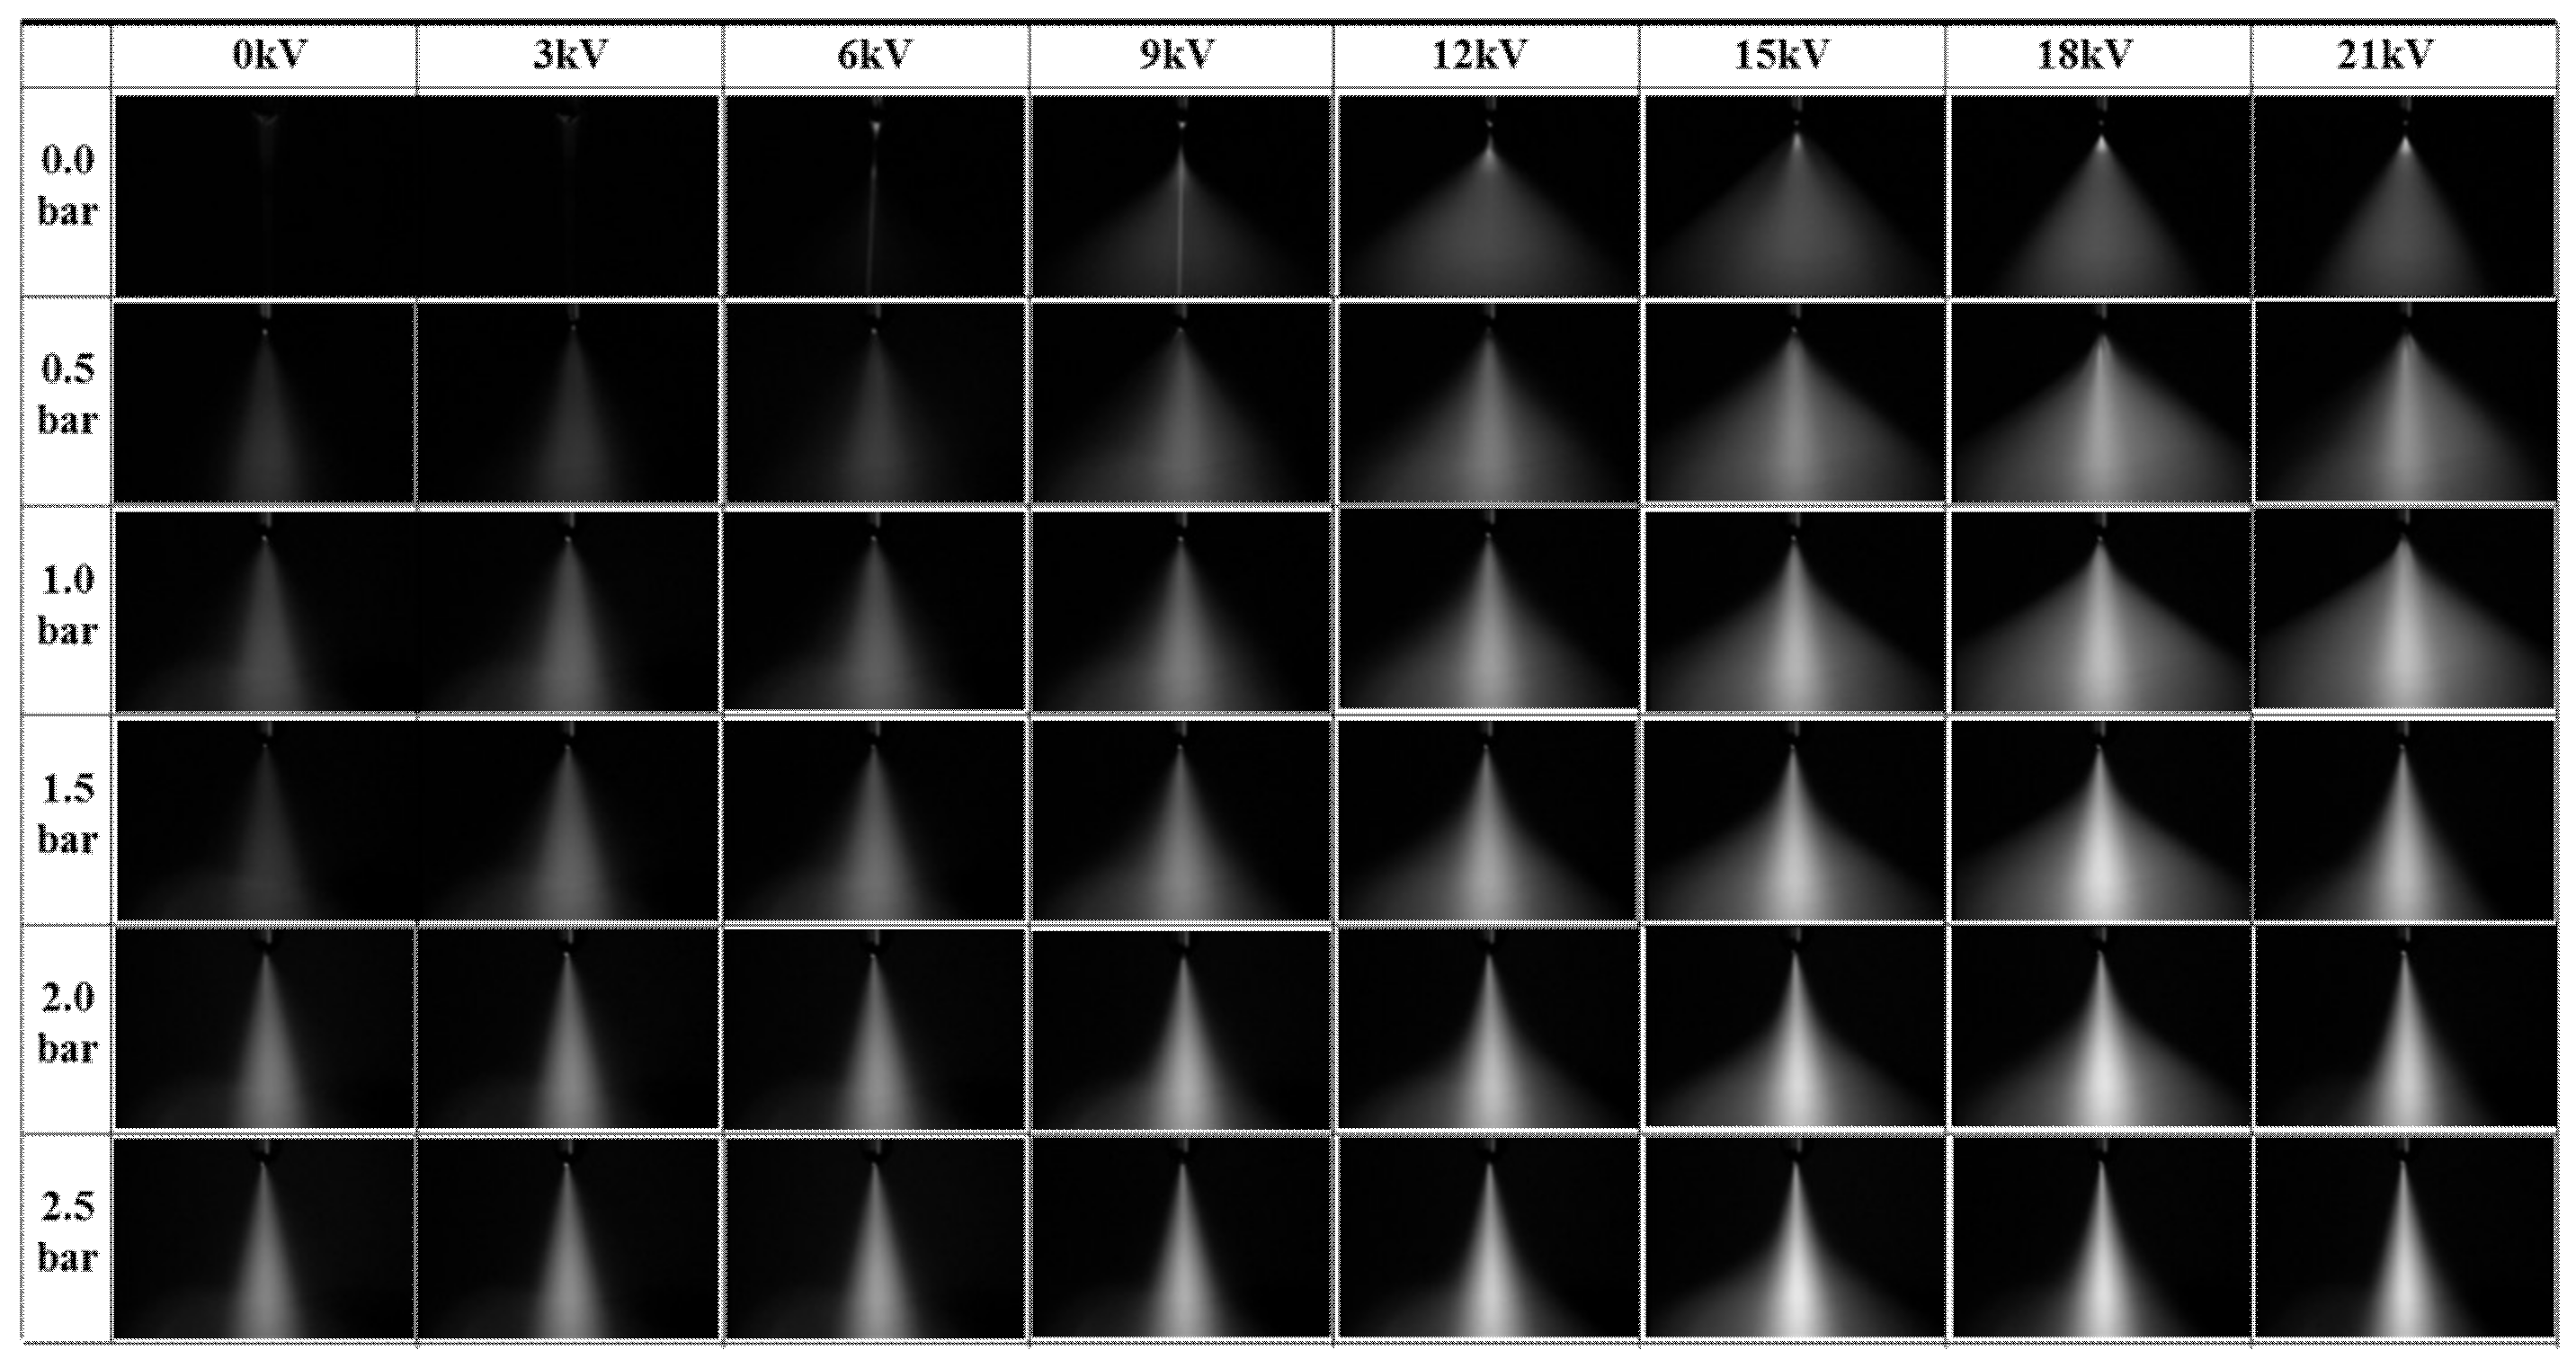
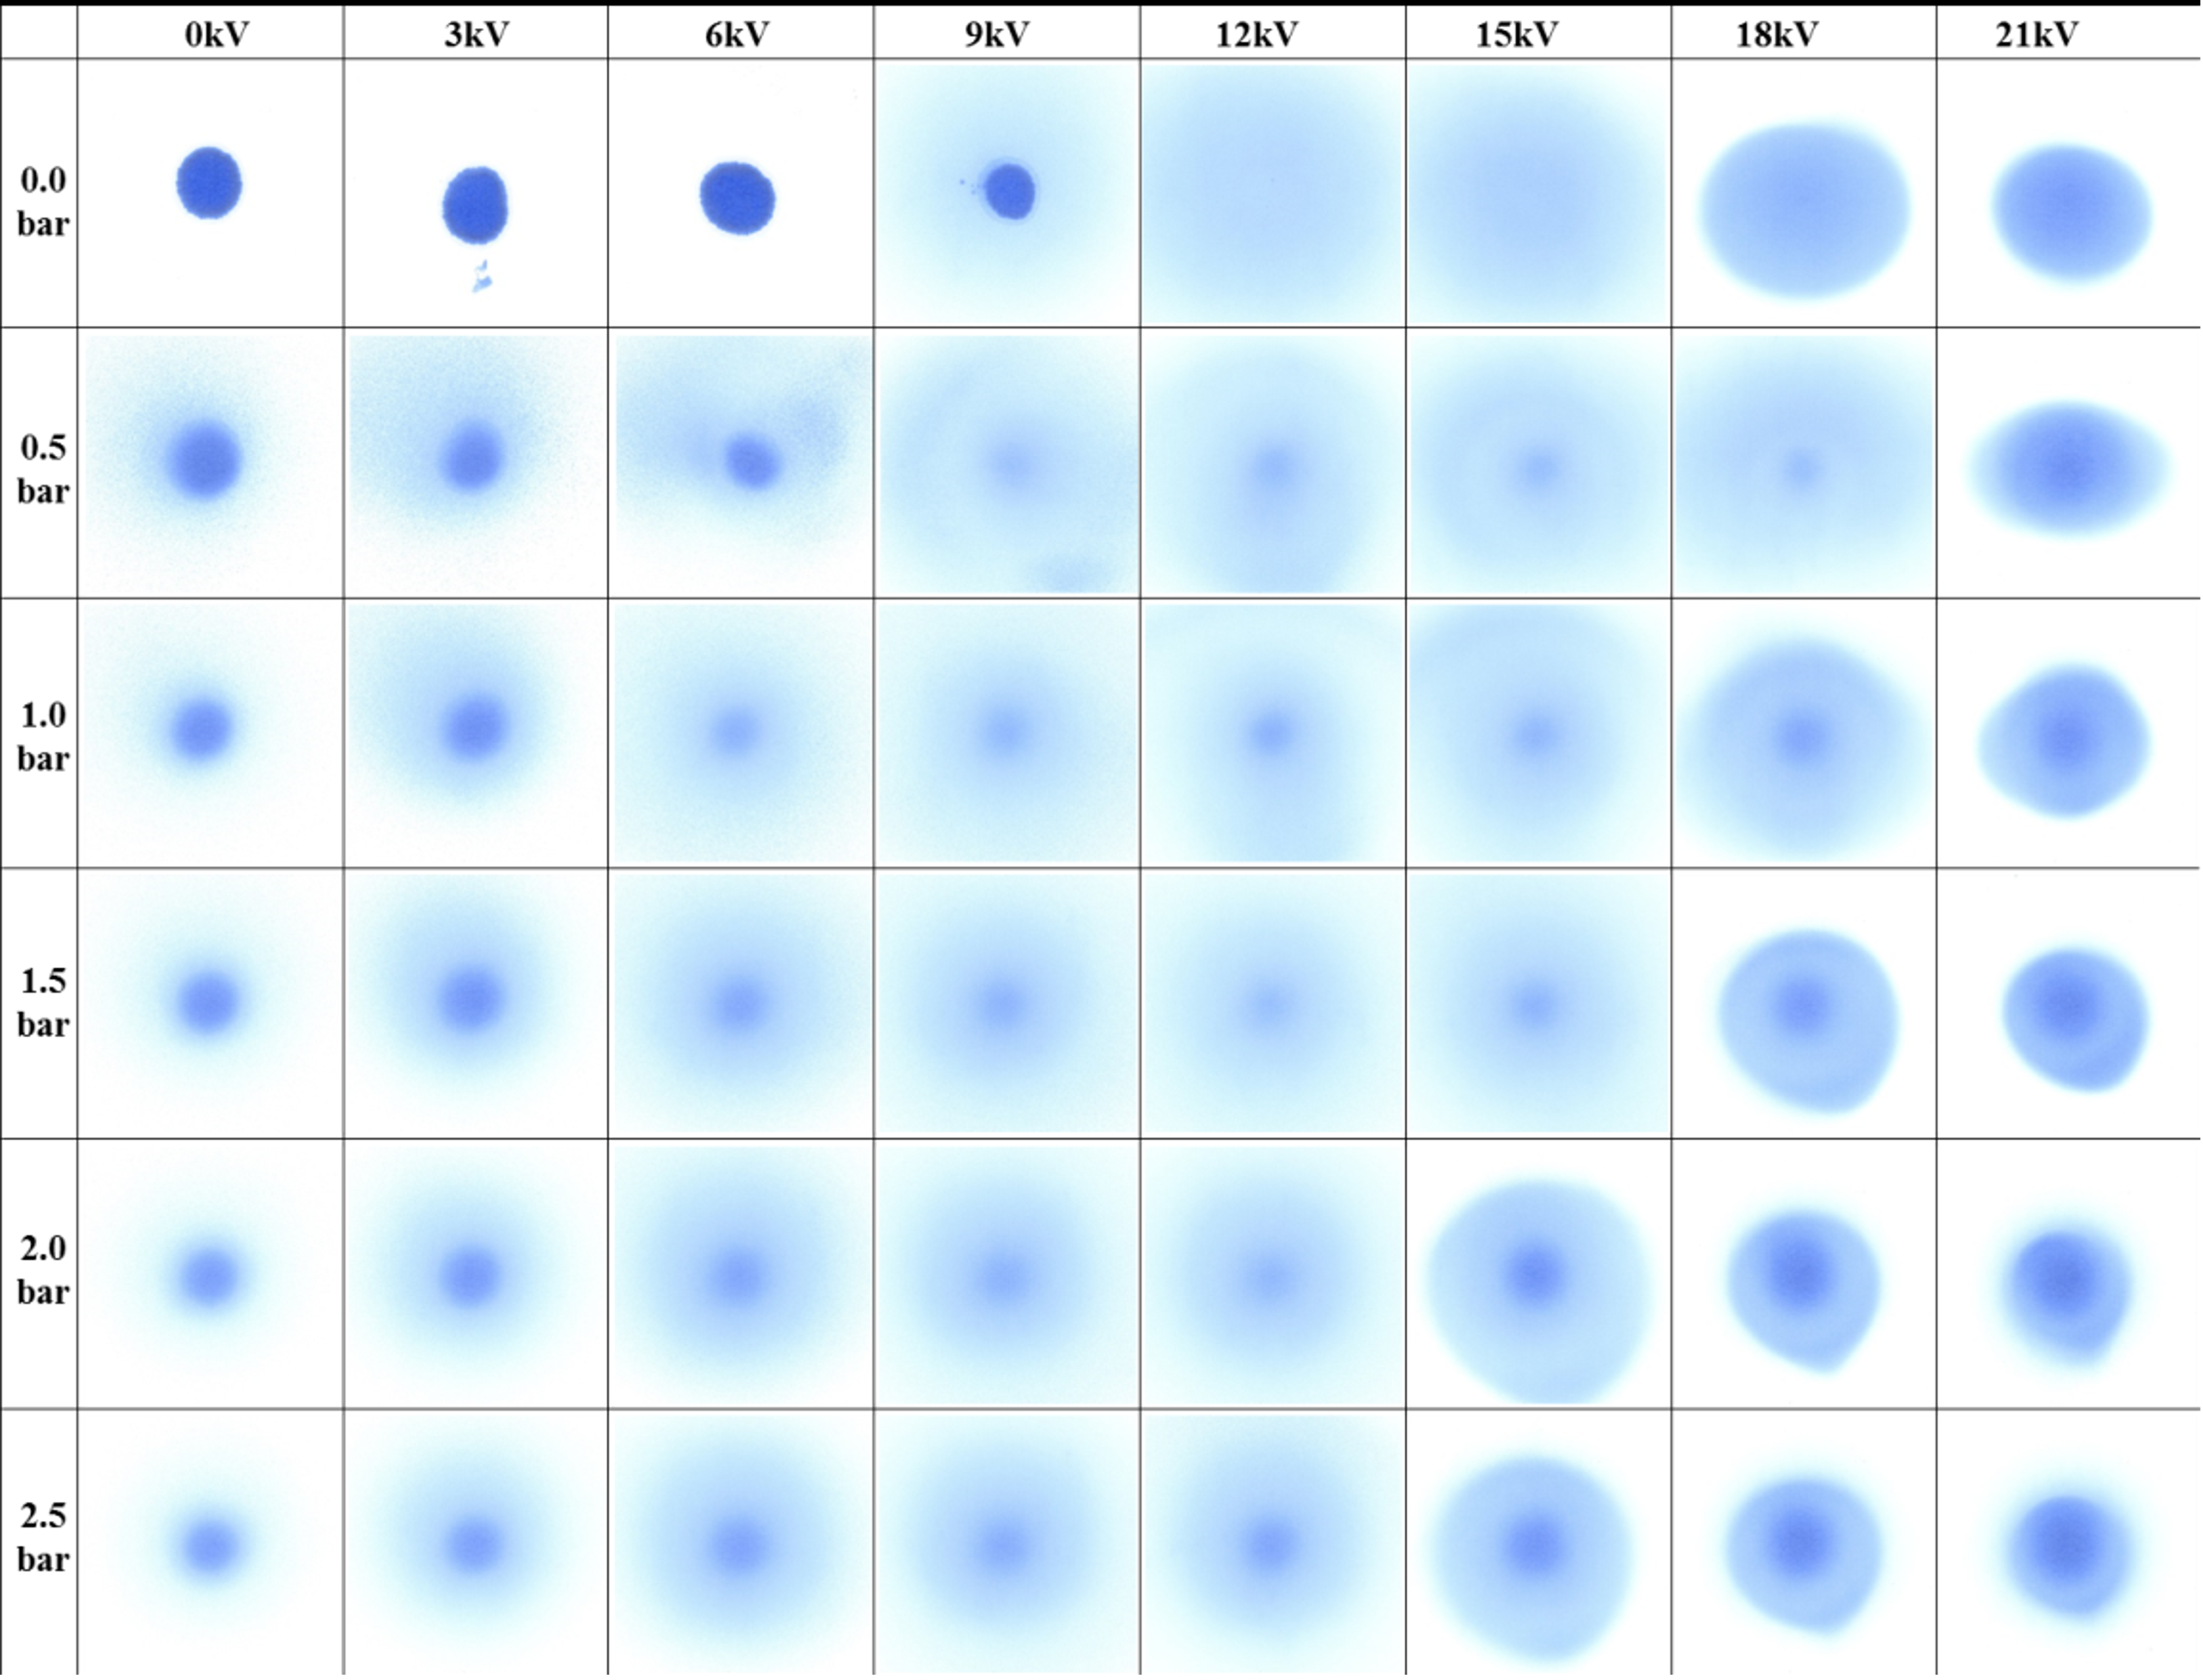
The images of spray patterns were gathered by conducting a split test of the electric field and the pneumatic pressure while the other process variables were set as the process conditions shown in Table 1. In total, 60 images were gathered in each process condition and the set of the averaged images obtained from the split test are shown in Figure 3. Without supplying pneumatic air, the spray shapes show the conventional aspect of the ESD process, in which the spray mode is transited gradually from the dripping mode to the cone-jet mode with the increase in the electric field. Above a certain voltage (18 kV), however, the dispersion angle of the spray is reduced because the attraction forces between the substrate and the droplets become higher than the repulsion forces among the droplets. The pressure of the pneumatic air helps to generate the spray even in the low electric field. However, turbulence and line jets are visible in the condition where both the pressure of the pneumatic air and the electric field are low.
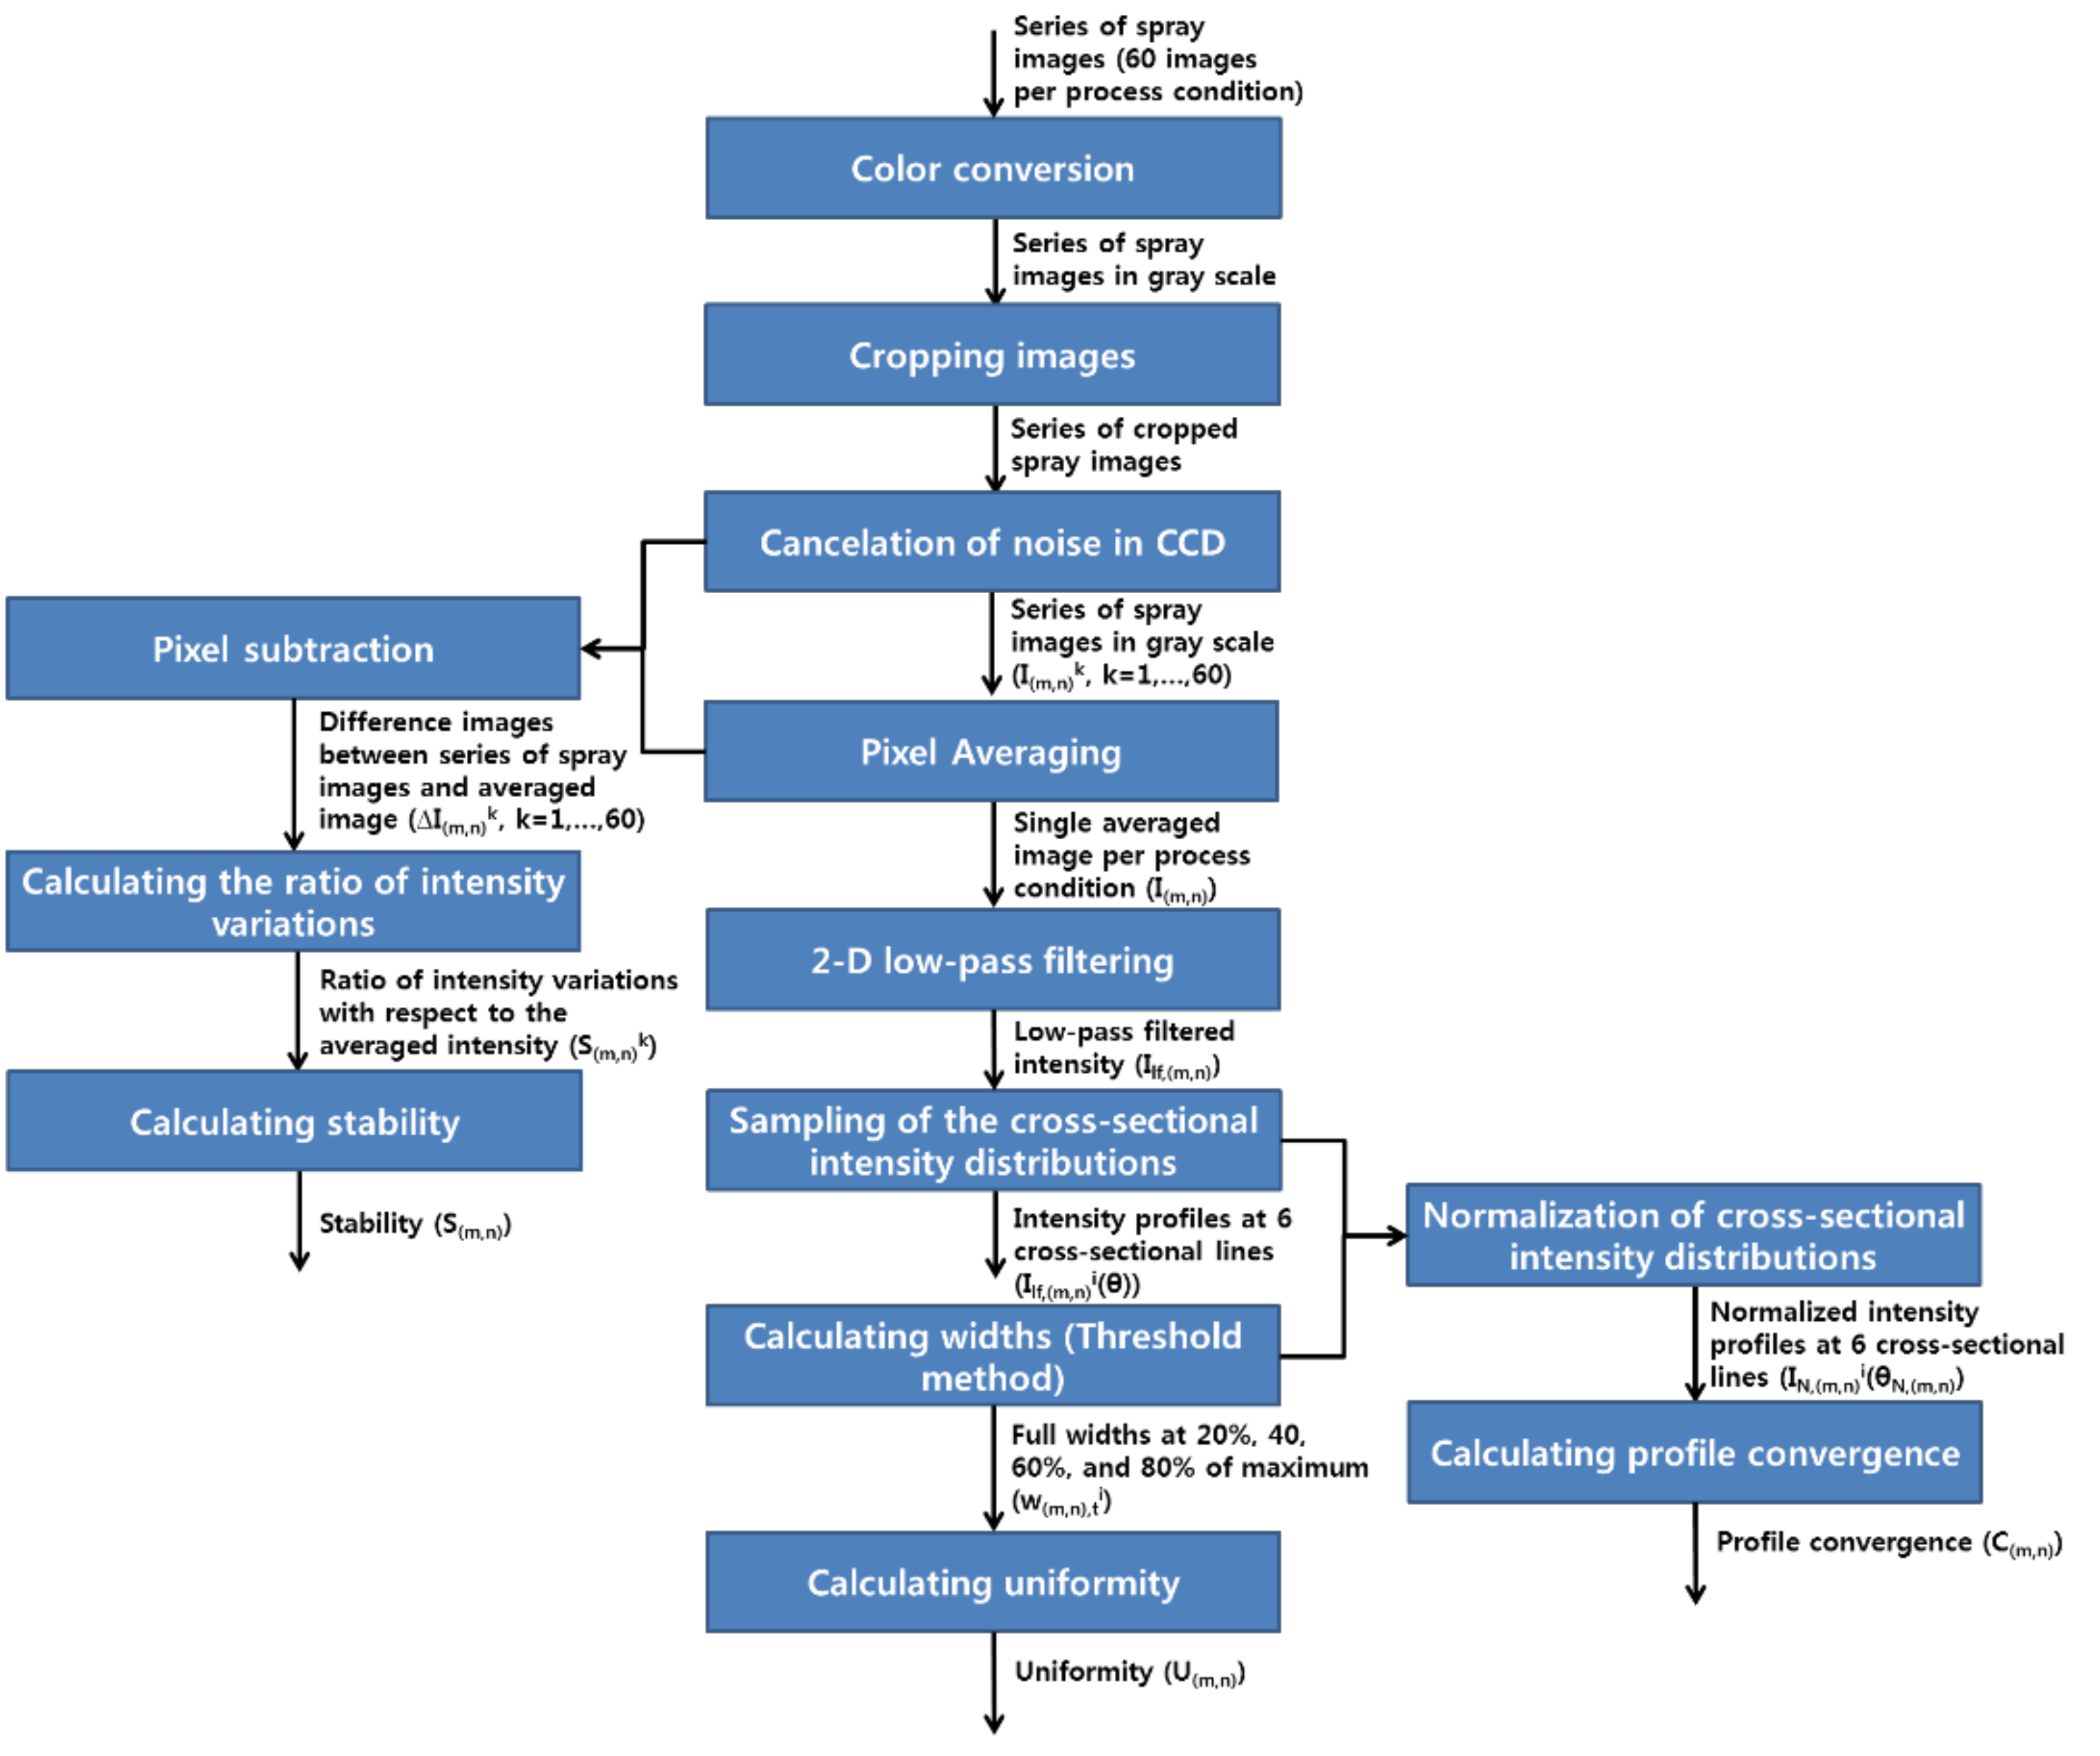
The quantification method for evaluating the characteristics of the spray shapes, such as the uniformity of the droplet density, the stability of the spray and the profile convergence, is presented using the images of spray in splited process conditions. The flow chart of the algorithm is given in Figure 4. The algorithm can be roughly divided into two steps. The first step consists of image processing using the images of the spray shapes captured by the vision system, while the second step consists in the extracting of quantification parameters for evaluating the droplet transport during the ESD process from the processed images.
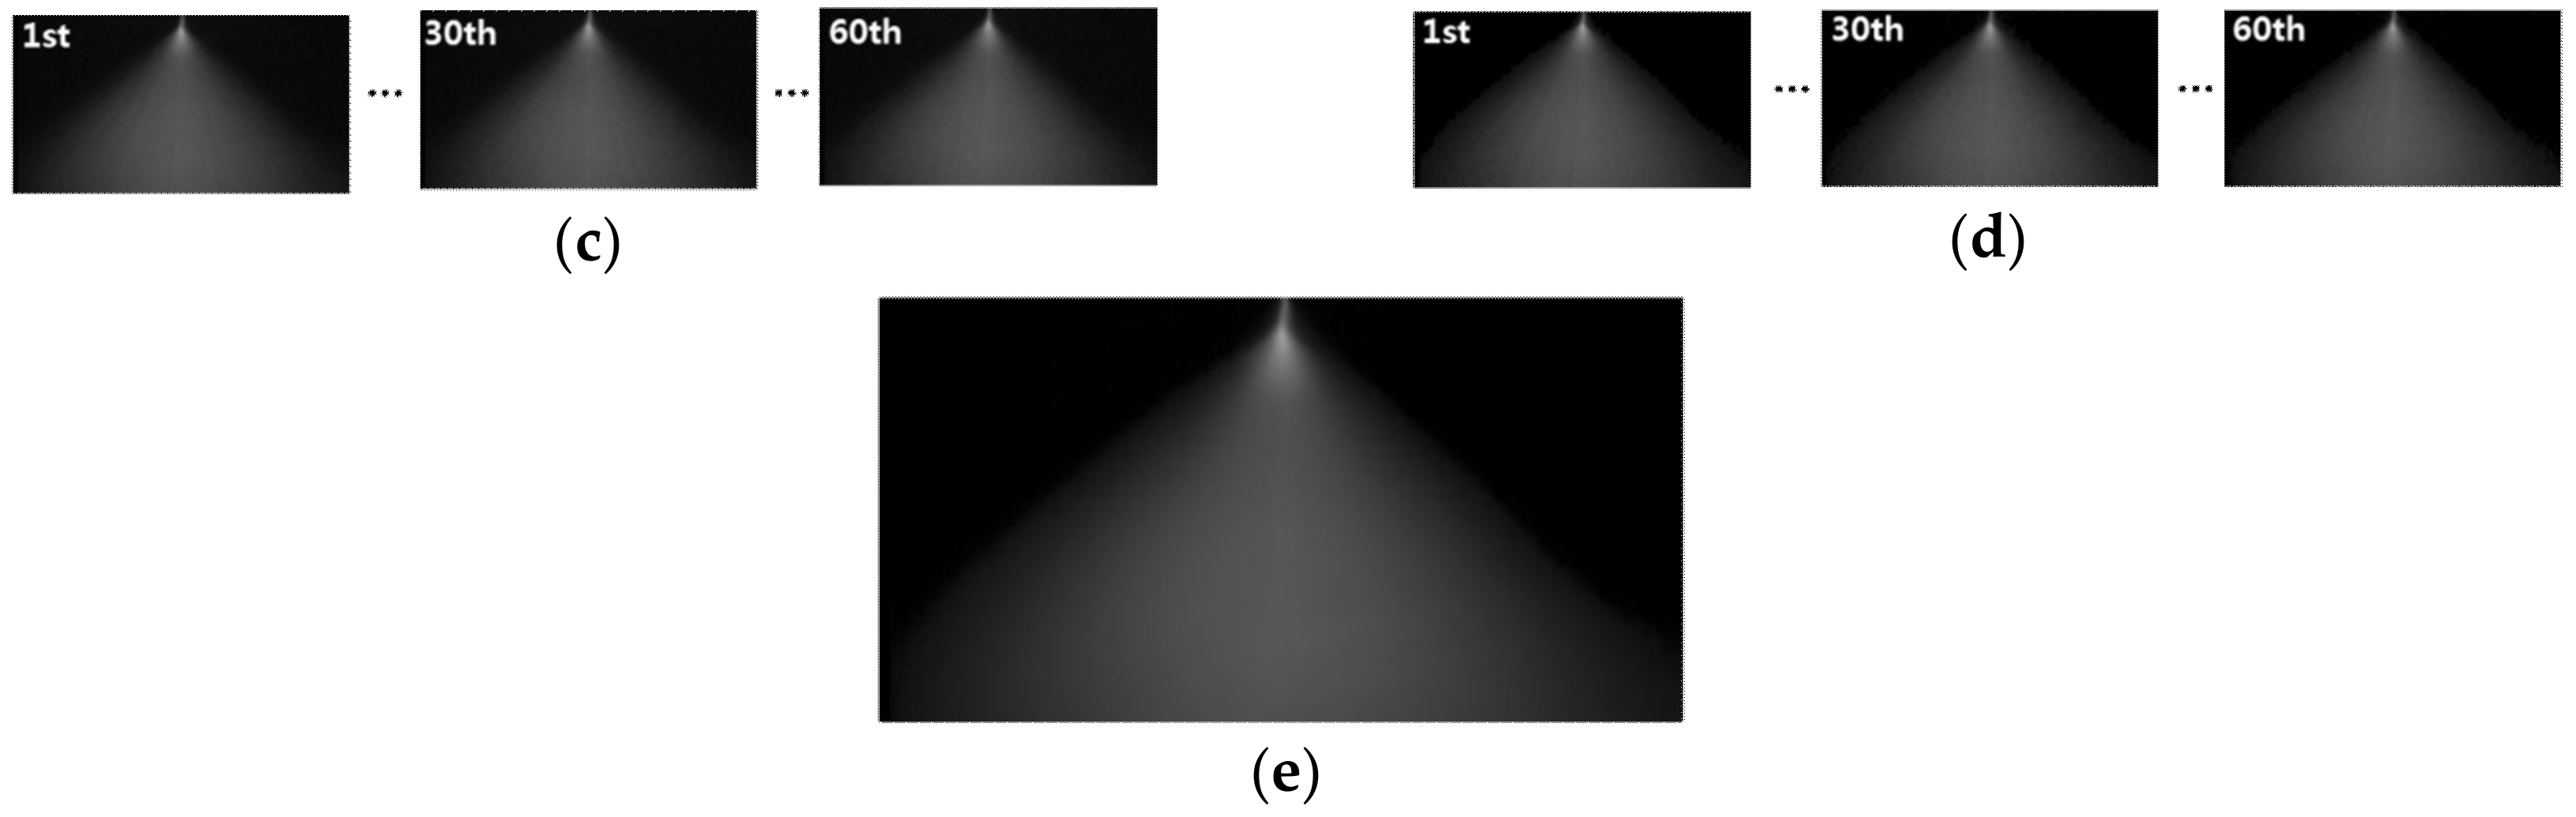
The first step begins as the series of spray images that there are 60 images per each process condition are gathered and the color of the captured images is converted to 2-dimensional intensity distribution in a gray scale having the display range of pixels from 0 to 255. The nozzle area is cropped from the spray images so that only the area of spray patterns is used for the analysis. Then, the noise of pixels in CCD (Charge-Coupled Device) is calculated by the threshold method in that the measured values of pixels are set to 0 if the measured value of pixels are less than the specified threshold value. In the analysis, the threshold value was set to 16 to effectively remove the most intensity variations in areas without spray jets. It may contribute to improve the estimation accuracy of calculating the jet stability by excluding the CCD noise. Next, the averaged intensity distribution (I(m,n)) was calcualted from 60 gray scale images (I(m,n)1, I(m,n)2, …, I(m,n)60) gathered in each process condition.
where m and n are the pnematic pressure and the electric field, which are matched with the array of images in Figure 3, x is the pixel index in the horizontal direction, y is the pixel index in the vertical direction and k means the order of the captured images. In the analysis, the averaged intensity distribitions are regarded as representative of each process condition. The example of analyzing the spray pattern at the electric field of 15 kV and the pneumatic pressure of 0.0 bar is shown in Figure 5.
Then, to investigate the uniformity of the spray, a low-pass filtered intensity distribution (Ilf,(m,n)(x,y)) is generated using the two-dimensional FIR filter based on the following magnitude response and the hamming window function [22]:
where hlp is the magnitude response used to generate the FIR low-pass filter, fx and fy are the normalized frequencies devided by half of the sampling frequencies in the x and y directions respectively, and lfxc and lfyc are the normalized cut-off frequencies in the x and y directions respectively. In this analysis, the filter order is 200 × 200; lfxc and lfyc, are set to 0.05. The examples of filtered intensity distribution, which can represent the typical purpose of the abovementioned low-pass filter, are given in Figure 6a. The smooth overall shape of the intensity distribution is obtained after low-pass filtering.
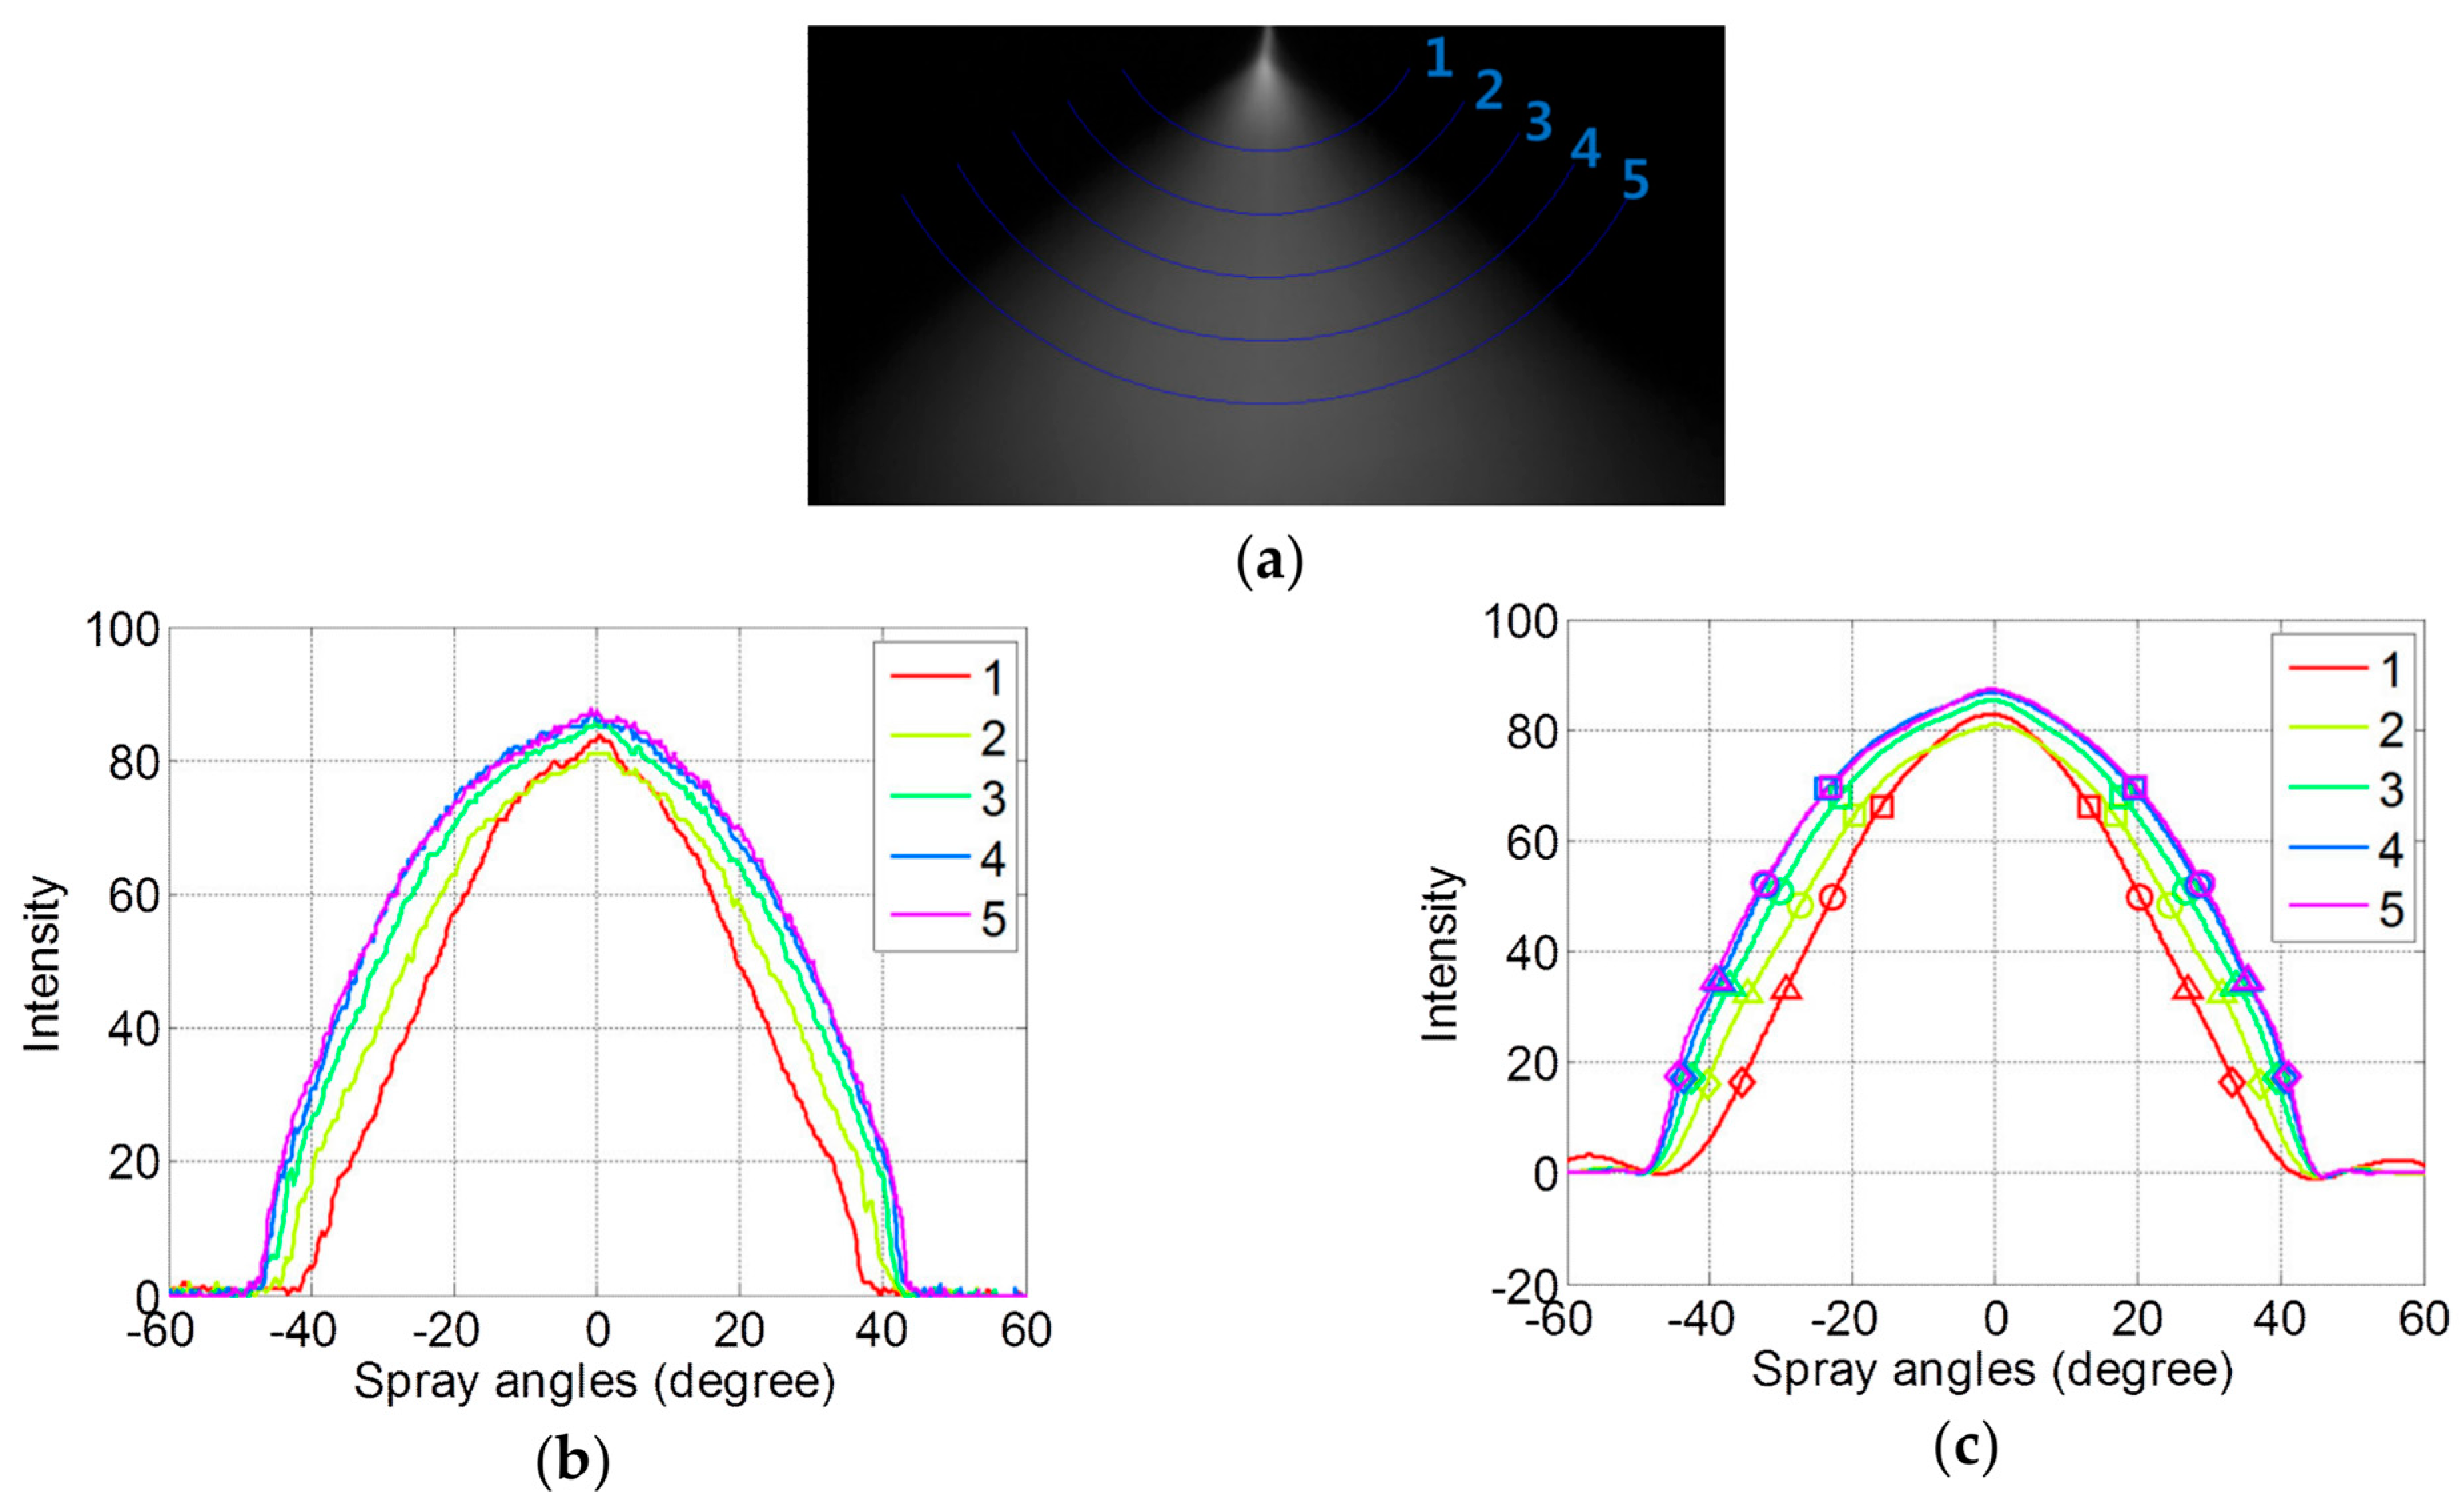
To observe the changes in the droplet density distribution depending on the distance from the nozzle, the intensity profiles are sampled from several circular cross-sections, which are located equi-distantly at intervals of 50 pixels, as shown in Figure 6a. As the sampled positions are not matched exactly with the pixel positions when the circular cross-section was applied, the intensity at the sampled points are linearly interpolated using the intensities at the four nearest pixels of the sampled position. The sampled intensity profiles of the original intensity, and the low-pass filtered intensity (Ilf,(m,n)i(θ), i means the sampled line number and θ is the spray angle) at the electric field of 15 kV and the pneumatic pressure of 0.0 bar are shown in Figure 6b,c respectively and the line numbers are determined in ascending order from the top. In the analysis, it is assumed that the intensity distribution within each cross-section is linearly correlated with the droplet density in the cross-section. For mono-sized particles whose size is smaller than the wavelength of the light, the particle density shows a linear relationship with the intensity of the scattered light and the correlation between the particle density and the intensity is still maintained as the size of particles become larger even though the linearity is slightly reduced [23]. However, in the ESD process, the droplets in spray patterns near the nozzle are not mono-sized and the size of droplets are generally larger than the wavelenth of the light. It is assumed that the droplets in the spray pattern may have the similar sizes when the droplets are located at equidistance from the nozzle because the size of droplets will be gradually reduced by the evaporation and disruption during the droplet transport. For this reason, the intensity distribution at circular cross-sections in which the origin of the cross-section located at the tip of the nozzle was sampled to reduce the distribution of the droplet sizes, as shown in Figure 6. As the above assumption is insufficient to prove that the characteristics of the coated thin films can be estimated by monitoring the spray patterns, the correlation of the extracted parameters between the spray patterns and the coated thin films is proven in the next section (see Supplementary Figures S1 and S2).
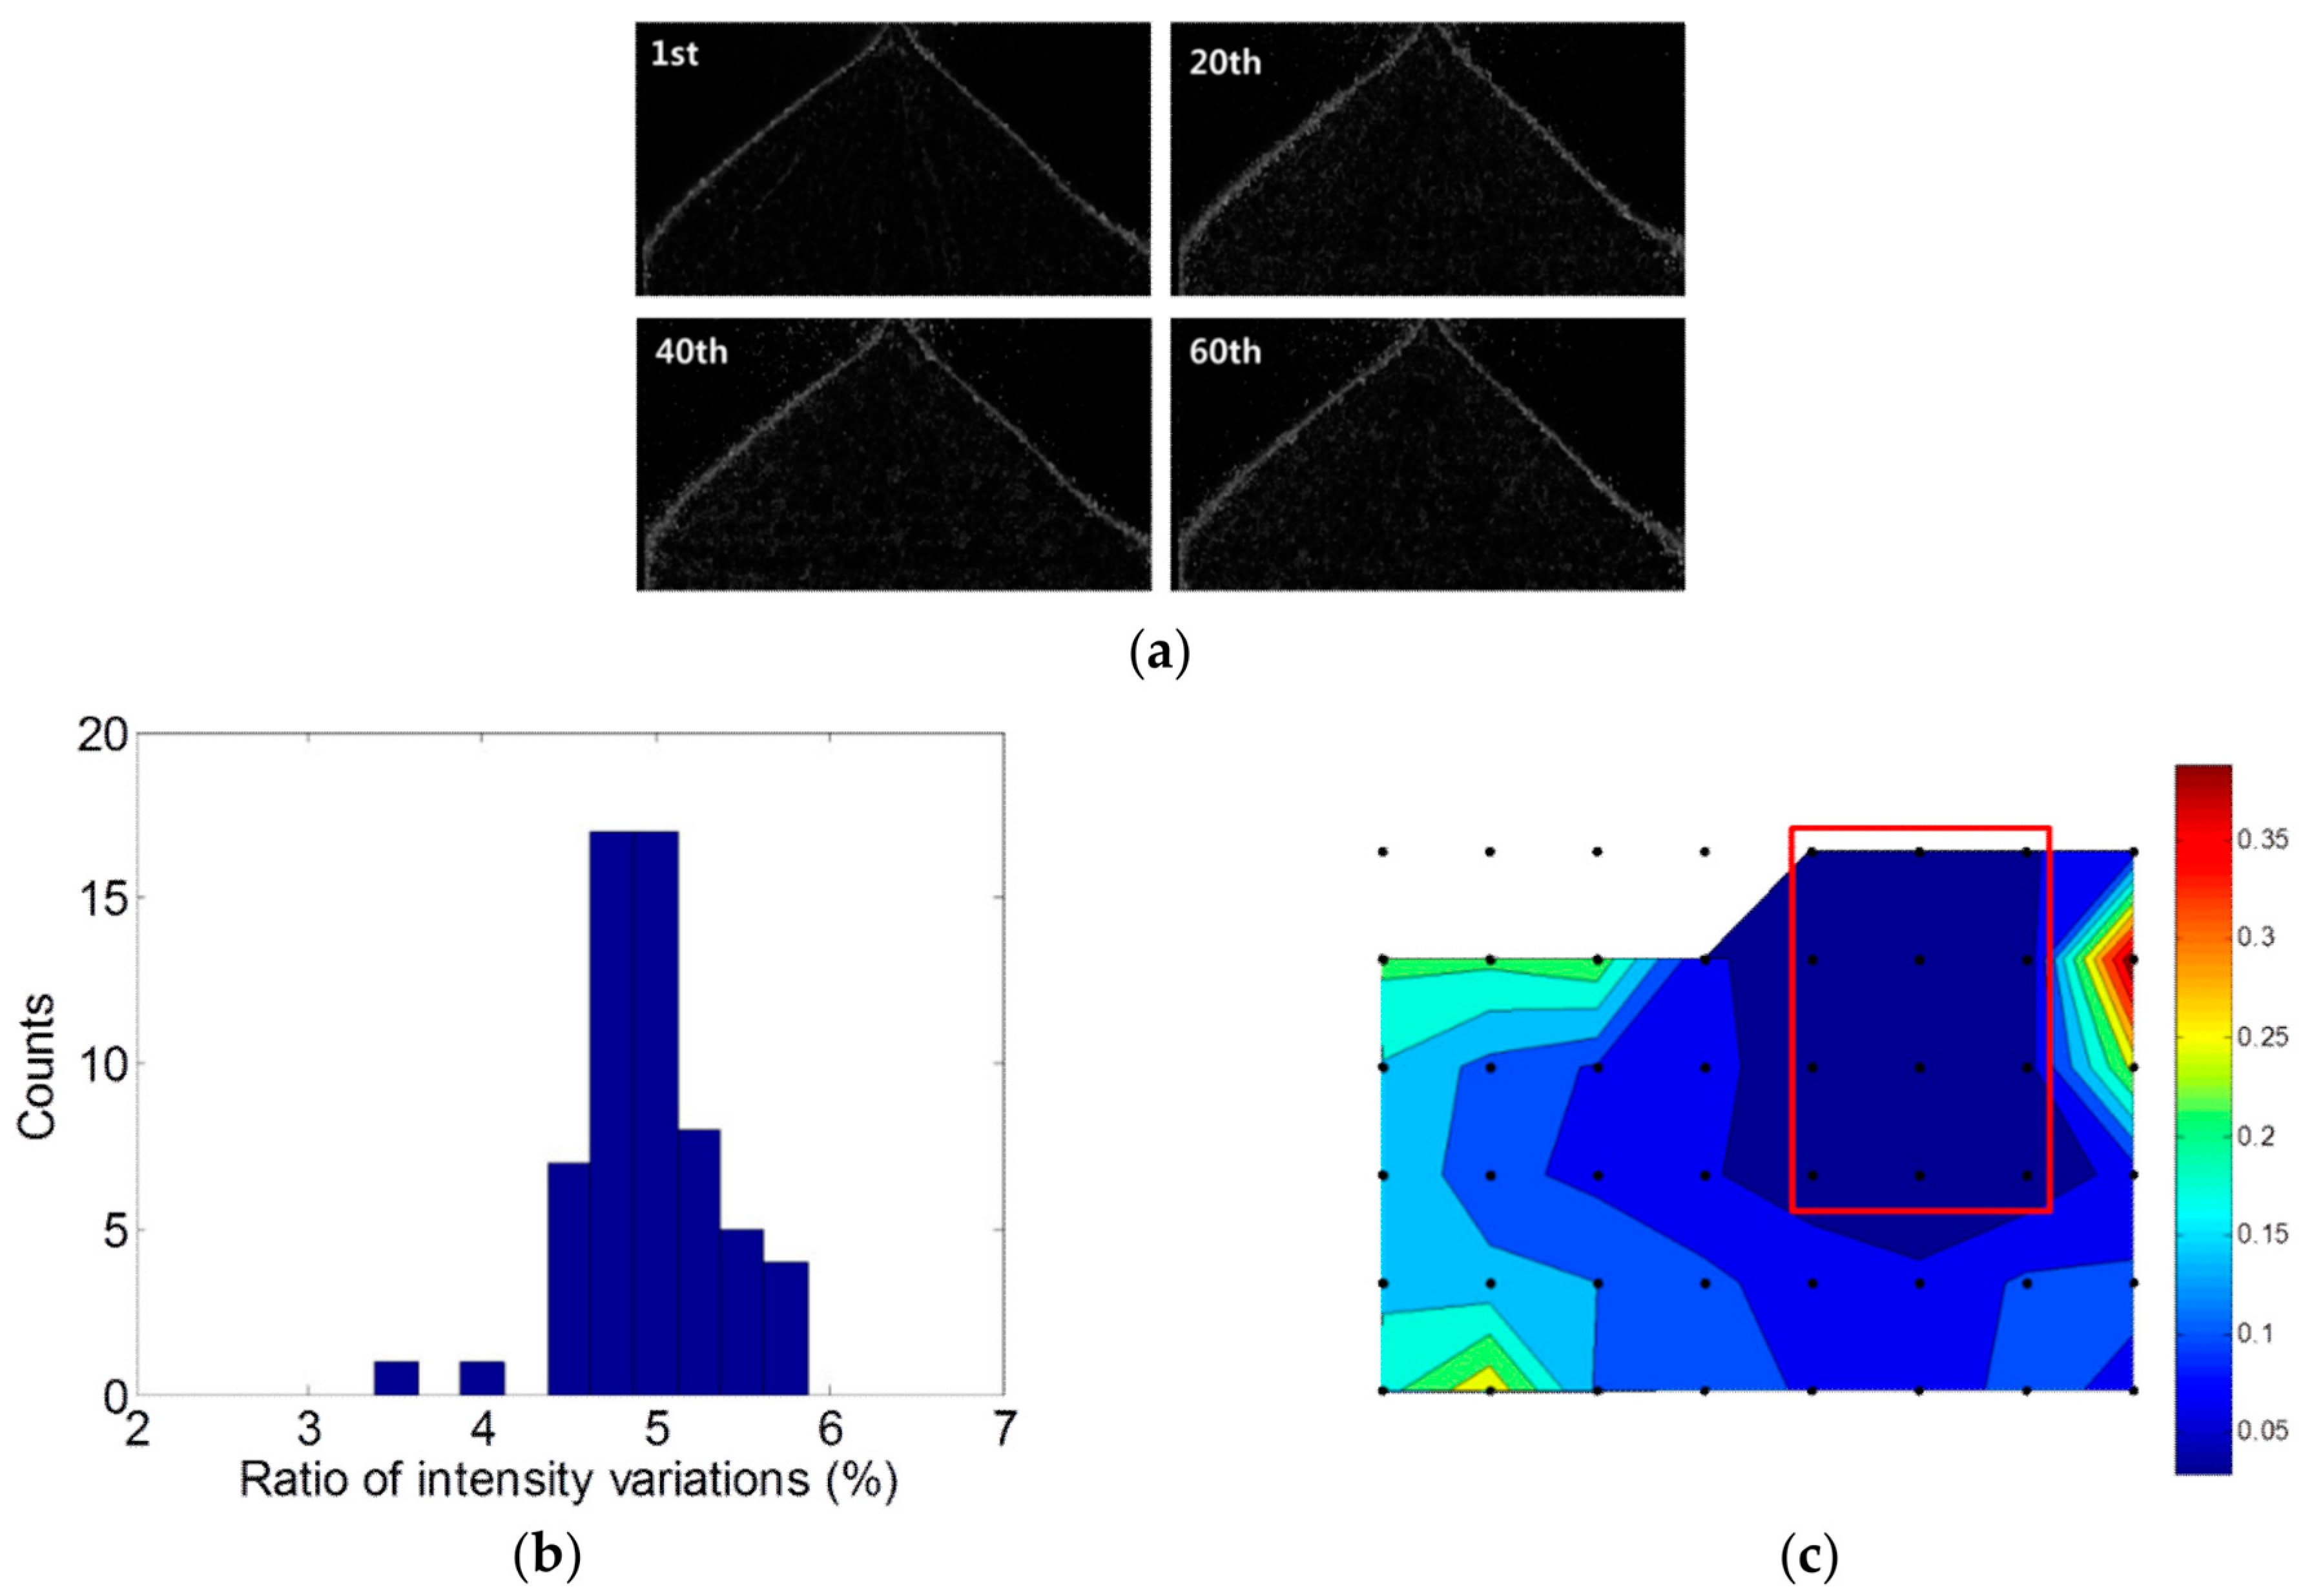
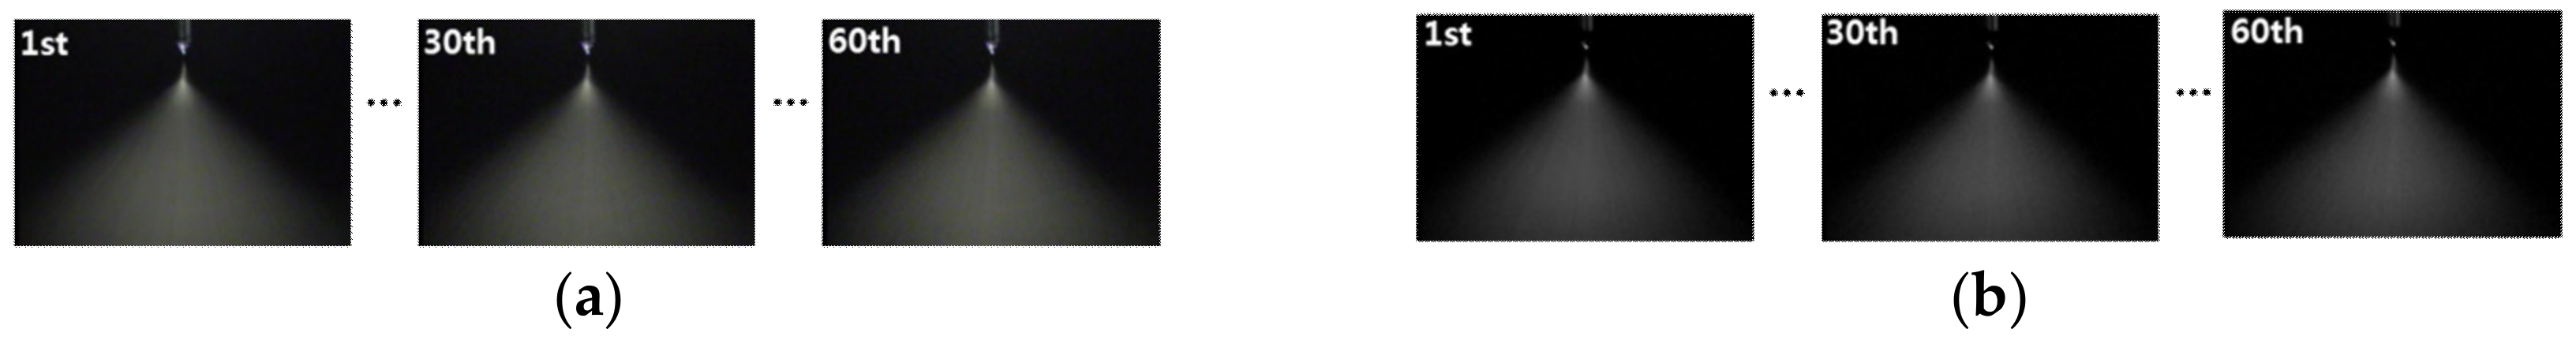
The second step includes the procedures for extracting parameters that quantify the spray shapes. First, the stability of spray patterns is estimated by the intensity differences (∆I(m,n)k, k = 1, 2,…, 60) between each gray-scale intensity of spray patterns (I(m,n)k) and their averaged intensity distribution (I(m,n)) and the intensity differences are calculated by the pixel subtraction as given in Equation (3). In total, 60 distributions of the intensity differences per each process condition of (m,n) were obtained and the example of the 1st, 20th, 40th and 60th distributions of the intensity differences at the electric field of 15 kV and the pneumatic pressure of 0.0 bar are shown in Figure 7a. In the images in Figure 7a, the display range of the gray-scale from black to white was set from 0 to 30 to demonstrate the differences clearly.
As the measure of the stability of spray patterns, the sum of all pixel values of the intensity difference (I(m,n)k) are calculated and it is normalized by the sum of all pixel values of the averaged intensity (I(m,n)) as shown in Equation (4):
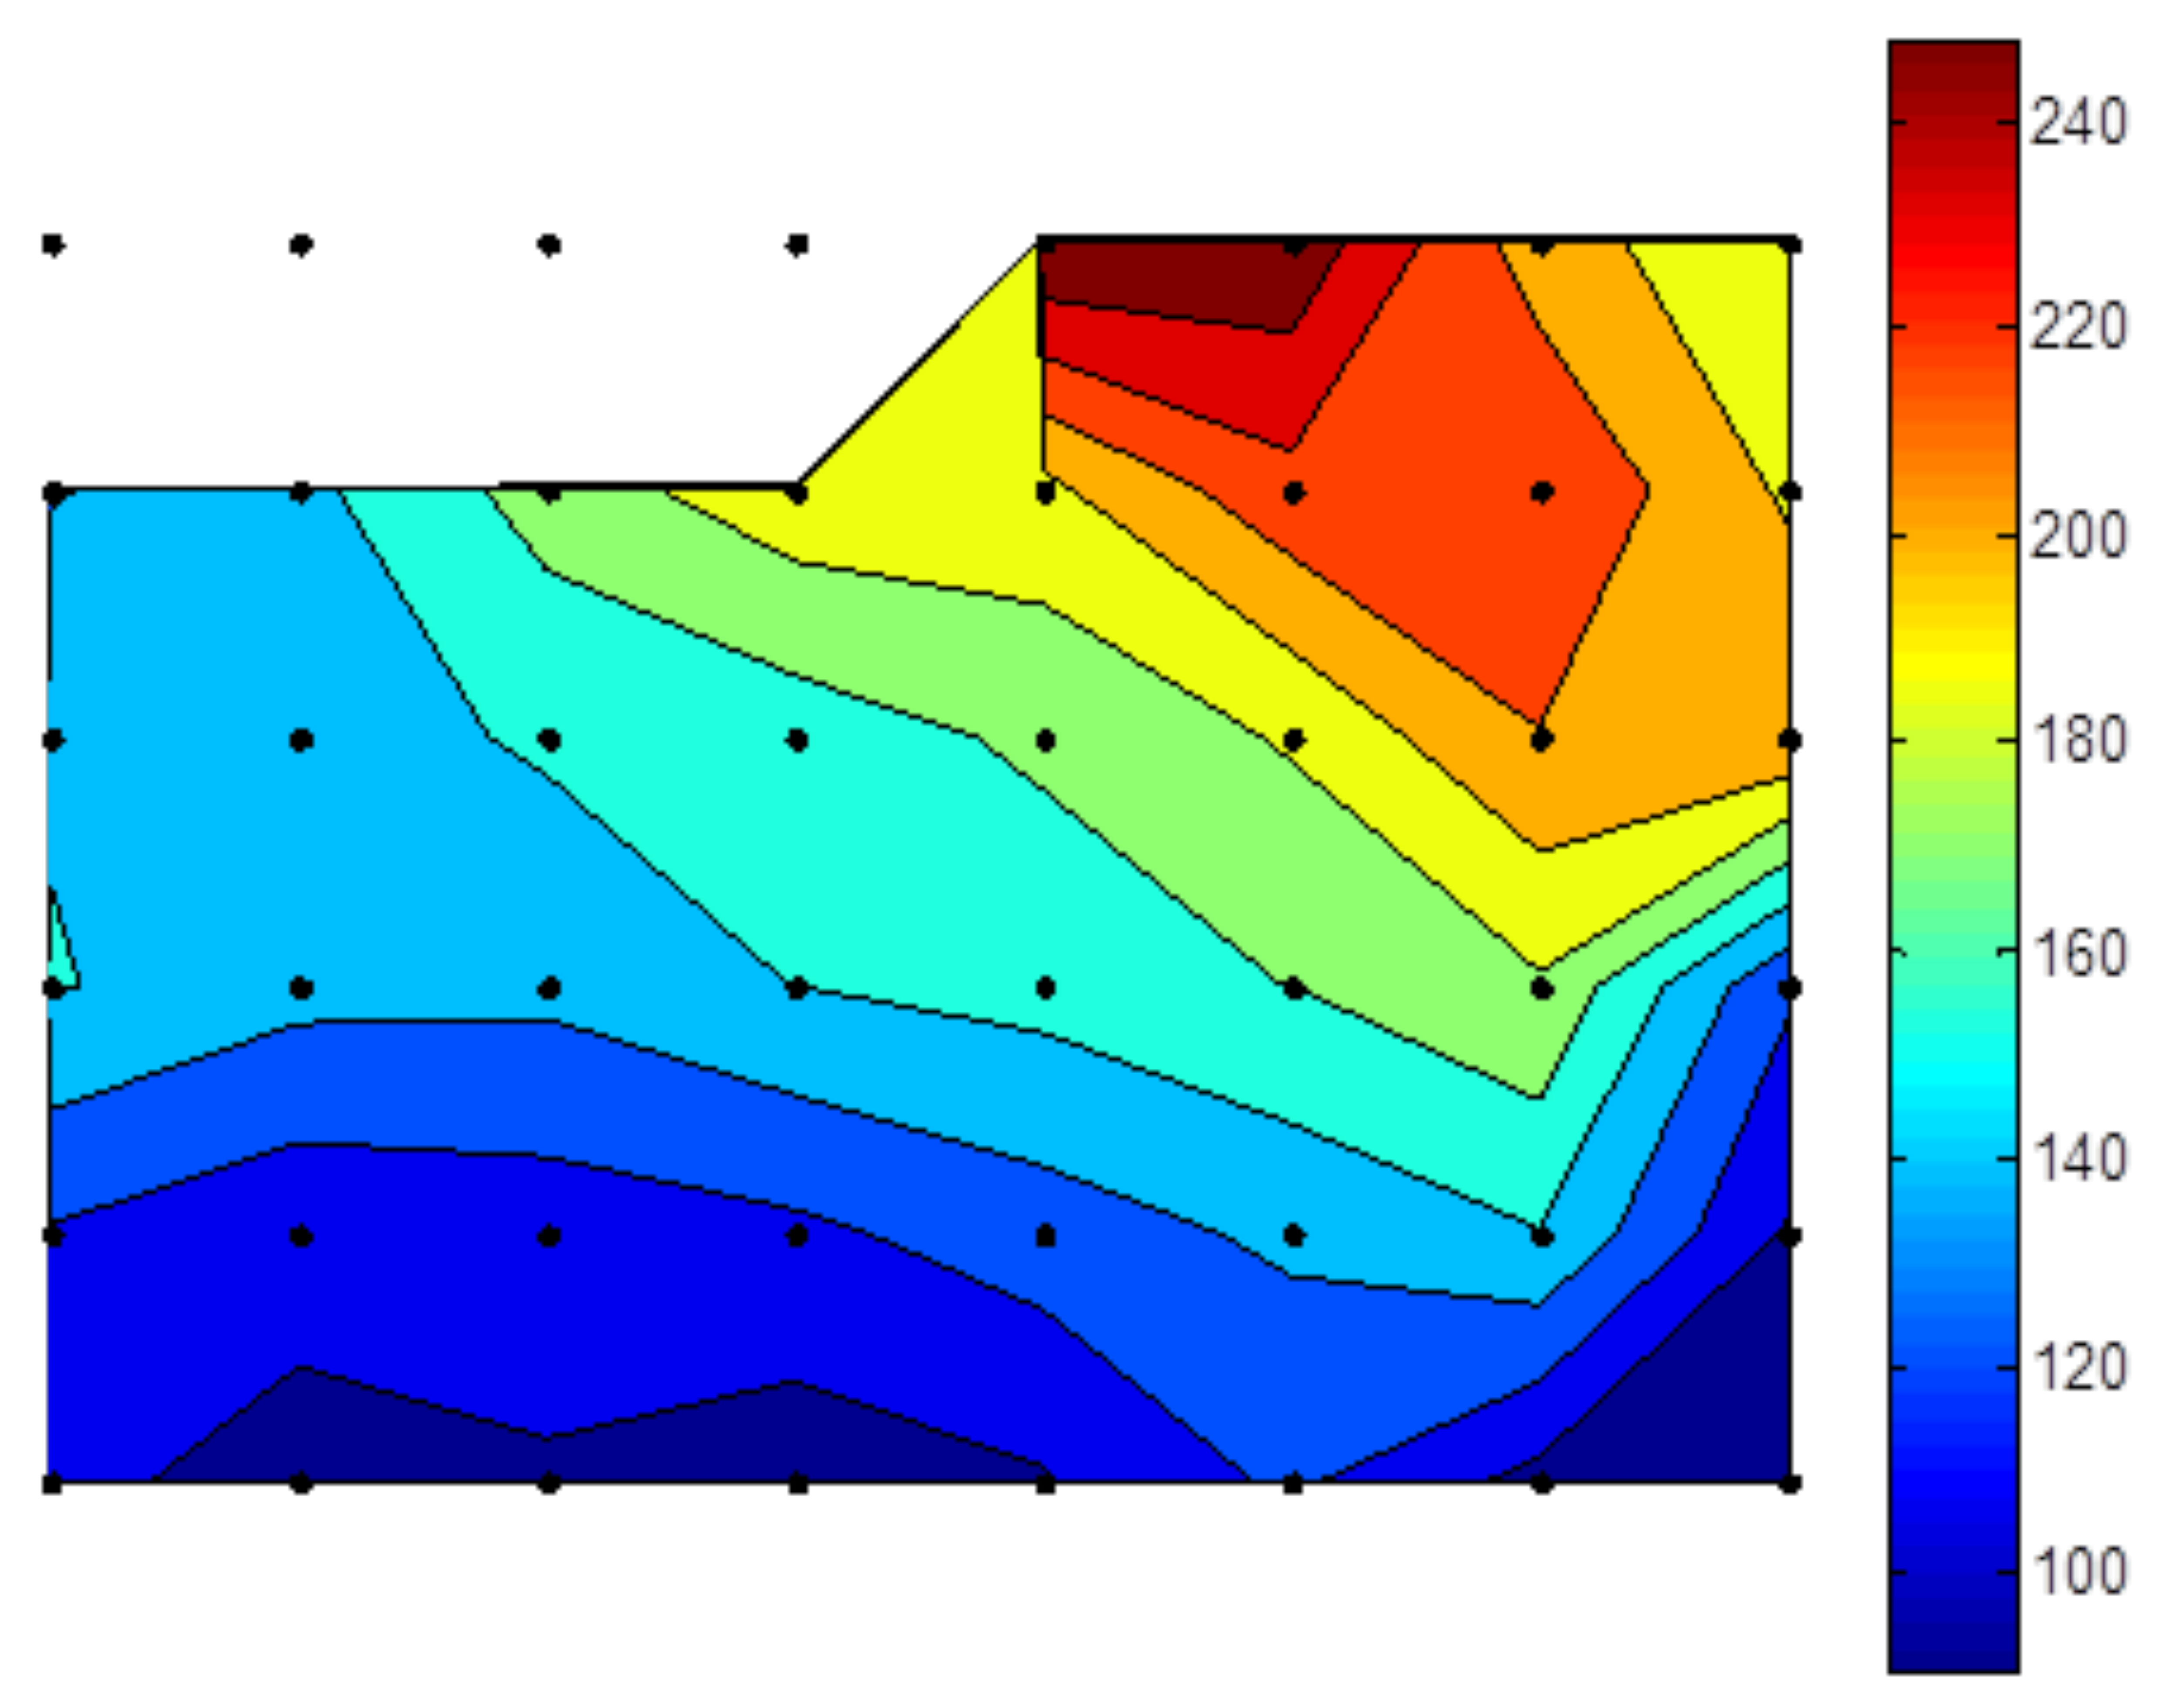
where S(m,n)k is the measure of the stability of the k-th spray pattern at the process condition of (m,n), Js(m,n) is the set including sixty S(m,n)k, and ns and ms are the numbers of pixels in the x and y directions, respectively. The histogram of Js(0bar,12kV) is given in Figure 7b as the example and the stability (S(m,n)) at the process condition of (m,n) is expressed by the maximum value of the set of Js(m,n). Figure 7c shows the contour map in that the stabilities of spray patterns are displayed by being matched with the array of images in Figure 3 using dots. Four process conditions in which the electric field are 0, 3, 6 and 9 kV at 0.0 bar of the pneumatic pressure were discarded because there were no normal spray pattern in those conditions. The spray patterns are stable only at the specific range of the electric field regardless of the pneumatic pressure. The developed stability measure can be used as the excluding criteia of the unstable spray because the unstable spray can cause the process-induced defects when the spray process is applied to the precision coating for the electronic devices. For example, the boundary of the stable spray processes was indicated by the red lines when the criteria of the stability measure was set to 6.5%.
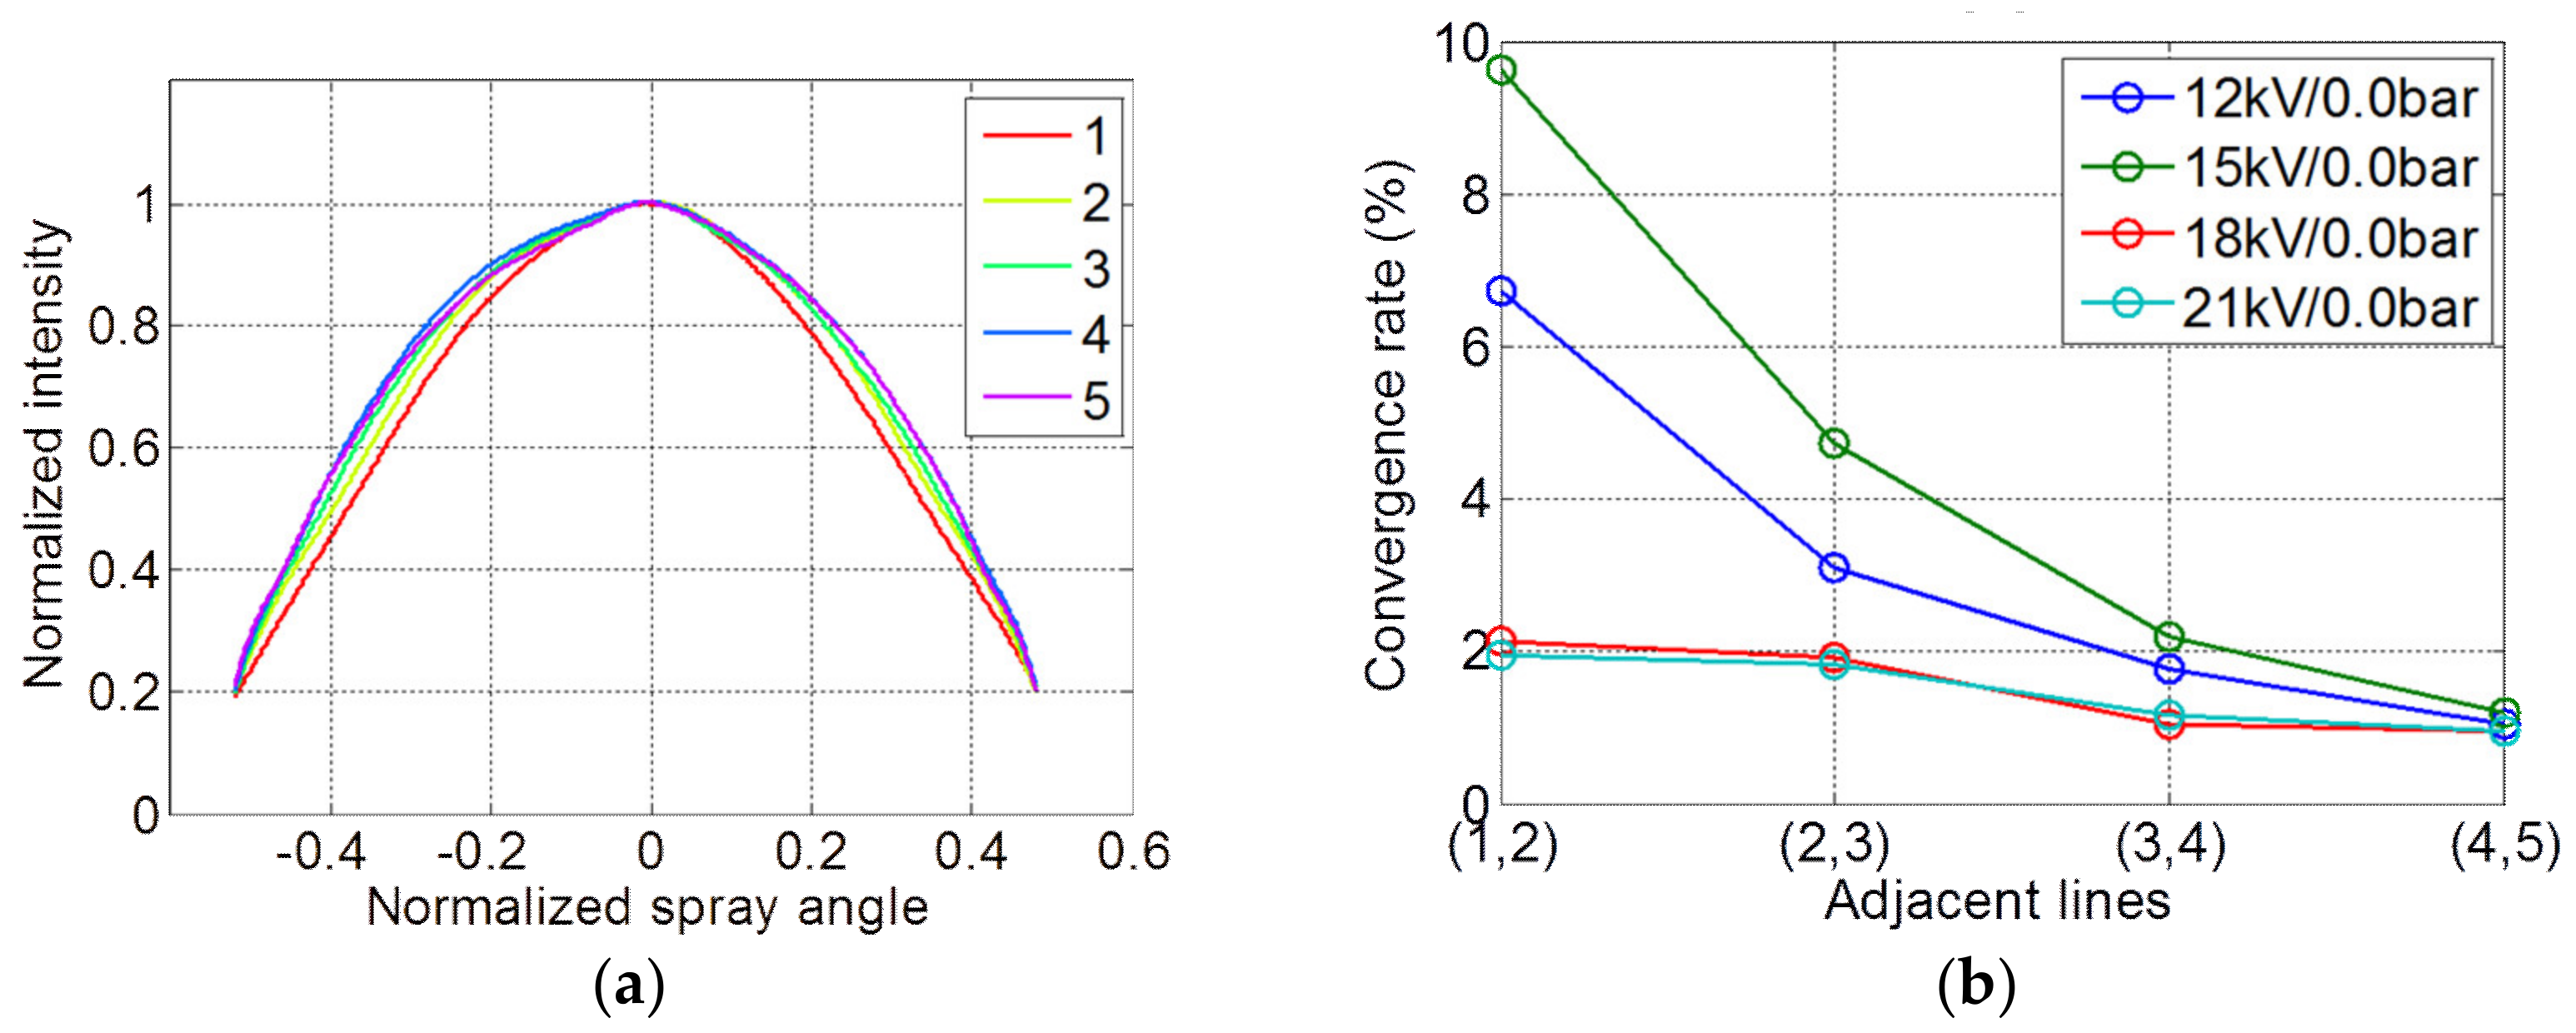
The profile convergence is additionally defined as the criteria to identify the level of accuracy at which the coated thin film can be evaluated by monitoring the spray patterns near the nozzle. As the monitoring length of the spray patterns are about a tenth of the distance from the nozzle and the substrate in our experimental setup, it should be validated if the distribution of the droplet density in the spray patterns remain unchanged outside of the monitored spray patterns. For this purpose, the convergence among five sampled intensity profiles was considered (Ilf,(m,n)i(θ), i is the index of the sampled lines and θ is the spray angle that the vertical direction from top to down is set to zero). In the analysis, it may be thought that the intensity profile will remain unchanged outside of the monitored spray patterns if the intensity profiles are converged during passing the five sampled lines. As shown in Figure 6b,c, the intensity profiles at the electric field of 15 kV and the pneumatic pressure of 0.0 bar were almost converged when the droplets reach the fourth sample line and it means that the captured spray patterns may represent the thickness distribution of the coated thin film. The procedure to quantify the profile convergence within the monitored area of spray patterns starts with normalizing the sampled intensity profiles. The spray angle was normalized by the full width at 20% of maximum and the intensity profile was normalized by the intensity value at the center of gravity of the profiles (θc,(m,n)i). The center of gravity was calculated by using the intensity values larger than the 80% of maximum to match the center of gravity of the coated thin films in the next section. The example of the normalized intensity profiles at the electric field of 15 kV and the pneumatic pressure of 0.0 bar were shown in Figure 8a.
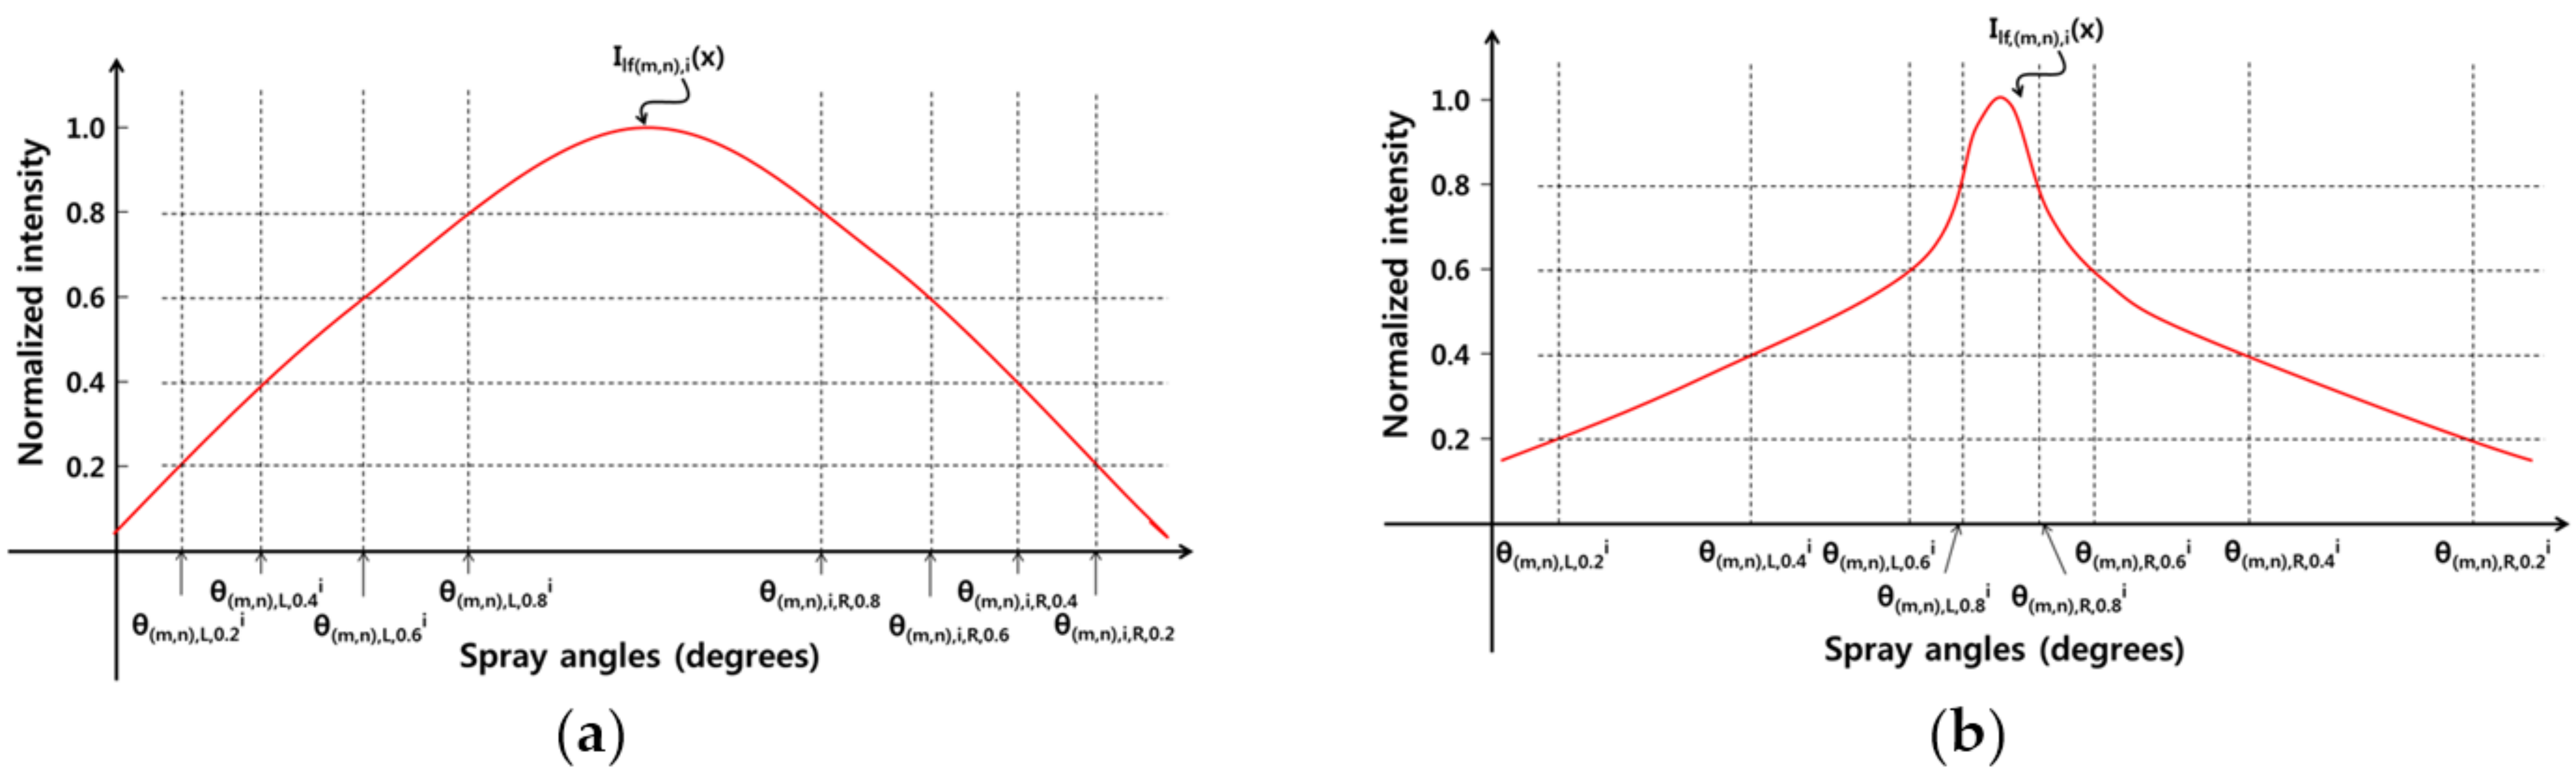
where θ(m,n),L,0.2i, θ(m,n),R,0.2i, θ(m,n),L,0.8i and θ(m,n),R,0.8i are the left and right end of spray angles indicating the full width at 20% and 80% of maximum respectively as shown in Figure 11, w(m,n),0.2i is the full width at 20% of maximum, θN,(m,n)i is the normalized spray angle and IN,(m,n)i is the normalized intensity profile. The Equations from (5) to (8) were written in case of the i-th sample line at the process condition of (m,n). The convergence rate between the two adjacent sampled lines is calculated by Equation (9).
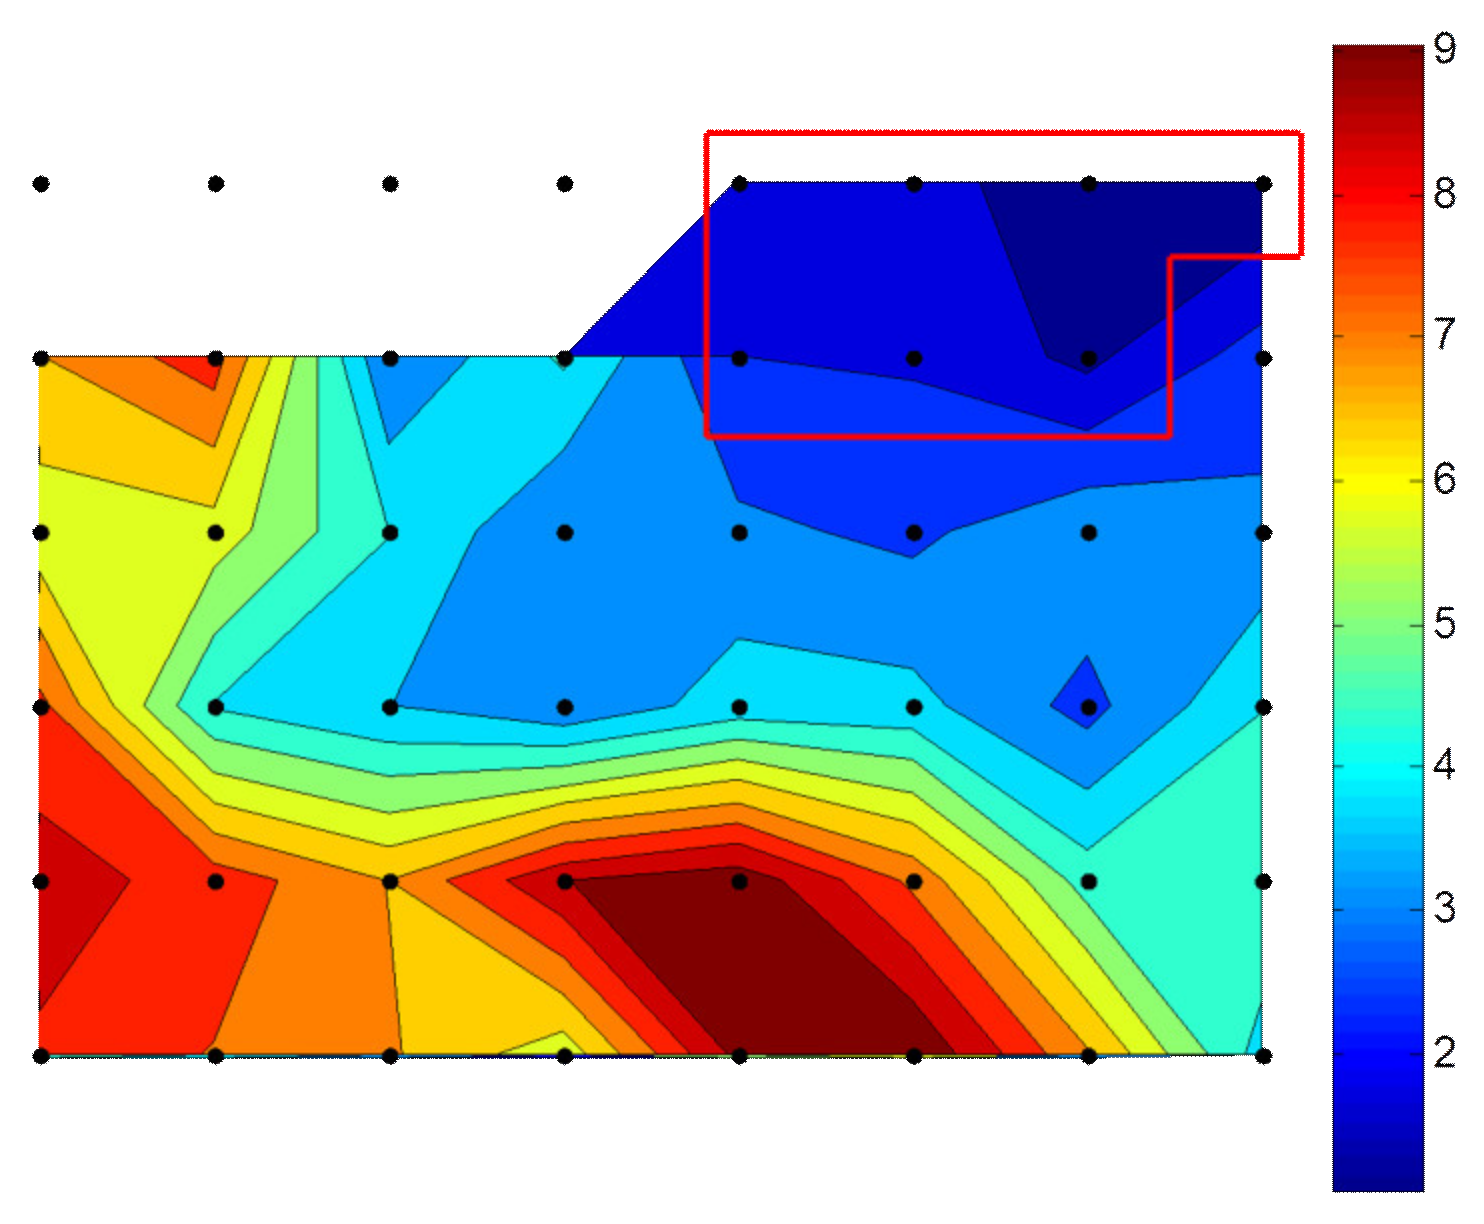
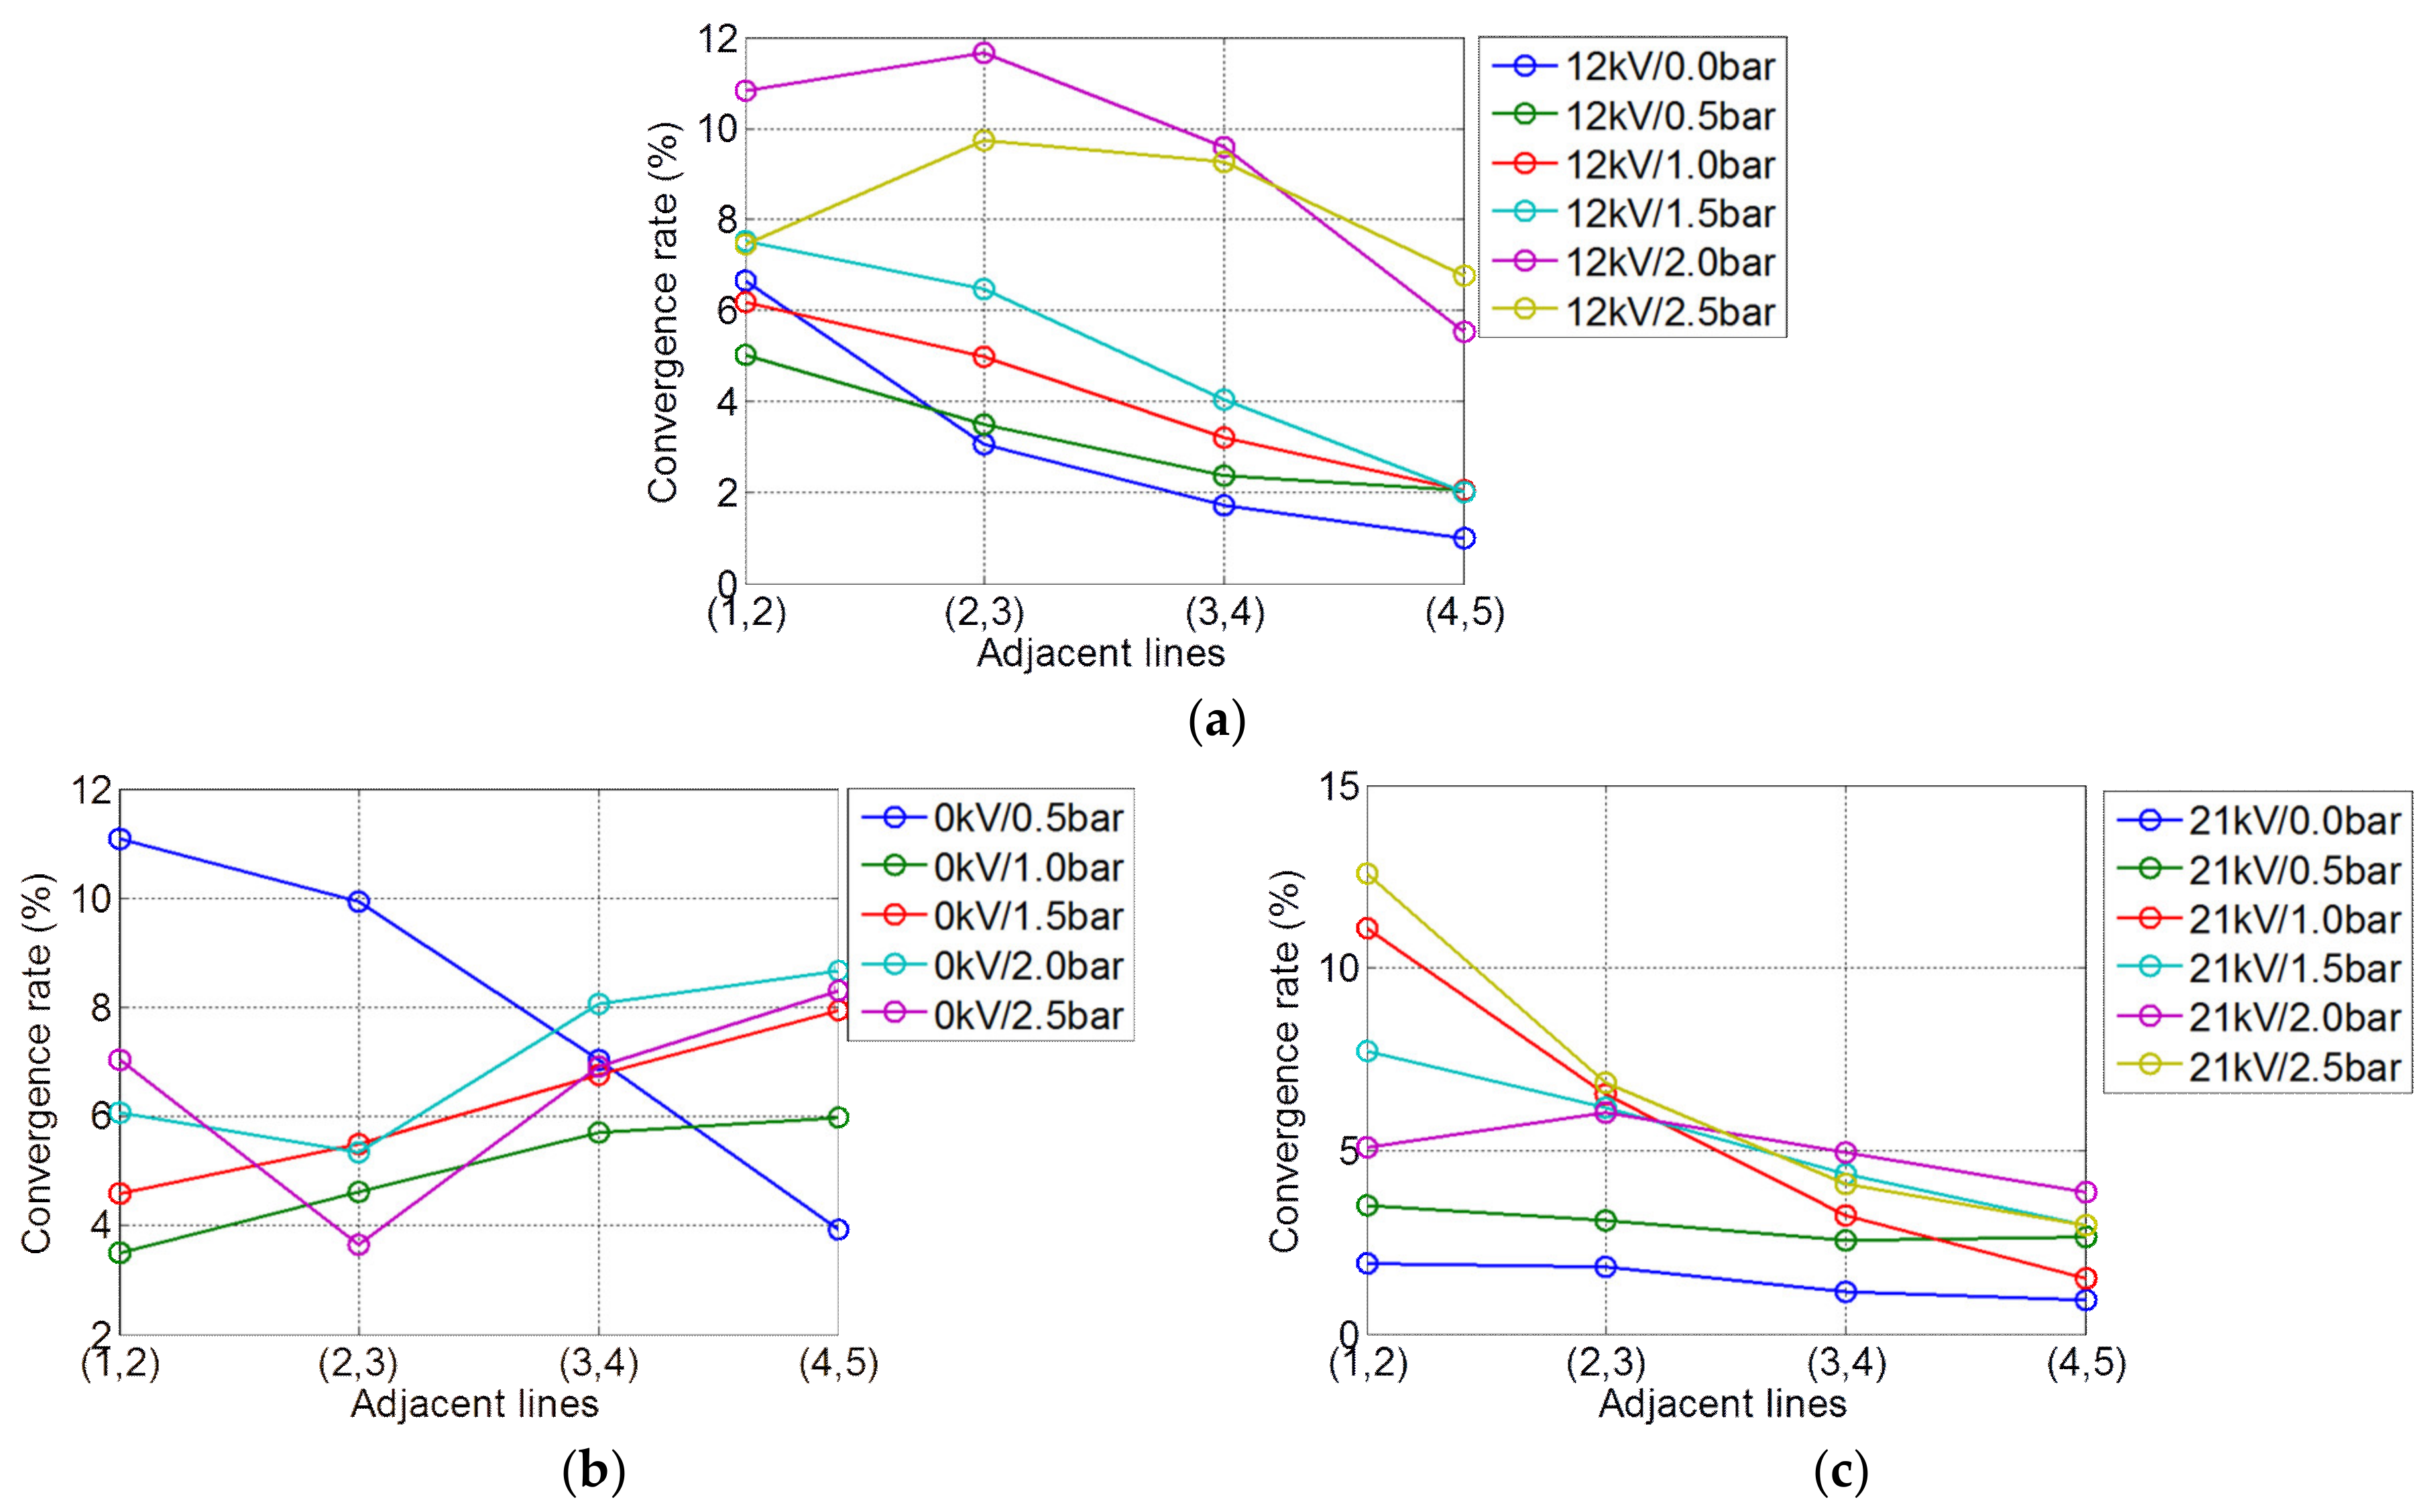
where θN,(m,n) was set to θN,(m,n)5, IN,(m,n)i(θN,(m,n)) was obtained by the linear interpolation in case that i is not 5 and C(m,n)(i,i+1) means the convergence rate between i-th and (I + 1)-th sampled profiles. Figure 8b shows that the profile convergence is satisfied by the pure ESD process in which there is no pneumatic pressure. In other words, estimating the thickness profiles of the coated thin film by monitoring the spray patterns near the nozzle is shown to be well suited to the pure ESD process. However, the profile convergence was degraded by applying the pneumatic pressure as shown in Figure 9a and some intensity profiles were not converged in the pure pneumatic spray, as shown in Figure 9b under the conditions of the high pneumatic pressures. Figure 9c shows that a high electric field can help to enhance profile convergence at high pneumatic pressures. However, it may be required to increase the field of view in the vision system in order to improve the accuracy of estimating the thickness profile of the coated thin film by the spray patterns in those process conditions of the high pneumatic pressures as the profiles are otherwise insufficiently converged for use in the analysis. The measure of the profile convergence (C(m,n)) in each process condition is defiend by the maximum value of the last two convergence rates to confirm the trend of the convergence concurrently as given in Equation (10). The contour map that displays the profile convergence according to the process conditions is given in Figure 10 and the abovementioned trend explaining the effect of the electric field and pneumatic pressure on the profile convergence is well indicated from this figure. For example, the boundary of the processes having the profile convergence rate less than 2.5% was indicated by the red lines in Figure 10.
Finally, the degree of spray dispersion was evaluated quantitatively as the measure of spray uniformity. The full-width at specific ratios of maximum intensity were obatined from the low-pass filtered intensity profiles of the sample lines, as shown in Figure 6c. The obtained widths for the ratios of 0.2, 0.4, 0.6, and 0.8 are expressed as diamond, square, circle, and triangle marks, respectively. Several ratios were used to distinguish abnormal spray shapes such as the concentrated dispersion near the spray center, as described in Figure 11b. The intensity profile only at the fifth sample line is used for evaluating the uniformity of spray patterns because the intensity profiles tend to be converged during the droplet transport in the ESD process as explained above.
where θ(m,n),L,t5 and θ(m,n),R,t5 are, respectively, the left and right end of spray angles indicating the full width at specific ratios (t, t can be 0.2, 0.4, 0.6 and 0.8) of the maximum as shown in Figure 11, w(m,n),t5 is the full width at specific ratios (t) of maximum and U(m,n) is the measure of spray uniformity. In superscript, five means the fifth sample line. Figure 12 shows the contour map experssing the measure of the spray uniformity by being matched with the array of images in Figure 3. The best performance of the hybrid ESD process can be obtained at the electric field from 12 to 15 kV without applying the pneumatic pressure in view of the spray uniformity. In addition, it can be believed that the abovementioned best process conditions are reliable because those process conditions are located in an area in which the stability and the profile convergence of the spray patterns are confirmed. (See Figure 7c and Figure 10) This means that the uniformity of the spray will be sacrificed to increase the deposition rate of the tested ethanol solution by the aid of the pneumatic pressure and the hybrid ESD process using the pneumatic pressure should be carefully applied to the precision coating for the electronic devices. Unfortunately, the trade-off between the deposition rate and the spray uniformity can not be considered quantatively as the deposition rate can not be obtained by the vision system.
Figure 11.
Examples showing the reason why several ratios are used to distinguish abnormal spray shapes: (a) Normal spray shape; (b) abnormal spray shape of the concentrated dispersion near the spray center.
Figure 11.
Examples showing the reason why several ratios are used to distinguish abnormal spray shapes: (a) Normal spray shape; (b) abnormal spray shape of the concentrated dispersion near the spray center.
3. Correlation between Spray Patterns and Deposited Thin Films
In this section, the qualification method of the ESD process by monitoring the spray patterns is validated by investigating the correlation between the spray patterns and the deposited thin films. The thickness of the deposited thin film can be represented by the contrast of blue dye on the sprayed thin film while the ESD process is being performed using a model fluid as the coating solution under the process conditions shown in Table 1. The images of the deposited thin films are shown in Figure 13.
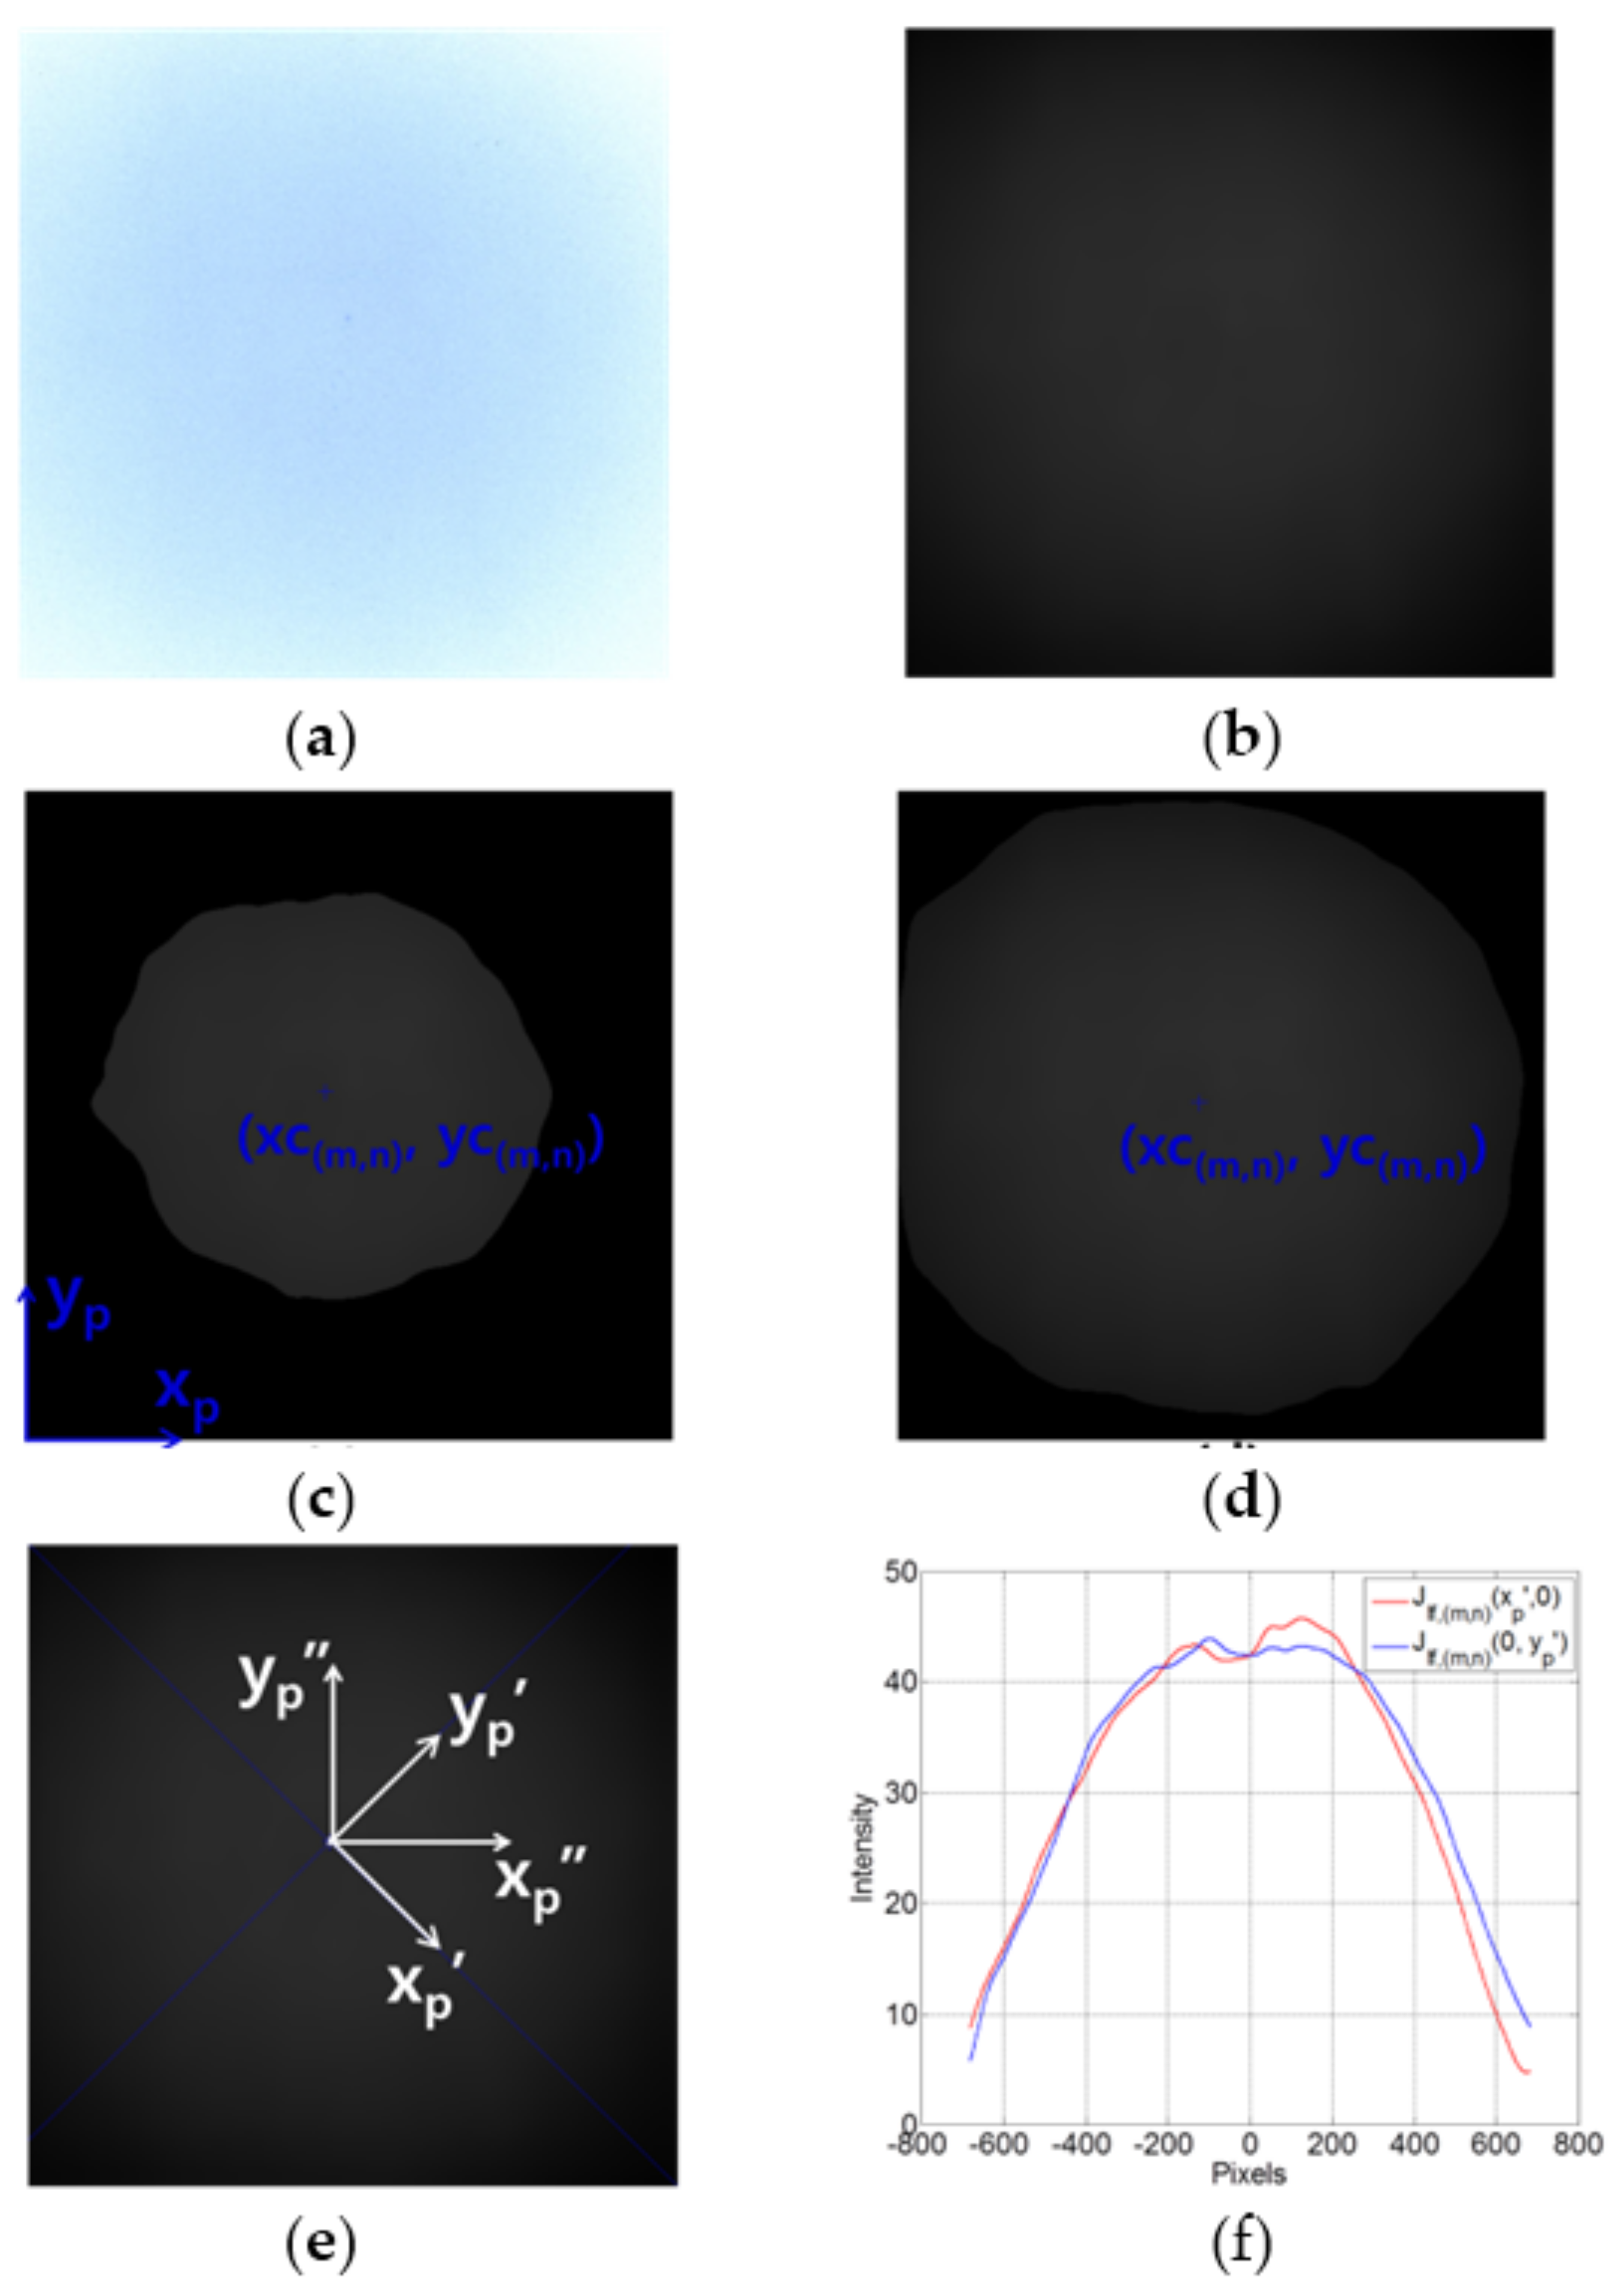
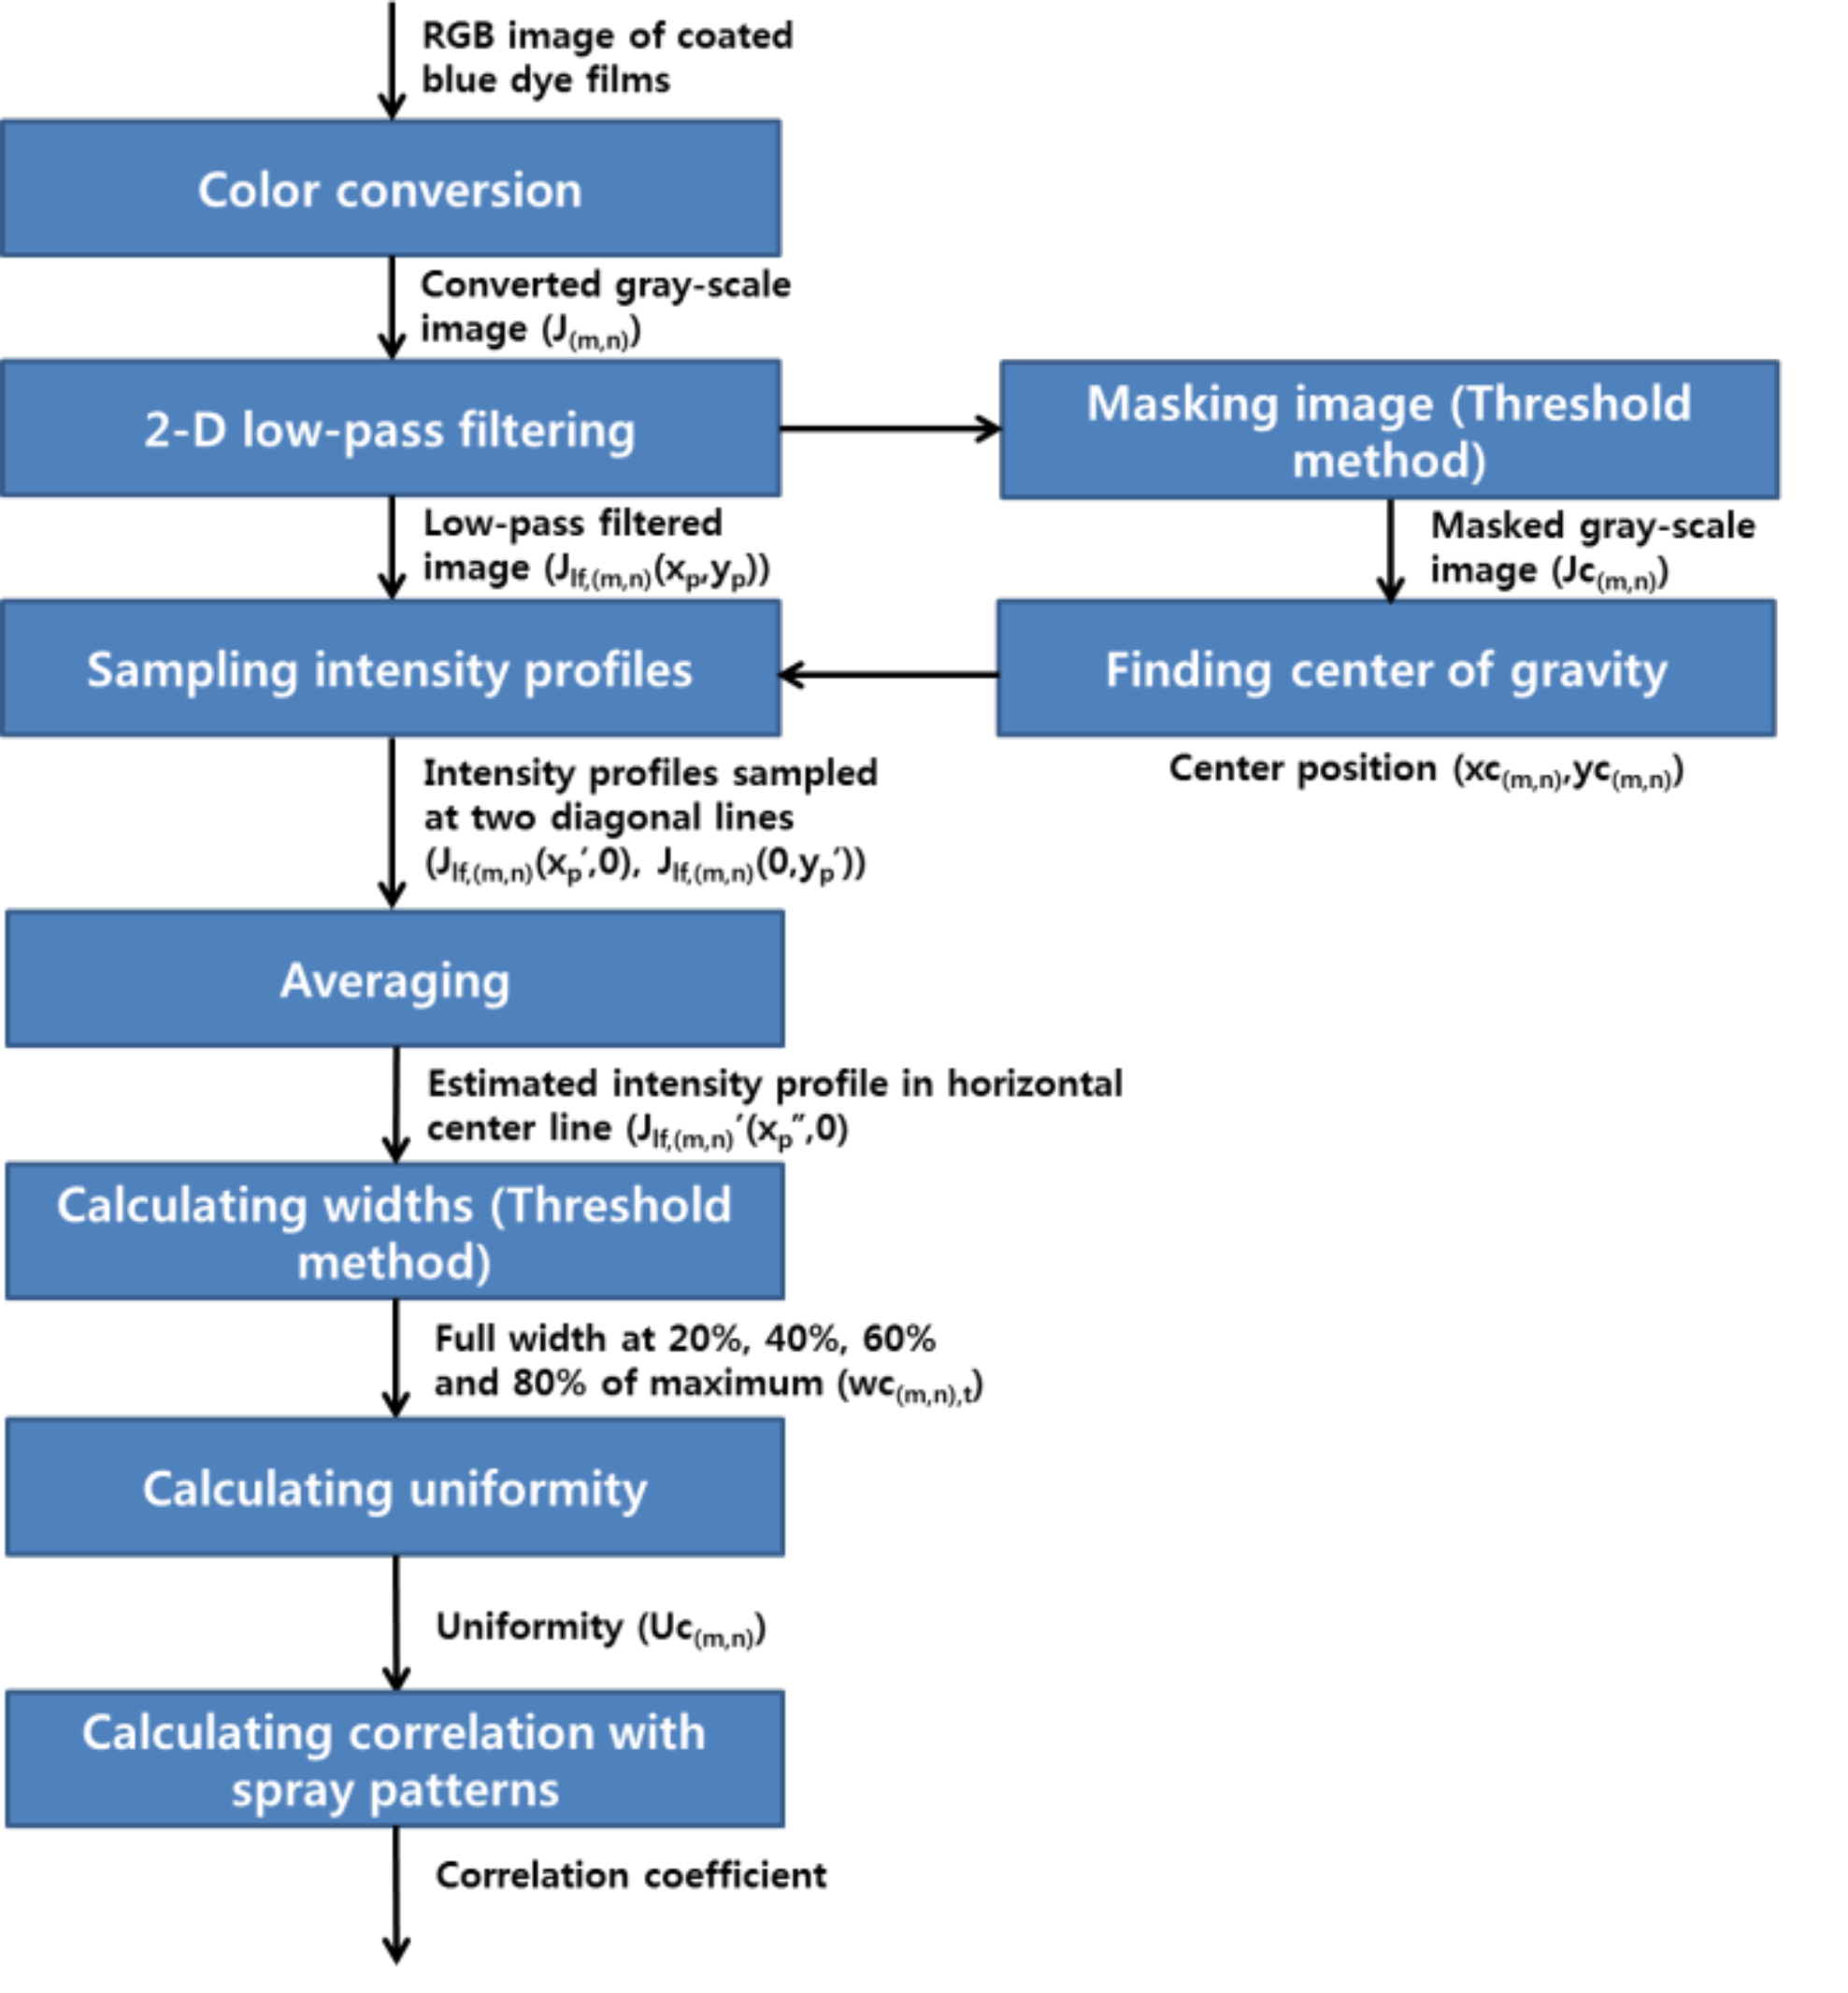
The analysis procedure given in Figure 14 shows the algorithm that quantifies the uniformity of the coated blue dye and extracts the normalized intensity profiles of the coated blue dye. In this procedure, the color is first converted to the gray scale (J(m,n)) and the low-pass filtered intensity distribution (Jlf,(m,n)) is generated by using the FIR low-pass filtering method described in the previous section. The normalized cut-off frequencies of 0.02 are used in both the x and y directions. Figure 15a,b show the captured RGB image of the coated thin film from CCD and the low-pass filtered image as the examples, respectively. In the examples, the images were obtained at the electric field of 15 kV and the pneumatic pressure of the 0.0 bar and the rest of this section will provide the examples at the same process condition to explain the algorithm. Then, the center position of the deposited thin films are calculated by the center of gravity method using the gray scale intensity distribution in which the area where the intensity is less than 80% of the maximum intensity (Jc(m,n)) was excluded to prevent the error of the center position, as shown in Figure 15c because the coated films are cut due to the limited size of the substrate in the case of the process conditions that the droplets are well dispersed, as shown in Figure 15d.
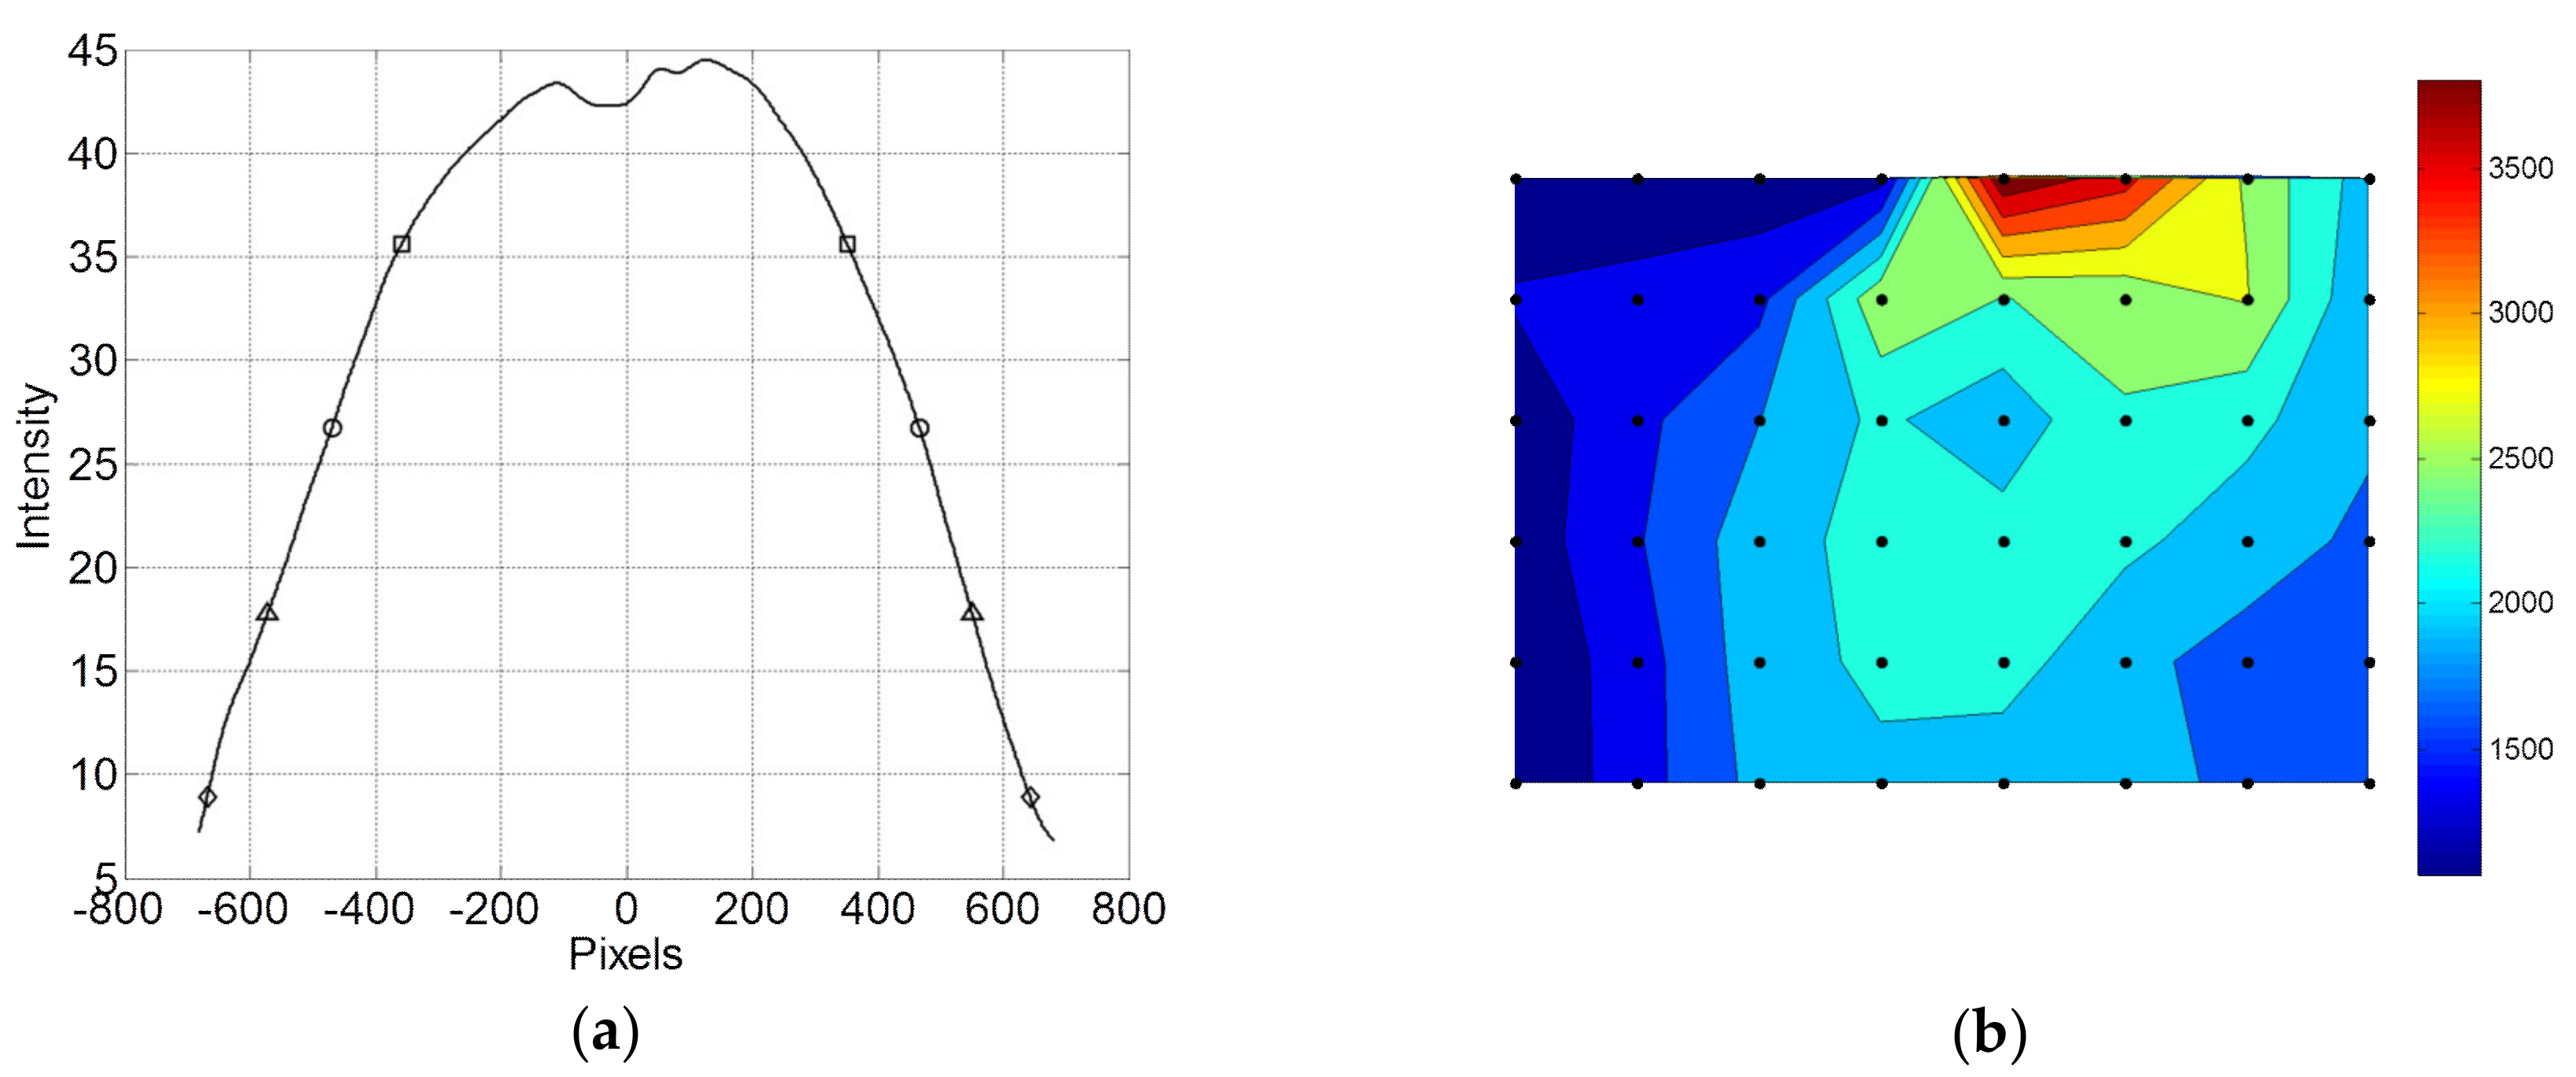
where Jc(m,n) is the intensity distribution of the gray scale image located at the mth row and nth column in Figure 13, xp and yp are the coordinate defined in the horizontal and vertical directions, xc(m,n) and yc(m,n) mean the center positions of each image in the coordinate of xp and yp, and mp and np are the numbers of pixels in the horizontal and vertical directions. The low-pass filtered intensity distribution is further used to extract the uniformity of the deposited films. For this purpose, the intensity profiles of two diagonal lines (Jlf,(m,n)(xp′,0), Jlf,(m,n)(0,yp′)) that intersect the center position are sampled to identify the representative intensity profiles of the coated thin films, as shown in Figure 15e,f. The diagonal lines were used by the reason that more information having low-level intensity was remained in those lines and the additional coordinate of xp′ and yp′ was defined in the dianogal direction. The intensity profile in the horizontal direction (Jlf,(m,n)′(xp″,0)) that was aligned with the plane of view in the imaging system of spray patterns was estimated by averging two intensity profiles at the diagonal sample lines. The full-width at specific ratios of maximum intensity were obatined from the averaged intensity profiles to quantify the uniformity of the coated thin films with the same method that was applied to the spray patterns, as shown in Figure 16a. The obtained widths for the ratios of 0.2, 0.4, 0.6, and 0.8 are expressed by diamond, square, circle, and triangle marks respectively.
The uniformity of the coated thin films was evaluated with Equation (15).
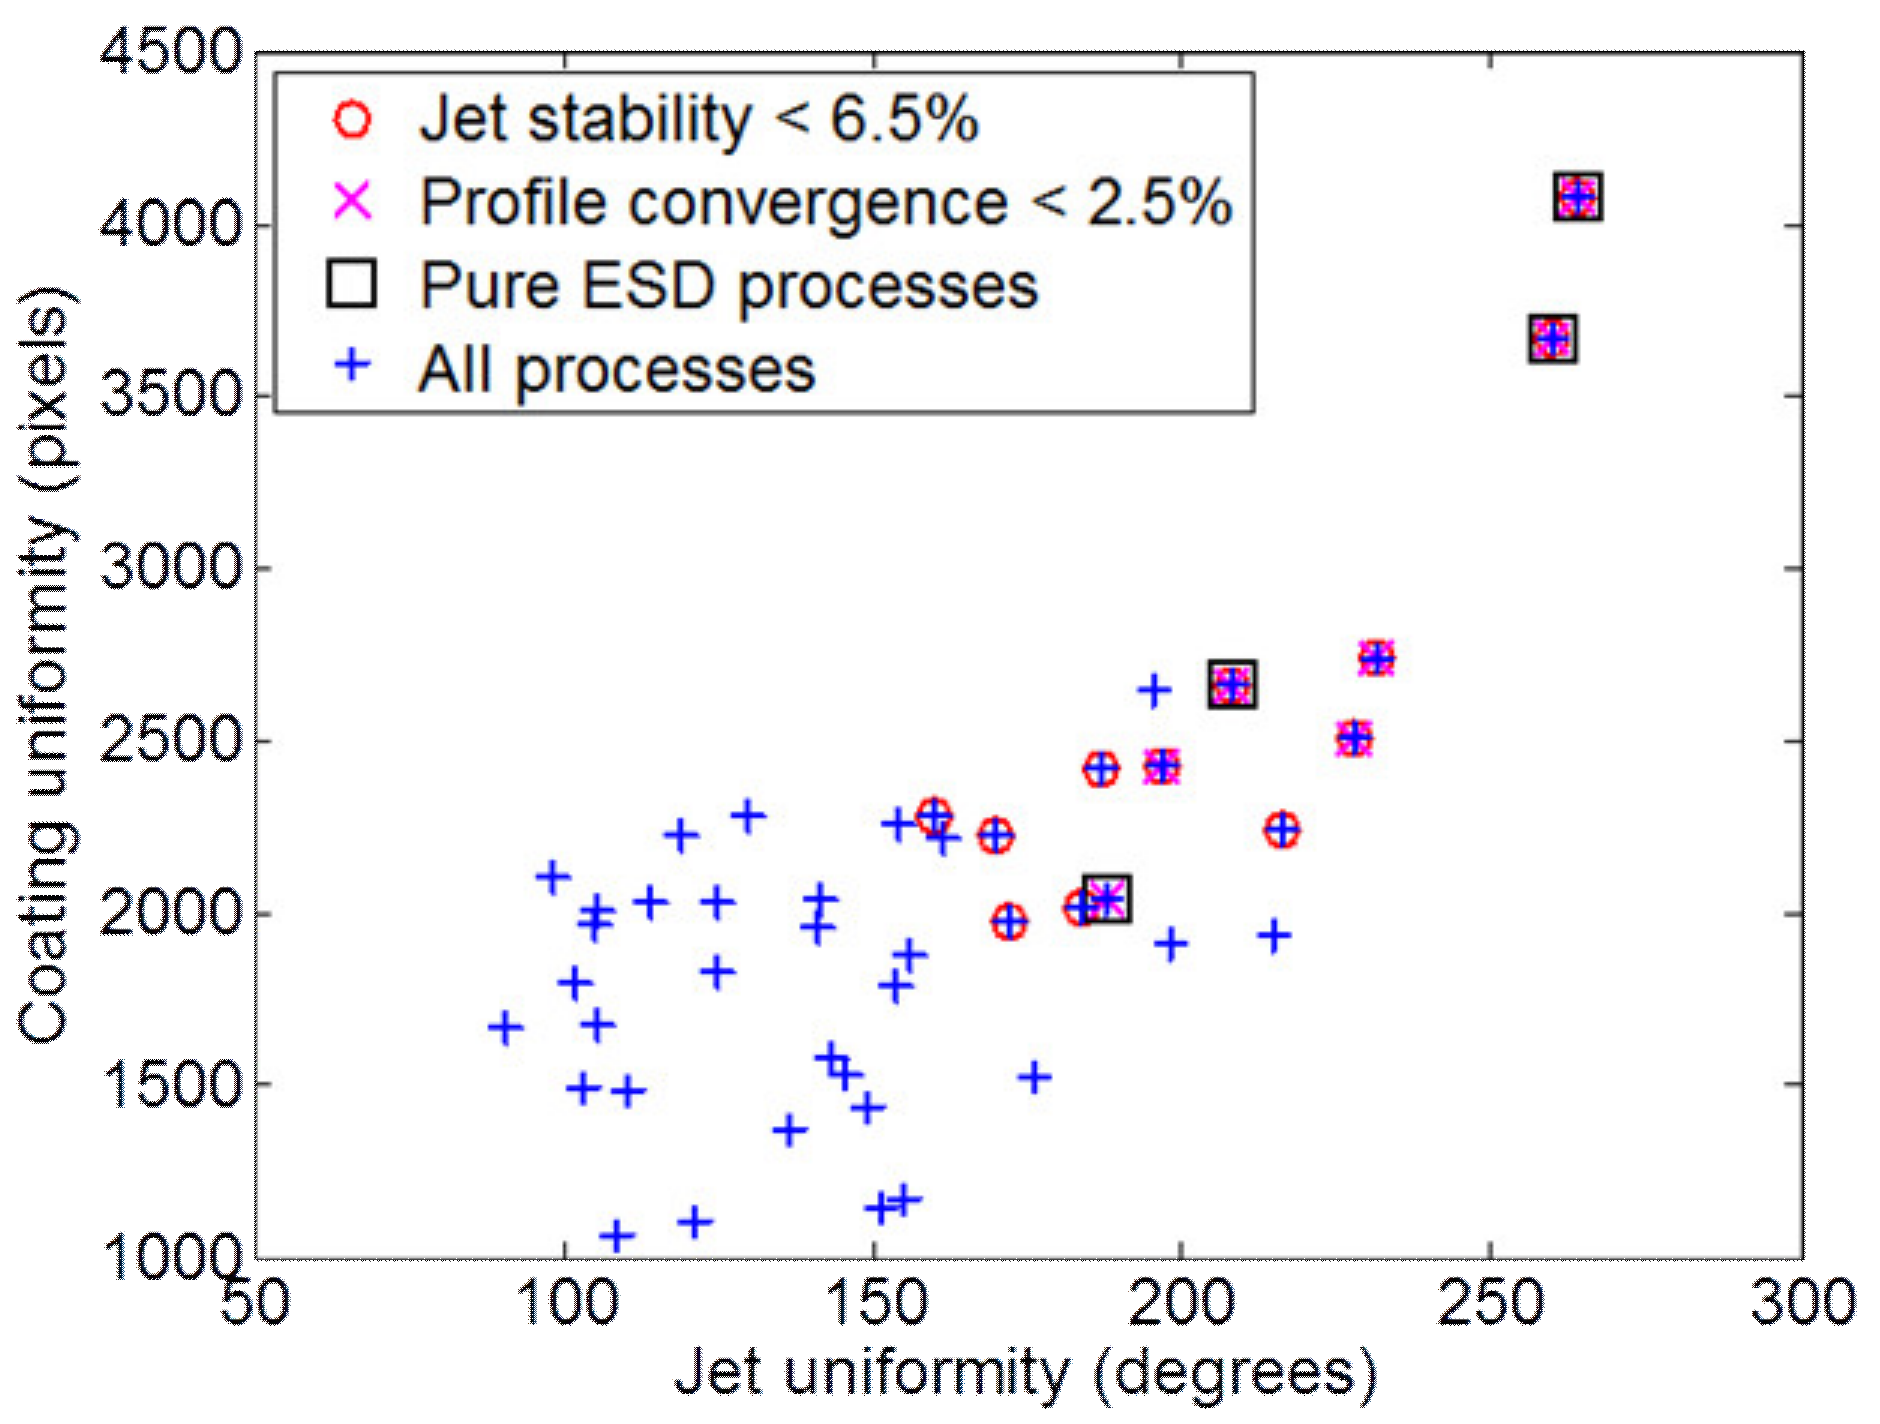
where wc(m,n),t5 is the full width at specific ratios (t, t can be 0.2, 0.4, 0.6 and 0.8) of maximum and Uc(m,n) is the measure of the uniformity of coated thin films. The contour map of the coating uniformity was shown in Figure 16b and the overall trend of the coating uniformity is similar with the uniformity of the spray patterns shown in Figure 12. However, the differencee between two uniformities are visible in the process conditions that the pneumatic pressure is high or the electric field is low, and those process conditions are related to the conditions that the criteria of the jet stability and the profile convergence are not satisfied. The correlation between two uniformities were evaluated quantatitively by calculating the correlation coefficient with the aid of the scatter plot shown in Figure 17. The correlation coefficient for all process conditions was 0.6859 and the correlation coefficients were enhanced to 0.8588, 0.9285 and 0.9886 by restricting the process conditions to the regions having the stable spray patterns in Figure 7c, the regions that the cross-sectional intensity profiles of the spray patterns were converged within the view field of the vision system in Figure 10 and the regions of the pure ESD processes that the pneumatic pressure was not applied, respectively. This means that the proposed quantification method of the spray patterns can be effectively applied to pure ESD processes on the condition that the method can only become effective for the hybrid ESD processes if the processes are properly restricted to conditions having stable spray patterns and converged spray profiles.
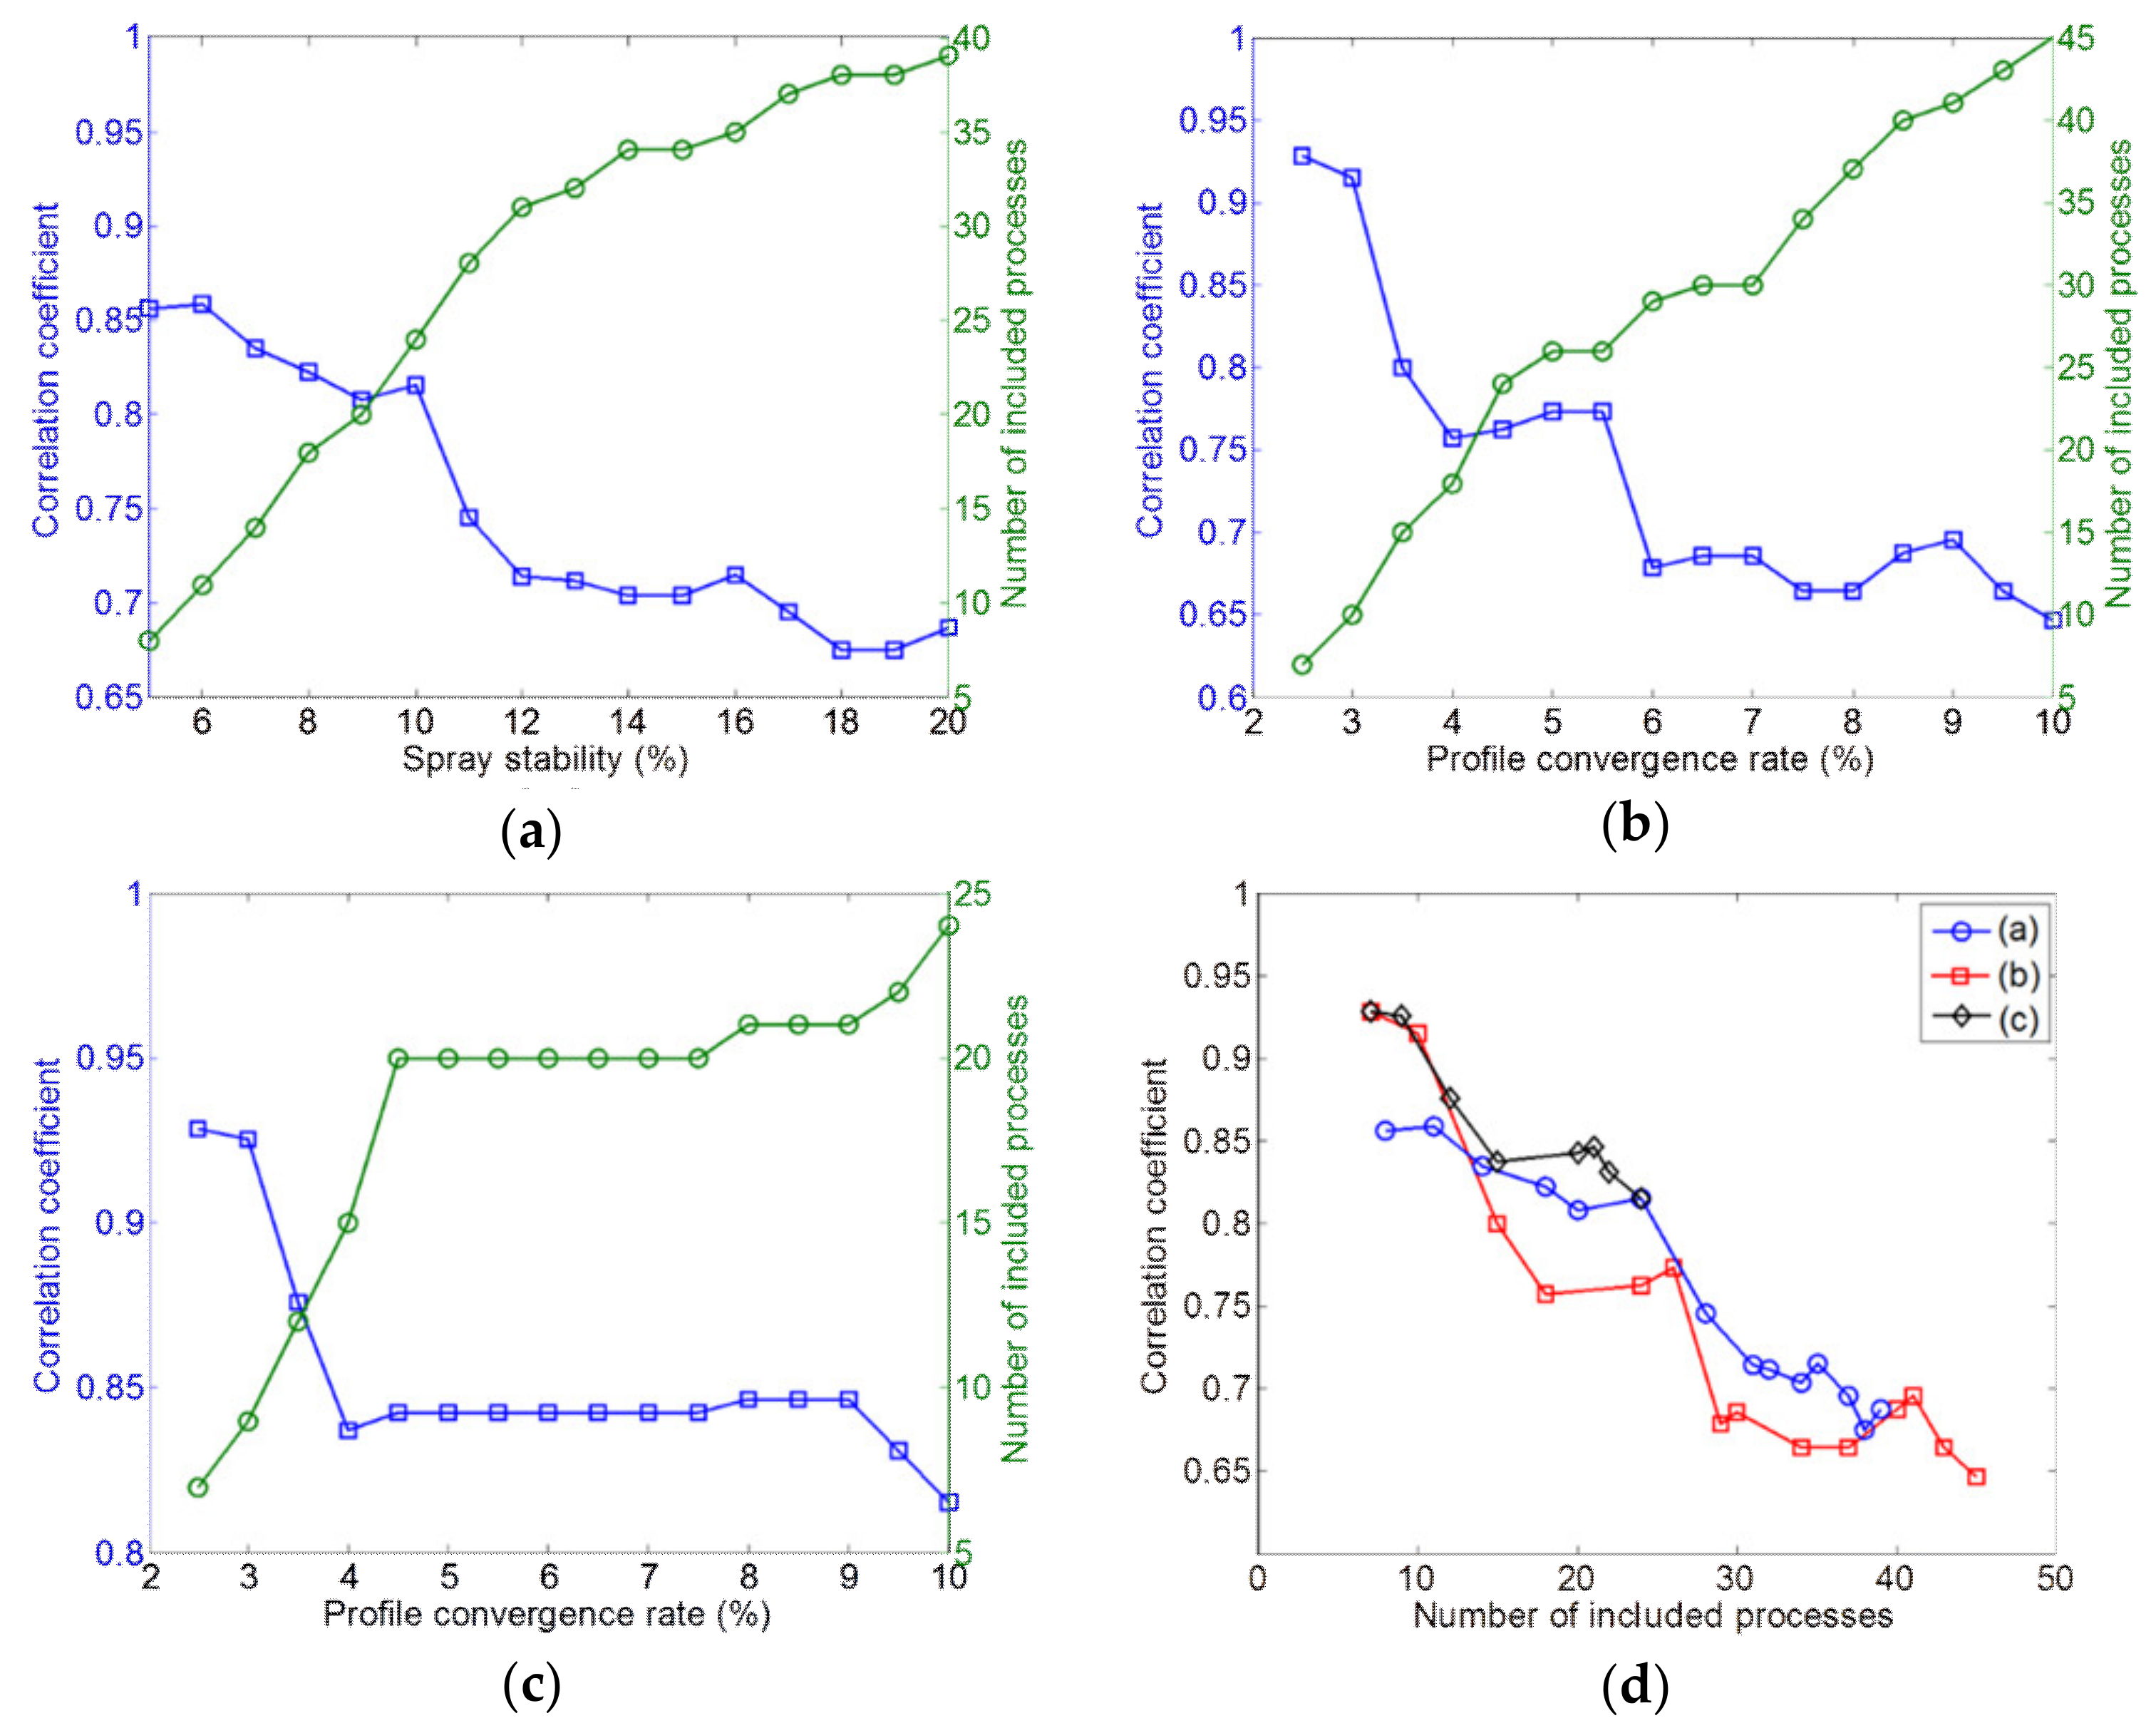
Figure 18a,b show the changes in the correlation coefficient and the number of process conditions that satisfied the selected criteria for the stability and the profile convergence as the selectred criteria were gradually increased. The trends show that both the profile convergence and the stabiliy of spray patterns can restrict the process conditions so that process conditions having the highest correlation coefficient remain. Profile convergence is natural by definition. The profile convergence of low values are effective for securing a high correlation between the spray patterns and the coated thin films. However, the correlation is lowered sharply by a slight increase in profile convergence. The stability of spray patterns can play a complementary role of preventing a rapid reduction in the correlation coefficient due to its gradual slope in the change of the correlation coefficients, even though the stability of spray patterns were developed for this purpose. The relationship between the profile convergence and correlation coefficient when the stability of spray patterns is limited to the criteria of 10% is given in Figure 18c and the rapid degradation of the correlation coefficient was prevented effectively. Figure 18a–c are redrawn in Figure 18d so that the correlation coefficient can be expressed by the number of included process conditions and the correlation coefficient shows a higher value in Figure 18c than in Figure 18a,b when the same number of process conditions are included in the analysis due to the criteria.
4. Discussion
A method to quantify the spray patterns was developed to evaluate the coated thin films. Thin films coated by the ESD processes were shown to be affected by five steps: (i) Spray formation, (ii) droplet transport, evaporation and disruption, (iii) preferential landing, (iv) discharge, droplet spreading, penetration and drying, and (v) surface diffusion and reaction, as described in the introduction section. Of these, the spray formation and the droplet transport are only the parts of the whole process to generate a thin film because the thickness profile of the coated thin film can be further changed by the latter three steps. Securing uniform and stable spray patterns should be considered a prerequisite for obtaining uniform thickness of coated thin films.
Three parameters of the stability, the profile convergence and the uniformity were extracted from the spray patterns. First, the stability was defined as the intensity variation of the spray patterns with respect to the averaged intensity. This was used to exclude unstable spray patterns that were mainly caused by imposing pneumatic pressure in hybrid ESD processes as the unstable spray patterns can make the unpredictable defect in the coated thin films. Next, the profile convergence was defined to evaluate if the coated thin films can be estimated by monitoring spray patterns. Finally, the uniformity was defined as the measure of the performance index to evaluate the spray patterns. To justify the developed method, the correlation between the uniformities of the spray patterns and the coated thin films was evaluated by analyzing the thickness profile of the coated thin films additionally. It is surprising that the correlation coefficient of 0.9886 was obtained in the pure ESD processes without applying the pneumatic pressures even though the latter three steps, such as the preferential landing, droplet spreading and surface reaction, were not considered in the comparison. The correlation was degraded for the hybrid ESD processes having both an electric field and pneumatic pressure. The effectiveness of the developed method for those processes could be evaluated by the combined criteria of the stability and the profile convergence. In this paper, the authors are trying to see if the coating uniformity may be estimated by monitoring the spray jet for the fixed coating solution of “model fluid” for the first step of our work. For the next step, we’ll try to apply the proposed method into various solutions. We will clarify the condition of jet stability and profile convergence to get a satisfied correlation for various solutions in future work.
The electric field and the pressure of pneumatic air are split as the process variables in this paper; however, there are more process variables, such as the distance between the nozzle and the substrate and the syringe pump rate, which should be determined in order to improve the thickness uniformity of the deposited thin films. Optimization of the process by measuring the thickness of the deposited thin films is troublesome in cases where there are many process variables. When using the proposed method, the droplet transport of the ESD process can be easily optimized by monitoring the variations of the spray shape due to the process conditions. In addition, the proposed method can be applicable to the in-line monitoring method of the droplet transport during the ESD process.
There are several recommendations for future research into ways to improve the accuracy of the proposed method. First, applying a sheet beam illumination [12,13,14,15,16] rather than a lamp. This would help reduce the intensity variation of spray patterns induced by the illumination conditions and the effect of the droplets located at out-of-focus planes. Second, considering the rotational asymmetry that is visible in many process conditions of Figure 13. The additional vision system that is located orthogonally to the original vision system can be adopted to monitor the rotational asymmetry.
Supplementary Materials
The following are available online at https://www.mdpi.com/2079-6412/9/5/294/s1, Figure S1. Measured droplet size of air-spray jets without applying external electric field, Figure S2. Measured droplet size of air-spray jets with applying external electric field of 15 kV.
Author Contributions
Formal analysis, D.K.; Funding acquisition, T.-M.L.; Methodology, D.K. and J.K.; Supervision, I.K., K.-H.C. and T.-M.L.; Writing—original draft preparation, D.K.; Writing—review and editing, I.K.
Funding
This research has been financially supported by the Korea Institute of Machinery and Materials through the Government-funded Research Program (Grant NK217D) and by the Ministry of Trade, Industry & Energy (MOTIE) and Korea Institute for Advancement of Technology (KIAT) through the Encouragement Program for The Industries of Economic Cooperation Region (Grant N0002310).
Conflicts of Interest
The authors declare no conflict of interest.
References
Cloupeau, M.; Prunet-Foch, B. Electrohydrodynamic spraying functioning modes: A critical review. J. Aerosol Sci.1994, 25, 1021–1036. [Google Scholar] [CrossRef]
Rosell-Llompart, J.; Fernandez de la Mora, J. Generation of monodisperse droplets 0.3 to 4 µm in diameter from electrified cone-jets of highly conducting and viscous liquids. J. Aerosol Sci.1994, 25, 1093–1119. [Google Scholar] [CrossRef]
Meesters, G.M.H.; Vercoulen, P.H.W.; Marijnissen, J.C.M.; Scarlett, B. Generation of micron-sized droplets from the Taylor cone. J. Aerosol Sci.1992, 23, 37–49. [Google Scholar] [CrossRef]
Jaworek, A.; Krupa, A. Classification of the modes of EHD spraying. J. Aerosol Sci.1999, 30, 873–893. [Google Scholar] [CrossRef]
Chen, C.; Kelder, E.M.; Schoonman, J. Morphology control of thin LiCoO2 films fabricated using the electrostatic spray deposition (ESD) technique. J. Mater. Chem.1996, 6, 765–771. [Google Scholar] [CrossRef]
Eijk, W.V.D.; Oldenhof, W.; Zehner, W. Preparation of thin sources: A review. Nucl. Instrum. Methods1973, 112, 343–351. [Google Scholar] [CrossRef]
Nguyen, T.; Djurado, E. Deposition and characterization of nanocrystalline tetragonal zirconia films using electrostatic spray deposition. Solid State Ionics2001, 138, 191–197. [Google Scholar] [CrossRef]
Chen, C.H.; Kelder, E.M.; Jak, M.J.G.; Schoonman, J. Electrostatic spray deposition of thin layers of cathode materials for lithium battery. Solid State Ionics1996, 86-88, 1301–1306. [Google Scholar] [CrossRef]
Khan, S.; Doh, Y.H.; Khan, A.; Rahman, A.; Choi, K.H.; Kim, D.S. Direct patterning and electrospray deposition through EHD for fabrication of printed thin film transistors. Curr. Appl. Phys.2011, 11, S271–S279. [Google Scholar] [CrossRef]
Kim, T.; Canlier, A.; Kim, G.H.; Choi, J.; Park, M.; Han, S.M. Electrostatic Spray Deposition of Highly Transparent Silver Nanowire. ACS Appl. Mater. Interfaces2013, 5, 788–794. [Google Scholar] [CrossRef] [PubMed]
Ju, J.; Yamagata, Y.; Higuchi, T. Thin-Film Fabrication Method for Organic Light-Emitting Diodes Using Electrospray Deposition. Adv. Mater.2009, 21, 4343–4347. [Google Scholar] [CrossRef] [PubMed]
Adrian, R.J. Twenty years of particle image velocimetry. Exp. Fluids2005, 39, 159–169. [Google Scholar] [CrossRef]
Stojkovic, B.D.; Sick, V. Evolution and impingement of an automotive fuel spray investigated with simultaneous Mie/LIF techniques. Appl. Phys. B2001, 73, 75–83. [Google Scholar] [CrossRef]
Gal PLe Farrugia, N.; Greenhalgh, D.A. Laser sheet dropsizing of dense sprays. Opt. Laser Technol.1999, 31. [Google Scholar] [CrossRef]
Berrocal, E.; Kristensson, E.; Richter Mattias Linne, M.; Aldén, M. Application of structured illumination for multiple scattering suppression in planar laser imaging of dense aprays. Opt. Express2008, 16, 17870–17881. [Google Scholar] [CrossRef]
Abu-Gharbieh, R.; Abu-Gharbieh, J.L.; Försth, M.; Rosén, A.; Karlström, A.; Gustavsson, T. Compensaation method for attenuated planar laser images of optically dense sprays. Appl. Opt.2000, 39, 1260–1267. [Google Scholar] [CrossRef] [PubMed]
Akafuah, N.K.; Salazar, A.J.; Saito, K. Infrared thermotraphy-based visualization of droplet transport in liquid sprays. Infrared Phys. Technol.2010, 53, 218–226. [Google Scholar] [CrossRef]
Kim, J.; Duraisamy, N.; Lee T, M.; Kim, I.; Choi K, H. Hybrid electrohydrodynamic atomization of nanostructured silver top contact for inverted organic solar cells. Sol. Energy Mater. Sol. Cells2014, 130, 156–162. [Google Scholar] [CrossRef]
Kim, J. Study on Hybrid Spray Process Based Nano Thin-Film Coating for Printed Electronics. Ph.D. Thesis, Jeju National University, Jeju-do, Korea, February 2014. (In Korean). [Google Scholar]
Wilhelm, O.; Mädler, L.; Pratsinis, S.E. Electrospray evaporation and deposition. J. Aerosol Sci.2003, 34, 815–836. [Google Scholar] [CrossRef]
Gañán-Calvo, A.M.; Lasheras, J.C.; Dávila, J.; Barrero, A. The electrostatic spray emitted from an electrified conical meniscus. J. Aerosol Sci.1994, 25, 1121–1142. [Google Scholar] [CrossRef]
Lim, J.S.; Hall, P. Two-Dimensional Signal and Image Processing; Prentice-Hall, Inc.: Upper Saddle River, NJ, USA, 1990. [Google Scholar]
Zare, R.N.; Spencer, B.H.; Springer, D.S.; Jacobson, M.P. Laser Experiments for Beginners; University Science Books: Sausalito, CA, USA, 1995; pp. 68–74. [Google Scholar]
Figure 1.
Droplets sprayed from the tip of the capillary tube in the electrostatic spray deposition (ESD) process when the strong electric field applied between the capillary tube and the conductive substrate reaches a critical value in which the electrostatic force overcome the surface tension of the coating solution.
Figure 2.
System for hybrid electrostatic atomization.
Figure 2.
System for hybrid electrostatic atomization.
Figure 3.
Dispersion images gathered by the split test of the electric fields and the pneumatic pressures.
Figure 3.
Dispersion images gathered by the split test of the electric fields and the pneumatic pressures.
Figure 4.
Flow chart of the algorithm for quantifying the characteristics of the spray shapes.
Figure 4.
Flow chart of the algorithm for quantifying the characteristics of the spray shapes.
Figure 5.
Example of analyzing the spray pattern at the electric field of 15 kV and the pneumatic pressure of 0.0 bar. One representative image was obtained from a series of sixty images in each process condition. (a) RGB images; (b) gray-scale image; (c) cropped images; (d) noise canceled images; (e) averaged image.
Figure 6.
(a) Examples of the low-pass filtered intensity map at the electric field of 15 kV and the pneumatic pressure of 0.0 bar. The intensity profiles are sampled from several circular cross-sections which are located equi-distantly at intervals of 50 pixels and whose line numbers are assigned in ascending order from the top. The original intensity, the low-pass filtered intensity and the band-pass filtered intensity are shown in (b) and (c) respectively. In the low-pass filtered intensity profile, the widths obtained for the ratios of 0.2, 0.4, 0.6, and 0.8 are expressed as diamond, square, circle, and triangular marks, respectively.
Figure 7.
Stability analysis of spray patterns at the electric field of 15 kV and the pneumatic pressure of 0.0 bar. (a) Example of the 1st, 20th, 40th and 60th distributions of the intensity differences. The display range of the gray-scale from black to white was set from 0 to 30 to show the differences clearly; (b) histogram of stabilities obtained from sixty intensity differences; (c) contour map in that the stabilities of spray patterns are displayed by being matched with the array of images in Figure 3 using dots. The boundary of the stable spray processes was indicated by the red lines when the criteria of the stability measure was set to 6.5%.
Figure 8.
Example of the normalized intensity profiles (a) and profile convergence rates calcuated from two adjacent lines (b) at the electric field of 15 kV and the pneumatic pressure of 0.0 bar.
Figure 8.
Example of the normalized intensity profiles (a) and profile convergence rates calcuated from two adjacent lines (b) at the electric field of 15 kV and the pneumatic pressure of 0.0 bar.
Figure 9.
Comparison of the profile convergence rate accroding to the process conditions. (a) Profile convergence was degraded by applying the pneumatic pressure at the electricfield of 12 kV; (b) most conditions without the electric field were not converged; (c) high electric field can help to enhance the profile convergence at high pneumatic pressures.
Figure 10.
Contour map that displays the profile convergence according to the process conditions. The boundary of the processes having the profile convergence rate less than 2.5% was indicated by red lines.
Figure 10.
Contour map that displays the profile convergence according to the process conditions. The boundary of the processes having the profile convergence rate less than 2.5% was indicated by red lines.
Figure 12.
Contour map experssing the measure of the spray uniformity by being matched with the array of images in Figure 3.
Figure 12.
Contour map experssing the measure of the spray uniformity by being matched with the array of images in Figure 3.
Figure 13.
Images of the deposited thin films.
Figure 13.
Images of the deposited thin films.
Figure 14.
Analysis procedure for the deposited thin films.
Figure 14.
Analysis procedure for the deposited thin films.
Figure 15.
Example of analyzing the coated thin film at the electric field of 15 kV and the pneumatic pressure of 0.0 bar. (a) RGB image; (b) low-pass filtered gray-scale image. Gray-scale images in which the area that the intensity is less than 80% (c) and 50% (d) of the maximum intensity was excluded. The center of gravity were marked by ‘+’; (e) intensity profiles of two diagonal lines that intersect the center position are sampled to see the representative intensity profiles of the coated thin films; (f) intensity profiles at two diagonal sample lines.
Figure 16.
(a) Averged intensity profile using two intensity profiles at the diagonal sample lines. The obtained widths for the ratios of 0.2, 0.4, 0.6, and 0.8 are expressed by diamond, square, circle, and triangle marks respectively; (b) contour map of the coating uniformity.
Figure 16.
(a) Averged intensity profile using two intensity profiles at the diagonal sample lines. The obtained widths for the ratios of 0.2, 0.4, 0.6, and 0.8 are expressed by diamond, square, circle, and triangle marks respectively; (b) contour map of the coating uniformity.
Figure 17.
The scatter plot showing the correlation between two uniformities of spray patterns and coated thin films. The correlation coefficient for all process conditions was 0.6859 and the correlation coefficients were enhanced to 0.8588, 0.9285 and 0.9886 by restricting the process conditions as shown in the respective legends.
Figure 18.
Changes in the correlation coefficient and the number of process conditions that satisfied the selected criteria for the stability (a) and the profile convergence (b) as the selectred criteria is gradually increased; (c) relationship between the profile convergence and the correlation coefficient when the stability of spray patterns is limited to the criteria of 10%; (d) change of the correlation coefficient depending on the number of included processes in (a–c).
Table 1.
Process variables and the values used for the hybrid electrostatic atomization process. The electric field and pneumatic pressure are split while the other process variables are fixed.
Table 1.
Process variables and the values used for the hybrid electrostatic atomization process. The electric field and pneumatic pressure are split while the other process variables are fixed.
Kang, D.; Kim, J.; Kim, I.; Choi, K.-H.; Lee, T.-M.
Experimental Qualification of the Process of Electrostatic Spray Deposition. Coatings2019, 9, 294.
https://doi.org/10.3390/coatings9050294
AMA Style
Kang D, Kim J, Kim I, Choi K-H, Lee T-M.
Experimental Qualification of the Process of Electrostatic Spray Deposition. Coatings. 2019; 9(5):294.
https://doi.org/10.3390/coatings9050294
Chicago/Turabian Style
Kang, Dongwoo, Junwoo Kim, Inyoung Kim, Kyung-Hyun Choi, and Taik-Min Lee.
2019. "Experimental Qualification of the Process of Electrostatic Spray Deposition" Coatings 9, no. 5: 294.
https://doi.org/10.3390/coatings9050294
APA Style
Kang, D., Kim, J., Kim, I., Choi, K.-H., & Lee, T.-M.
(2019). Experimental Qualification of the Process of Electrostatic Spray Deposition. Coatings, 9(5), 294.
https://doi.org/10.3390/coatings9050294
Note that from the first issue of 2016, this journal uses article numbers instead of page numbers. See further details here.
Article Metrics
No
No
Article Access Statistics
For more information on the journal statistics, click here.
Multiple requests from the same IP address are counted as one view.
Kang, D.; Kim, J.; Kim, I.; Choi, K.-H.; Lee, T.-M.
Experimental Qualification of the Process of Electrostatic Spray Deposition. Coatings2019, 9, 294.
https://doi.org/10.3390/coatings9050294
AMA Style
Kang D, Kim J, Kim I, Choi K-H, Lee T-M.
Experimental Qualification of the Process of Electrostatic Spray Deposition. Coatings. 2019; 9(5):294.
https://doi.org/10.3390/coatings9050294
Chicago/Turabian Style
Kang, Dongwoo, Junwoo Kim, Inyoung Kim, Kyung-Hyun Choi, and Taik-Min Lee.
2019. "Experimental Qualification of the Process of Electrostatic Spray Deposition" Coatings 9, no. 5: 294.
https://doi.org/10.3390/coatings9050294
APA Style
Kang, D., Kim, J., Kim, I., Choi, K.-H., & Lee, T.-M.
(2019). Experimental Qualification of the Process of Electrostatic Spray Deposition. Coatings, 9(5), 294.
https://doi.org/10.3390/coatings9050294
Note that from the first issue of 2016, this journal uses article numbers instead of page numbers. See further details here.


