1. Introduction
AISI D2 steel is widely used in the manufacturing industry, especially in the development of dies, due to its high degree of hardness and wear resistance. However, the tribological and wear resistance performance of tool steels can be enhanced by the application of surface treatments that allow coatings of carbides or nitrides of transition metals to be obtained, which help to improve the tribological and chemical properties of materials that work under conditions of high wear or corrosion, such as the materials for forming dies and cutting tools, which function in aggressive environments such as coastal cities. The coatings are industrially produced using techniques such as physical vapor phase deposition (PVD) and chemical vapor deposition (CVD) [
1,
2]. In general, these processes are mainly limited to equipment to be used for operation in a high vacuum, making them very expensive to install and put into production at the industrial level. An alternative for producing hard coatings with good wear resistance is the thermo-reactive deposition/diffusion (TRD) process [
3], which is applied over substrates containing a higher percentage of carbon, up to 0.3% by weight [
4]. Coatings produced using this process have good adhesion to the substrate, a low friction coefficient, and excellent thickness uniformity [
4,
5]. In this coating process, a bath of molten salts can be used, consisting of borax, aluminum, or ferro-silicon as the reducing element and carbide-forming elements (FCEs) such as vanadium, chromium, titanium, and niobium [
4]. The carbide layer growth is produced when the metal dissolved in the salt bath has a relatively low energy of formation of carbide and an energy of formation of the metal oxide greater than that of boron oxide (B
2O
3). If this condition is not met [
6,
7], the boron atoms do not rust and are free to diffuse into the matrix of the steel, combining with the iron to form layers of iron oxide (FeO and Fe
2B) [
8,
9].
Papers published to date have studied binary metal carbides deposited via the TRD process and have characterized their microstructure, wear resistance, and mechanical behavior. Additionally, they have focused on the production of VC, CrC, and NbC coatings on substrates of AISI H13, AISI M2, and AISI D2 steel, and up to 2300 HV hardness has been reported [
3,
5]. Others researchers have studied the layer growth kinetics of niobium carbides, borides, and chromium [
10,
11,
12]. With respect to the electrochemical behavior of the coatings, there are papers on chromium carbides in which the relation between the microstructure and the corrosion resistance was studied using potentiodynamic polarization, as well as impedance studies (EIS) [
13]. Furthermore, studies have been conducted on the corrosion and mechanical properties of nano-vanadium carbide coatings deposited via sputtering on tool steels, showing better mechanical performance for the coating–substrate combination than that exhibited by the substrate [
14]. Further investigations have been made on the electrochemical behavior of nano-coatings of chromium carbide alloys deposited on Ti6Al4V and Co–Cr–Mo [
15] and on the resistance to the corrosion and wear of niobium–chromium carbides deposited on tool steels. However, there have been no reports of studies on the corrosion and wear resistance of vanadium carbide and chromium carbide systems. Therefore, the objective of this paper is to deposit these coatings on D2 steel substrates using the TRD technique with the aim of combining the properties of the high degree of hardness of vanadium carbide and the good corrosion resistance of chromium carbide. The coatings produced are characterized and compared with the performance of binary carbides and chromium carbides with respect to their mechanical and electrochemical behavior.
2. Materials and Methods
Coatings of vanadium carbide, chromium carbide, and chromium–vanadium carbide were deposited on substrates of AISI D2 steel with dimensions of 15 mm in diameter and 4 mm in thickness, polished using emery paper of 220 to 1200, and subjected to ultrasonic cleaning with acetone. The chemical composition of annealed AISI D2 steel is 1.5 wt % C, 11.5–12.5 wt % Cr, from 0.15 to 0.45 wt % Mn, 0.6–0.9 wt % W, and Fe, which completes the chemical balance.
The coatings were developed from a salt bath comprised of molten borax (Na
2B
4O
7), ferro-chromium (Fe-Cr), ferro-vanadium (Fe-V), and aluminum (Al), varying the chemical| composition (see
Table 1). The aluminum was added to the salt bath as a reducing agent; i.e., it reduces boron oxide and rusts to prevent the added metal (chromium or vanadium) from rusting. It is thus available to combine with the carbon of the steel to form carbide. The TRD surface treatment was performed at 1020 °C for 4 h with the preheating of the samples at 600 °C.
The crystal structure of the coatings was determined by means of an analysis of the patterns of X-ray diffraction, obtained on a X-PertPro PANalytical device, working at 45 kV and 40 mA, emitting monochromatic radiation Ka of Cu (1.594 Å) in the configuration ϴ–2ϴ in a range of 35° to 85°, with a step of 0.02°. The chemical surface composition of the coating was determined through X-ray photoelectron spectroscopy (XPS). XPS spectra were recorded in a SPECS spectrometer in the constant pass energy mode at 50 eV, using Mg Kα radiation as the excitation source. Sample cleaning was performed with Ar+ ions of 3.5 keV for 5 min in a preparation chamber (base pressure 2 × 10⁻⁷ mbar) connected through a gate valve to the chamber. The calibration of the binding energy (BE) scale was checked using the C 1s signal (284.1 eV). X-ray spectroscopy (EDS) was carried out at a voltage of 20 kV and collection time of 120 s in a FEI Quanta 200 scanning electron microscope (Thermo Fisher Scientific, Waltham, MA, USA). The measurement of the hardness of the coatings was performed with a CSM Berkovich nanoindentation instrument (Peseux, Switzerland) with a speed of approach to the sample of 2000 nm/min, a rate of application of the load of 10 mN/min, and a maximum load of 30 mN, pausing for 15 s in the application of the load. The friction coefficient was evaluated through the pin-on-disk test using a CETR-UMC-2 tribometer (San Jose, CA, USA) with steel balls of 6 mm in diameter, coated with a layer of Al2O3 and with an applied load of 4 N at a speed of 50 mm/s for 10 min.
The wear track cross profile was measured for at least four points of the wear track with a Dektak 150 profilometer (Tucson, AZ, USA) in order to obtain an average of the wear-track width. After the test, the wear tracks were examined using a Bruker contour GT optical profilometer (Tucson, AZ, USA). The wear volume (Wv) of the films and the balls was calculated according to ASTM G99-17 [
16]. The wear products were chemically analyzed using energy-dispersive X-ray spectroscopy (Thermo Fisher Scientific, Waltham, MA, USA) (EDS). The wearzrate (Ws) was calculated according to Archard’s equation, Equation (1), where
F is the normal load (N) and
L is sliding length (mm). The wear rate is reported in mm
3/Nm [
16].
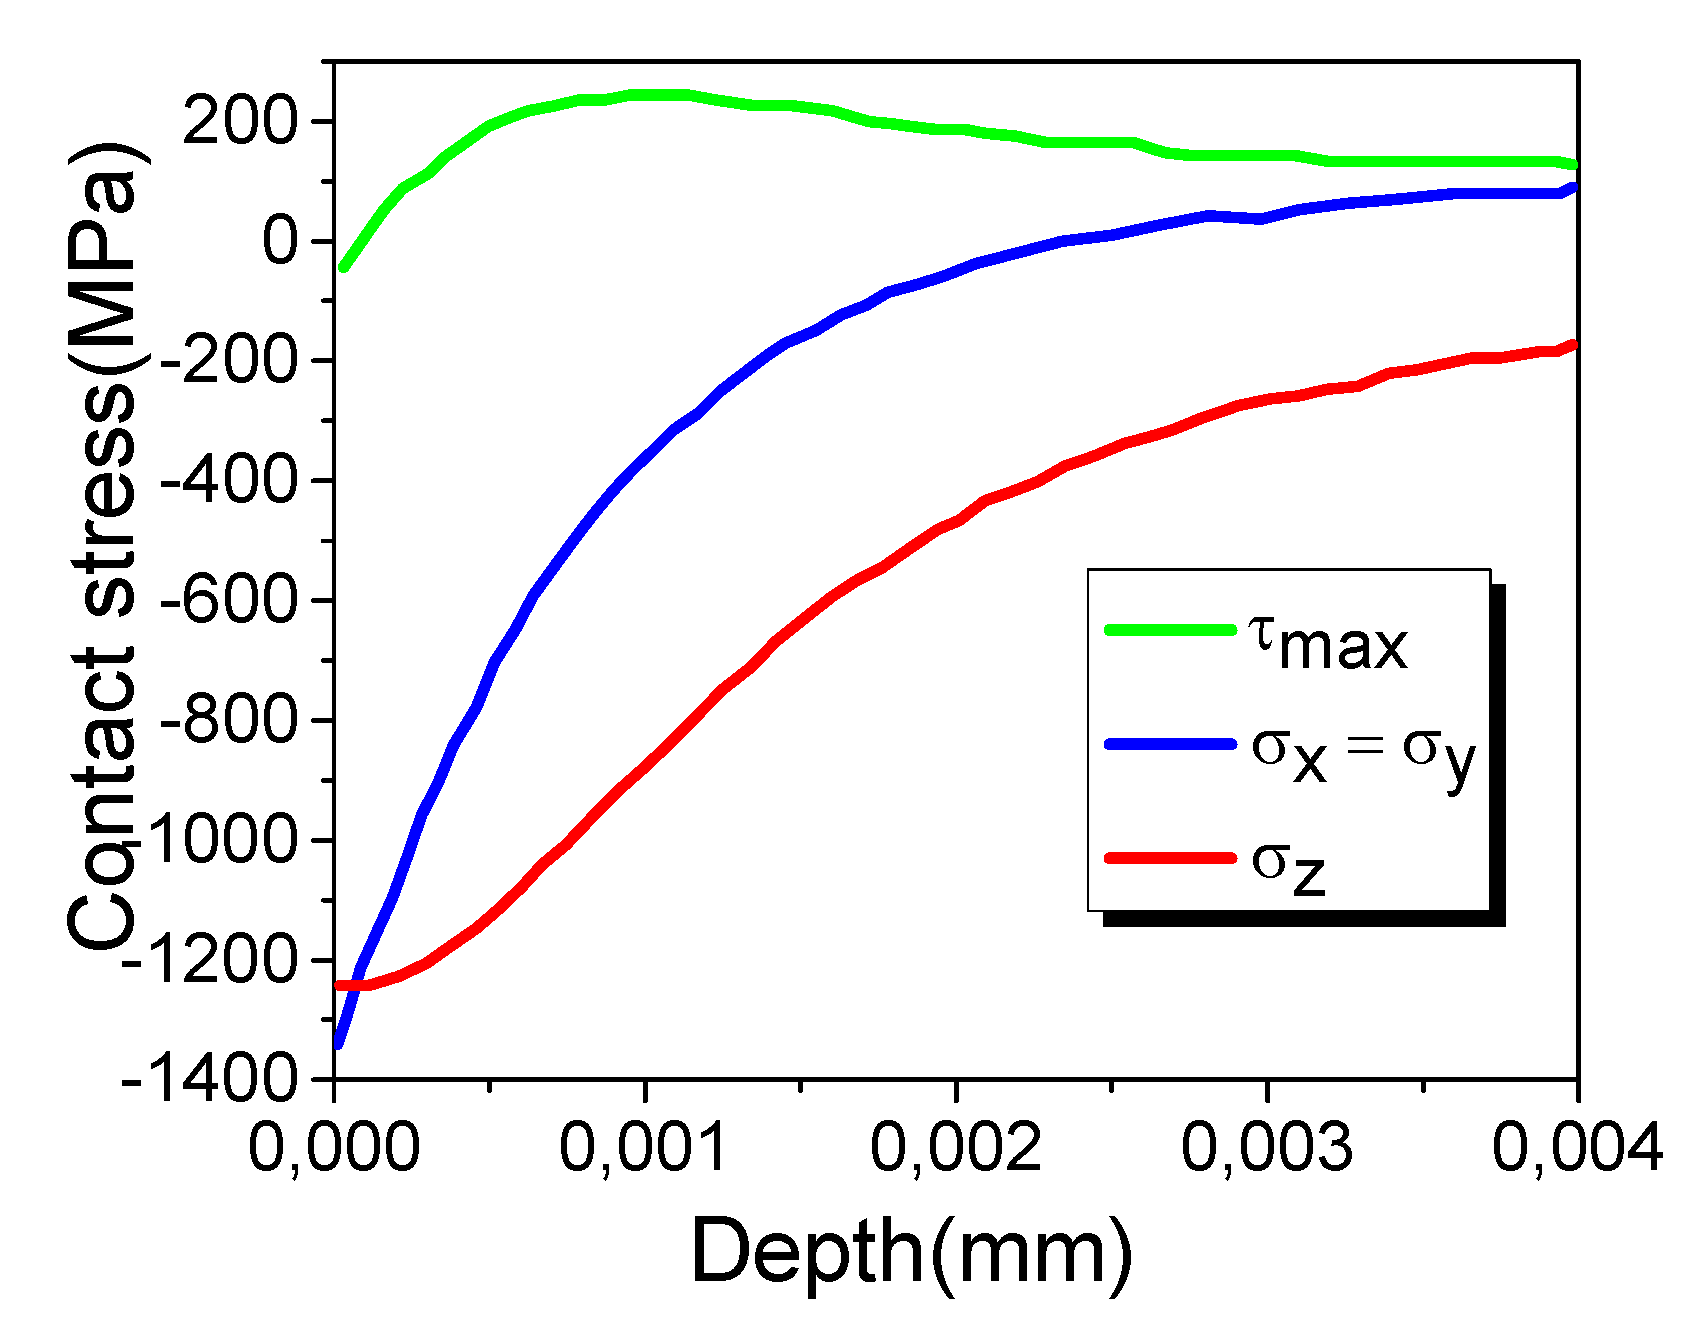
The maximum contact pressure was 1.5 Pa with a contact radius of 1.5 × 10
−3 m, assuming an elastic modulus of 380 GPa and a Poisson ratio of 0.3 for Al
2O
3, and for the ternary carbide coating, an elastic modulus of 308 GPa and a Poisson ratio of 0.24. The contact radius and the contact pressure were useful for calculating the shear stress distribution along the x, y, and z directions for the two surfaces in contact, using the following Equations [
17]:
where
σx,
σy and
σz are the shear stress along the x, y, and z directions, respectively, z is the depth of the shear stress, and
τmax is the maximum shear stress.
Figure 1 shows the determined maximum shear stress and its distribution. The maximum shear stress was 239 MPa, located at a depth of 0.91 μm below the coating surface.
The electrochemical behavior of the coatings was analyzed by means of potentiodynamic polarization and electrochemical impedance (EIS) tests. These measurements were performed on a Gamry 600 brand potentiostat instrument using an electrochemical cell with a volume of 100 mL in a solution of 3% NaCl at 23 °C. The analysis area was 0.196 cm2, using a bar of platinum and a calomel electrode as the auxiliary and reference electrodes, respectively. Polarization assays were performed with a scanning rate of 0.5 mV/s, supplying a bias from −0.3 to 0.4 V with respect to the resting potential. EIS tests were conducted while varying the frequency from 0.01 KHz to 100 MHz, applying a voltage of 10 mV.
3. Results
Figure 2 shows the SEM micrographs of the cross section of three of the coatings produced on AISI D2. Using the measurement scale, it can be established that the coatings have the following thicknesses: M4: 12.4 ± 0.2 µm, M3: 13.1 ± 0.1 µm, and M2: 12.7 ± 0.5 µm. The M1 sample (not shown) had a thickness of 15.9 ± 0.5 um. In general, the cross-section of the coatings is compact, since there were no pores and the deposited material was completely melted.
Figure 3 shows the XRD patterns of each of the coatings (M1, M2, M3, and M4). The M4 sample exhibits the cubic V
8C
7 crystalline phase structure of the NaCl type [
18]. This phase is reported on the PDF 00-025-1002 card, which assigned the highest intensities to planes (111) and (200). The coating grown from ferro-chrome (M3) has two crystalline phases: one for Cr
23C
6 belonging to the structure of NaCl (PDF 00-035-0783) with planes (420), (422), and (511) of high intensity, and the other for chromium carbide (Cr
7C
3, PDF 00-036-1482), with an orthorhombic phase that highlights planes (150), (112), (151), and (060). Due the complex structure of the XRD patterns of the M1 and M2 samples, in
Figure 4, the deconvolution of these patterns is shown in detail, where we see the presence of two for chromium carbide and one fors vanadium carbide. These results suggest that the samples with the greatest content of Fe-Cr allow a chemical reaction between the carbon of the steel and the chromium of the bath. The presence of vanadium carbide in the M1 and M2 samples in the coatings can be explained by the greater thermodynamic stability in forming vanadium carbide, because the energy of formation of vanadium carbide (−24 Kcal / mol) [
19] is less than that of chromium carbide (−18 Kcal/mol) [
20].
Figure 5 shows Kα and Kβ emission lines of the chromium (5.41 and 5.95 keV), vanadium (4.95 and 5.43 keV), aluminum (1.48 and 1.56 keV), and iron (6.40 and 7.06 keV) in the coatings. The Kα and Kβ lines are not detectable using the EDS technique because the energy of those lines is about 0.185 keV.
Table 2 summarizes the content of each element in at%. These results allow us to establish that the M1 sample, even though it was sinterized with a greater ferro-chromium content than ferro-vanadium, contains more V than Cr in the coating. This is because the formation energy of vanadium carbide is more negative than that of chromium carbide. In the M2 and M3 samples, the percentage of Cr increases, because the ferro-chromium increases from 26% to 30% wt. Finally, the M4 sample has a high content of vanadium because of the lack of ferro-chromium in the fabrication process.
Figure 6 shows XPS spectra for the Cr carbide coatings of the M1-V sample deposited on tool steel.
Figure 6a shows the extended XPS spectrum. In this spectrum, binding energies can be identified corresponding to vanadium, chromium, oxygen, carbon, and iron on the coating’s surface.
Figure 6b shows the high-resolution XPS spectrum of C1
s. Within the spectrum, four contributions can be identified. The first is centered on 284.4 eV, which corresponds to the aliphatic carbon found on the coating’s surface; the second is centered on 285.6 eV, which corresponds to the binding energy of C in the vanadium carbide; and the last two contributions are focused on 286.5 and 287.4 eV, corresponding to the binding energy of C in the chromium carbide [
21].
In
Figure 6c, the 2
p peak of Cr is exhibited, formed by the contributions of two peaks centered at 576.12 and 574.4 eV. These energies correspond to chromium oxide (Cr
2O
3) and chromium carbide (Cr
3C
2).
Figure 6d shows the V2
p and O1
s peaks, which are composed of two contributions: V 2p exhibits binding energies centered at 512.6 and 514.2 eV. These energies correspond to the V–C bonding, and the other peak corresponds to vanadium oxide. The O1s peak has four contributions: (i) one centered at 530.1 eV, corresponding to Cr
2O
3 [
22]; (ii) one centered at 531.4 eV, which is the energy of an OH group; (iii) one centered at 532 eV, which is the energy corresponding to the water absorbed by the coating (when it is exposed to the atmosphere); and iv) one centered at 533 eV, which is the energy of the oxygen absorbed into the vanadium carbide [
23].
The hardness values obtained for the carbide coatings are shown in
Table 3. The lowest hardness value for M3 is obtained in the sample corresponding to chromium carbide (14.7 GPa), and for the M4 sample, vanadium carbide values above 20 GPa were recorded, which are consistent with other studies [
24,
25]. Overall, a significant increase in hardness for the chromium–vanadium systems (M1 and M2) was not observed, possibly because there is no substantial atomic substitution between the crystal lattices of the materials that form the coatings.
Table 3 also shows the wear rate of the carbide coatings. These values show evidence that all the coatings have higher wear resistance than the substrate. Furthermore, the M3 sample exhibits the lowest wear resistance, possibly due to the low degree of hardness.
Figure 7 shows the curves of the friction coefficient for each of the carbides deposited on AISI D2. From the graph, it can be established that the coefficient of friction (COF) of the grown carbides is between 0.3 and 0.4, while for the substrate it is greater than 0.6. These values agree with results obtained in other studies [
26]. The decrease in the coefficient of friction of the coatings compared with the substrate could be explained by considering that there is free carbon on the surface, which probably acts as a lubricant when the ball-on-disk test is performed.
Figure 8 shows the scar wear for the M1 and M2 samples. The figure shows parallel lines or channels, characteristic of adhesive wear. According to Adachi and Hutchings, this situation is known as grooving wear, or the abrasion of two bodies [
27]. These slots arise from the cutting action of abrasive microparticles that are fundamentally embedded in the ball with which the test is conducted. The microparticles were possibly produced by the mechanisms of the contact fatigue and the plastic deformation that are generated during the contact of the tribological pair. These types of wear can be combined with an oxidation wear mechanism promoted by the formation of oxides due to the increase in temperature and the reaction of elements such as chromium and vanadium with the oxygen in the environment, possibly forming a film that prevents the continuous removal of material.
To determine the corrosion rate of the coating–substrate system, the potential vs. current curves, called potentiodynamic polarization and Tafel polarization, can be used.
Figure 9 shows the curves obtained for uncoated AISI D2 steel and for the coatings.
Table 4 summarizes the parameters obtained through this measurement. From the values in the table, it can be established that the coated steels exhibit increased corrosion resistance, since the corrosion current Icorr decreases by an order of magnitude with respect to the Icorr values for the AISI D2. Additionally, the results show that the coatings that grow in a salt bath with the highest concentration of vanadium exhibit lower corrosion resistance, while the coatings with chromium contents exhibit the best protection against corrosion These results can be explained by considering the XPS analysis, which showed the formation of two types of oxide in the coating: chromium oxide (Cr
2O
3) and vanadium oxide (V
2O
5). Chromium oxide has a high degree of chemical stability and is used in industry as a protective material against degradation in layers or thin films [
28,
29], and vanadium oxide is chemically unstable and therefore does not have the ability to serve as a protective layer [
30,
31].
Figure 10 shows the electrochemical impedance spectroscopy (EIS) spectra obtained for the steel and the carbides after 7 days of corrosion treatment in a solution of 3% NaCl. The equivalent circuits (EC) proposed for the fit of the experimental spectra are shown in
Figure 11. The fit between the theoretical and experimental spectra was performed with Gamry Echem Analyist software, version 7. The EC corresponding to AISI D2 (
Figure 11a) has a resistance, Rsol, which is the solution resistance, connected in series with two parallel elements: a constant phase element (CPE) with an exponent n, in which a value of 1 indicates that that element of the proposed circuit is completely capacitive, and a value of 0 indicates that that circuit element is resistive. Values between 0 and 1 indicate a capacitive and resistive behavior. Rpol is the polarization resistance, which is the resistance to the passage of charge through the substrate-electrolyte interface. For the coated steel (
Figure 11b), the proposed circuit represents a coating material with pores. The EC has an Rsol that represents the resistance of the electrolytic solution, a constant phase element CPE-c with its exponent m that represents the coating-solution interface, and Rpor, which represents the resistance to charge transfer through the pores. Additionally, a second constant phase CPE-s is included, with its exponent n along with the corrosion resistance Rcor describing the electrochemical behavior and the resistance to charge transfer at the coating–substrate interface.
Bode plots show a polarization resistance at 0.01 Hz in the range of 5 kΩ for the AISI D2 substrate (
Figure 10), while for the coatings, the impedance values are about 10 kΩ at the same frequency. In general, the impedance decreases with the exposure time for all cases, which could be due to the increase in porosity over time, which allows the electrolyte to penetrate and reach the coating–substrate interface. Additionally, the figure that shows the behavior of the phase as a function of the frequency shows two relaxation times for the coatings. This is evident in the coating submerged for 7 days (blue curve triangles). These relaxation times are given by [
32]
where
Cc is the capacitance of coatings and
Cs is the capacitance of the substrate–coating interface.
The relaxation time at high frequencies represents the dielectric coating performance (
Cc, Rpor), and the relaxation time at low frequencies represents the properties of the substrate/coating interface (
Cs, Rcor) [
33]. Bode diagrams of the M4 sample do not show good corrosion resistance, since the sample has a layer of vanadium oxide on the surface, which has little chemical stability (
Figure 9b), while the M2 sample exhibits high corrosion resistance due to the presence of a surface layer of chromium oxide, which has excellent chemical stability and acts as a protective coating. The values of the parameters obtained after the fit of the proposed equivalent circuits are summarized in
Table 5 for the coatings produced, after exposure times of 168 h. The result shows that Rpor and Rcor are lower for the M4 sample, indicating low corrosion resistance for this coating. This could be explained by the formation of only vanadium oxide in the coating during its production, as seen in the XPS spectra, whereas the coatings with high chromium content have higher values of Rcor and Rpor, which could be explained by the presence of Cr
23C
6 and Cr
7C
3 along with the formation of the stable oxide Cr
2O
3, creating a passive layer on the coating that protects the substrate from electrolyte penetration.


