1. Introduction
Surface-enhanced Raman spectroscopy (SERS) has attracted remarkable attention as a highly sensitive and powerful approach for the detection of chemical and biological substances in trace amount, since its discovery in 1974 [
1,
2,
3,
4,
5]. Although some recent studies depicted the employment of inorganic [
6,
7,
8,
9] and organic semiconductors [
10,
11,
12] as SERS platforms, nanostructures of noble metals are still major systems in SERS applications. Typically, the increase in Raman signals basically is originated to the enhancement in electromagnetic field due to the close vicinity (in nm scale) of plasmonic nanostructures [
4]. For this, to obtain the fingerprint SERS spectra of analyte molecules at ultralow concentrations, various approaches have been demonstrated to fabricate a sensitive, selective, and reliable SERS platforms [
3,
13]. Basically, the employment of colloidal nanoparticles or 2-D/3-D plasmonic nanostructures are the main strategies to fabricate SERS platforms. The usage of metal colloidal nanoparticles is a simple, inexpensive, and facile method. However, the uncontrolled aggregation of nanoparticles leads to fluctuations and discrepancy in resultant SERS spectra limiting their employment as an ideal SERS platform [
14,
15]. To overcome the major drawbacks of colloidal nanoparticles, many sophisticated methods including especially lithographic techniques such as nanosphere lithography [
16], electron beam lithography [
17], and also focused ion beam milling [
18] are commonly employed in SERS applications. The platforms with well-controlled surface morphology can be fabricated by these techniques and lead to high SERS activity and acceptable reproducibility because of the generations of hot spots and cavity resonances, as well as propagation of surface plasmon resonances (SPRs) [
19,
20]. However, these techniques need quite complicated and expensive devices [
21]. Also, the fabrication of these kinds of platforms in large quantities requires many procedures and long time. In recent years, the oblique angle deposition (OAD) approach was proposed to create spatially uniform 3-D metallic nanostructures. This vapor-phase-based technique is simple, facile, maskless, inexpensive, and scalable. By employing OAD, tilted columns of plasmonic metals can be fabricated on the surfaces [
22,
23,
24]. Internanostructure spacing, which is highly prominent to produce main enhancement factors, can be manipulated in OAD by changing the deposition conditions. In my earlier study, the OAD technique was used to fabricate anisotropic gold nanorod arrays (GNAs) and surface morphology of the resultant film was controlled via deposition angle (α) [
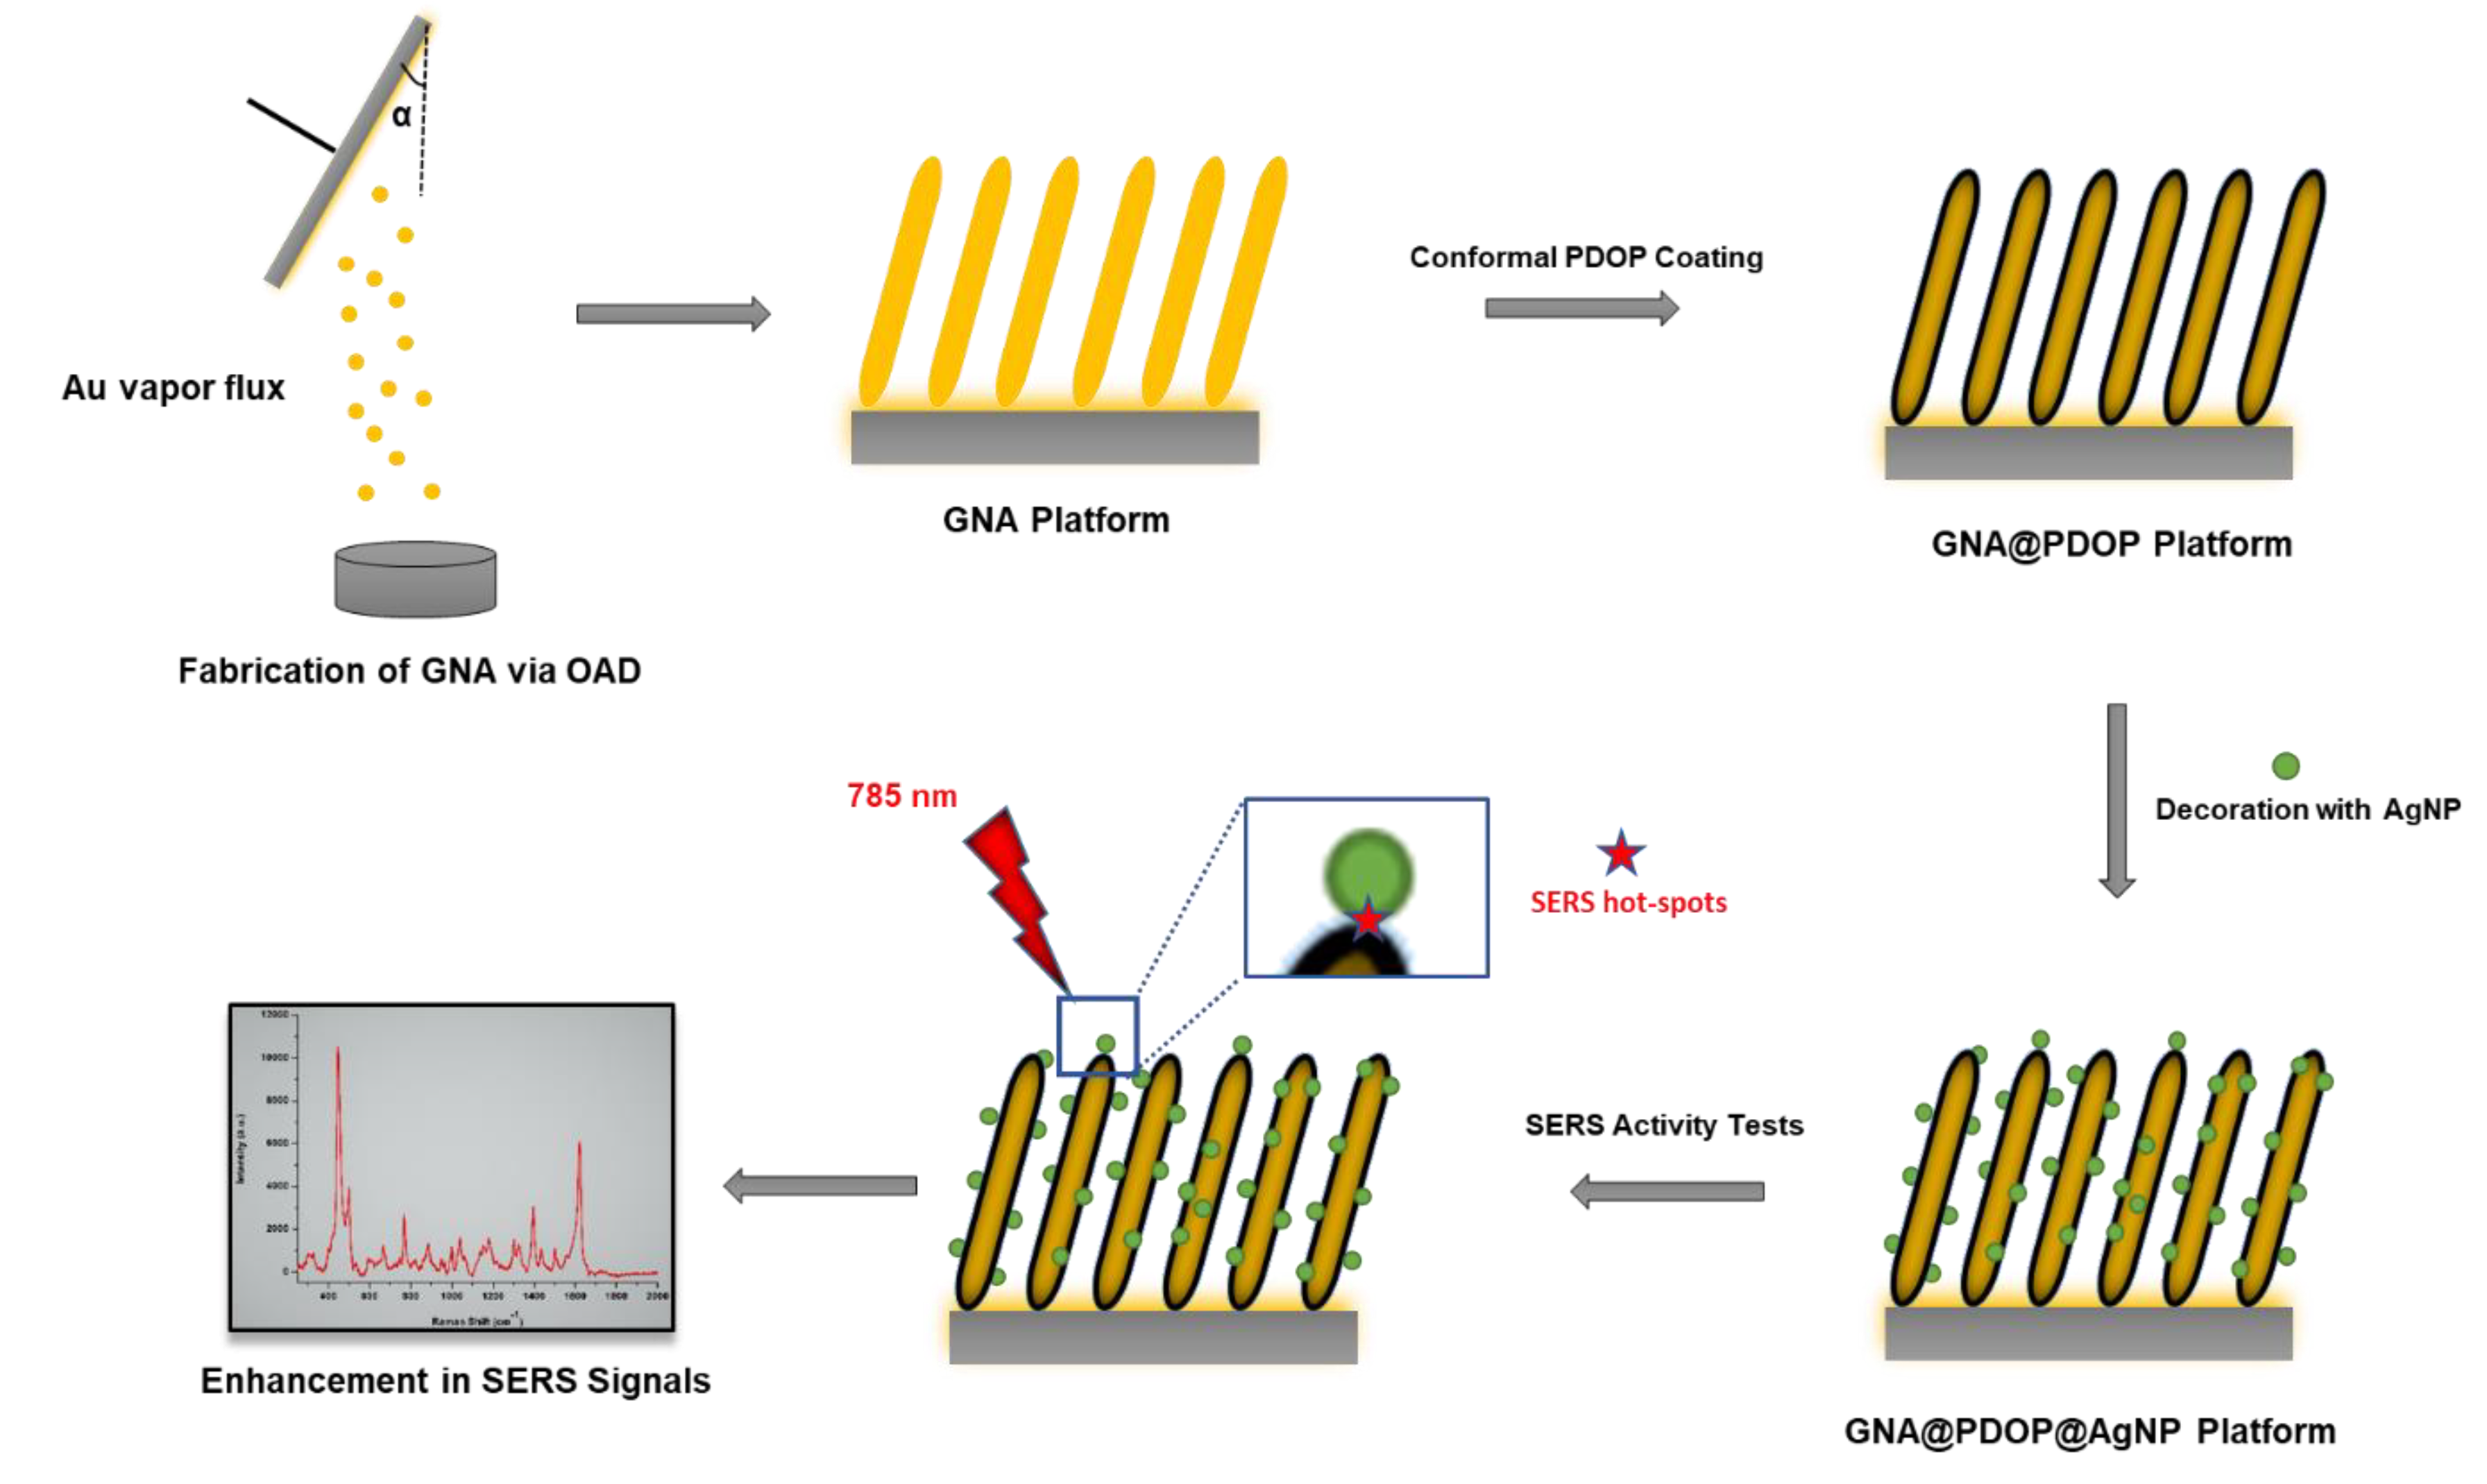
25]. It was detected that for the case of 10° of deposition angle, GNAs provided the highest enhancement in SERS signal. The combination of pristine GNAs without any surface modification with colloidal nanoparticles in different morphologies led to enhancement in SERS signal intensity. However, it was detected that some gold nanoparticles were aggregated on the GNAs’ surface which limited the SERS activity of the proposed platform in terms of reproducibility and homogeneity.
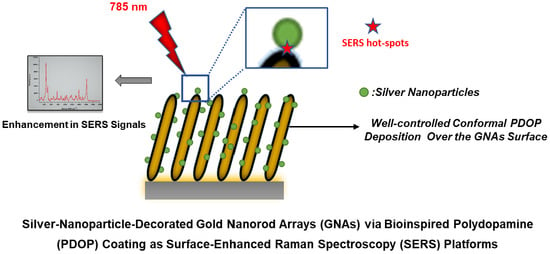
In the context of this study, to eliminate the aggregation of nanoparticles, the surface of GNAs was conformally coated with a thin layer of polydopamine (PDOP) (see
Scheme 1). Herein, PDOP, having abundant functional groups such as amine, imine, and catechol, not only adsorbs nanoparticles onto its surface but also can be employed as an interphase between GNAs and silver nanoparticles (AgNPs). PDOP via oxidative polymerization of dopamine can be conformally coated onto the all types of substrates with well-controlled thickness, superior biocompatibility, and vigorous stability. SERS tests of AgNP-decorated GNAs via bioinspired PDOP layer (GNA@PDOP@AgNP) depicted that the thickness of the PDOP layer was the dominant parameter that determined the SERS activity. Two nanostructures with controlled distance in nm scale lead to enhancement in electric field distribution which is required for an ideal SERS system.
2. Materials and Methods
2.1. Fabrication of Gold Nanorod Arrays (GNAs)
For the fabrication of GNA thin films, the procedure developed in our earlier report was employed [
25]. For this, firstly, the glass slides were cut (2.5 × 2.5 cm
2) and washed and then rinsed with excess amount of deionized water, acetone, and piranha solution. Afterwards, the glass surfaces were treated with oxygen plasma (0.2 mbar, 30 min) to eliminate contaminants. The GNAs were fabricated via a physical vapor deposition (PVD) system (NANOVAK HV, Ankara, Turkey). For the oblique angle deposition (OAD) a simple and homemade equipment was employed to arrange deposition angle. Inficon XTM/2 with high sensitivity (0.5%) was used to monitor the thickness of the films. The extra-pure gold (99.99%) was employed in the fabrication of the GNAs’ films. The deposition was accomplished at fixed base pressure (8 × 10
−6 Torr) and gold evaporation rate (0.1 A s
−1) for the same deposition angle (α = 10°).
2.2. Synthesis of Silver Nanoparticles (AgNPs)
Well-known citrate reduction method was employed to synthesize AgNPs. Briefly, aqueous solution of AgNO3 (25 mL, 1 mM) was heated to boiling under vigorous stirring in a three-neck round-bottom flask. The reduction of silver ions was obtained by addition of drop by drop tri-sodium citrate solution (1 %, 1.65 mL) to the boiling mixture. The AgNPs suspension was cooled to room temperature, and then centrifuged for the purification, and redispersed in water.
2.3. Fabrication of PDOP-Coated GNA (GNA@PDOP) and AgNP-Decorated PDOP@AgNP (GNA@PDOP@AgNP) Platforms
For the fabrication of AgNP-decorated GNA platforms, firstly, GNA platforms were deposited with a conformal layer of PDOP by immersing into the dopamine solution (2 mg/mL) in Tris Buffer (10 mM, pH = 8.5) for different deposition times (10–180 min). The thickness of PDOP layer can be manipulated via deposition time. PDOP, having abundant catechol, amine, and imine groups, can reduce the metal salts without using any stabilizer and reducing agent and also can adsorb nanoparticles onto its surface in a stable state for a long period of time. After PDOP deposition, GNA@PDOP samples were then rinsed with excess amount of water to remove unbound impurities and dried with N2 gas. Finally, to deposit AgNPs along the GNA@PDOP films (GNA@PDOP@AgNP), GNA@PDOP were immersed into the AgNP solution (40 ppm) for the fixed decoration time (1 h). Then, GNA@PDOP@AgNP platforms were rinsed with water to remove unbound AgNPs, dried with N2 gas, and stored at room condition until the next use.
2.4. SERS Measurements of GNA@PDOP and GNA@PDOP@AgNP Platforms
WITech alpha 300R Micro Raman Microscopy system was employed in SERS activity studies of the proposed platforms. The Raman system has a 785 nm laser source, a cooled charge-coupled device (CCD) detector and a motorized microscope stage. The Raman measurements were obtained in the following experimental conditions: ×50 objective, 10 mW laser power, 1 µm spot size, and 20 s acquisition time. Baseline correction was performed to all measurements in the range of 200–2000 cm−1. Methylene blue (MB) was employed as the Raman reporter molecule to determine the SERS performances of the platforms. For this, 3 µL of aqueous solution of MB (10 µM) was dropped onto the films and kept in a hood until dry. After drying, coin-shaped Raman sample sizes of 3 ± 1 mm was observed onto the platform surfaces. To evaluate the reproducibility and homogeneity of the proposed SERS system, at least ten Raman spectra were obtained from the different spots of the substrate.
2.5. Characterization
The ultraviolet−visible (UV−vis) absorption spectra of AgNPs were obtained using a Shimadzu UV-3600 Plus UV−vis−near-IR spectrophotometer (Shimadzu, Kyoto, Japan). The morphologies of the SERS platforms were characterized by a Zeiss Sigma 300 (Zeiss, Jena, Germany) field emission scanning electron microscope (SEM). The transmission electron microscopy (TEM) images of AgNPs were collected by a Hitachi 7700 (Hitachi, Tokyo, Japan) at 120 KV. The thickness of the PDOP films was measured via a variable angle ellipsometer (UVISEL, Jobin Yvon-Horiba, Kyoto, Japan). For this, during PDOP deposition procedure, a smooth silicon wafer was immersed into the solution. All thickness values were averages of at least five measurements obtained from different positions on each substrate with a four-phase model including silicon substrate/SiO2/overlayer/air.
3. Results and Discussion
Firstly, I fabricated anisotropic GNAs onto the glass slides by employing OAD technique. In my previous study, we showed that directional GNAs having tilt angles could easily be created on solid substrates via the OAD technique and the surface densities of the resultant films can be controlled by manipulating the deposition angle (α) [
25]. We also detected that at 10° of deposition angle, we obtained closely packed and tilted gold nanorod arrays. The number density of nanorods was calculated by using IMAGEJ software and found to be 3.9 × 10
8 nanorods/cm
2. I also detected that the diameters of nanorods were in the range of 100–200 nm with average of 140 nm. This platform resulted in the highest SERS activity due to its unique advantages over 1-D and 2-D structures. The 3D structure of the SERS platform provided advantages such as promoted number of hot spots, increment in surface area, and easily capture of analyte molecule. SERS tests of this platform indicated that the tips of gold nanorods were main contributors for the creation of hot spots. It was also shown that longitudinal and transverse localized surface plasmon resonance (LSPR) modes of the nanorod, nanoantenna effects, tip-focusing, and cavity resonances could generate remarkably enhanced electric field [
19,
20,
26]. I employed spectroscopic ellipsometry to determine plasmonic properties of GNA films fabricted at 10° of deposition angle. The variations of the ellipsometric variables (Ψ and Δ) and dielectric constants (i.e., both real and imaginary parts) of the GNAs for different direction of incoming light are summarized in
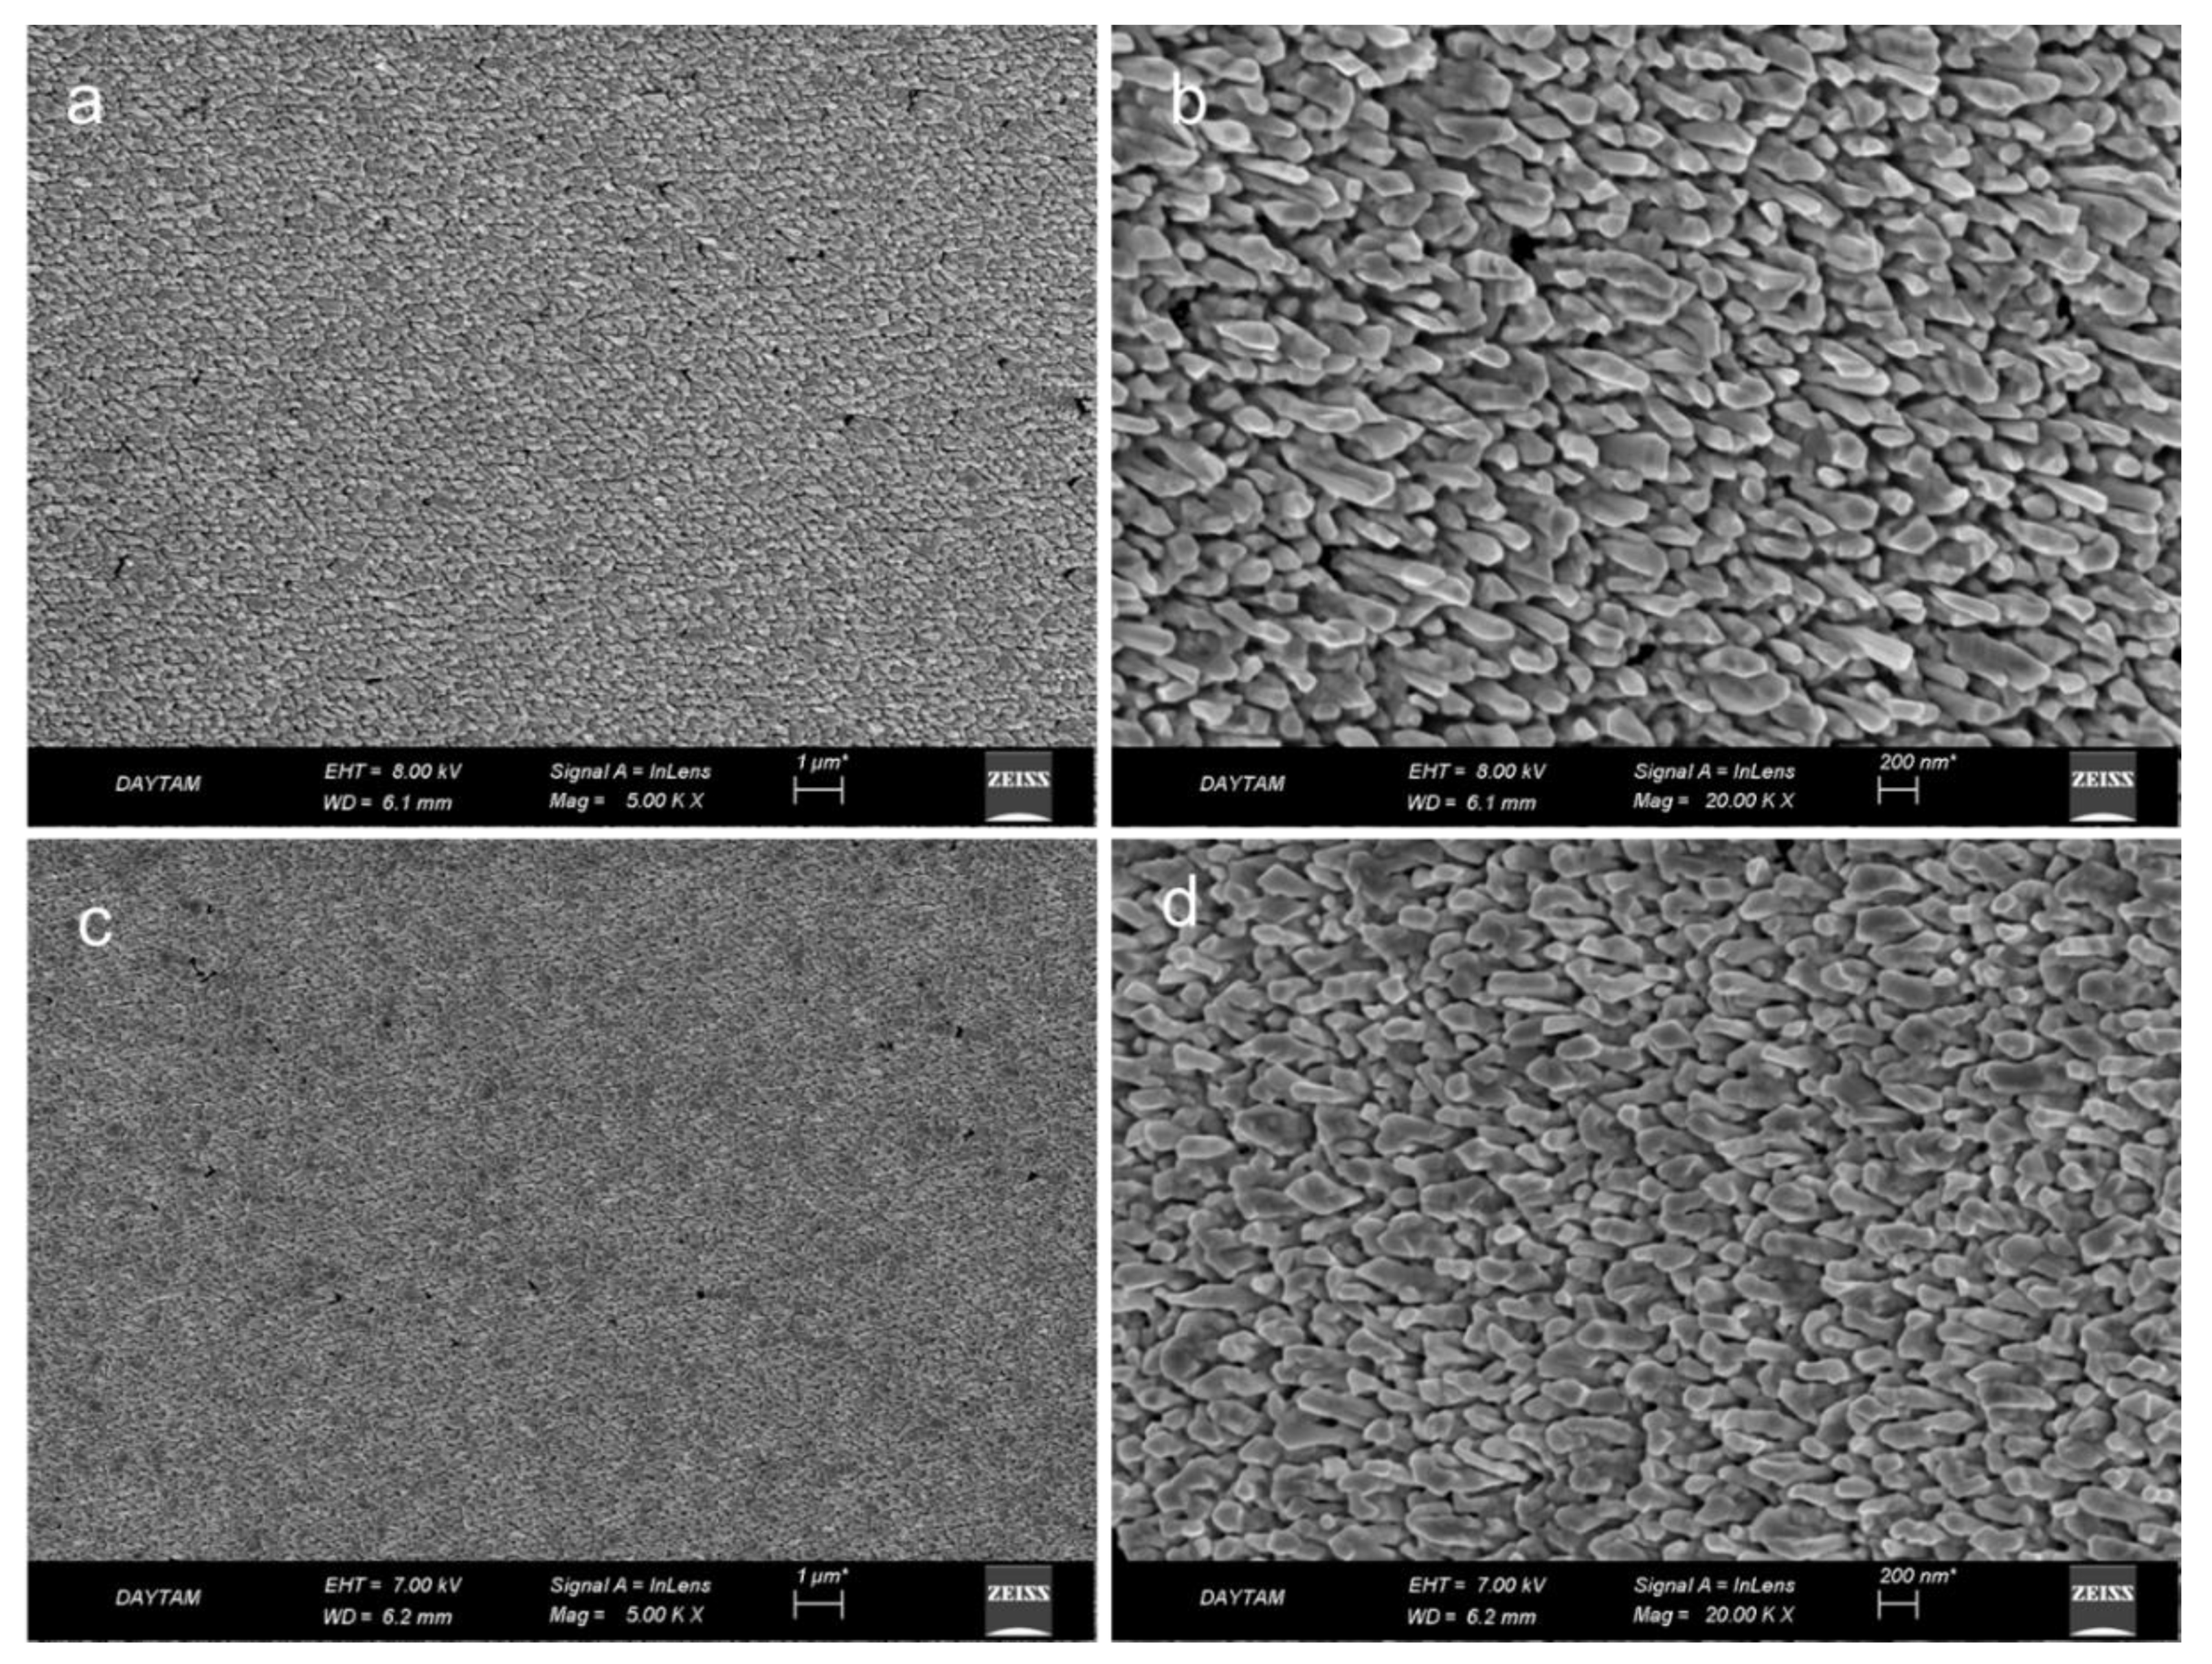
Figure S1. Briefly, GNA films, due to the direction of incoming light, revealed a clear optical anisotropy. Strong plasmon resonance was observed, indicating high polariton formation when incoming light came through the GNA along the anisotrophic axis. The amplitude (Ψ) spectrum has a sharp dip and a weak dip at ≈1.1 eV (1127 nm), and ≈2.1 eV (590 nm), respectively, indicating the longitudinal and transverse surface plasmon resonances (SPRs). For the same wavelengths, the phase (Δ) spectrum reveals maximums. The tilted GNAs induced an enhancement in both of the the photonic light scattering and trapping, which led to the increase in the local photon intensity. In summary, an enhancement in the excitation of surface plasmons these phenomena was observed due to these phenomena. The shift to higher energy and broadening was observed in the SPR bands, if the incoming light was aligned with isotrophic axis. Therefore, in this study, the gold deposition angle was kept at a constant value of 10°. SEM images of thin gold film (
Figure 1a,b) indicate that GNAs with closely packed and tilted gold nanorods were fabricated successfully onto the glass slide through the OAD approach.
In the second step, the surface of the GNAs was deposited with a well-controlled thin layer of PDOP through oxidative polymerization of dopamine. It was shown that the thickness of the PDOP layer can be manipulated by changing dopamine polymerization periods [
27]. Also, PDOP can be conformally coated onto the all types of substrates with well-controlled thickness, superior biocompatibility, and vigorous stability. In addition to all its advantages, in the context of this study, PDOP would provide these two benefits [
28,
29]: (i) PDOP, having abundant functional groups including amine, imine, and catechol can reduce metallic salts as metallic nanoparticles in an easily controlled procedure without the employment of any additional reductive agents or metallic seed systems and also adsorb nanoparticles onto its surface in a stable state for a long period of time; (ii) since the thickness of the PDOP layer can be controlled with high sensitivity (in nm range) over the polymerization time, PDOP can be employed as an interphase between two plasmonic nanostructures (such as GNAs and AgNPs). Two nanostructures with controlled distance in nm scale would lead to enhancement in electric field distribution which is required for an ideal SERS system. To determine the effect of PDOP thickness on SERS activity of the resultant platforms, polymerization time periods were varied in the range of 10–180 min. In my earlier reports, we detected that for this range of polymerization times, the thickness of the PDOP layer ranged from 1 to 10 nm [
28,
29]. After the PDOP deposition, no morphological change was observed from the SEM images of the GNA@PDOP platform (
Figure 1c,d) for the case of 30 min polymerization time, indicating the conformal coating of PDOP all over the GNAs. Similar results were obtained for the other GNA@PDOP platforms with different polymerization times (see
Figure S2).
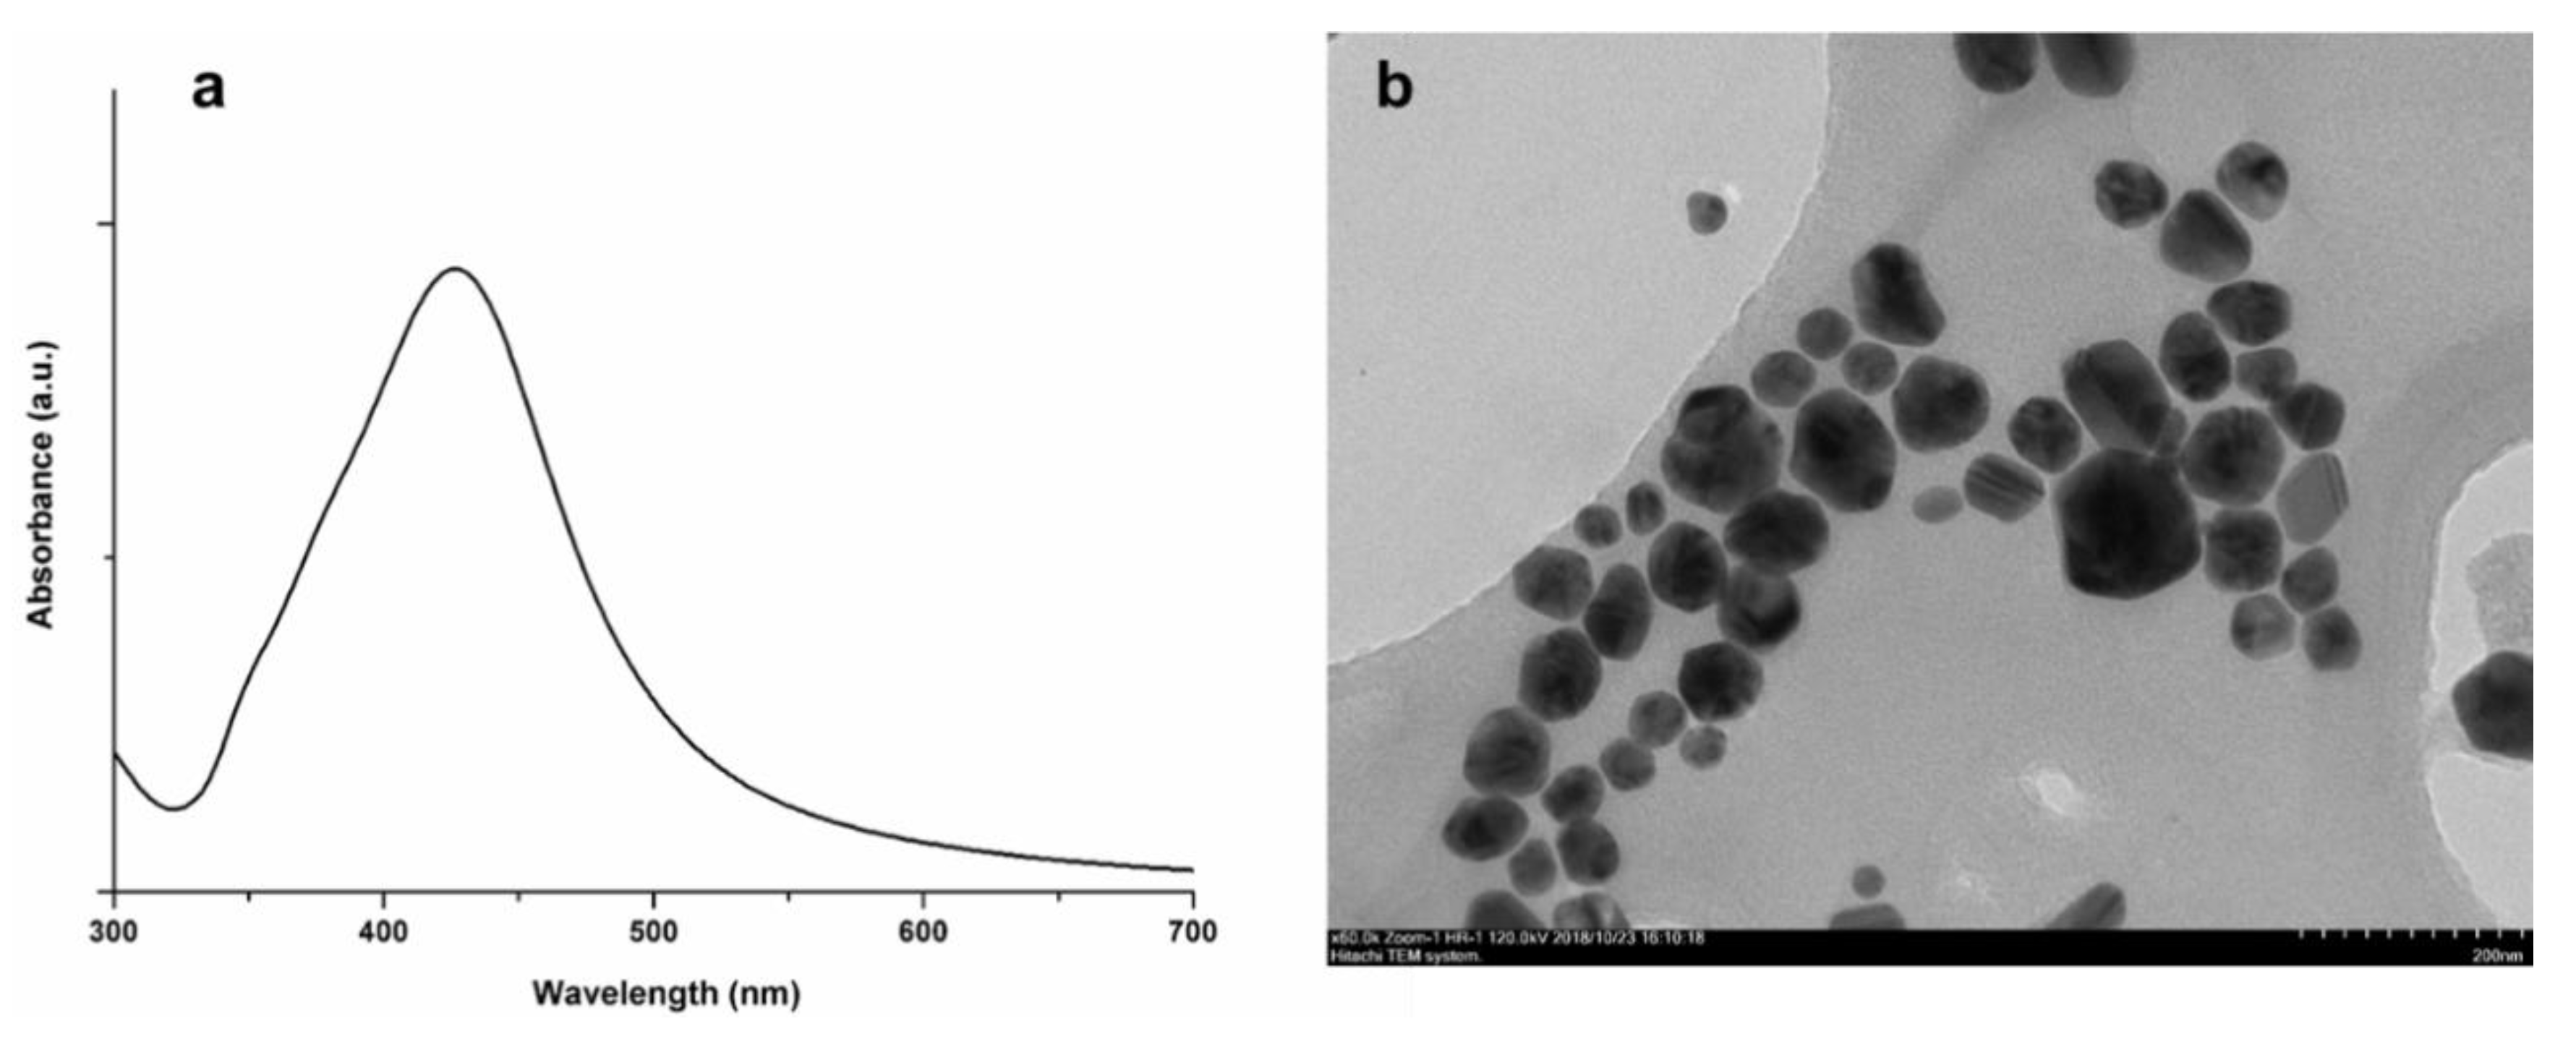
For the characterization of AgNPs, I employed the UV–vis absorption spectra and TEM analysis (
Figure 2). AgNPs showed an absorption maxima at 430 nm and from the TEM images, it was detected that the size of AgNPs were in the range of 20–70 nm and average size was found to be 40 nm. From these data, I can conclude that AgNPs were synthesized in the required morphology and size range.
For the SERS activity tests, firstly, at least 10 spectra from the different spots were collected from the pristine (bare) GNA and GNA@PDOP platforms.
Figure 3 summarizes the SERS activity of platforms with representative spectra and their intensity histogram at 1620 cm
−1 for the comparison. Similar to my earlier report, for the case of bare GNAs, all obtained spectra are obvious with high signal-to-noise ratios. Also, the all collected spectra are consistent with my earlier reports for MB [
10,
11,
12,
25,
28,
29]. Some prominent peaks in the spectra of MB were corresponded to the following Raman bands: peak at 1620 cm
−1 the ring stretch (ϒ(C–C)), peak at 1435 cm
−1 asymmetric C–N stretches (ϒ
asym(C–N)), peak at 1393 cm
−1 symmetric C–N stretches (ϒ
sym(C–N)), and peak at 451 cm
−1 the C–N–C skeletal deformation mode (δ(C–N–C)). Closely packed and tilted GNAs resulted in the high SERS activity due to its unique advantages over 1-D and 2-D structures such as increased surface area of the substrate, enhancement in the creation of hot spots, and the increase in the capture of analyte molecules. SERS tests of this platform indicated that the tips of gold nanorods were main contributors for the formation of hot spots. Nanoantenna effects, tip-focusing, and cavity resonances in addition to longitudinal and transverse LSPR modes of the nanorods can create the enhancement in SERS signal. However, after deposition of a thin layer of PDOP via oxidative polymerization, a dramatic decrease was detected for all GNA@PDA samples. Even for 10 min of polymerization time (~1 nm PDOP layer thickness), SERS signal intensity was decreased to half of the bare GNA. This result is somewhat expected. Since the MB molecules were not adsorbed directly on the surface of the GNAs, electromagnetic enhancement due to enhancement of localized surface plasmons could not be created on the plasmonic surface. As the polymerization time was increased (i.e., PDOP film thickness), the SERS signal was decreased accordingly. It seems that for the case of 60 min PDOP deposition time (~6 nm PDOP layer thickness), Raman signal was totally quenched.
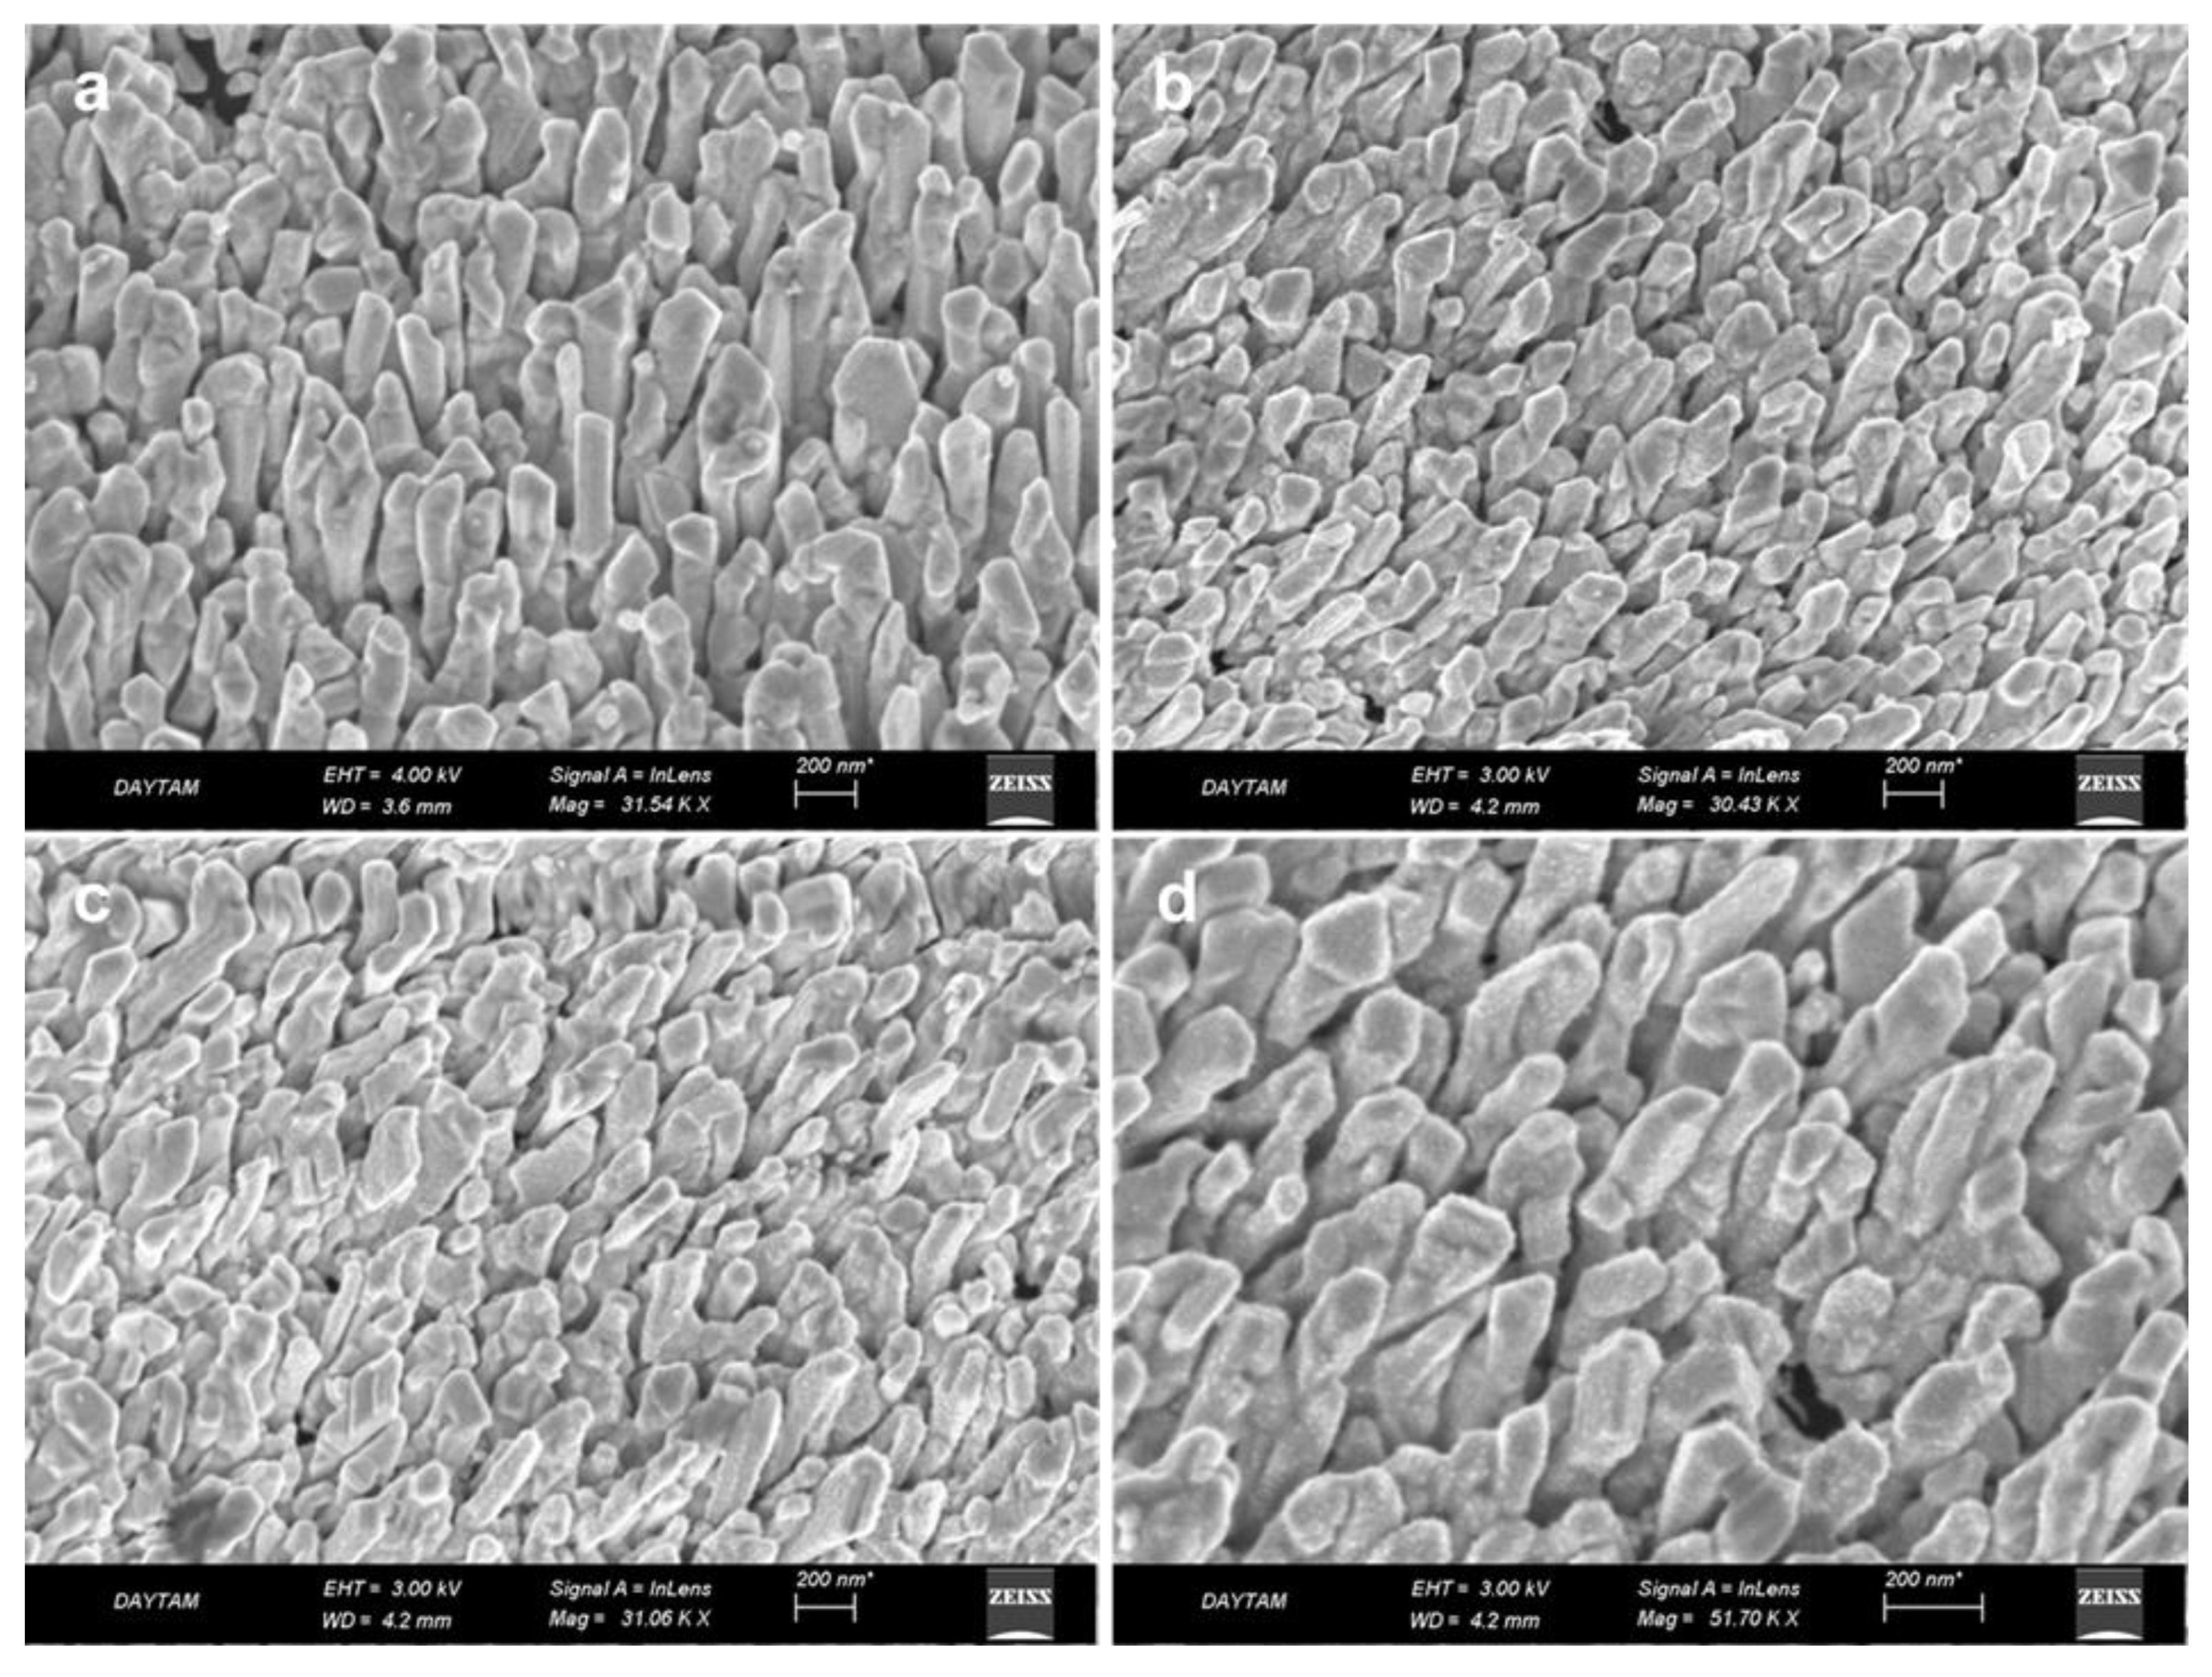
In this study, I aimed to increase SERS efficiency of GNA films by decorating them with AgNPs via bioinspired PDOP layer. To fabricate GNA@PDOP@AgNP platforms, GNA@PDOP thin films were immersed into the AgNP solution for a fixed time (1 h). The morphological observation of the GNA@PDOP@AgNP platforms for different PDOP deposition times was performed by SEM and representative images were summarized in
Figure 4. In general, for the all PDOP deposition times (i.e., PDOP film thickness), the AgNPs were decorated on the GNA@PDOP platform. It seems that PDOP, having abundant functional groups including catechol, amine, and imine, could adsorb AgNPs onto its surface. Detailed examination of GNA@PDOP@AgNP platforms indicated that for the case of 10 min PDOP deposition (
Figure 4a), lower surface coverage of AgNPs was detected in comparison to higher deposition times’ samples. This observation can be attributed to probable discontinuities in PDOP film due to the very low thickness (~1 nm) of the film. Higher deposition time of PDOP (30, 60, and 180 min) led to a higher number of decorated AgNPs. No remarkable difference was observed for these three platforms (
Figure 4b–d). Also, I performed an EDX elemental mapping to determine composition of the proposed SERS system (
Figure S3). From this analysis, I can conclude that AgNPs were deposited all over the GNA surface. Also, the elemental weight ratio of silver to gold was found to be 6/94.
After AgNP decoration, the resultant platforms were employed as SERS systems.
Figure 5 summarizes the SERS activity of the platforms with representative spectra and their intensity histogram at 1620 cm
−1 for the comparison. Raman spectra of GNA@PDOP@AgNP platfoms clearly indicated that PDOP deposition time (i.e., PDOP film thickness) is the dominant parameter that determines the SERS activity of the final system. Although the lower surface coverage of AgNPs was detected for the case of 10 min of PDOP deposition time, a two times higher SERS signal intensity was measured compared with bare GNA. This enhancement in SERS signal can be attributed to the synergistic action which originated from the interaction of GNAs and AgNPs. Theoretical and experimental observations depict that plasmonic nanostructures with a few nanometers proximity can produce an enhanced electrical field and serve as an ideal SERS platform [
25]. For example, Garcia-Vidal and Pendry have depicted a model to determine the electromagnetic interaction between adjacent plasmonic nanostructures [
30]. By this model, they demonstrated that for the case of isolated nanoparticles, the average electromagnetic enhancement is about 10
3. However, when two particles are almost in direct contact, average enhancement has its maximum value with 10
6. Therefore, it is quite reasonable to expect an enhancement in local electric field and an increase in resultant SERS activity of the proposed platform. The increase in PDOP deposition time (30 min, 3 nm PDOP film thickness) resulted in the highest SERS signal intensity (5 times higher than bare GNA). Conformal and continuous deposition of PDOP layer led to higher surface coverage of AgNPs as well as more enhancement in Raman signal intensity. For the quantification of the SERS activity of the platforms, Equation (1), by using the prominent Raman peak intensity of MB at 1620 cm
−1, was employed to calculate the SERS enhancement factors (EF).
Herein,
Ibulk and
ISERS Platform are the Raman peak intensities obtained from bulk MB and the adsorbed MB on the SERS platform, respectively, and
Nbulk and
NSERS Platform are the calculated number of MB molecules for the reference sample and SERS platform, respectively. The EFs for bare GNA and GNA@30 min PDOP@GNA were found to be 7.5 × 10
5 and 3.75 × 10
6, respectively. These values were three times higher than my earlier study which was obtained from gold nanoparticles deposited onto GNAs without any surface modification [
25]. It seems that the employment of a PDOP layer as an interface between two plasmonic nanostructures led to uniform deposition of AgNPs and a resultant enhancement in SERS activity. However, further increase in PDOP deposition time showed dramatic decrease in SERS intensity. It must be noted that for the cases of 30, 60, and 180 min of PDOP deposition times, the surface coverages of AgNPs were almost the same. Therefore, it can be concluded that the controlled distance between the GNA and AgNPs via PDOP determines SERS efficiency of GNA@PDOP@AgNP platforms and 3 nm of PDOP thickness is the optimum value to obtain the highest SERS signal. More detailed theoretical and experimental research is required to clarify these phenomena which will be the subject of another study in the near future. However, when AgNPs were deposited onto the bare GNA films, it was detected that most of the AgNPs were aggregated onto the GNA (
Figure S4). These kinds of agregated structures lead to the loss of advantages of the 3-D GNA surface and the decrease as well as discrepancy in SERS signal.
For the quantification and characterization of the reproducibility of GNA@PDOP@AgNP platforms, relative standard deviation (RSD) analysis was performed for the case of 30 min PDOP deposition time from 20 different spectra. The RSD values for the some obvious peaks in the MB spectra at 1620, 1435, 1393, and 451 cm−1 were calculated as 0.14, 0.14, 0.15, and 0.16, respectively. For the all peaks, RSD values less than 0.17 definitely indicates the acceptable reproducibility of GNA@PDOP@AgNP system as an ideal SERS platform.


