Inkjet Printing of Sc-Doped TiO2 with Enhanced Photoactivity

 ,
,
Abstract
1. Introduction
2. Materials and Methods
2.1. Materials and Characterization Methods
2.2. Synthesis of Pure and Sc-Doped TiO2 Nanoparticles
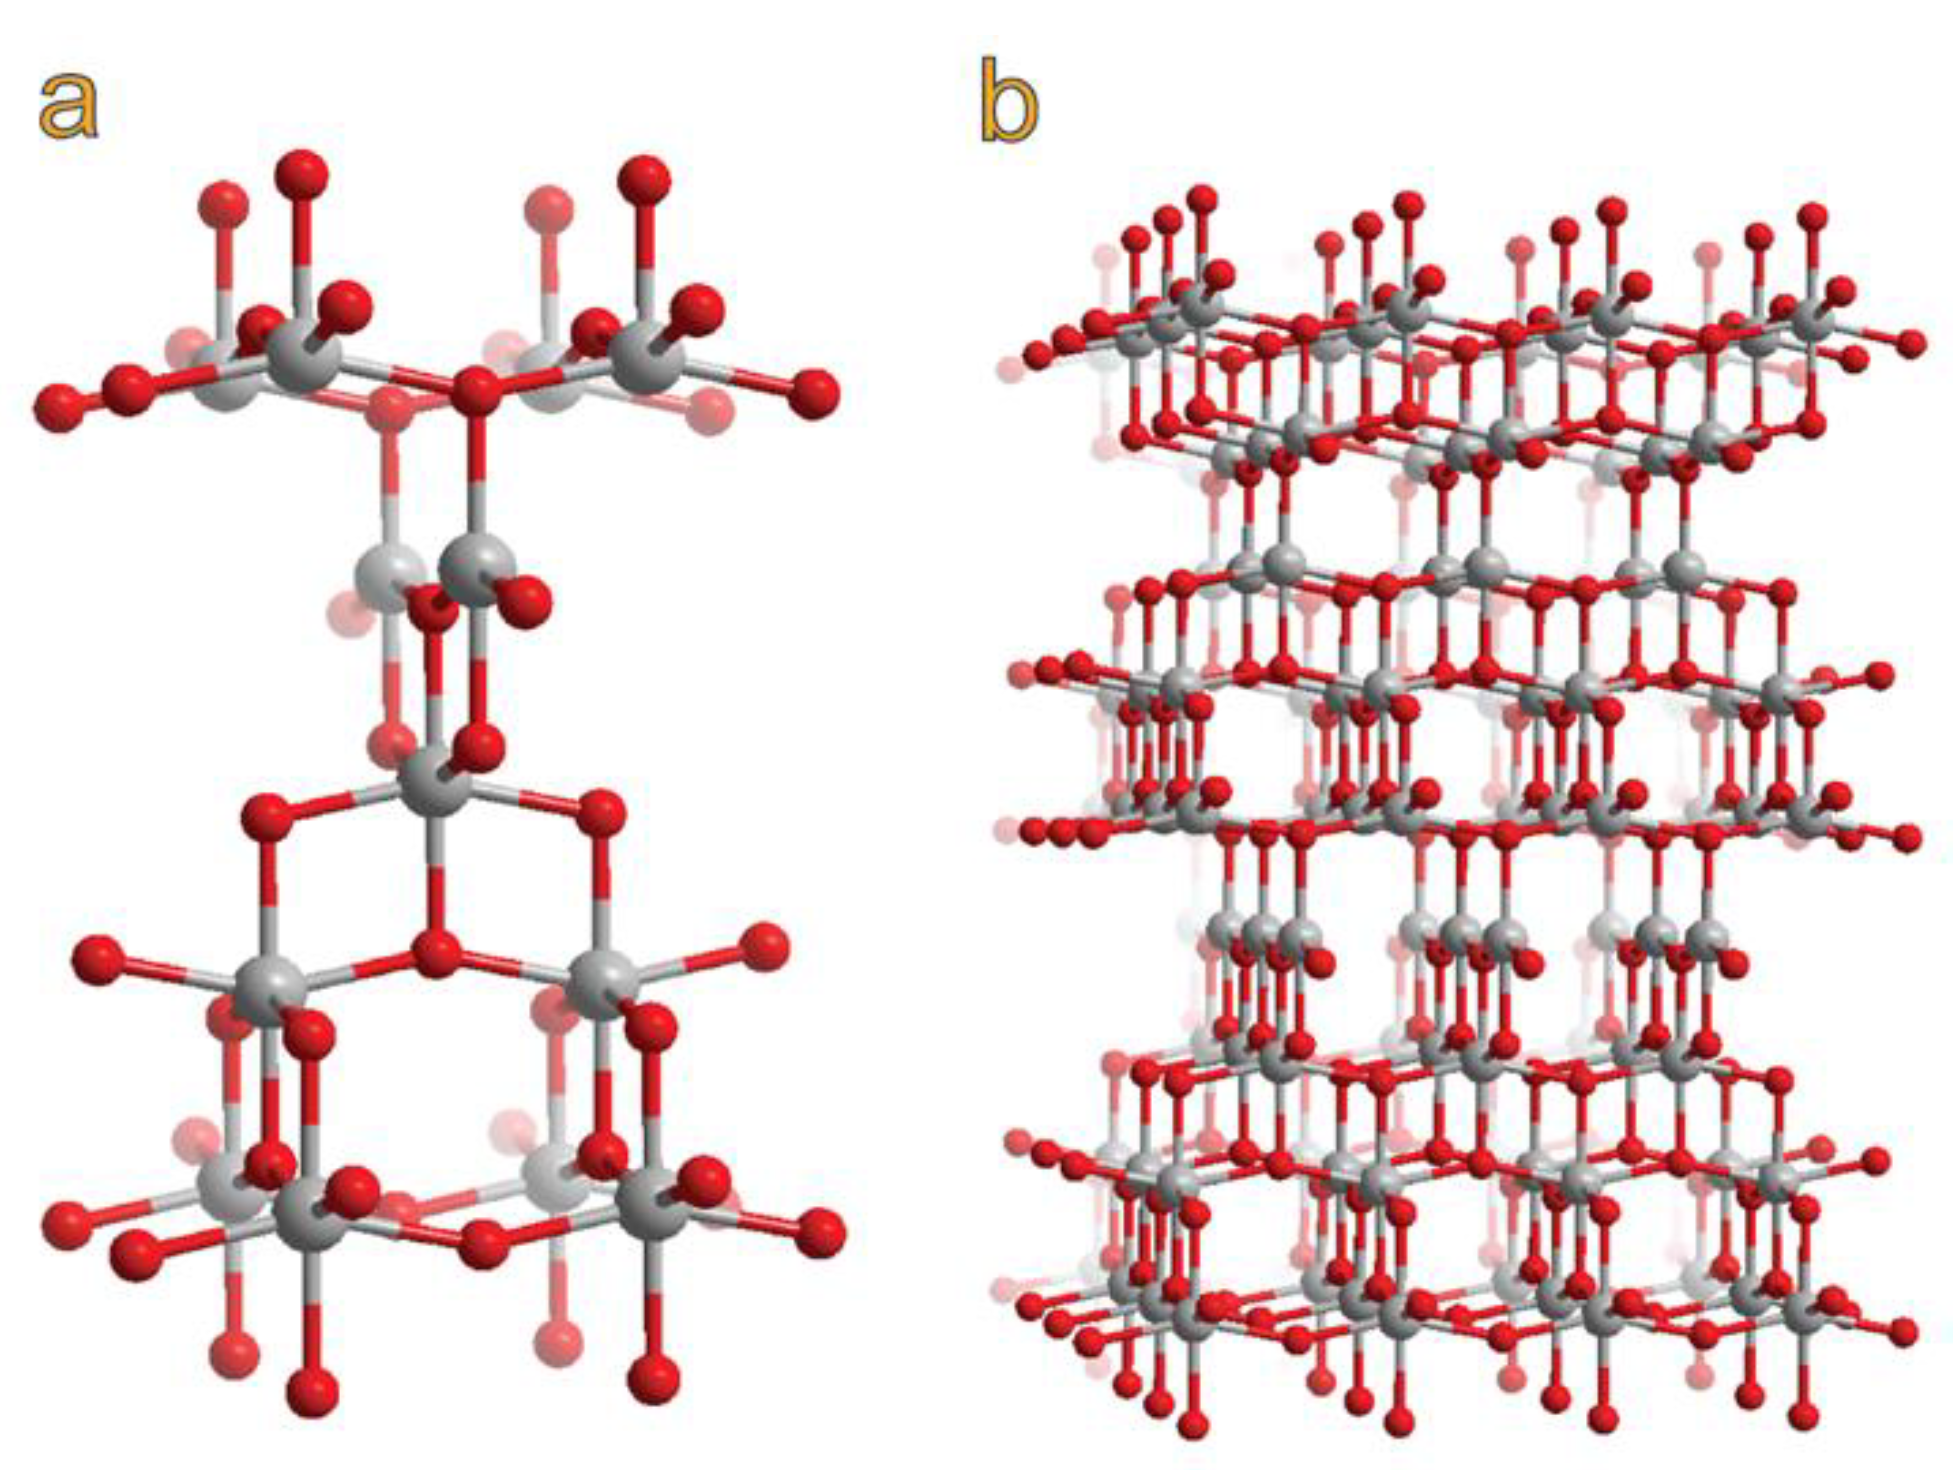
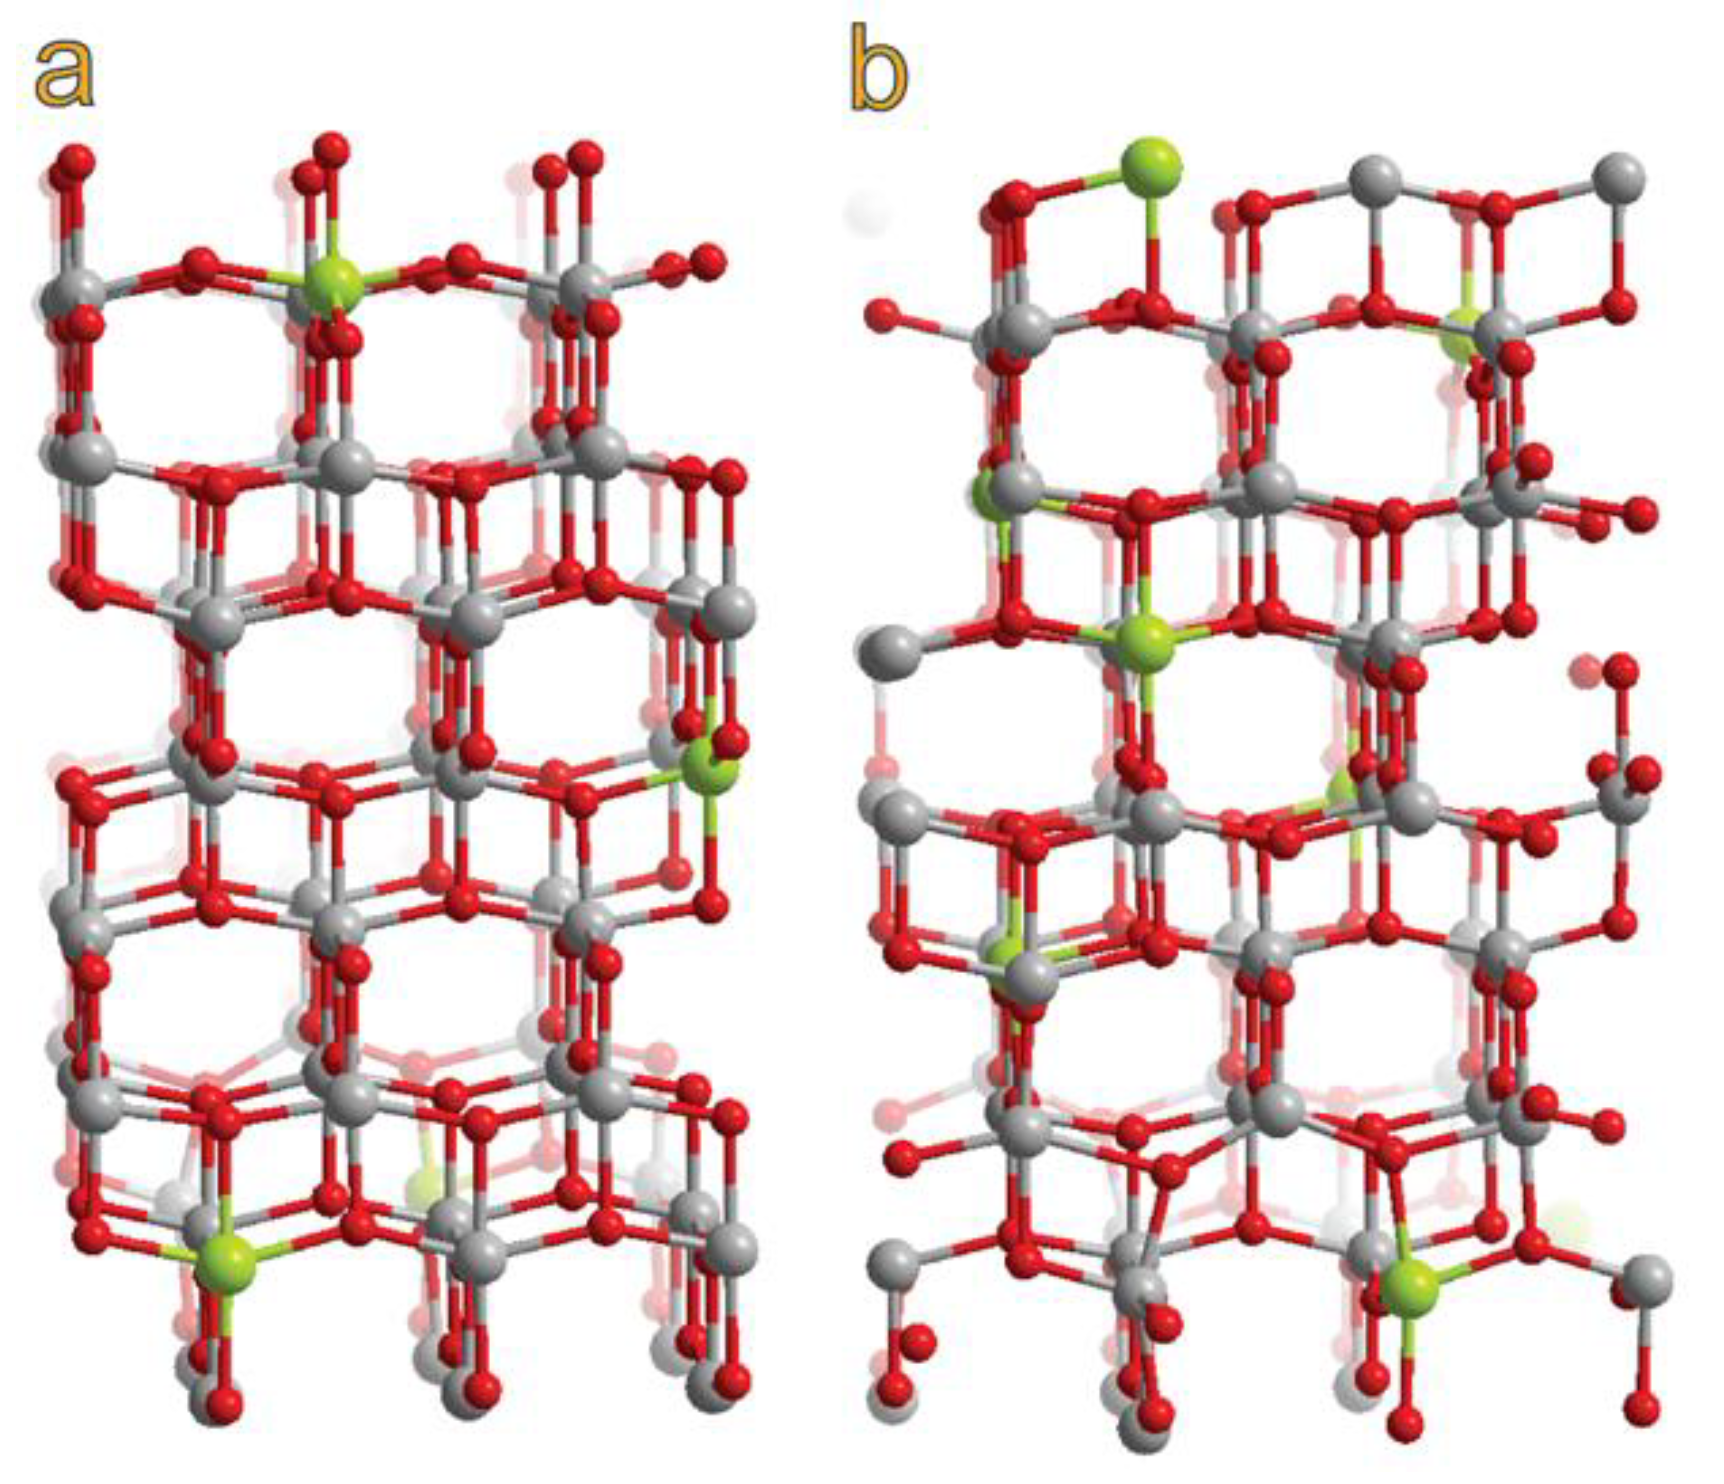
2.3. Computational Models and Methods
3. Results and Discussions
3.1. Physicochemical Characterization of Sc-Doped Nanoparticles
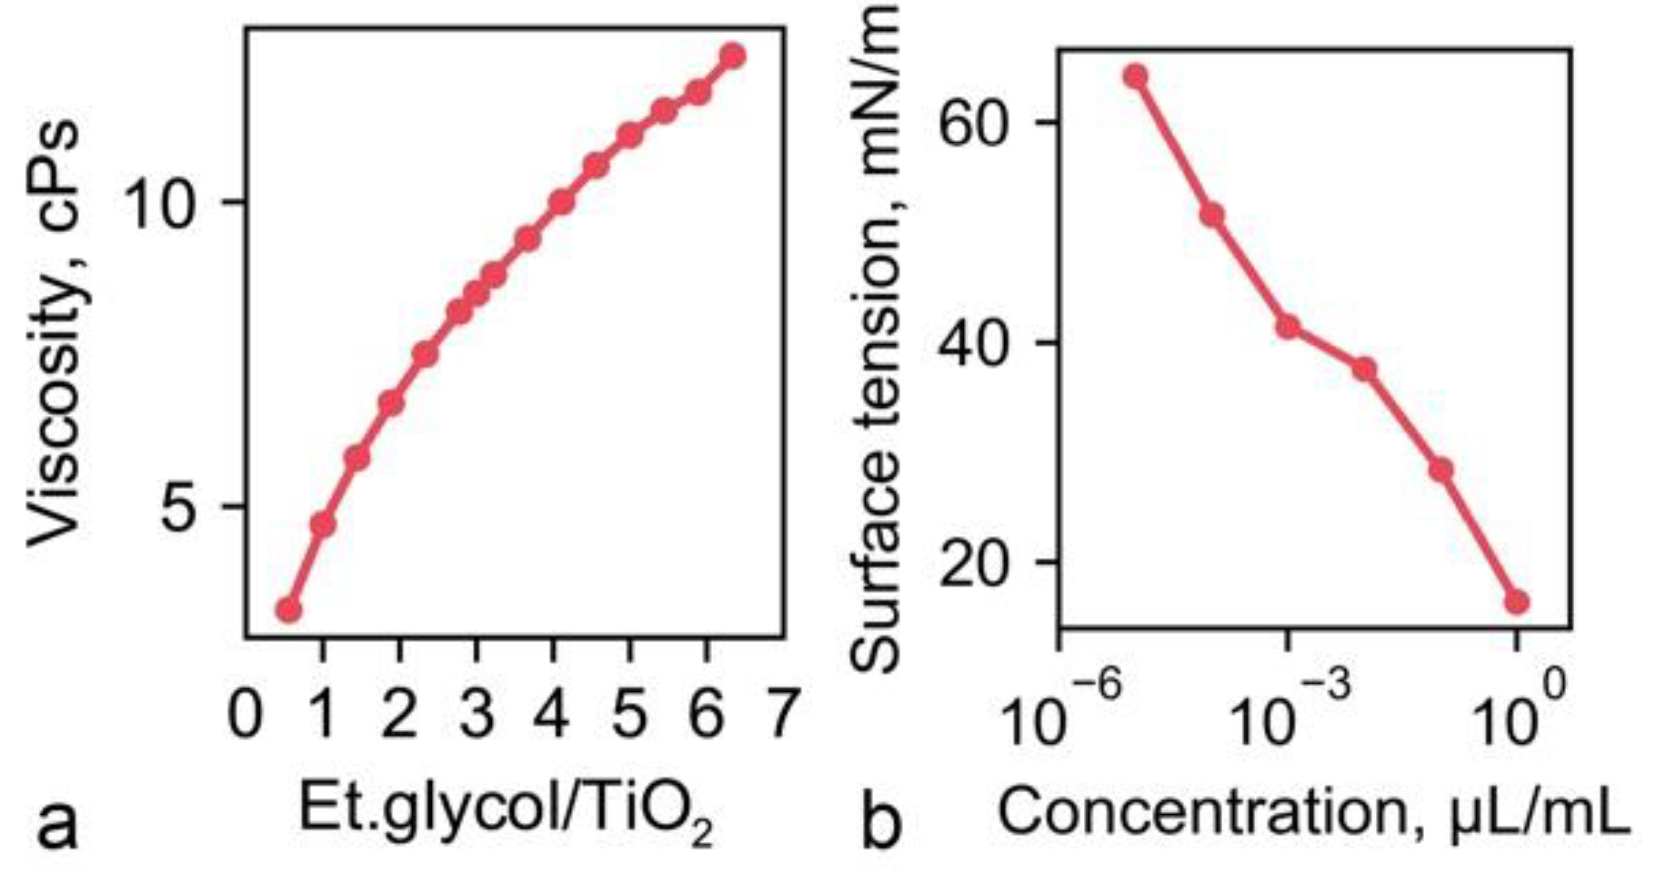
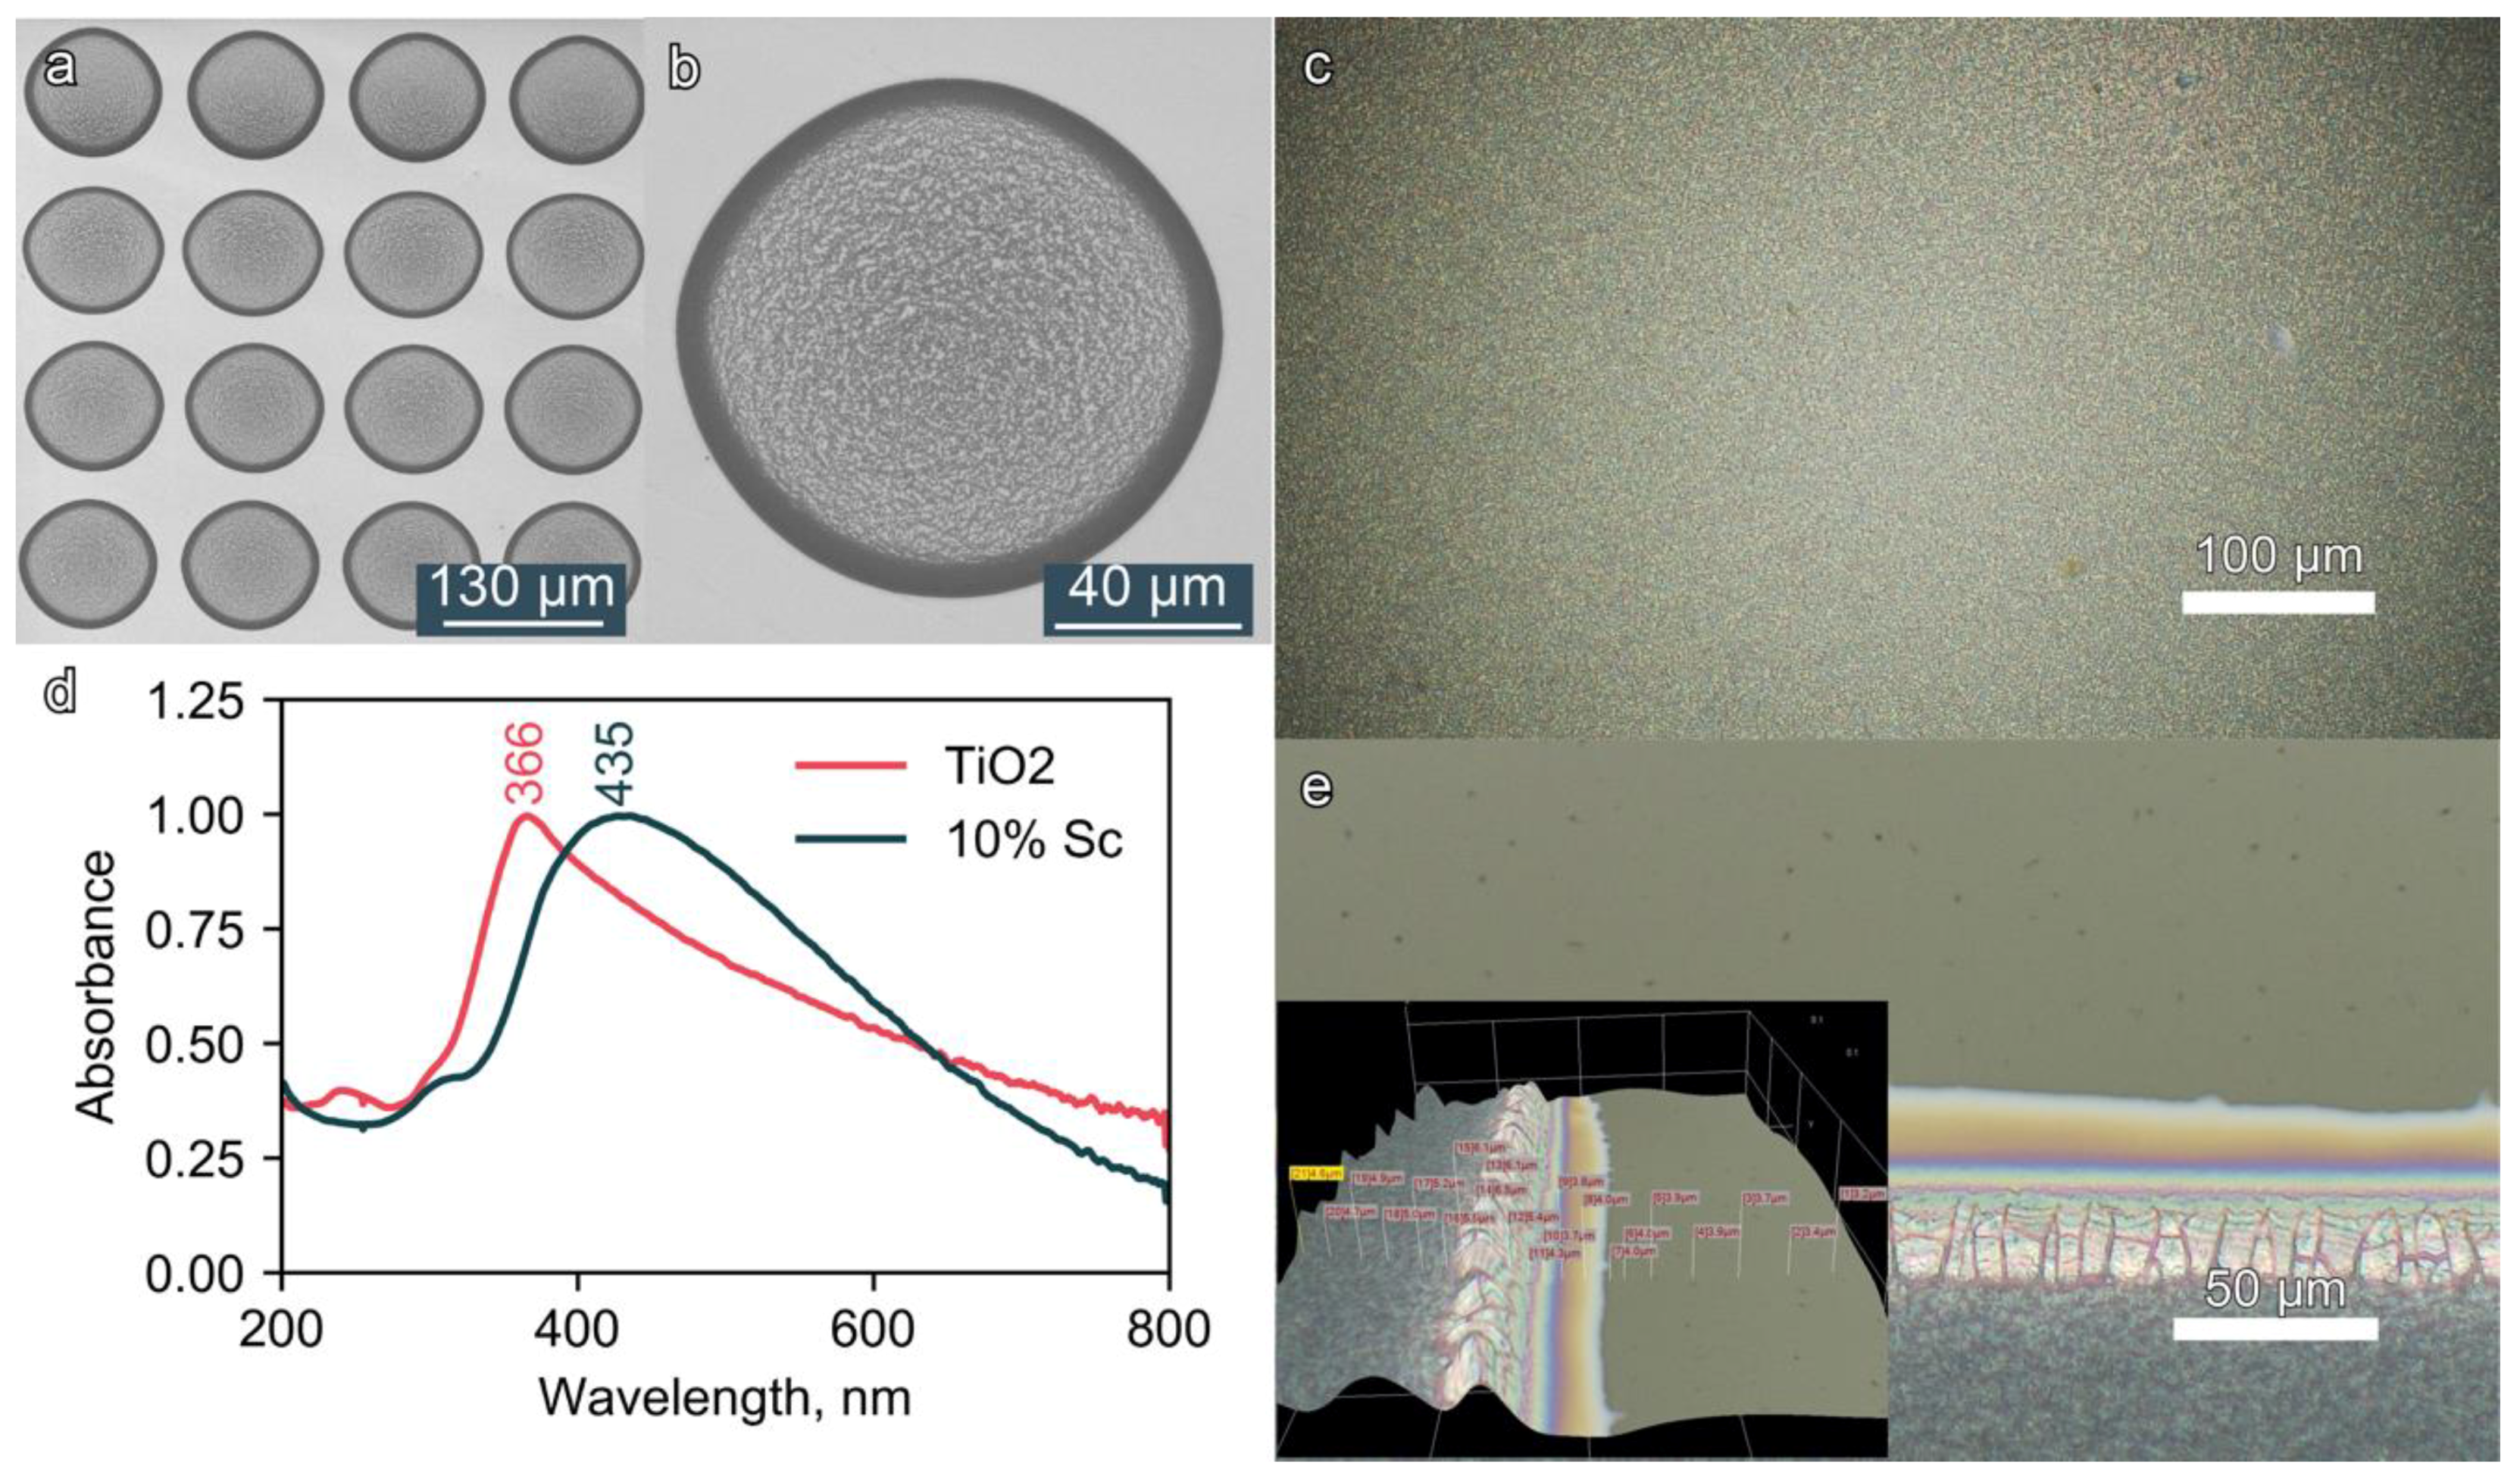
3.2. Inkjet Printing
4. Conclusions
Supplementary Materials
Author Contributions
Funding
Acknowledgments
Conflicts of Interest
Appendix A


| Sc-Doped System, % | Ef, eV/atom from Elemental Phase | Ef, eV/atom from Oxide Phase |
|---|---|---|
| 0 | − | |
| 5 | 2.00 | 1.47 |
| 10 | 1.96 | 1.42 |
| Sc-Doped Anatase, % | Lattice Parameters, Å | ||
|---|---|---|---|
| a | b | c | |
| 0% | 11.72 | 11.72 | 19.58 |
| 5% | 11.74 | 11.76 | 19.75 |
| 10% | 11.76 | 11.79 | 19.96 |
| Sample | Specific Surface Area, m2/g | Volume of Pores, cm3/g | Radius of Pores, Å |
|---|---|---|---|
| Pure TiO2 | 146.028 | 0.007 | 17.239 |
| 3% Sc-TiO2 | 159.981 | 0.006 | 17.244 |
| 5% Sc-TiO2 | 167.464 | 0.010 | 17.271 |
| 7% Sc-TiO2 | 172.451 | 0.008 | 17.305 |
| 10% Sc-TiO2 | 176.145 | 0.007 | 17.477 |


References
- Zhang, Q.; Uchaker, E.; Candelaria, S.L.; Cao, G. Nanomaterials for energy conversion and storage. Chem. Soc. Rev. 2013, 42, 3127. [Google Scholar] [CrossRef] [PubMed]
- Chen, G.; Seo, J.; Yang, C.; Prasad, P.N. Nanochemistry and nanomaterials for photovoltaics. Chem. Soc. Rev. 2013, 42, 8304. [Google Scholar] [CrossRef] [PubMed]
- Adly, N.; Feng, L.; Krause, K.J.; Mayer, D.; Yakushenko, A.; Offenhäusser, A.; Wolfrum, B. Flexible Microgap Electrodes by Direct Inkjet Printing for Biosensing Application. Adv. Biosys. 2017, 1, 1600016. [Google Scholar] [CrossRef]
- Bai, L.; Xie, Z.; Wang, W.; Yuan, C.; Zhao, Y.; Mu, Z.; Zhong, Q.; Gu, Z. Bio-Inspired Vapor-Responsive Colloidal Photonic Crystal Patterns by Inkjet Printing. ACS Nano 2014, 8, 11094–11100. [Google Scholar] [CrossRef] [PubMed]
- Chen, C.-T. Inkjet Printing of Microcomponents: Theory, Design, Characteristics and Applications. In Features of Liquid Crystal Display Materials and Processes; Kamanina, N., Ed.; InTech: Rijeka, Croatia, 2011. [Google Scholar]
- Singh, M.; Haverinen, H.M.; Dhagat, P.; Jabbour, G.E. Inkjet printing-process and its applications. Adv. Mater. 2010, 22, 673–685. [Google Scholar] [CrossRef] [PubMed]
- Hebner, T.R.; Wu, C.C.; Marcy, D.; Lu, M.H.; Sturm, J.C. Inkjet printing of doped polymers for organic light emitting devices. Appl. Phys. Lett. 1998, 72, 519–521. [Google Scholar] [CrossRef]
- De Gans, B.-J.; Duineveld, P.C.; Schubert, U.S. Inkjet printing of polymers: state of the art and future developments. Adv. Mater. 2004, 16, 203–213. [Google Scholar] [CrossRef]
- De Gans, B.-J.; Schubert, U.S. Inkjet printing of well-defined polymer dots and arrays. Langmuir 2004, 20, 7789–7793. [Google Scholar] [CrossRef]
- Yakovlev, A.V.; Milichko, V.A.; Vinogradov, V.V.; Vinogradov, A.V. Inkjet color printing by interference nanostructures. ACS Nano 2016, 10, 3078–3086. [Google Scholar] [CrossRef]
- Yakovlev, A.V.; Pidko, E.A.; Vinogradov, A.V. Inkjet printing of transparent sol-gel computer generated holograms. Opt. Mater. Express 2016, 6, 3794. [Google Scholar] [CrossRef]
- Keller, K.; Yakovlev, A.V.; Grachova, E.V.; Vinogradov, A.V. Inkjet printing of multicolor daylight visible opal holography. Adv. Funct. Mater. 2018, 28, 1706903. [Google Scholar] [CrossRef]
- Gao, M.; Li, L.; Song, Y. Inkjet printing wearable electronic devices. J. Mater. Chem. C 2017, 5, 2971–2993. [Google Scholar] [CrossRef]
- Cummins, G.; Desmulliez, M.P.Y. Inkjet printing of conductive materials: a review. Circuit World 2012, 38, 193–213. [Google Scholar] [CrossRef]
- Sum, T.C.; Mathews, N. Advancements in perovskite solar cells: photophysics behind the photovoltaics. Energy Environ. Sci. 2014, 7, 2518–2534. [Google Scholar] [CrossRef]
- Zhang, H.; Yang, Z.; Zhang, X.; Mao, N. Photocatalytic effects of wool fibers modified with solely TiO2 nanoparticles and N-doped TiO2 nanoparticles by using hydrothermal method. Chem. Eng. J. 2014, 254, 106–114. [Google Scholar] [CrossRef]
- Long, R.; English, N.J. Band gap engineering of (N,Ta)-codoped TiO2: A first-principles calculation. Chem. Phys. Letter. 2009, 478, 175–179. [Google Scholar] [CrossRef]
- Zhang, G.; Liu, G.; Wang, L.; Irvine, J.T.S. Inorganic perovskite photocatalysts for solar energy utilization. Chem. Soc. Rev. 2016, 45, 5951–5984. [Google Scholar] [CrossRef]
- Toroker, M.C.; Carter, E.A. Transition metal oxide alloys as potential solar energy conversion materials. J. Mat. Chem. A 2013, 1, 2474. [Google Scholar] [CrossRef]
- Wang, M.; Ioccozia, J.; Sun, L.; Lin, C.; Lin, Z. Inorganic-modified semiconductor TiO2 nanotube arrays for photocatalysis. Energy Environ. Sci. 2014, 7, 2182–2202. [Google Scholar] [CrossRef]
- Hanaor, D.A.H.; Assadi, M.H.N.; Li, S.; Yu, A.; Sorrell, C.C. Ab initio study of phase stability in doped TiO2. Comput. Mech. 2012, 50, 185–194. [Google Scholar] [CrossRef]
- Seebauer, E.G.; Kratzer, M.C. Charged Semiconductor Defects: Structure, Thermodynamics and Diffusion; Springer: London, UK, 2009. [Google Scholar]
- Pan, X.; Yang, M.-Q.; Fu, X.; Zhang, N.; Xu, Y.-J. Defective TiO2 with oxygen vacancies: synthesis, properties and photocatalytic applications. Nanoscale 2013, 5, 3601. [Google Scholar] [CrossRef] [PubMed]
- Liu, K.; Litke, A.; Su, Y.; van Campenhout, B.G.; Pidko, E.A.; Hensen, E.J.M. Photocatalytic decarboxylation of lactic acid by Pt/TiO2. Chem. Commun. 2016, 52, 11634–11637. [Google Scholar] [CrossRef] [PubMed]
- Kang, Y.S.; Zhang, D.R. Synthesis and characterization of titanium dioxide doped with Sc3+ ions. Int. J. Nanosci. 2006, 5, 351–357. [Google Scholar] [CrossRef]
- Zhang, D.R.; Kang, Y.S. Synthesis and Characterization of Nanocrystalline TiO2 Doped with 2 at.% Sc3+ and V5+ Ions. Solid State Phenom. 2007, 121–123, 41–44. [Google Scholar] [CrossRef]
- Pan, J.W.; Li, C.; Zhao, Y.F.; Liu, R.X.; Gong, Y.Y.; Niu, L.Y.; Liu, X.J.; Chi, B.Q. Electronic properties of TiO2 doped with Sc, Y, La, Zr, Hf, V, Nb and Ta. Chem. Phys. Lett. 2015, 628, 43–48. [Google Scholar] [CrossRef]
- Cavalheiro, A.A.; Bruno, J.C.; Saeki, M.J.; Valente, J.P.S.; Florentino, A.O. Effect of scandium on the structural and photocatalytic properties of titanium dioxide thin films. J. Mater. Sci. 2008, 43, 602–608. [Google Scholar] [CrossRef]
- Tao, Z.; Le Borgne, B.; Mohammed-Brahim, T.; Jacques, E.; Harnois, M. Spreading and drying impact on printed pattern accuracy due to phase separation of a colloidal ink. Colloid Polym. Sci. 2018, 296, 1749–1758. [Google Scholar] [CrossRef]
- Klestova, A.; Cheplagin, N.; Keller, K.; Slabov, V.; Zaretskaya, G.; Vinogradov, A.V. Inkjet printing of optical waveguides for single-mode operation. Adv. Opt. Mat. 2019, 7, 1801113. [Google Scholar] [CrossRef]
- Slabov, V.; Vinogradov, A.V.; Yakovlev, A.V. Inkjet printing of specular holograms based on a coffee-ring effect concave structure. J. Mat. Chem. C 2018, 6, 5269–5277. [Google Scholar] [CrossRef]
- Yakovlev, A.V.; Milichko, V.A.; Pidko, E.A.; Vinogradov, V.V.; Vinogradov, A.V. Inkjet printing of TiO2/AlOOH heterostructures for the formation of interference color images with high optical visibility. Sci. Rep. 2016, 6, 37090. [Google Scholar] [CrossRef]
- Safaryan, S.M.; Yakovlev, A.V.; Vinogradov, A.V.; Vinogradov, V.V. Inkjet printing of the chromogen free oxidase based optical biosensors. Sensor. Actuat. B Chem. 2017, 251, 746–752. [Google Scholar] [CrossRef]
- Banisharif, A.; Khodadadi, A.A.; Mortazavi, Y.; Anaraki Firooz, A.; Beheshtian, J.; Agah, S.; Menbari, S. Highly active Fe2O3-doped TiO2 photocatalyst for degradation of trichloroethylene in air under UV and visible light irradiation: Experimental and computational studies. Appl. Catal. B Environ. 2015, 165, 209–221. [Google Scholar] [CrossRef]
- Momma, K.; Izumi, F. VESTA 3 for three-dimensional visualization of crystal, volumetric and morphology data. J. Appl. Crystallogr. 2011, 44, 1272–1276. [Google Scholar] [CrossRef]
- Tauc, J.; Grigorovici, R.; Vancu, A. Optical properties and electronic structure of amorphous germanium. Phys. Status Solidi 1966, 15, 627–637. [Google Scholar] [CrossRef]
- Davis, E.A.; Mott, N.F. Conduction in non-crystalline systems V. Conductivity, optical absorption and photoconductivity in amorphous semiconductors. Phil. Mag. 1970, 22, 903–922. [Google Scholar] [CrossRef]
- Dette, C.; Pérez-Osorio, M.A.; Kley, C.S.; Punke, P.; Patrick, C.E.; Jacobson, P.; Giustino, F.; Jung, S.J.; Kern, K. TiO2 Anatase with a Bandgap in the Visible Region. Nano Lett. 2014, 14, 6533–6538. [Google Scholar] [CrossRef] [PubMed]
- Kresse, G.; Furthmüller, J. Efficient iterative schemes for ab initio total-energy calculations using a plane-wave basis set. Phys. Rev. B 1996, 54, 11169–11186. [Google Scholar] [CrossRef]
- Perdew, J.P.; Burke, K.; Ernzerhof, M. Generalized gradient approximation made simple. Phys. Rev. Lett. 1996, 77, 3865. [Google Scholar] [CrossRef]
- Dudarev, S.L.; Botton, G.A.; Savrasov, S.Y.; Humphreys, C.J.; Sutton, A.P. Electron-energy-loss spectra and the structural stability of nickel oxide: An LSDA+U study. Phys. Rev. B 1998, 57, 1505–1509. [Google Scholar] [CrossRef]
- Zhu, H.X.; Zhou, P.X.; Li, X.; Liu, J.-M. Electronic structures and optical properties of rutile TiO2 with different point defects from DFT+U calculations. Phys. Lett. A 2014, 378, 2719–2724. [Google Scholar] [CrossRef]
- Kresse, G.; Joubert, D. From ultrasoft pseudopotentials to the projector augmented-wave method. Phys. Rev. B 1999, 59, 1758–1775. [Google Scholar] [CrossRef]
- Blöchl, P.E. Projector augmented-wave method. Phys. Rev. B 1994, 50, 17953–17979. [Google Scholar] [CrossRef]
- Nowotny, M.K.; Sheppard, L.R.; Bak, T.; Nowotny, J. Defect Chemistry of Titanium Dioxide. Application of Defect Engineering in Processing of TiO2-Based Photocatalysts. J. Phys. Chem. C 2008, 112, 5275–5300. [Google Scholar] [CrossRef]
- Wendt, S.; Schaub, R.; Matthiesen, J.; Vestergaard, E.K.; Wahlström, E.; Rasmussen, M.D.; Thostrup, P.; Molina, L.M.; Lægsgaard, E.; Stensgaard, I.; et al. Oxygen vacancies on TiO2(110) and their interaction with H2O and O2: A combined high-resolution STM and DFT study. Surf. Sci. 2005, 598, 226–245. [Google Scholar] [CrossRef]
- Roose, B.; Pathak, S.; Steiner, U. Doping of TiO2 for sensitized solar cells. Chem. Soc. Rev. 2015, 44, 8326–8349. [Google Scholar] [CrossRef] [PubMed]


| Sc Calculated, wt.% | Sc Experimental, wt.% |
|---|---|
| 3 | 2.89 ± 0.15 |
| 5 | 5.34 ± 0.18 |
| 7 | 6.51 ± 0.13 |
| 10 | 9.69 ± 0.09 |
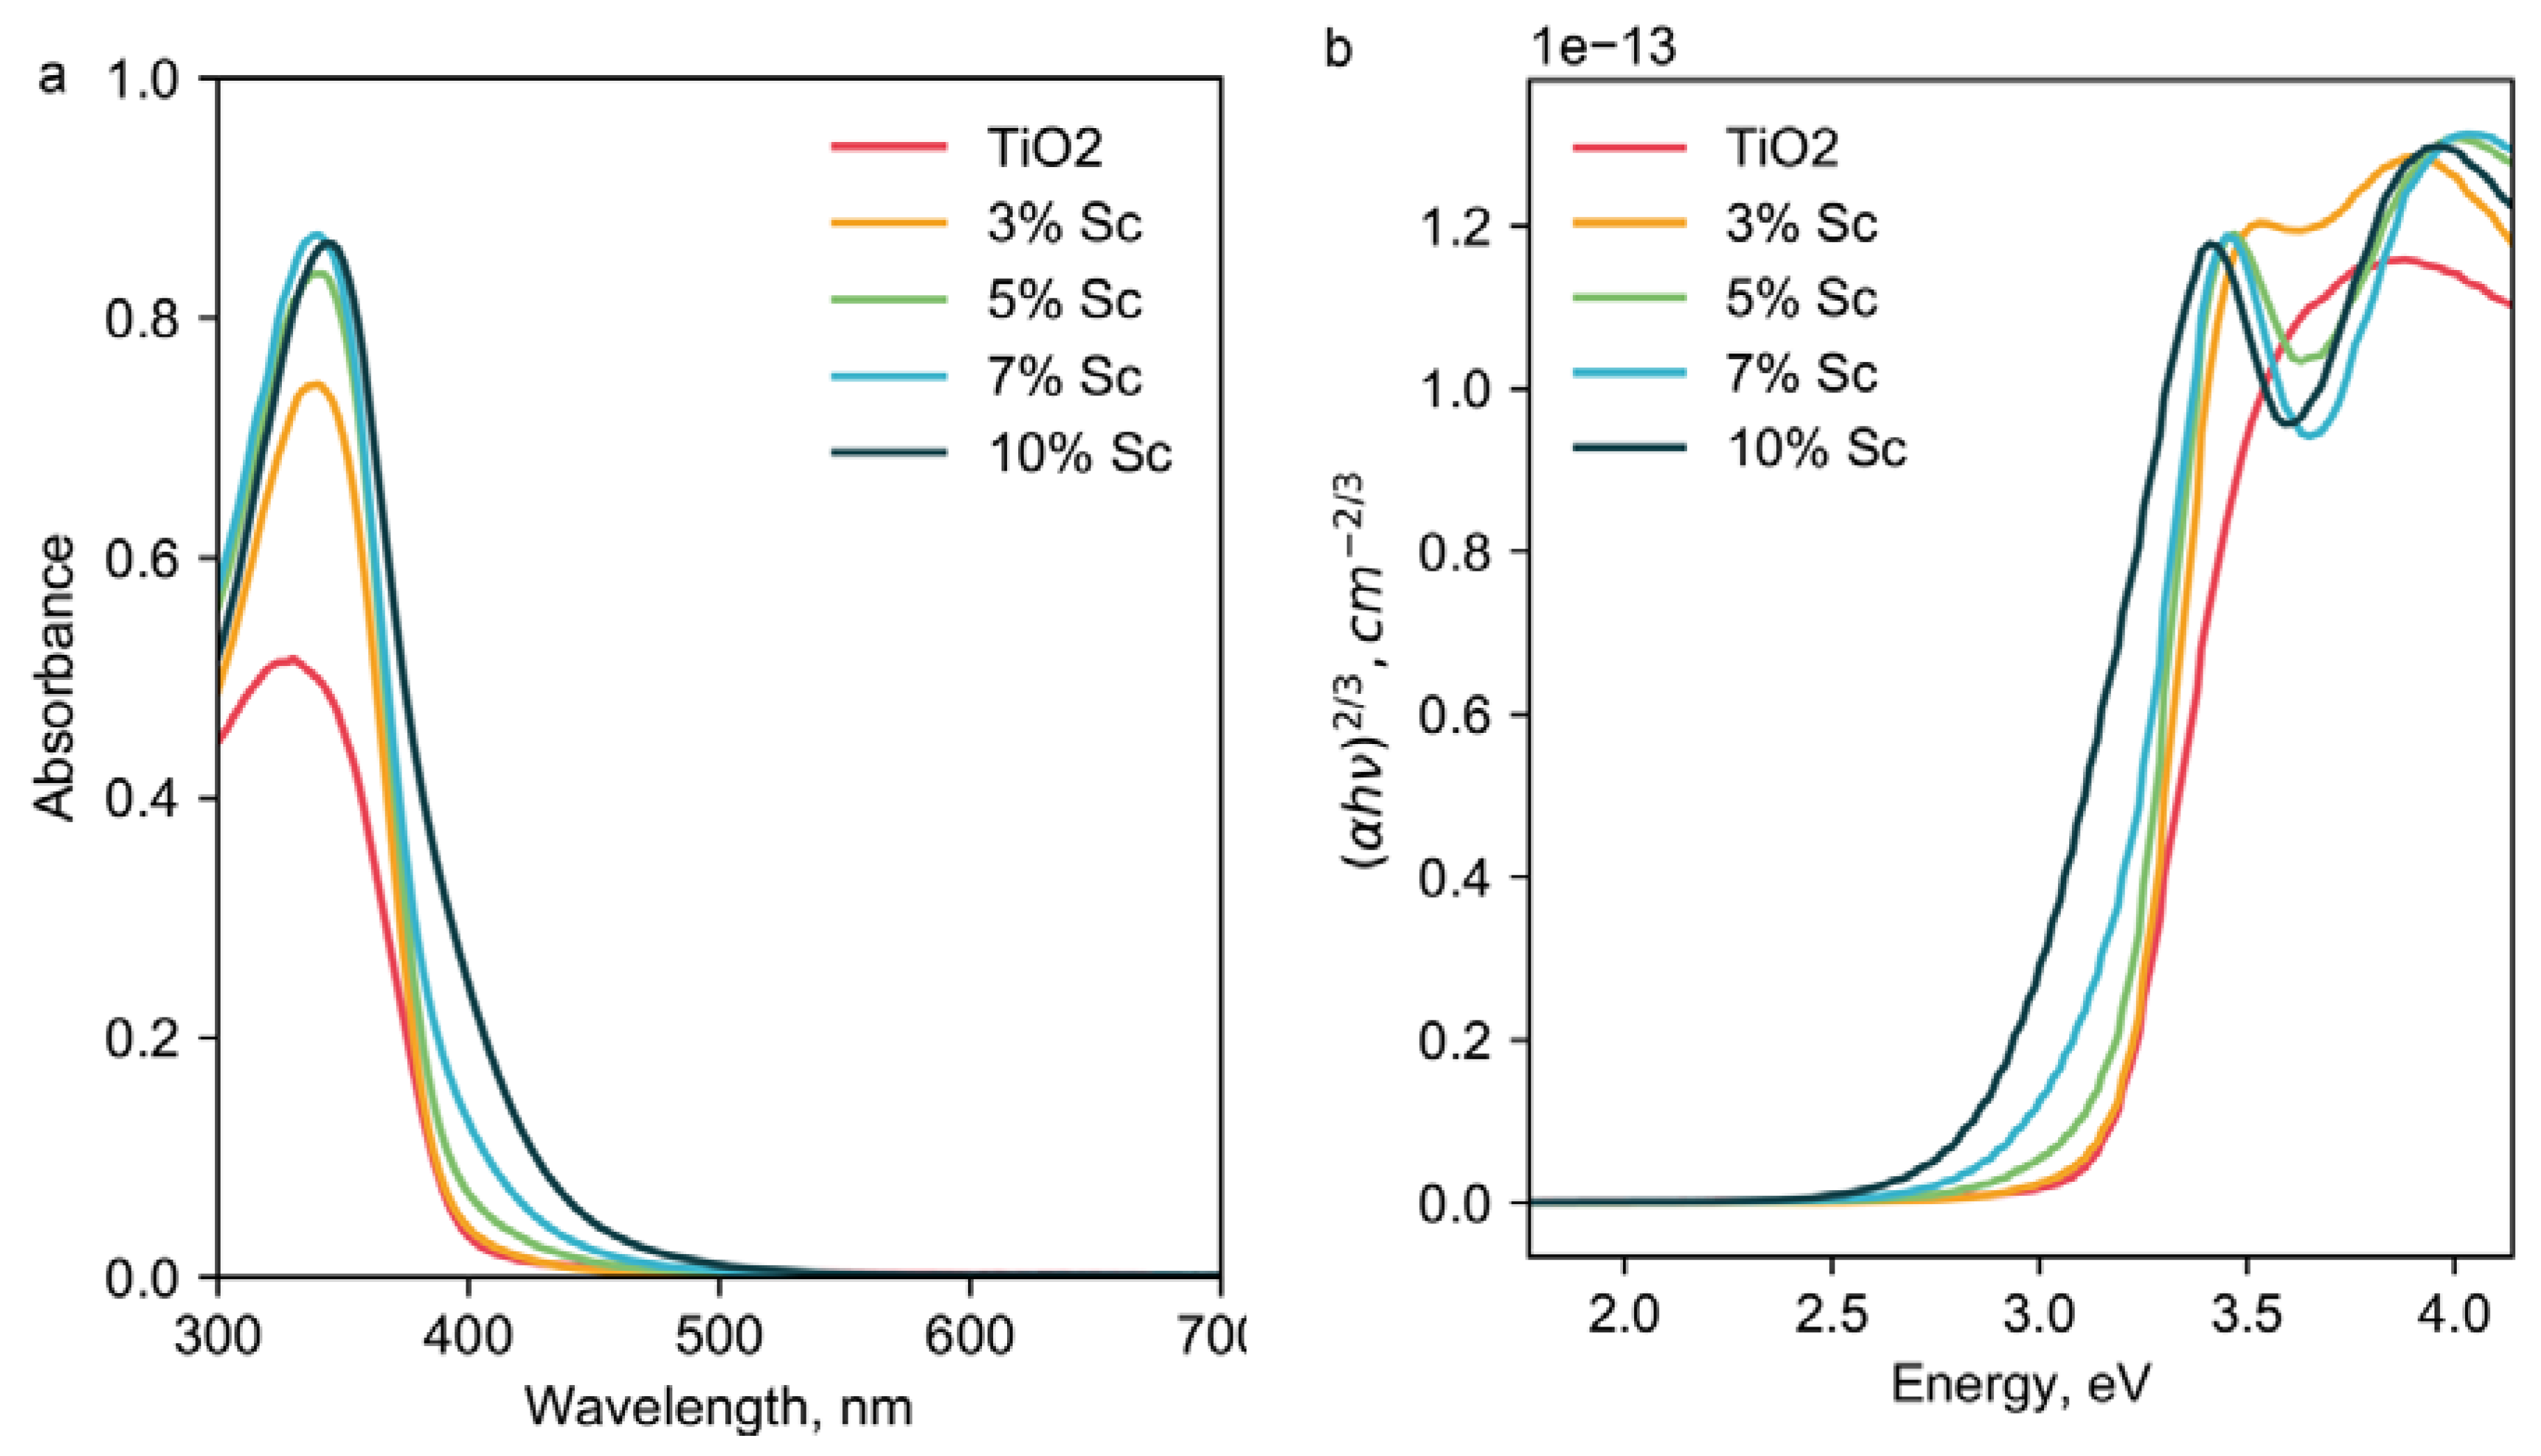
| Sample | Eg, eV | Wavelength, nm |
|---|---|---|
| TiO2 | 3.2 | 387.5 |
| TiO2 + 3% Sc | 3.18 | 389.9 |
| TiO2 + 5% Sc | 3.14 | 394.9 |
| TiO2 + 7% Sc | 3.11 | 398.7 |
| TiO2 + 10% Sc | 2.9 | 427.6 |
| Surface Tension, mN/m | Viscosity, cPs | Particle Size, nm | Z-Number |
|---|---|---|---|
| 28 | 6.7 | 8.4 | 4.2 |
© 2019 by the authors. Licensee MDPI, Basel, Switzerland. This article is an open access article distributed under the terms and conditions of the Creative Commons Attribution (CC BY) license (http://creativecommons.org/licenses/by/4.0/).
Share and Cite
Keller, K.; Khramenkova, E.V.; Slabov, V.; Musin, A.; Kalashnikov, A.; Vinogradov, A.V.; Pidko, E.A. Inkjet Printing of Sc-Doped TiO2 with Enhanced Photoactivity. Coatings 2019, 9, 78. https://doi.org/10.3390/coatings9020078
Keller K, Khramenkova EV, Slabov V, Musin A, Kalashnikov A, Vinogradov AV, Pidko EA. Inkjet Printing of Sc-Doped TiO2 with Enhanced Photoactivity. Coatings. 2019; 9(2):78. https://doi.org/10.3390/coatings9020078
Chicago/Turabian StyleKeller, Kirill, Elena V. Khramenkova, Vladislav Slabov, Albina Musin, Alexander Kalashnikov, Alexandr V. Vinogradov, and Evgeny A. Pidko. 2019. "Inkjet Printing of Sc-Doped TiO2 with Enhanced Photoactivity" Coatings 9, no. 2: 78. https://doi.org/10.3390/coatings9020078
APA StyleKeller, K., Khramenkova, E. V., Slabov, V., Musin, A., Kalashnikov, A., Vinogradov, A. V., & Pidko, E. A. (2019). Inkjet Printing of Sc-Doped TiO2 with Enhanced Photoactivity. Coatings, 9(2), 78. https://doi.org/10.3390/coatings9020078