Effect of Trajectory Curvature on the Microstructure and Properties of Surfacing Wall Formed with the Process of Wire Arc Additive Manufacturing

Abstract
1. Introduction
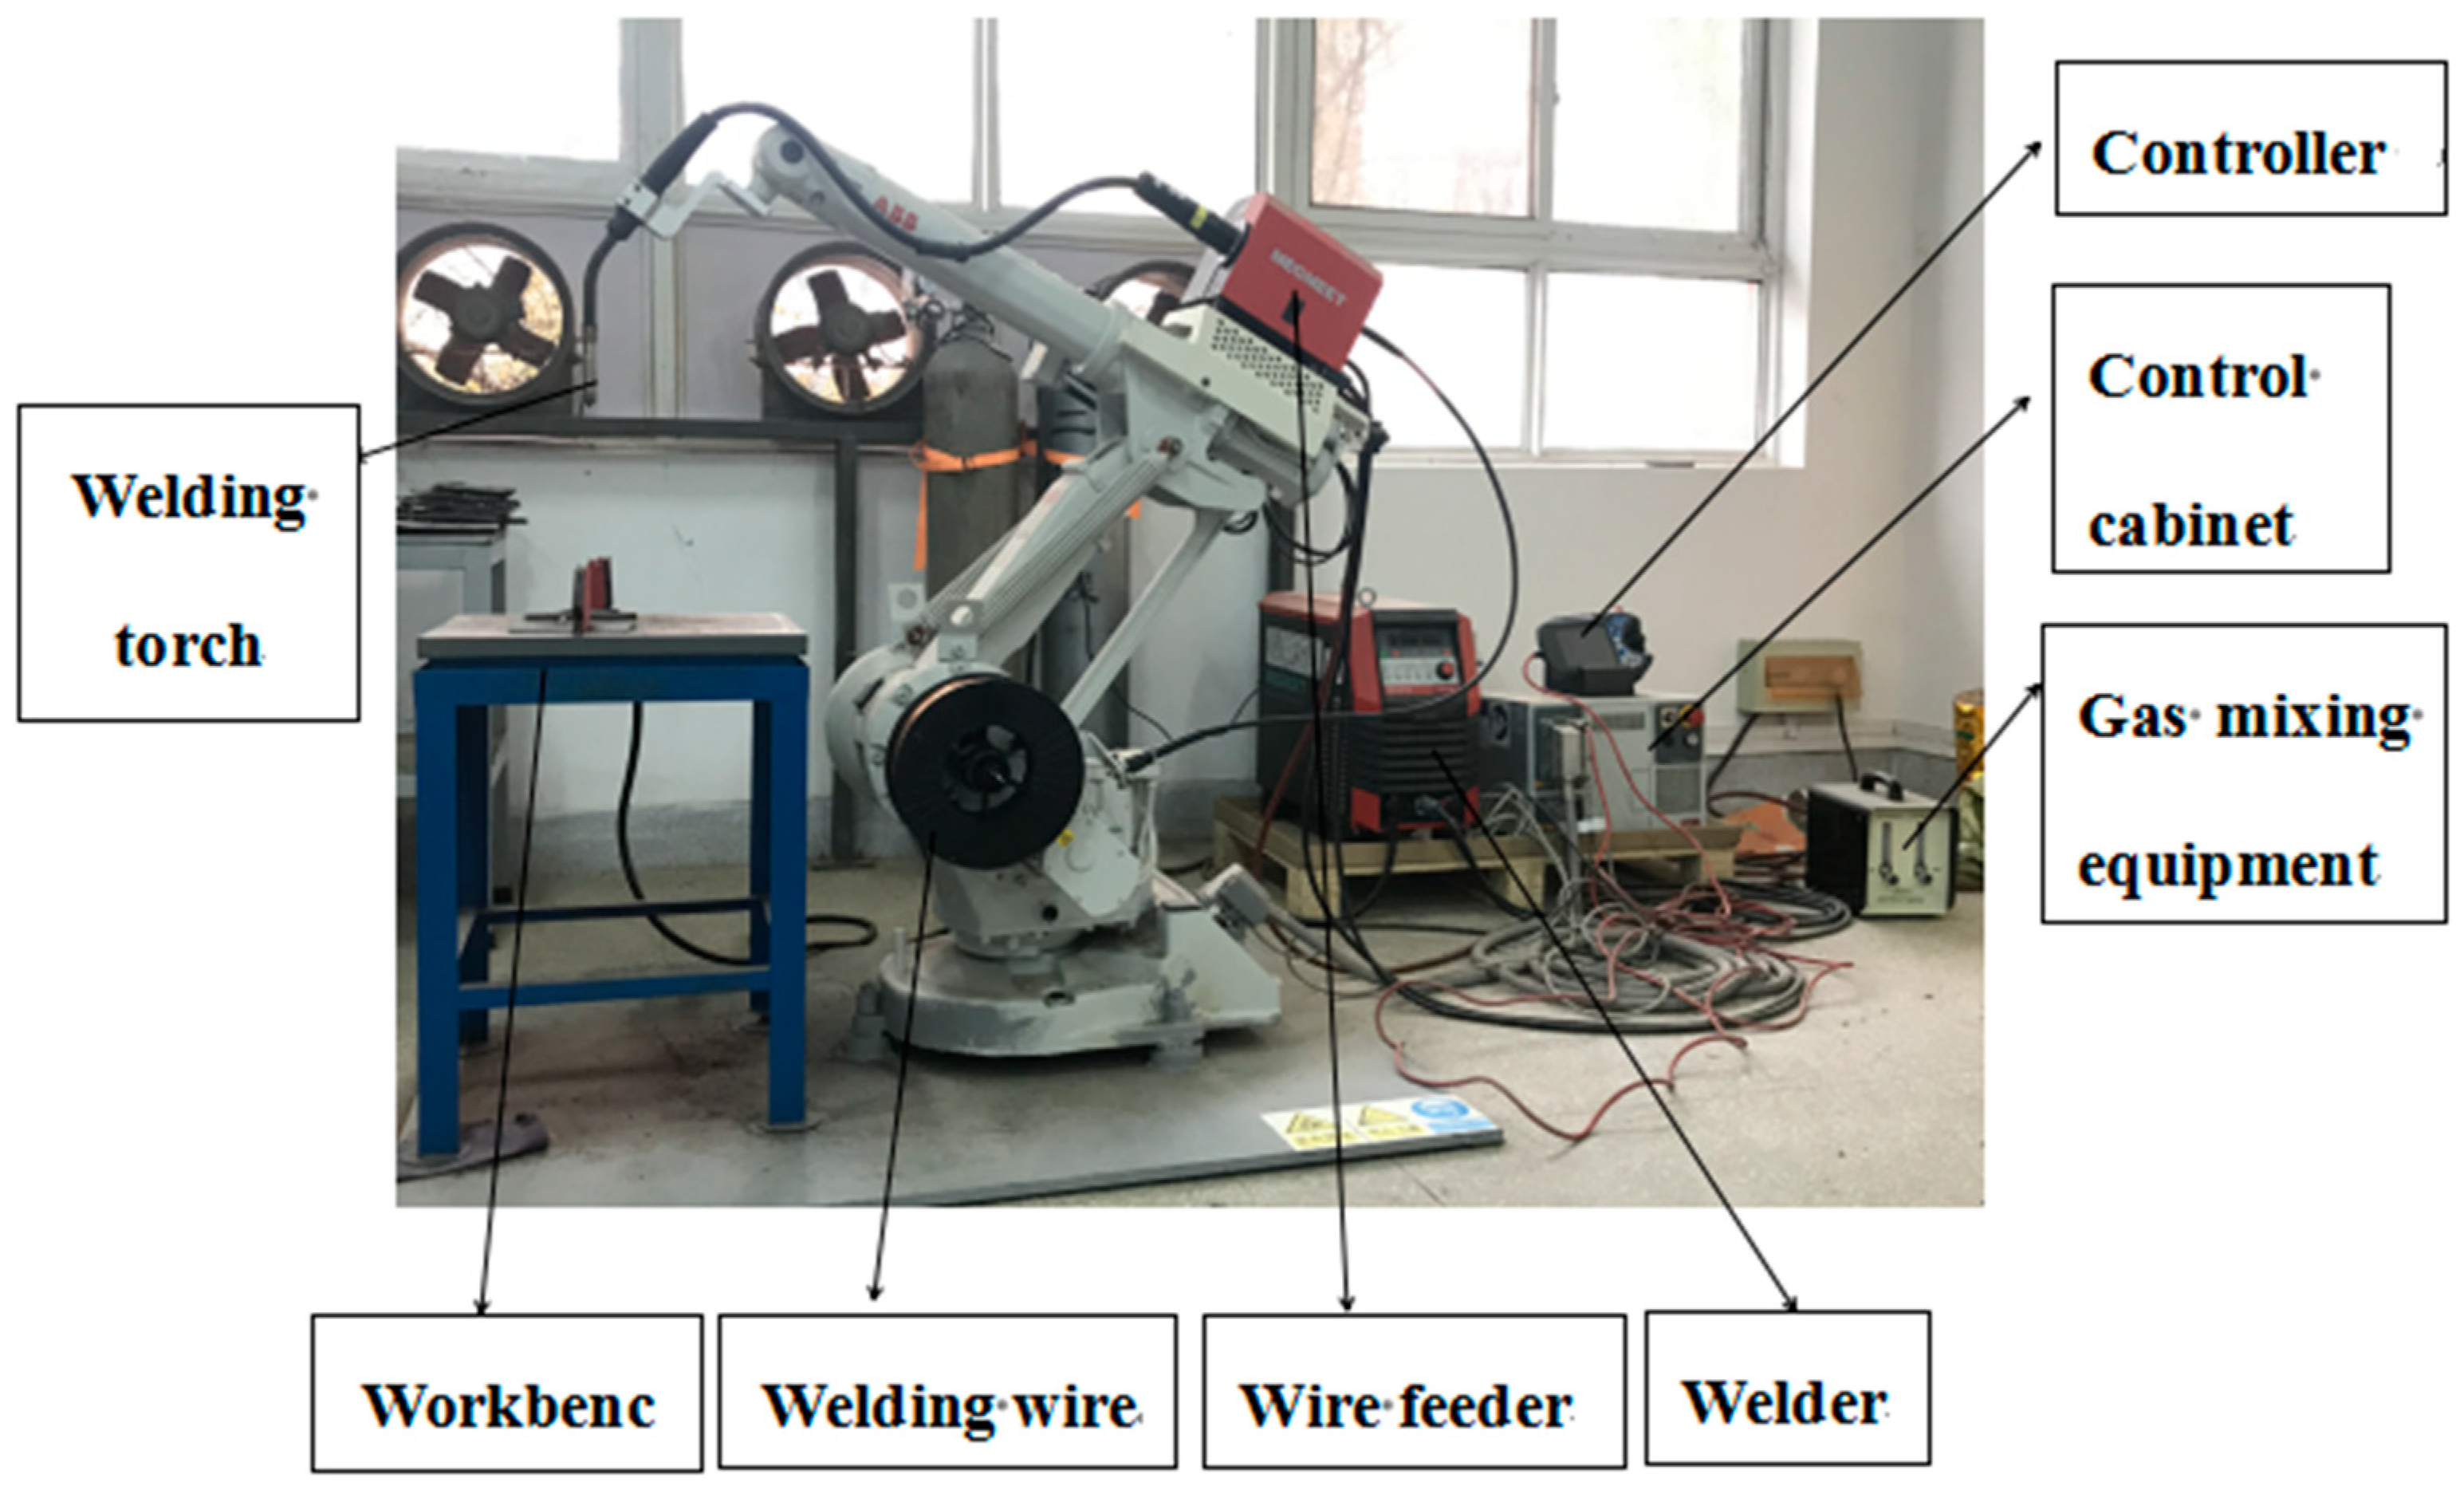
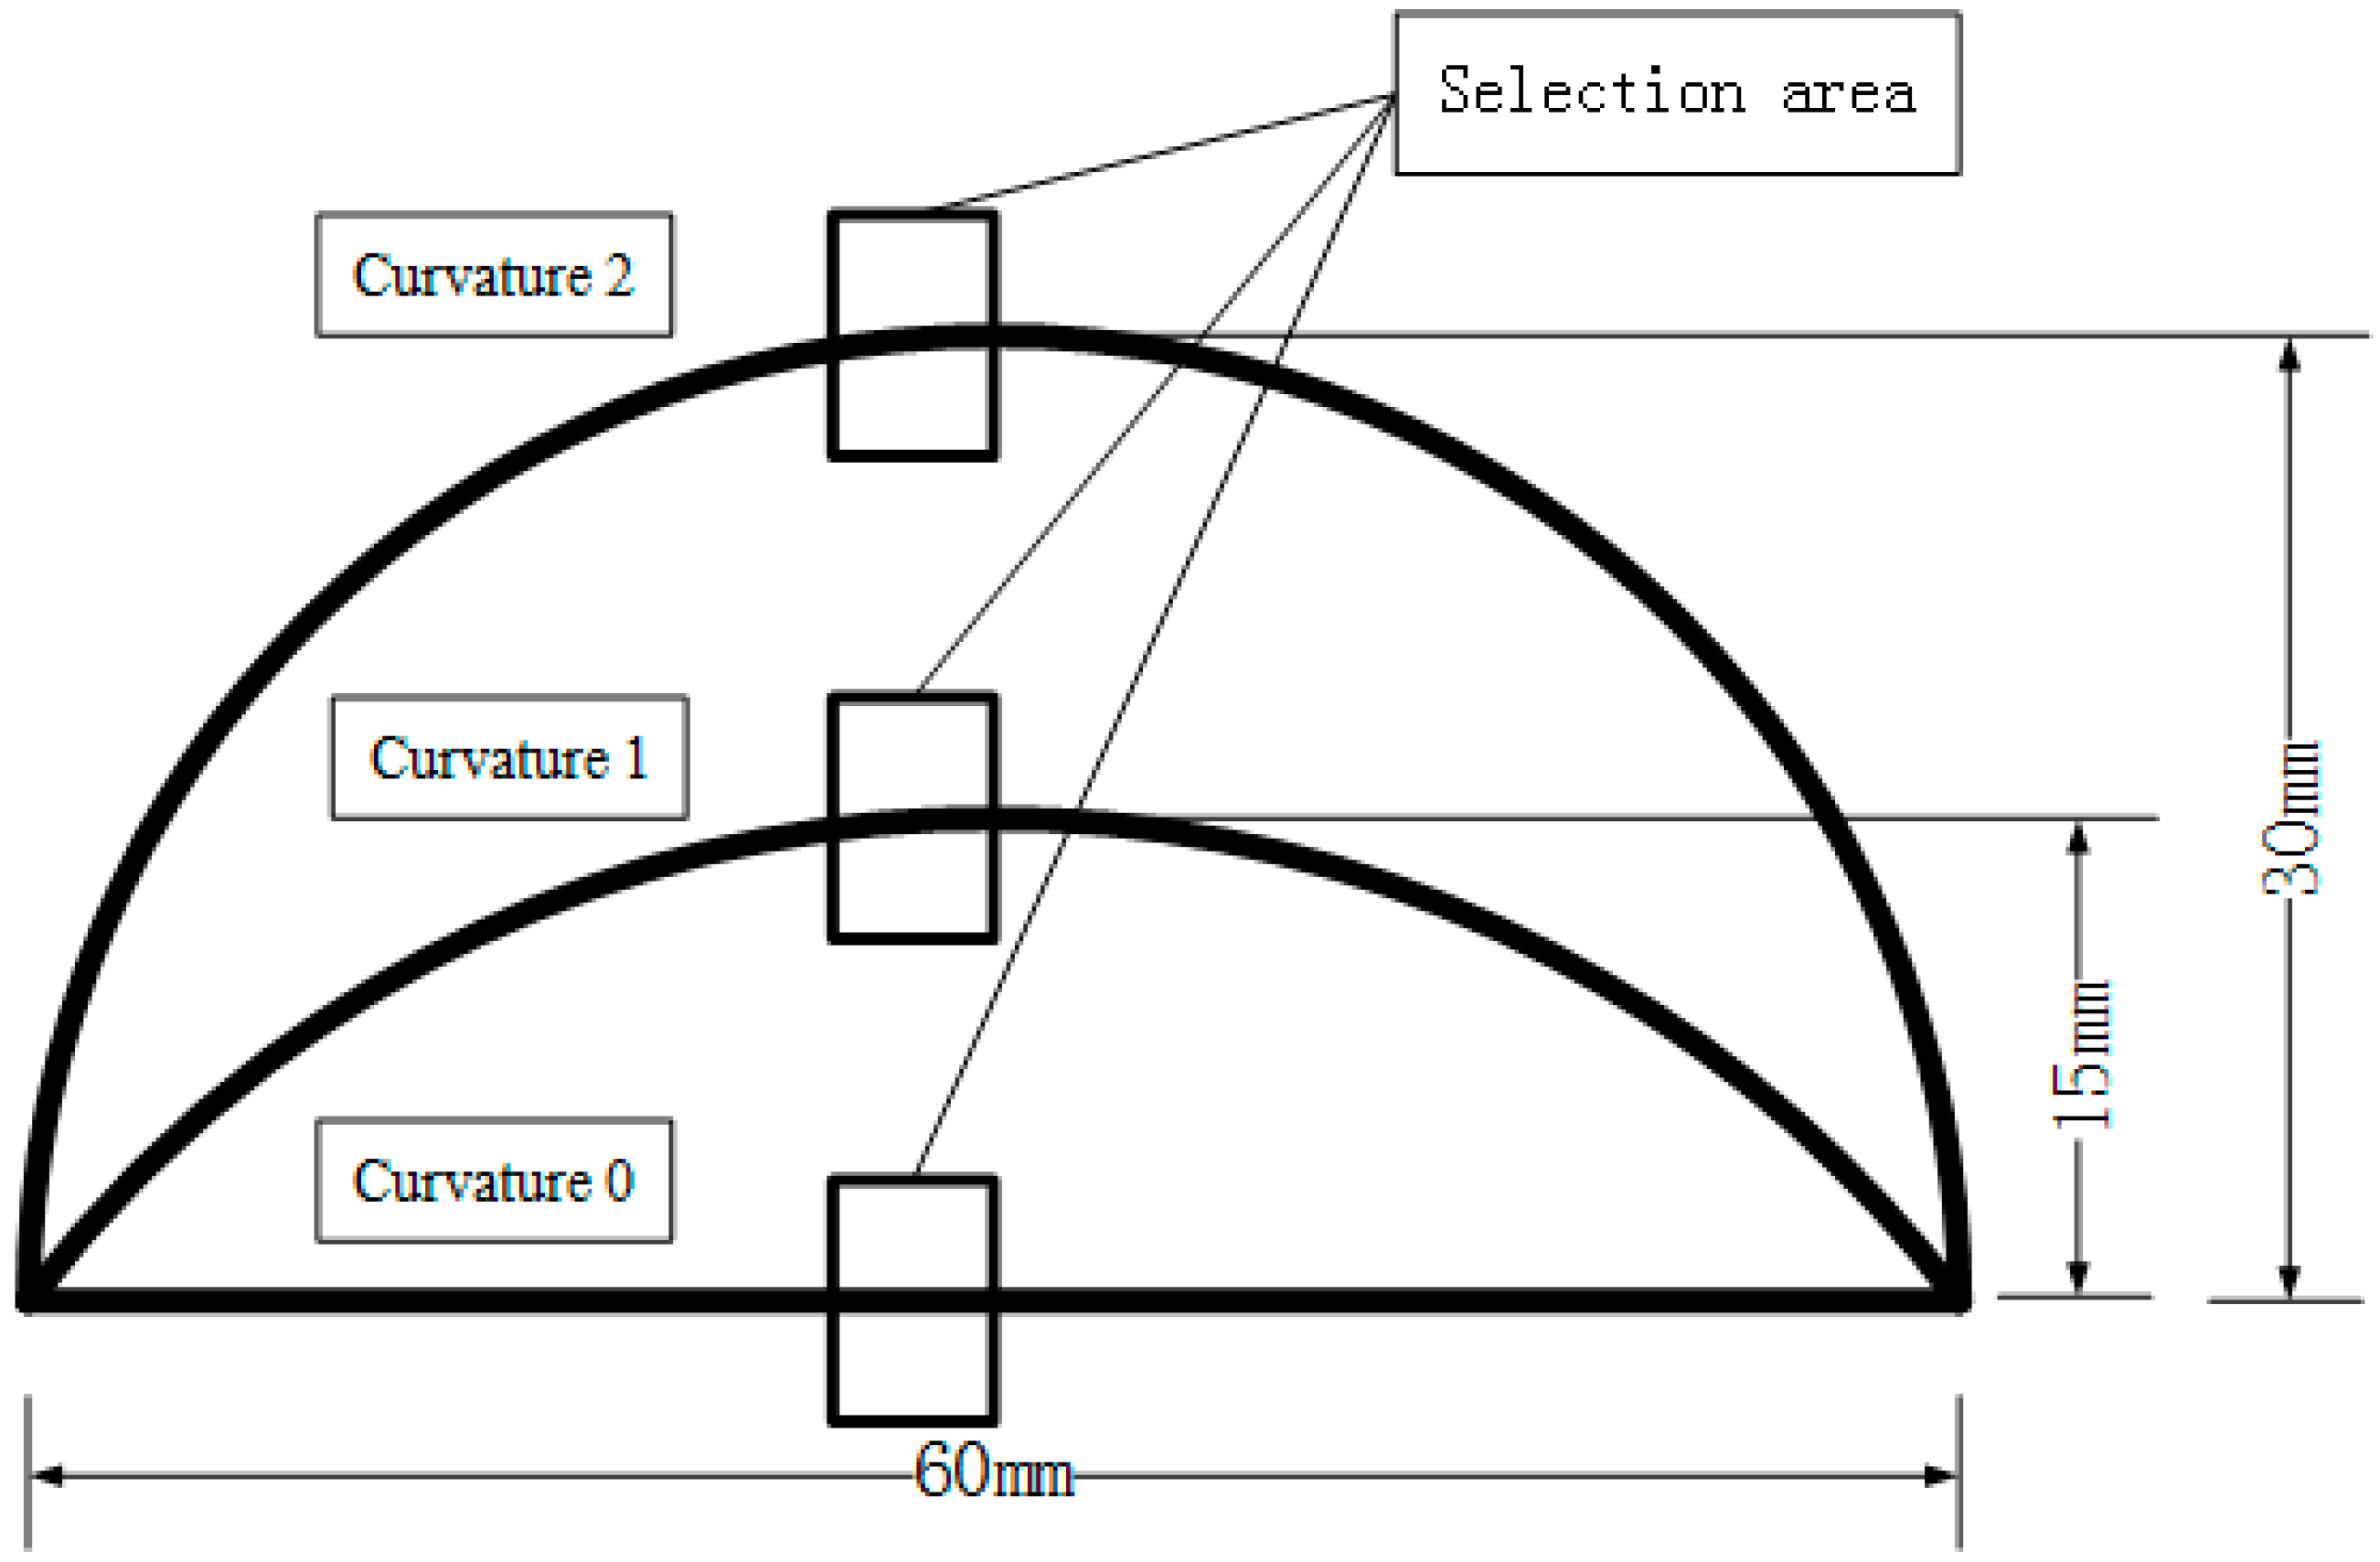
2. Experimental
3. Results and Discussion
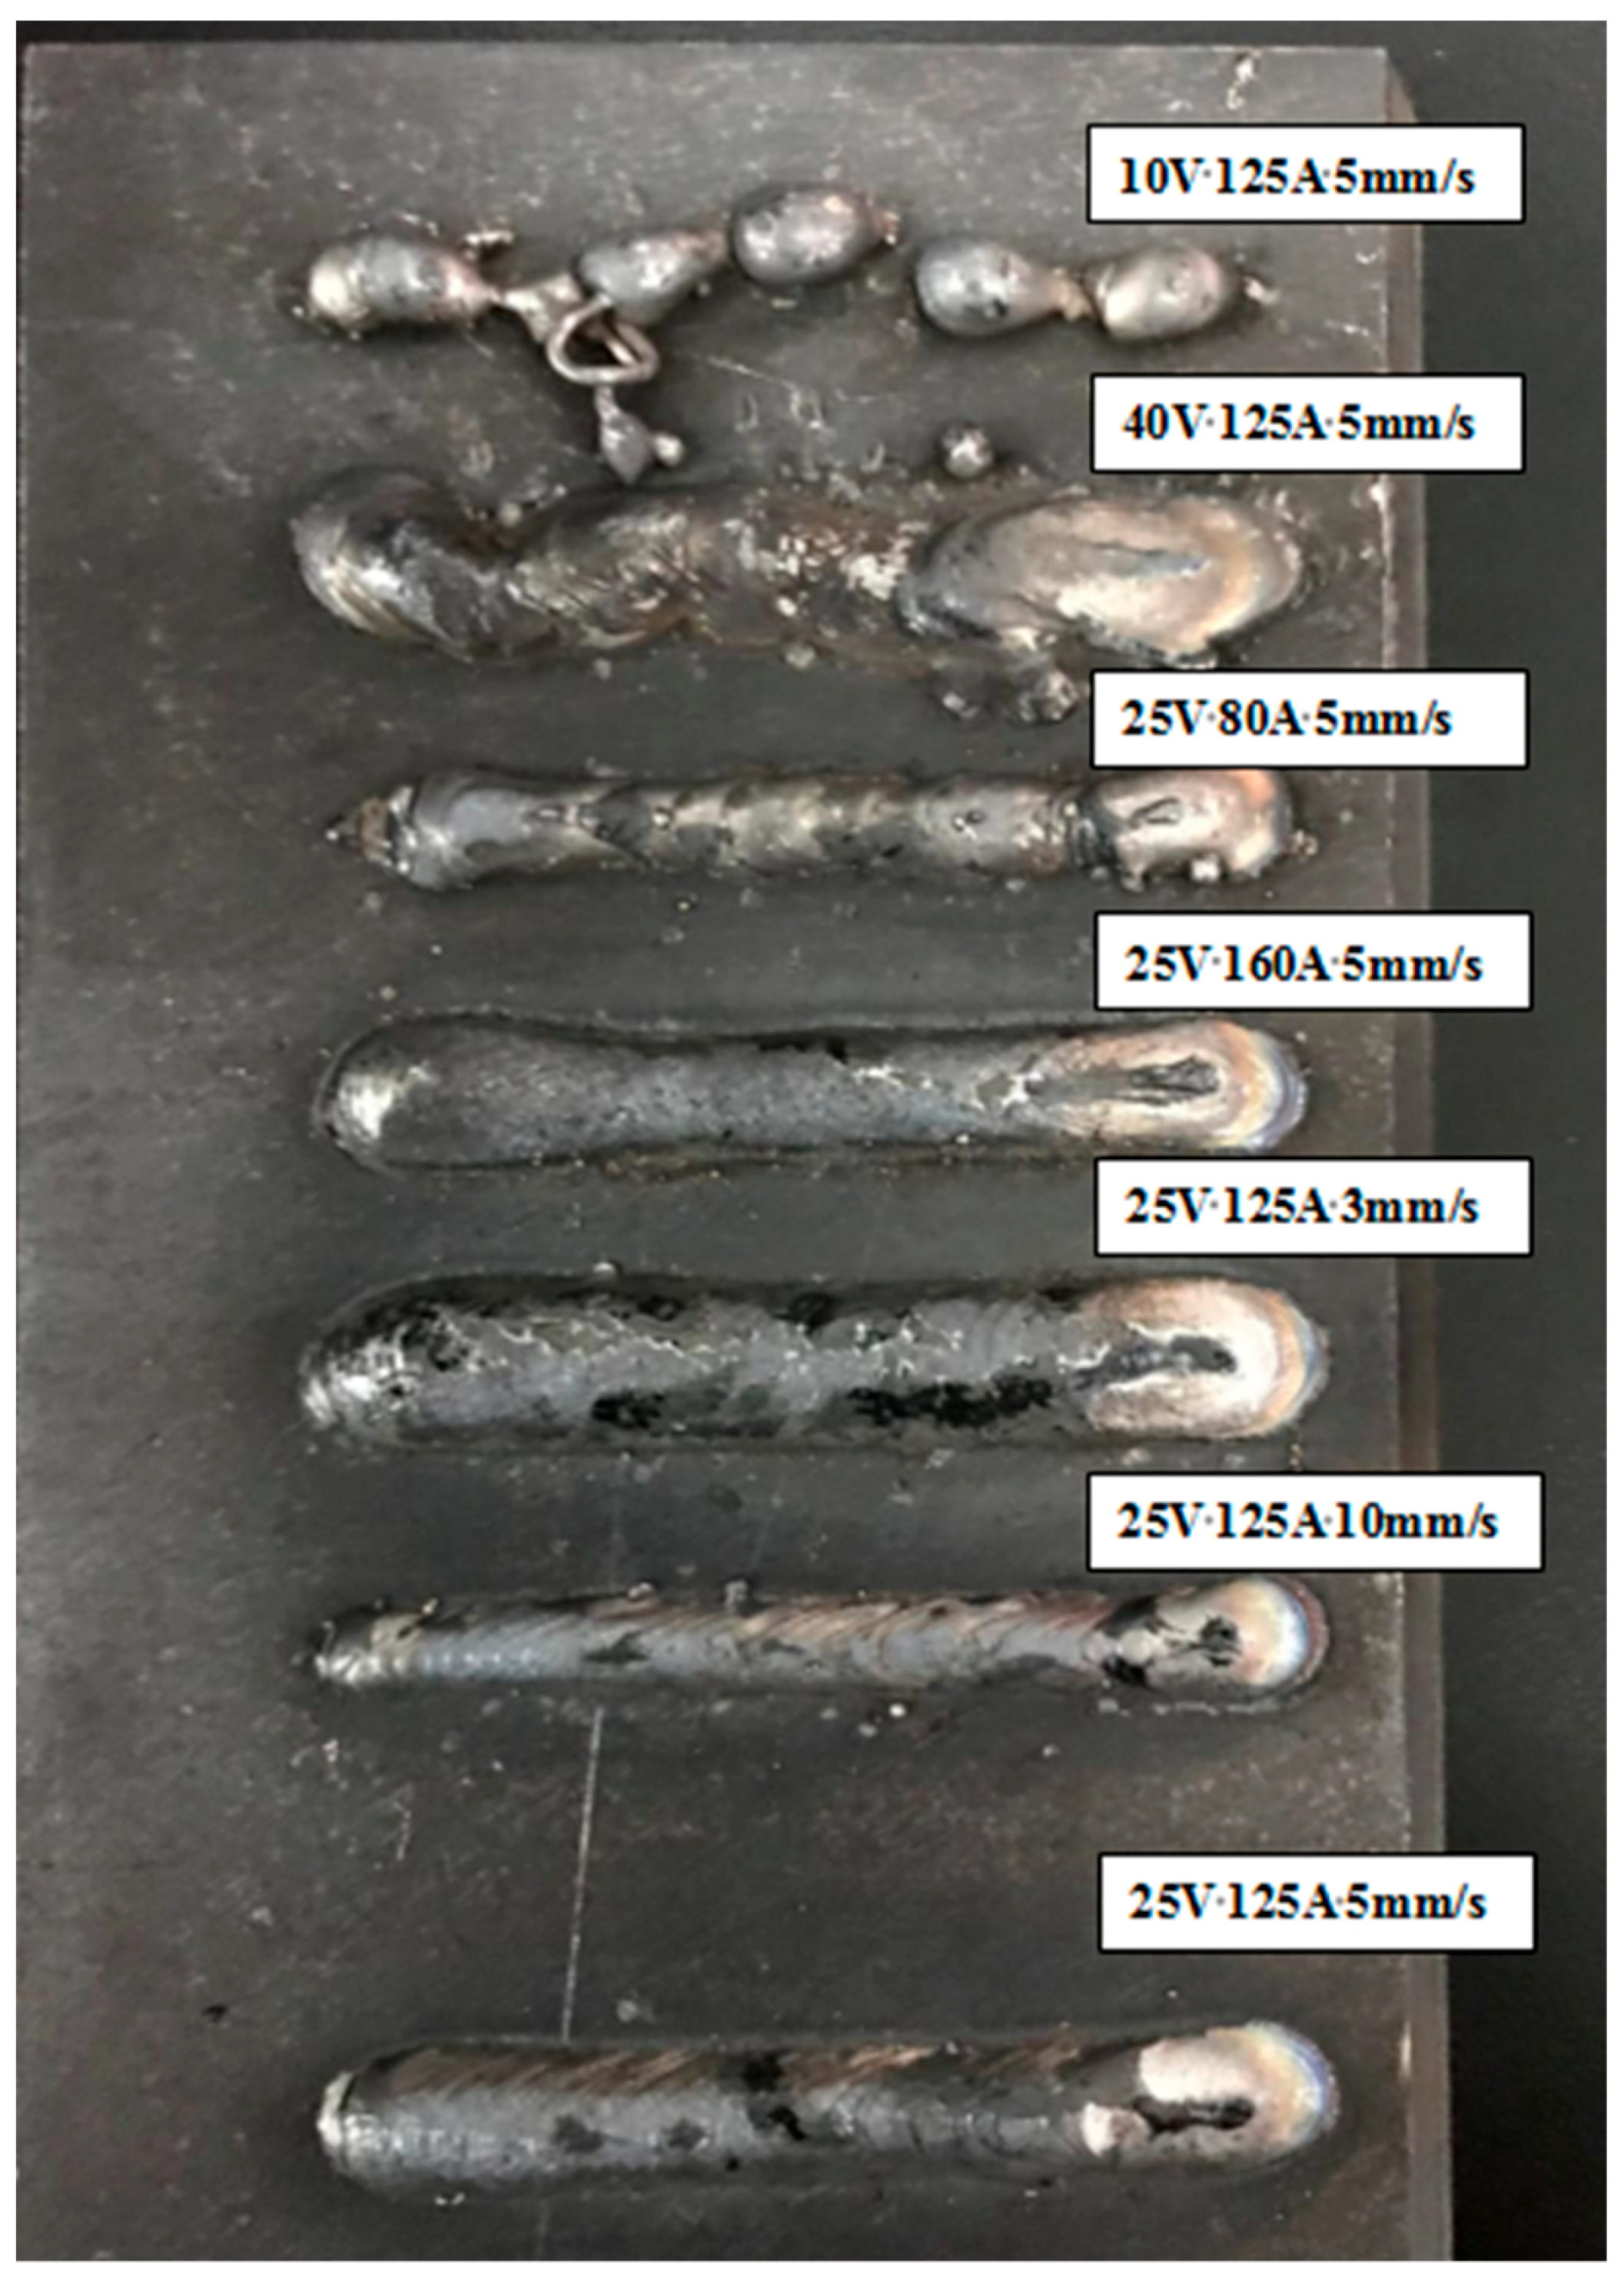
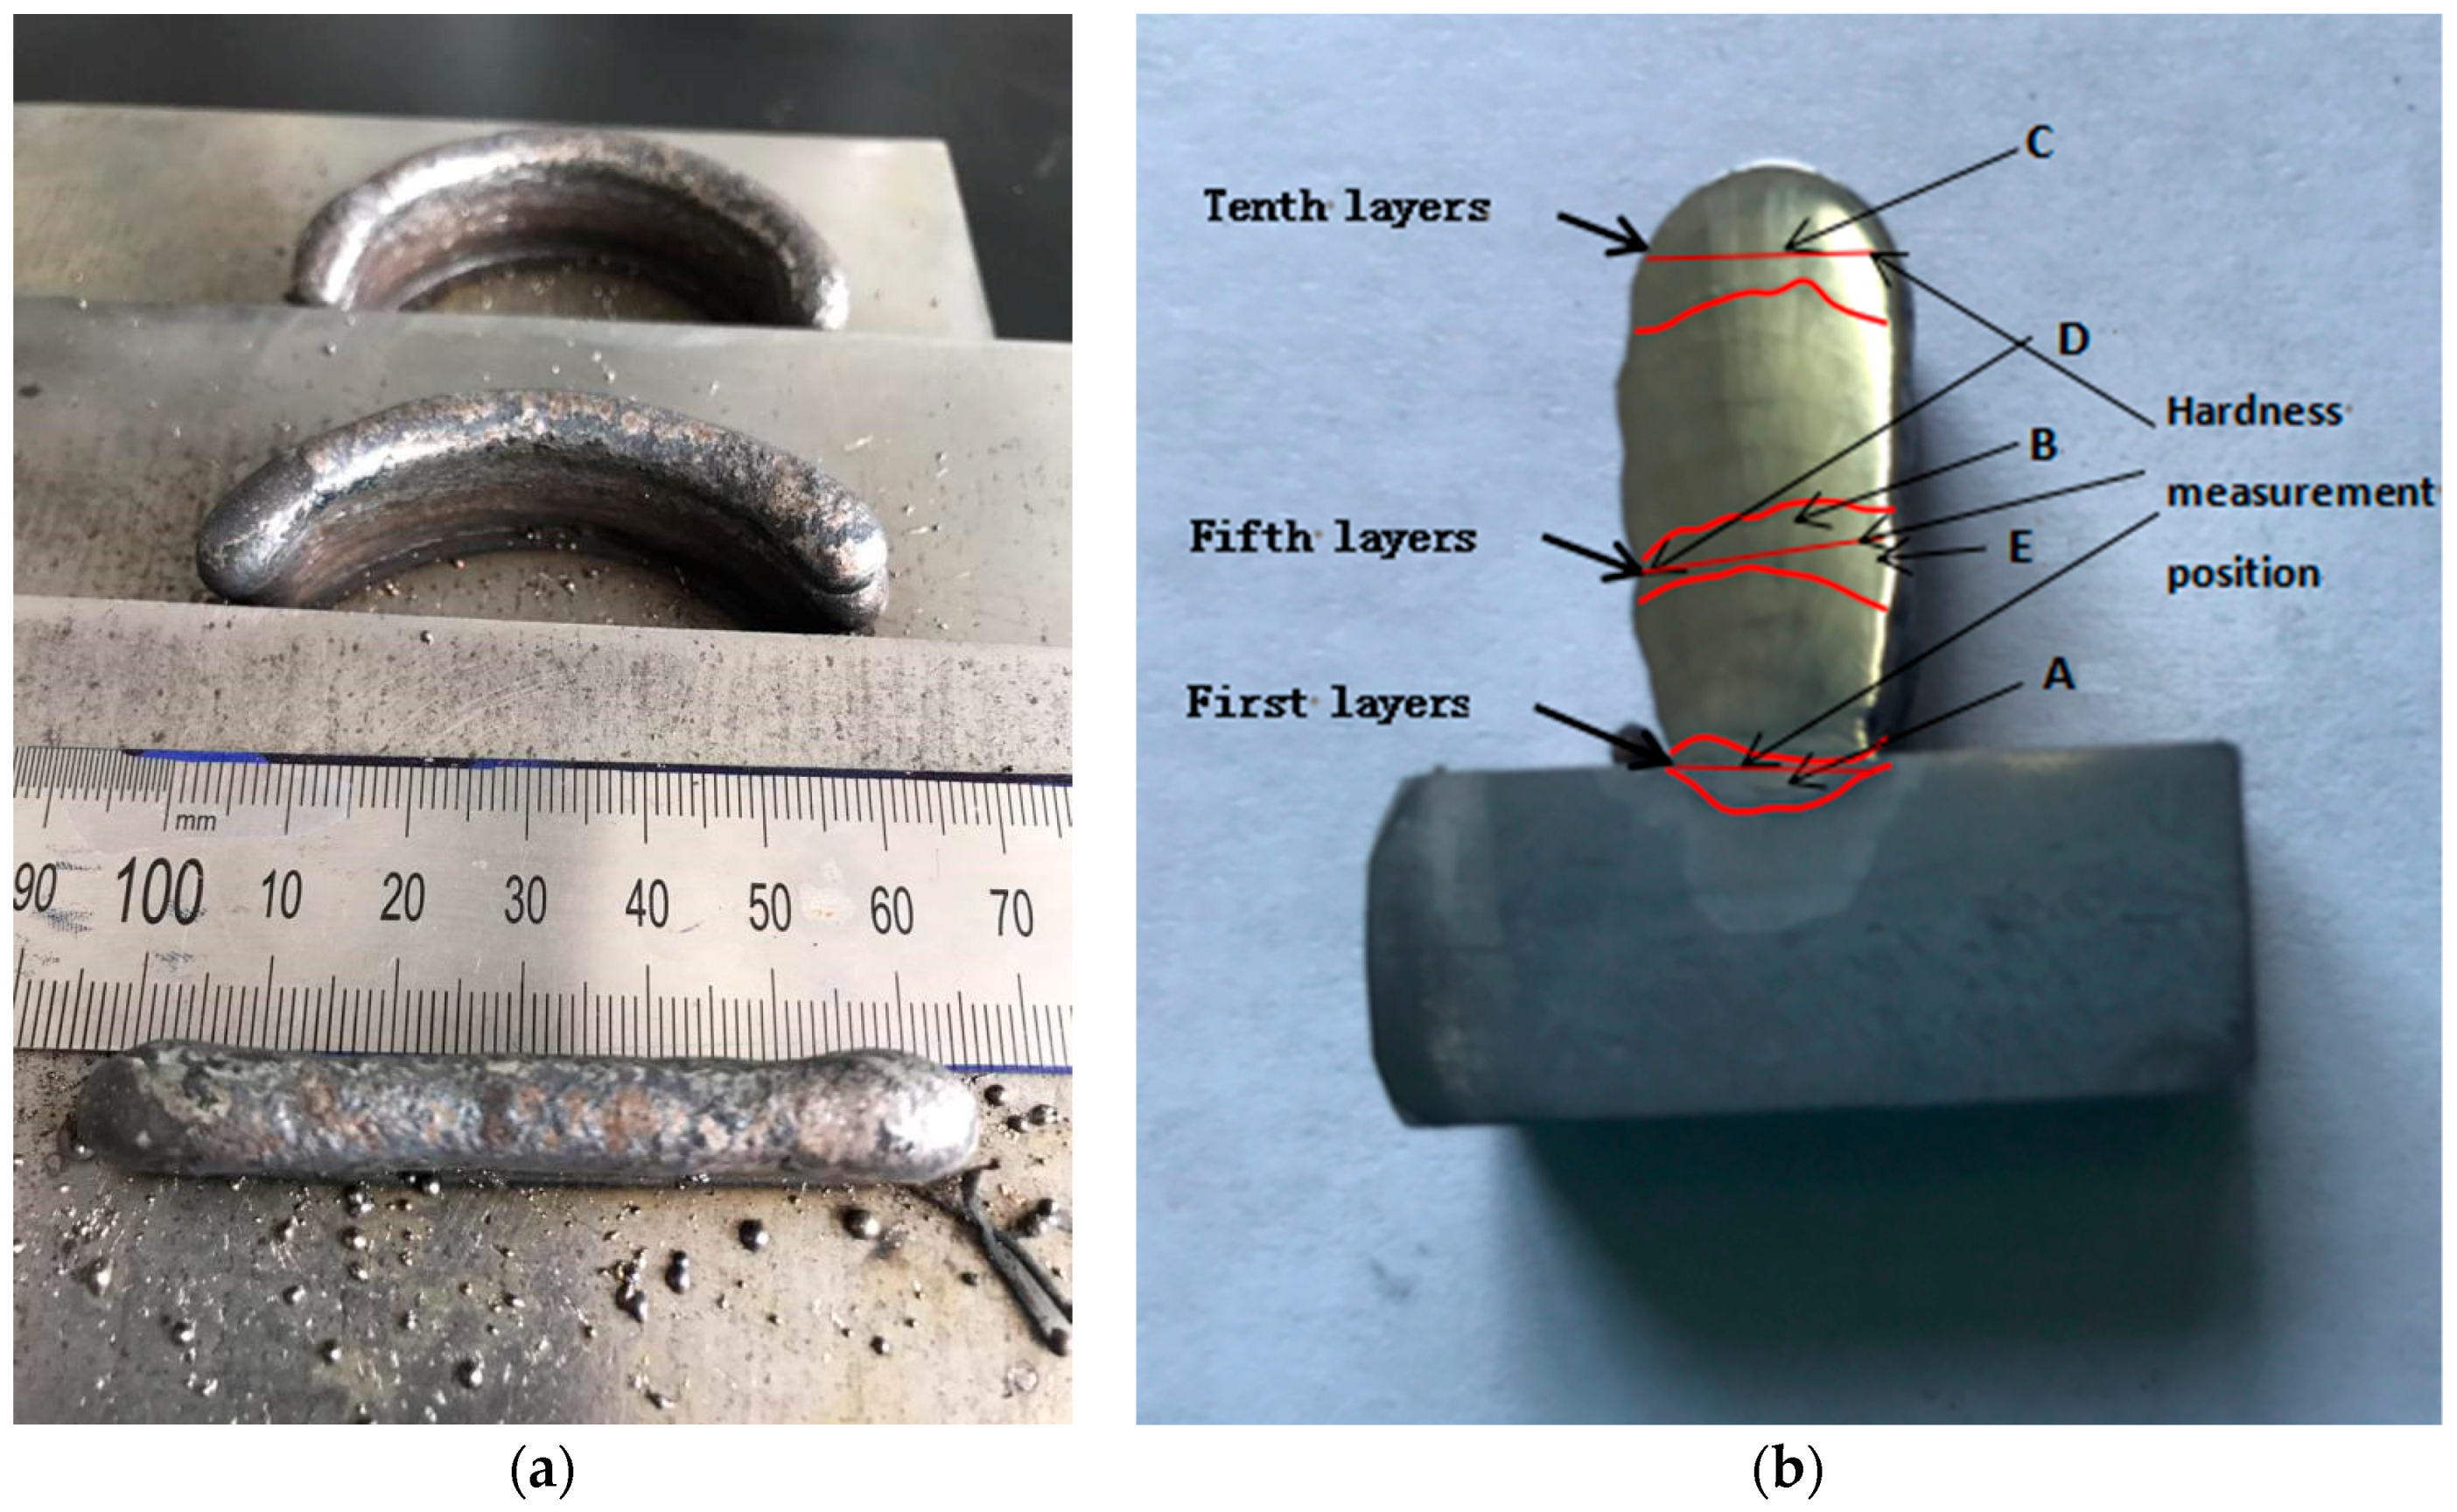
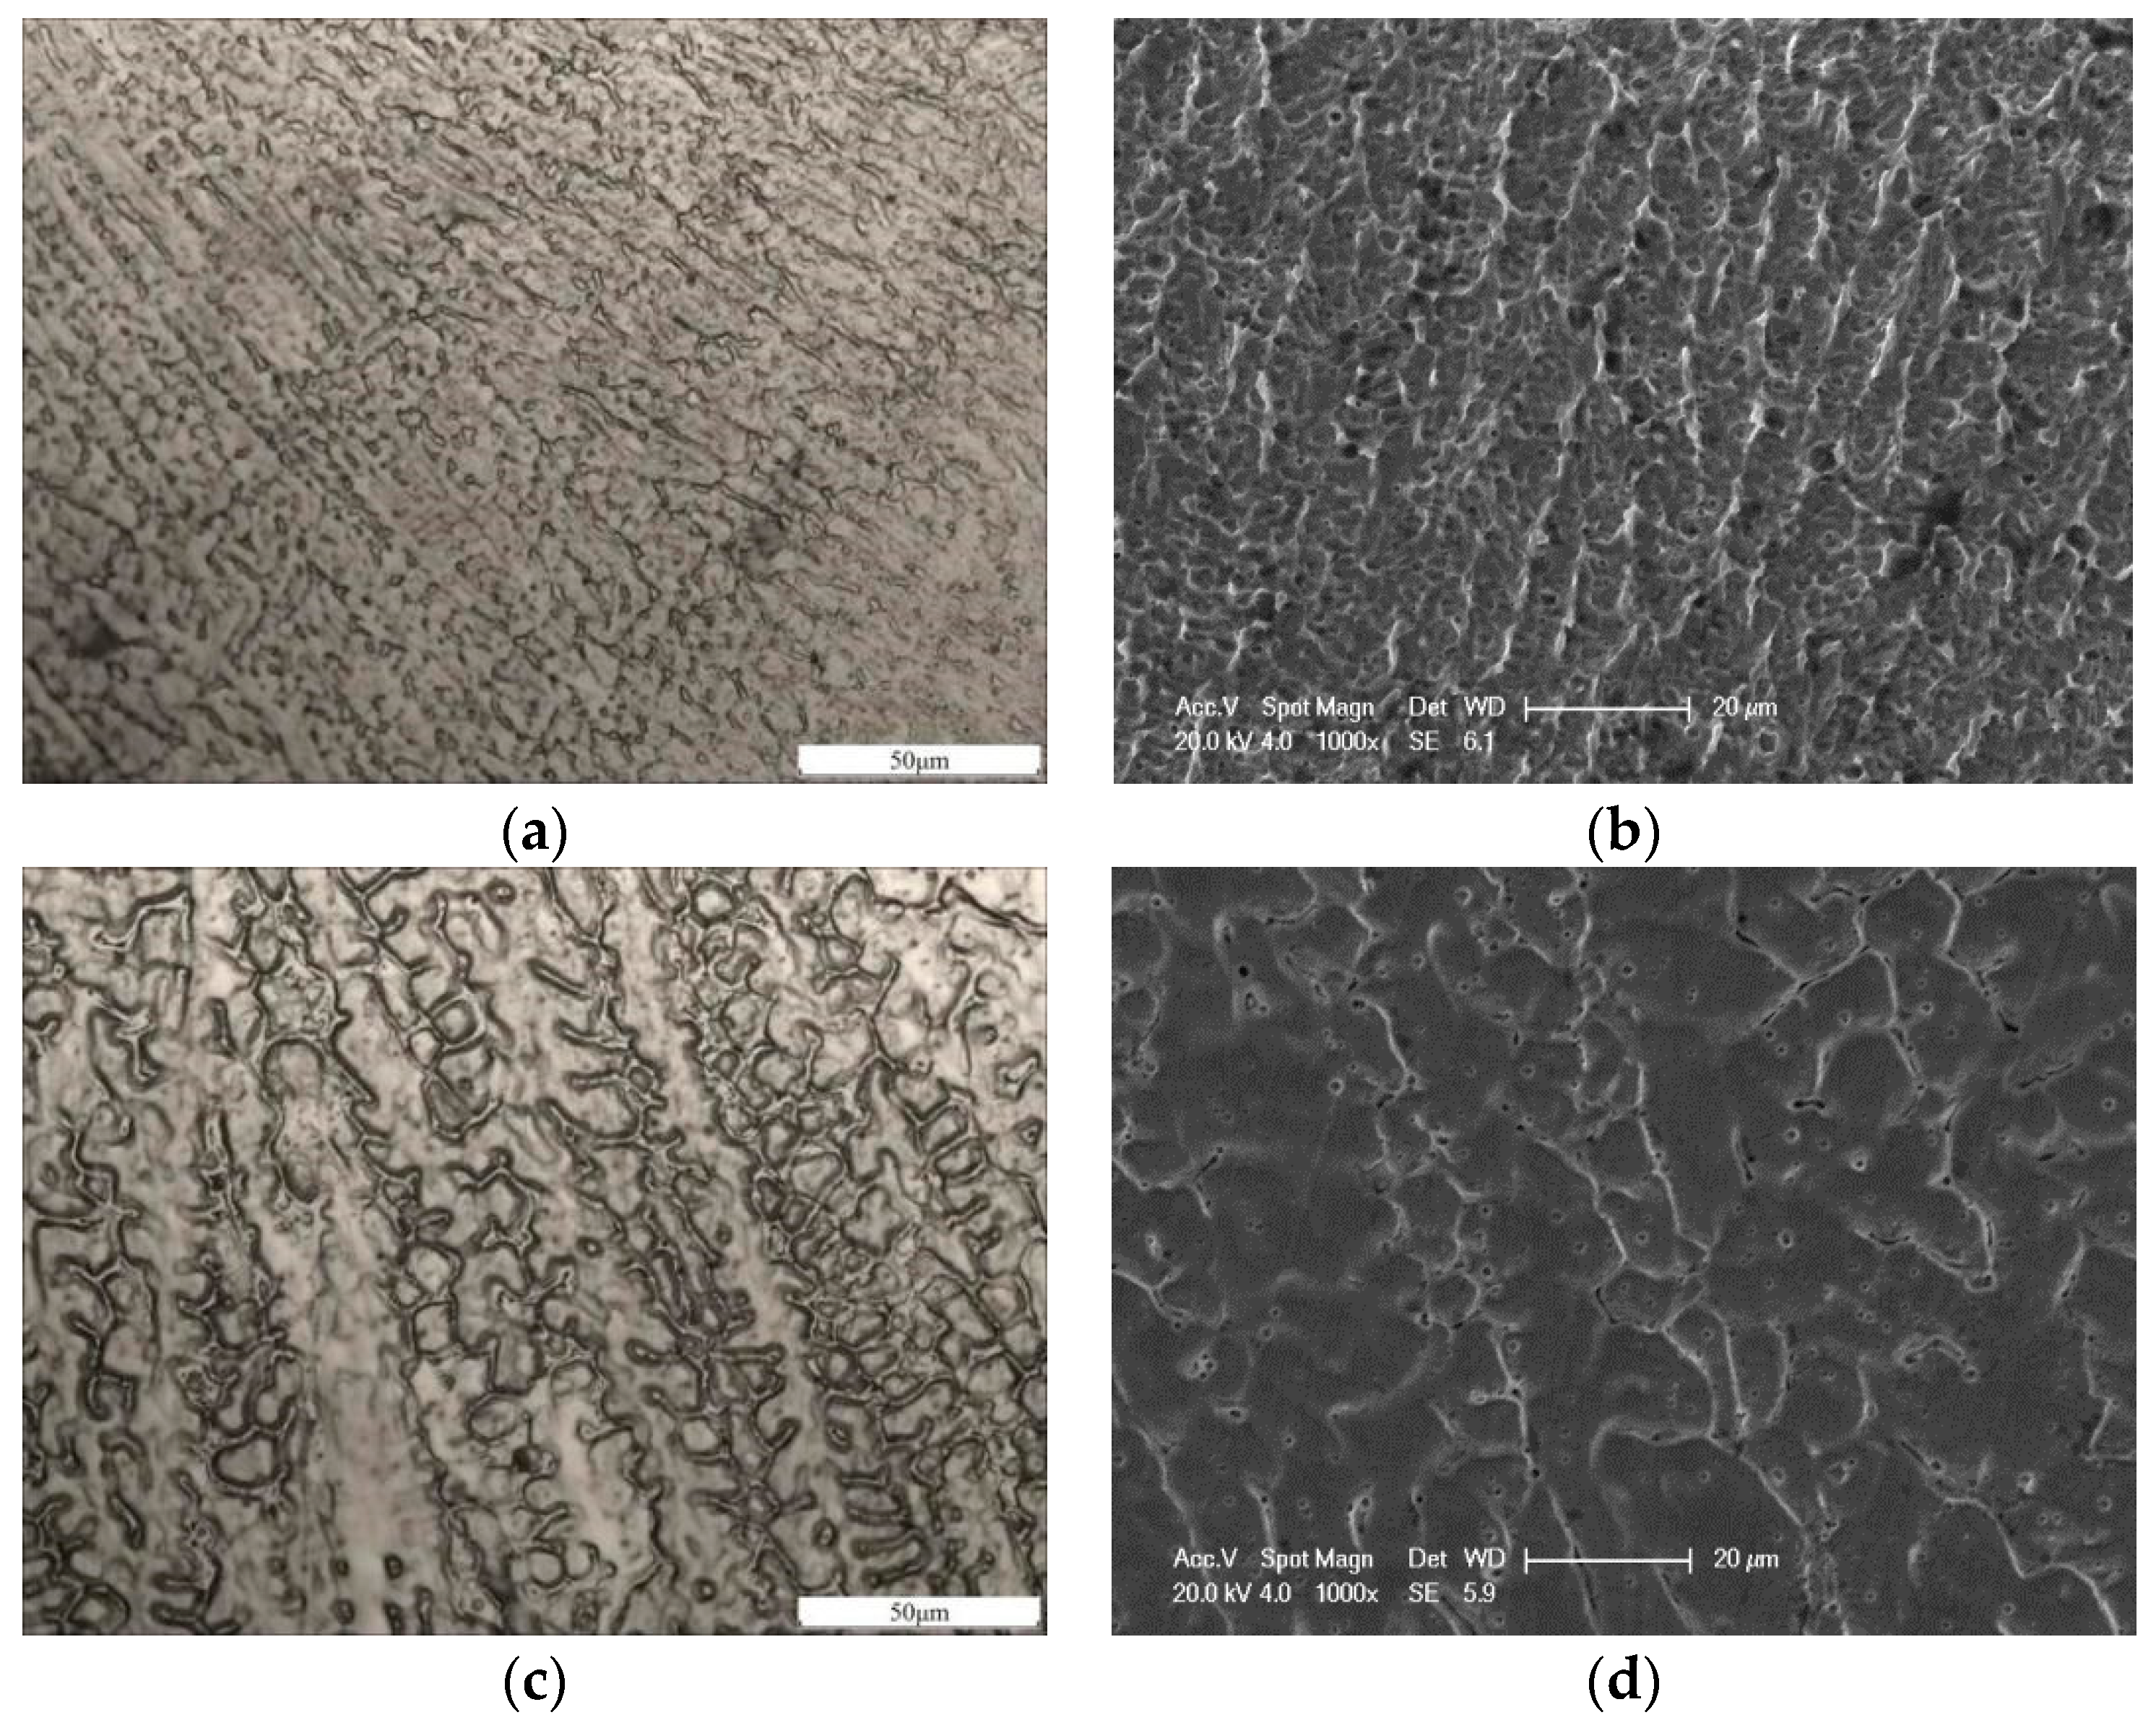
3.1. Macroscopic Morphology and Microstructure of Stainless-steel Specimens
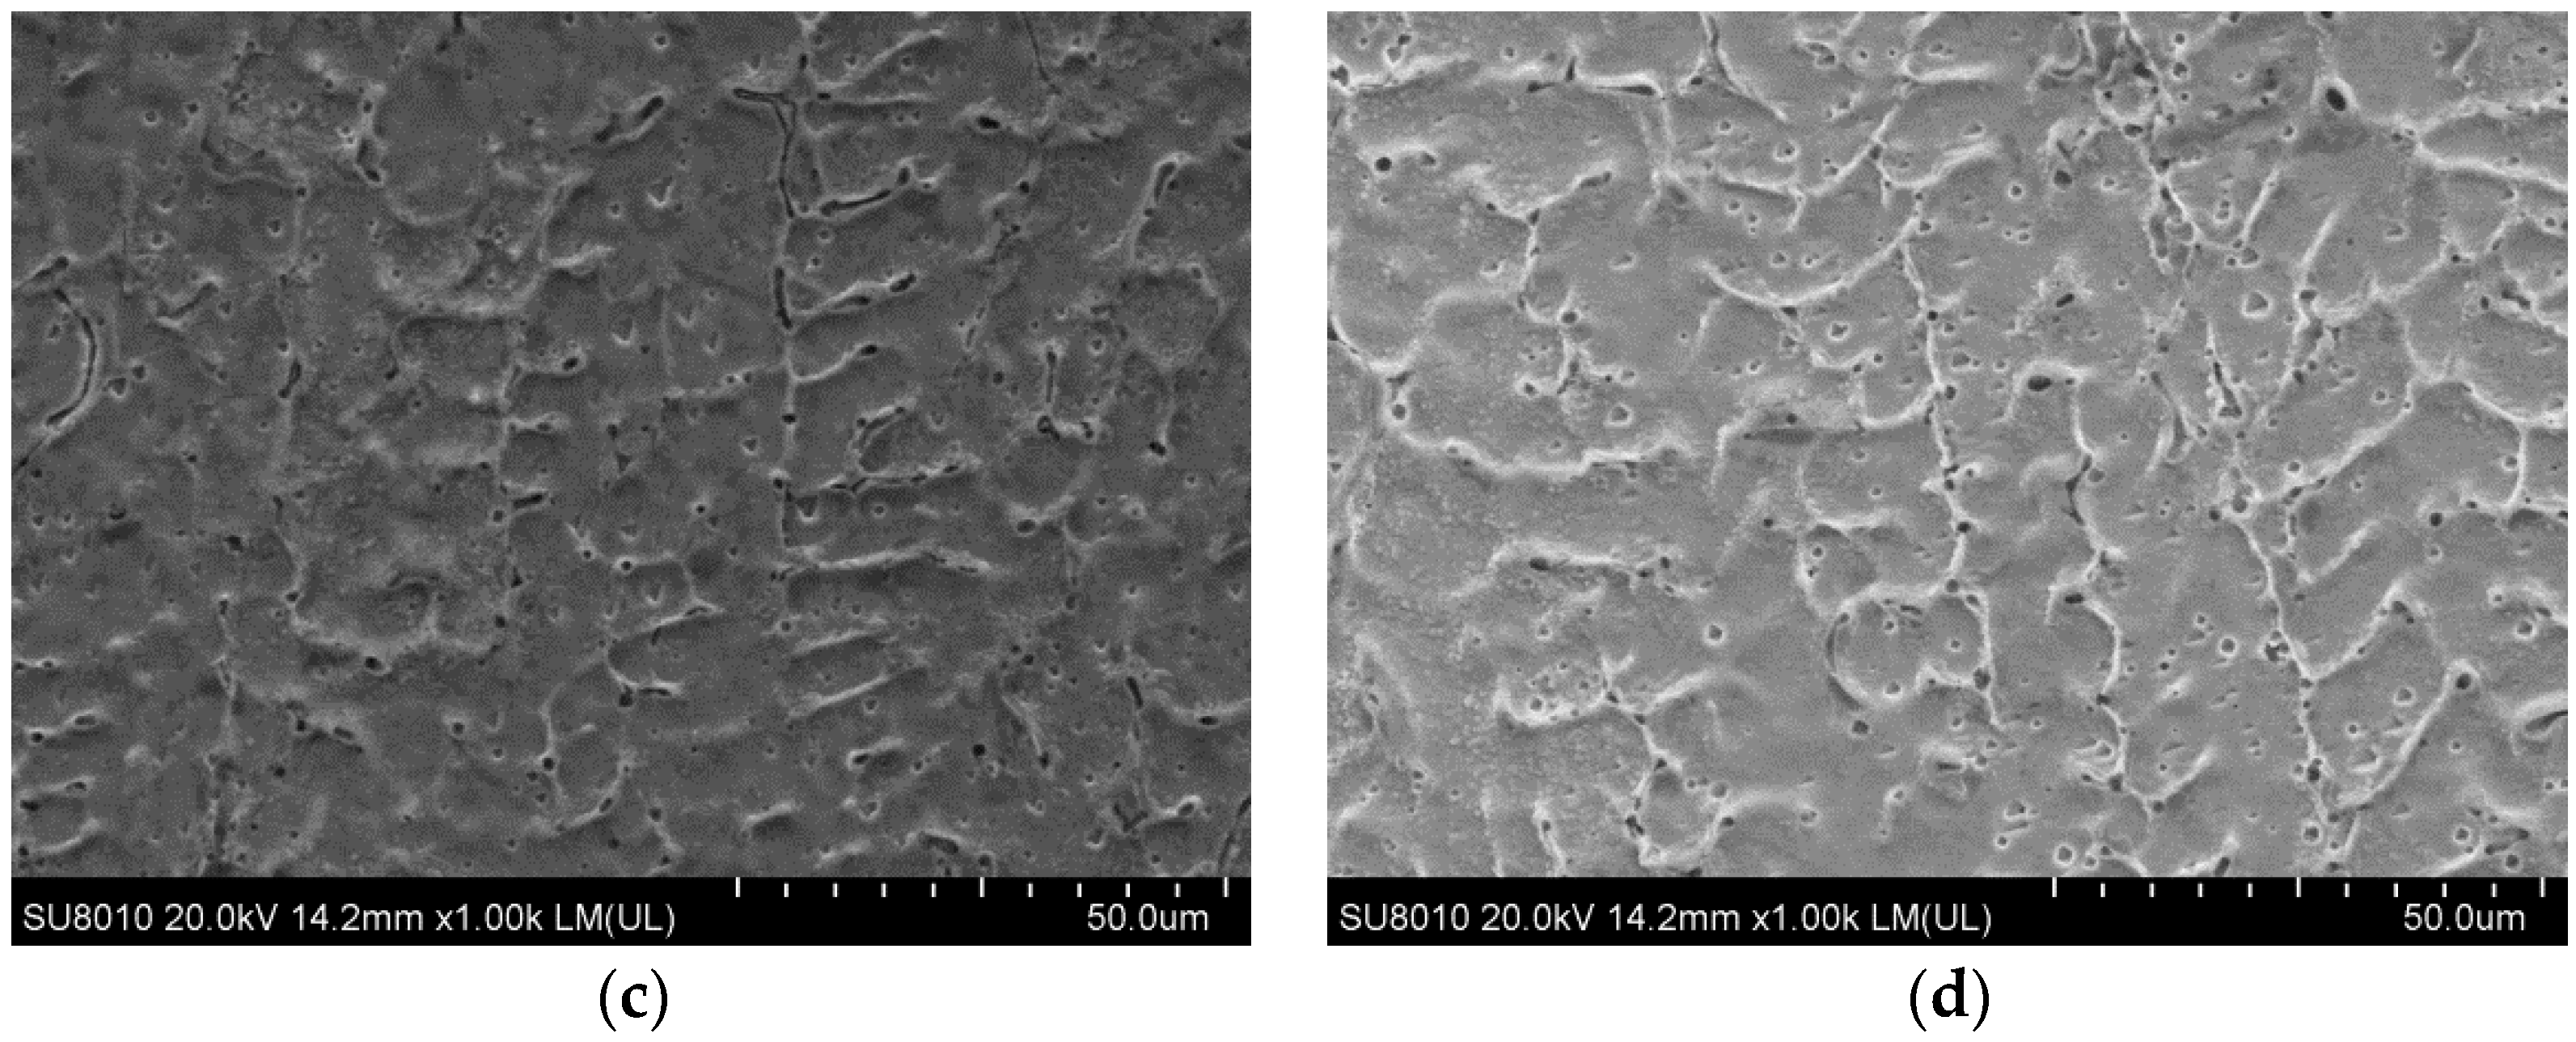
3.2. Microhardness Distribution of Stainless-steel Samples
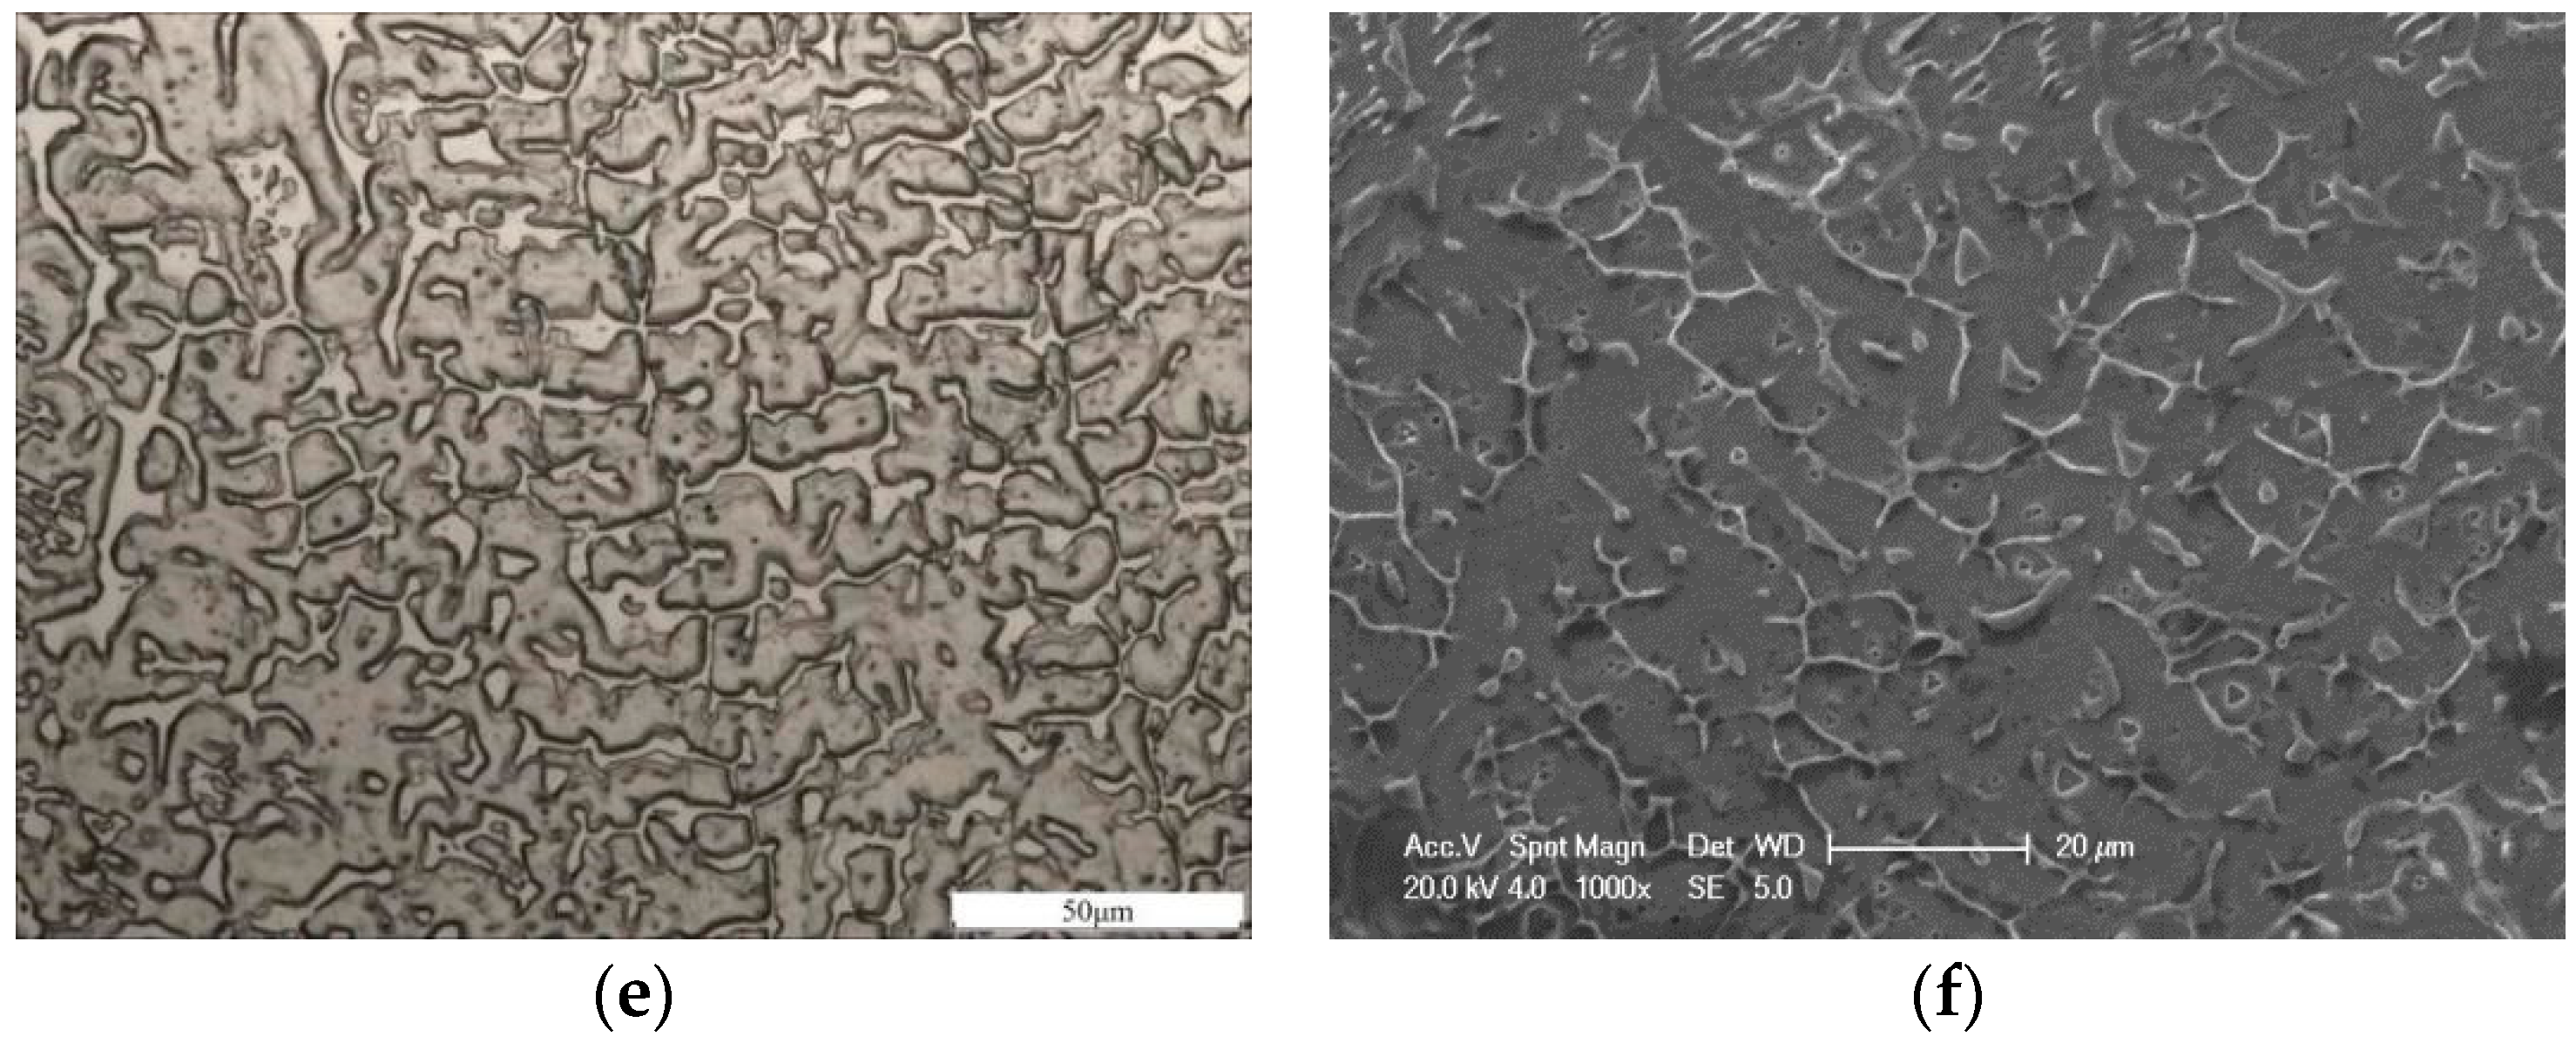
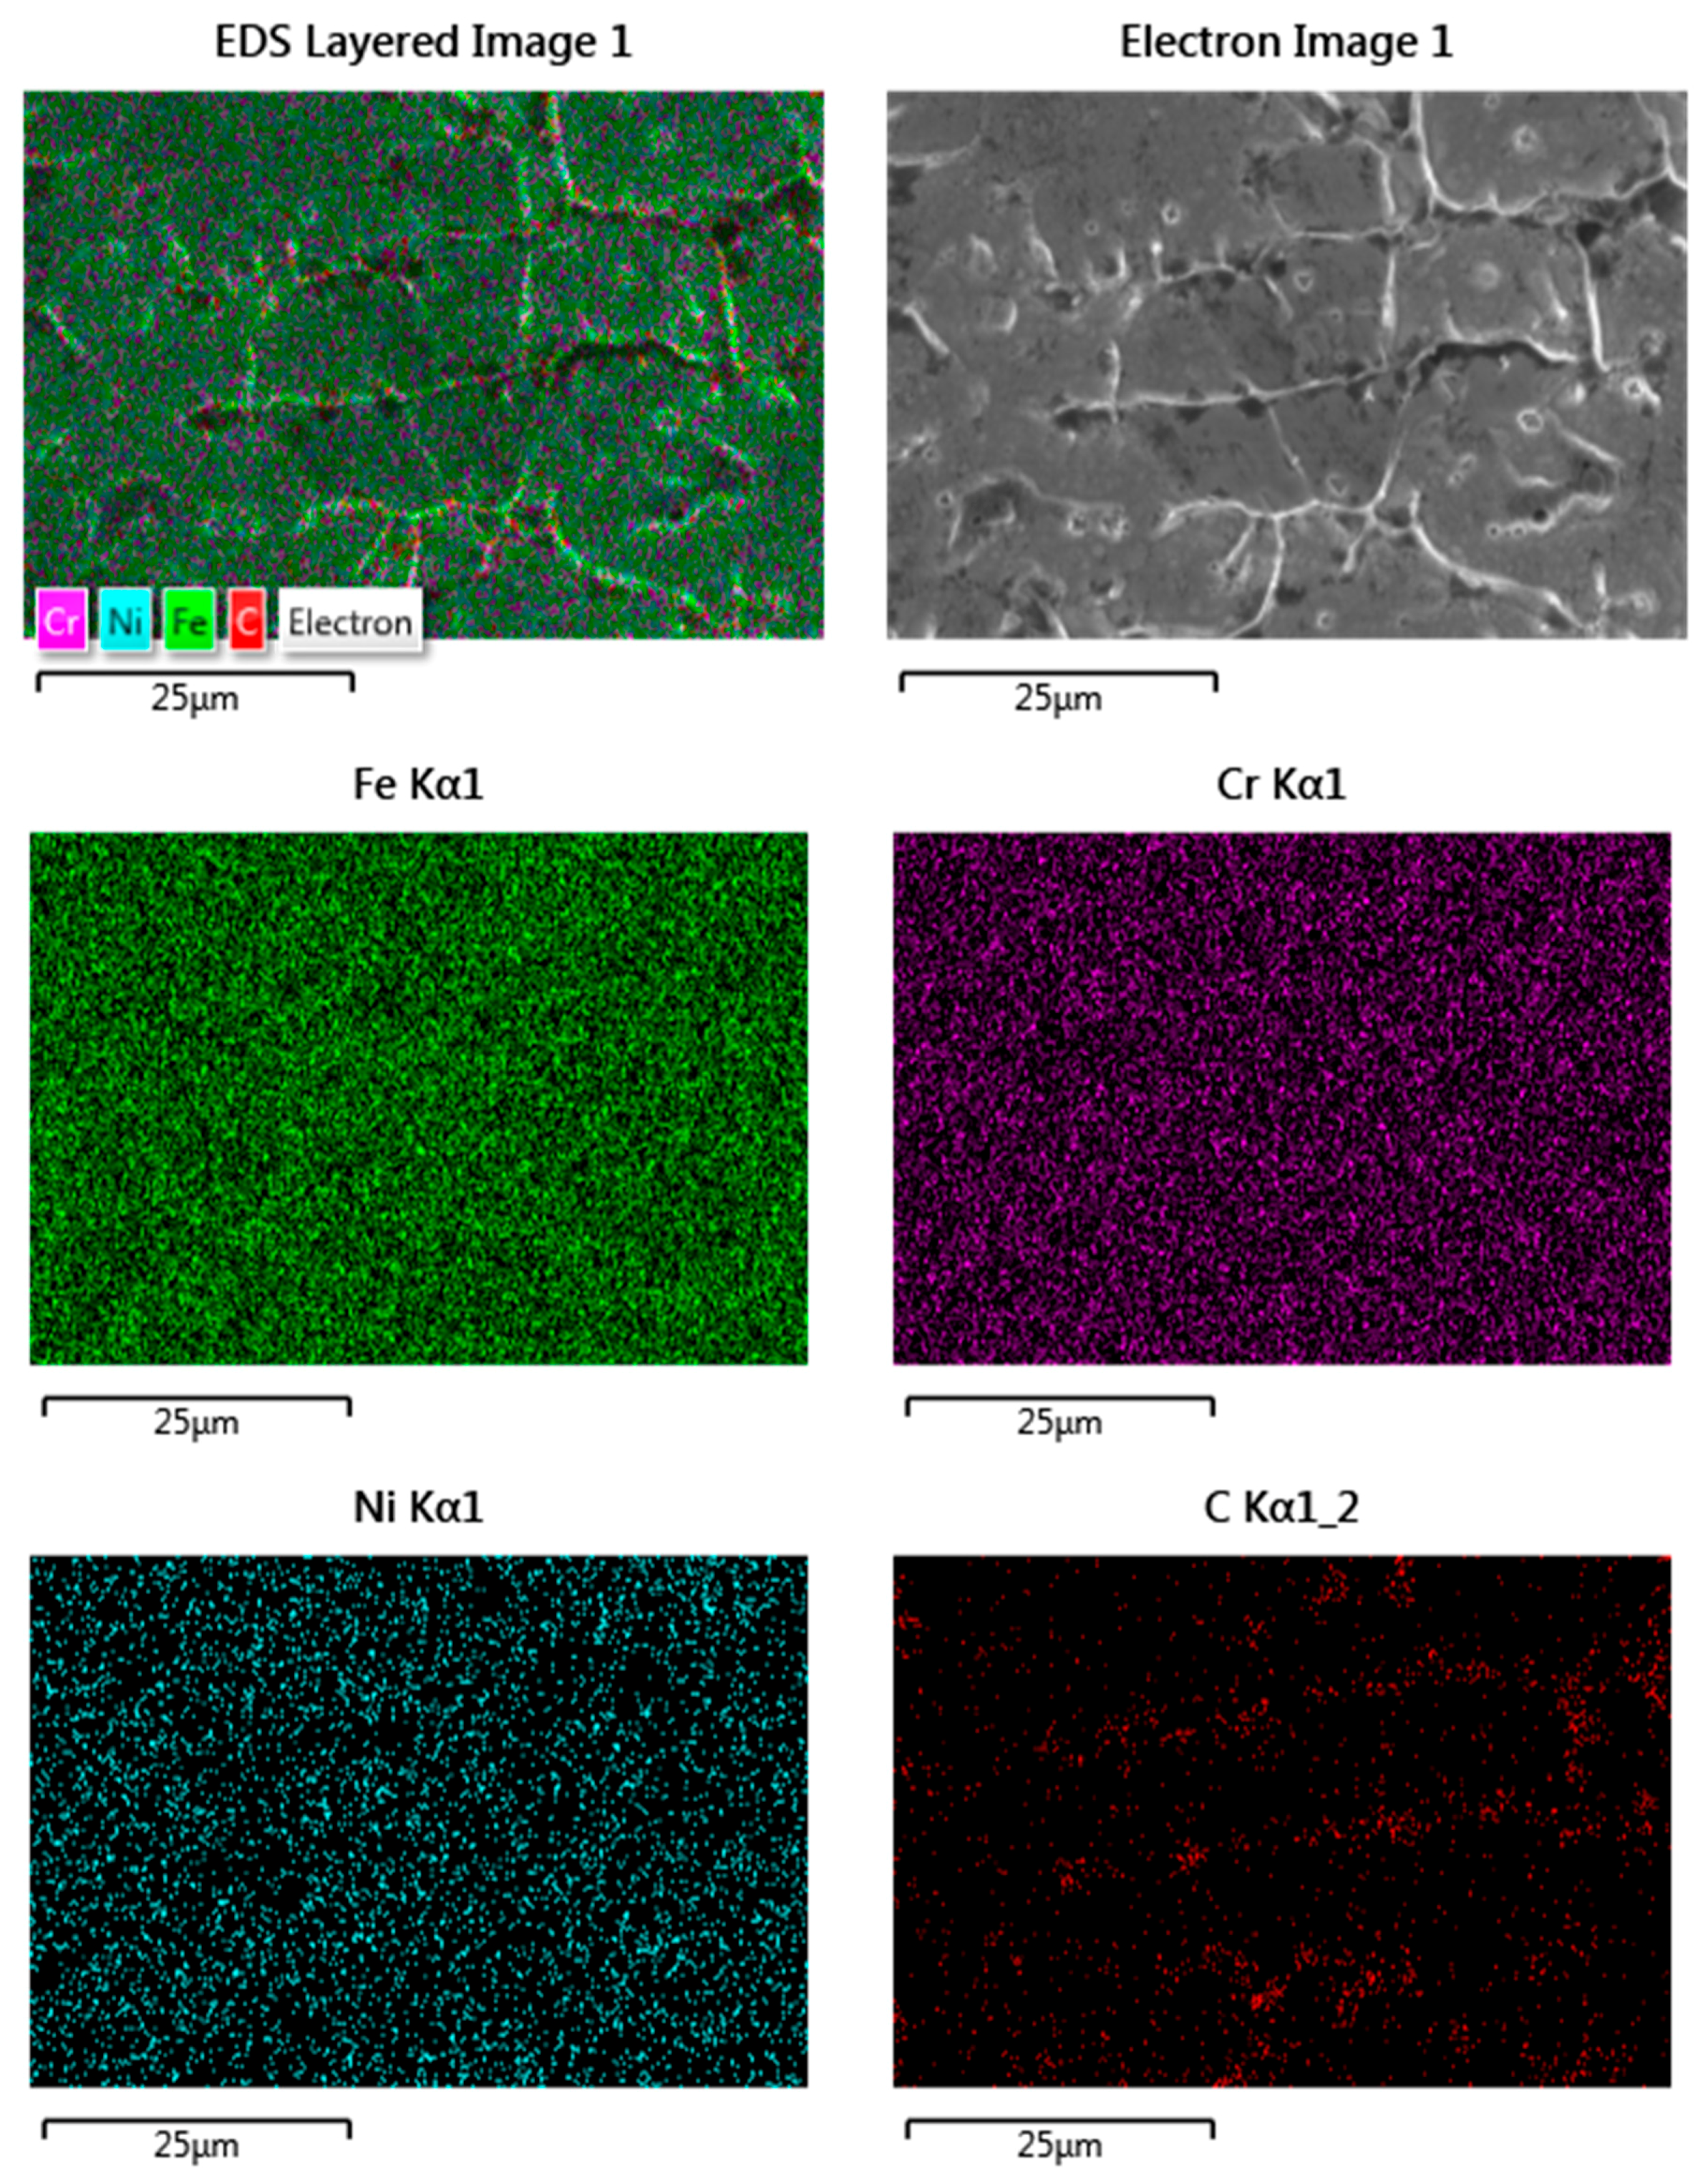
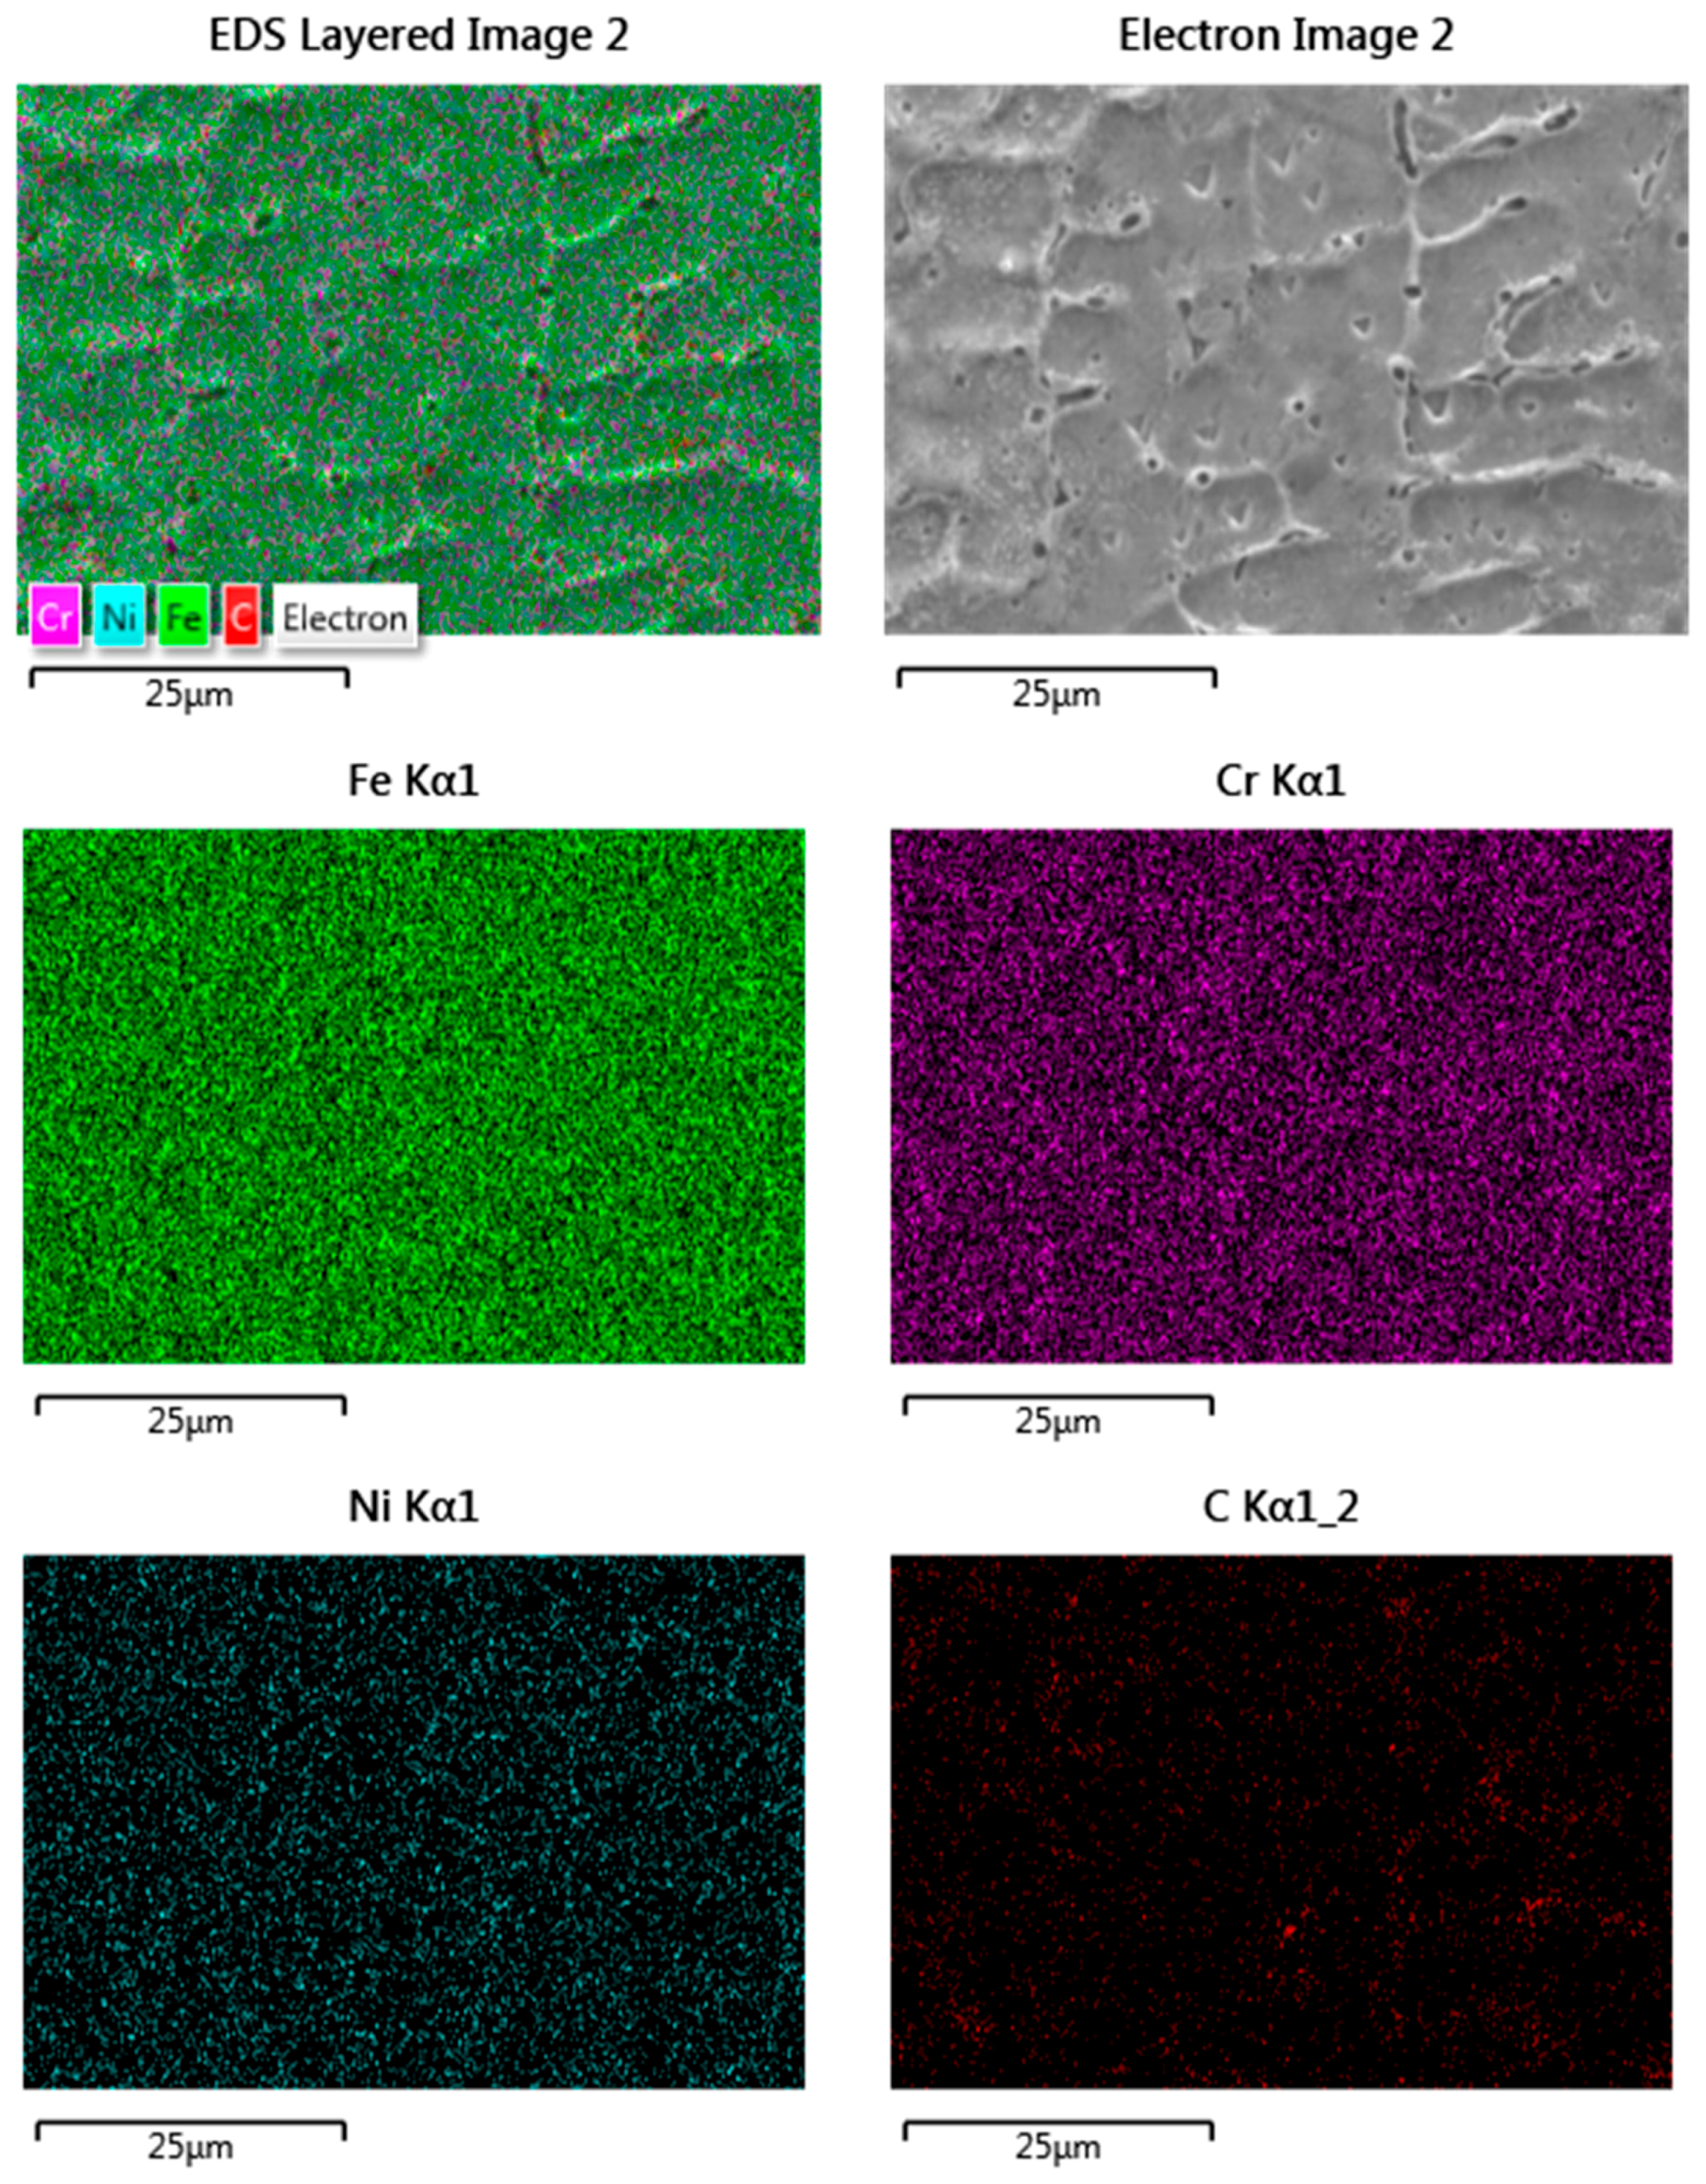
3.3. Microstructure of the Low Carbon Steel Sample
4. Conclusions
- The top layer has a slow cooling rate. More carbides particles are precipitated at the grain boundaries, rather than within the grains, and the microhardness value is slightly lower than that of the middle layer.
- Different trajectory curvature leads to a difference in microstructure and properties for inner and outer regions, which originates from the difference in heat input, due to the difference in the actual welding traveling speed between the inside and outside regions.
- As curvature increases, the enhanced effect of the magnetic arc blow reduces the difference in heat input, due to the difference in actual welding traveling speed between the inside and outside areas.
Author Contributions
Funding
Acknowledgments
Conflicts of Interest
References
- Horii, T.; Kirihara, S.; Miyamoto, Y. Freeform fabrication of superalloy objects by 3D Micro welding. Mater. Des. 2009, 30, 1093–1097. [Google Scholar] [CrossRef]
- Frazier, W.E. Metal additive manufacturing: A review. J. Mater. Eng. Perform. 2014, 23, 1917–1928. [Google Scholar] [CrossRef]
- Baufeld, B.; Biest, O.V.D.; Gault, R. Additive manufacturing of Ti-6Al-4V components by shaped metal deposition: Microstructure and mechanical properties. Mater. Des. 2010, 31, 106–111. [Google Scholar] [CrossRef]
- Spencer, J.D.; Dickens, P.M.; Wykes, C.M. Rapid prototyping of metal parts by three- dimensional welding. Proc. Inst. Mech. Eng. Part B J. Eng. Manuf. 1998, 212, 175–182. [Google Scholar] [CrossRef]
- Zhang, H.; Wang, X.; Wang, G.; Zhang, Y. Hybrid direct manufacturing method of metallic parts using deposition and micro continuous rolling. Rapid Prototyp. J. 2013, 19, 387–394. [Google Scholar] [CrossRef]
- Zinoviev, A.; Zinovieva, O.; Ploshikhin, V.; Romanova, V.; Balokhonov, R. Evolution of grain structure during laser additive manufacturing simulation by A cellular automata method. Mater. Des. 2016, 106, 321–329. [Google Scholar] [CrossRef]
- Liu, F.; Xin, L.; Song, M.; Yang, H.; Song, K.; Guo, P.; Huang, W. Effect of tempering temperature on microstructure and mechanical properties of laser solid formed 300M steel. J. Alloy. Compd. 2016, 689, 225–232. [Google Scholar] [CrossRef]
- Kobryn, P.A.; Semiatin, S.L. Microstructure and texture evolution during solidification processing of Ti-6Al-4V. J. Mater. Process. Technol. 2003, 135, 330–339. [Google Scholar] [CrossRef]
- Nowotny, S.; Scharek, S.; Beyer, E.; Richter, K.H. Laser beam build-Up welding: Precision in repair, surface cladding, and direct 3D metal deposition. J. Therm. Spray Technol. 2007, 16, 344–348. [Google Scholar] [CrossRef]
- Katou, M.; Oh, J.; Miyamoto, Y.; Matsuura, K.; Kudoh, M. Freeform fabrication of titanium metal and intermetallic alloys by three-dimensional micro welding. Mater. Des. 2007, 28, 2093–2098. [Google Scholar] [CrossRef]
- Debroy, T.; Wei, H.; Zuback, J.; Mukherjee, T.; Elmer, J.W.; Milewski, J.O.; Beese, A.M.; Wilson-Heid, A.; De, A.; Zhang, W. Additive manufacturing of metallic components—Process, structure and properties. Prog. Mater. Sci. 2018, 92, 112–224. [Google Scholar] [CrossRef]
- Segura, I.A.; Murr, L.E.; Terrazas, C.A.; Bermudez, D.; Mireles, J.; Injeti, V.S.V.; Li, K.; Yu, B.; Misra, R.D.K.; Wicker, R.B. Grain boundary and microstructure engineering of Inconel 690 cladding on stainless-steel 316L using electron powder bed fusion additive manufacturing. J. Mater. Sci. Technol. 2019, 35, 351–367. [Google Scholar] [CrossRef]
- Mines, R. Parent materials and lattice characterisation for metallic microlattice structures. In Information and Communication Technologies for Ageing Well and e-Health; Springer: Cham, Switzerland, 2019; pp. 17–29. [Google Scholar]
- Gupta, K. Near Net Shape Manufacturing Processes; Springer International Publishing: Cham, Switzerland, 2019; pp. 54–74. [Google Scholar]
- Xu, J.; Li, A.; Liu, D.; Wang, H. Research on corrosion resistance and wear resistance of laser cladding Cr3Si/g multi-phase coating. Chin. J. Lasers 2016, 43, 72–78. [Google Scholar]
- Mehrpouya, M.; Dehghanghadikolaei, A.; Fotovvati, B.; Vosooghnia, A.; Emamian, S.S.; Gisario, A. The potential of additive manufacturing in the smart factory industrial 4.0: A review. Appl. Sci. 2019, 9, 3865. [Google Scholar] [CrossRef]
- Yan, X.; Gu, P. A review of rapid prototyping technologies and systems. Comput. Aided Des. 1996, 28, 307–318. [Google Scholar] [CrossRef]
- Clark, D.; Bache, M.R.; Whittaker, M.T. Shaped metal deposition of a nickel alloy for aero engine applications. J. Mater. Process. Technol. 2008, 203, 439–448. [Google Scholar] [CrossRef]
- Williams, S.W.; Martina, F.; Addison, A.C.; Ding, J.; Pardal, G.; Colegrove, P. Wire + arc additive manufacturing. Mater. Sci. Technol. 2016, 3, 641–647. [Google Scholar] [CrossRef]
- Zhao, H.; Zhang, G.; Yin, Z.; Wu, L. A 3D dynamic analysis of thermal behavior during single-pass multi-layer weld-based rapid prototyping. J. Mater. Process. Technol. 2011, 211, 488–495. [Google Scholar] [CrossRef]
- Fachinotti, V.D.; Cardona, A.; Baufeld, B.; Van der Biest, O. Finite-element modelling of heat transfer in shaped metal deposition and experimental validation. Acta Mater. 2012, 60, 6621–6630. [Google Scholar] [CrossRef]
- Liu, S.Y.; Feng, Y.H.; Zhan, B.; Luo, Z.J.; Fang, L.L. Effect of stacking speed on microstructure and properties of carbon steel stacking coating fabricated by plasma arc double-filled additive. Mater. Mech. Eng. 2018, 42, 69–72. [Google Scholar] [CrossRef]
- Zhou, X.M.; Tian, Q.H.; Du, Y.X.; Bai, X.W. Effect of longitudinal steady state magnetic field on surface quality and performance of arc additive forming parts. J. Mech. Eng. 2018, 54, 84–92. [Google Scholar] [CrossRef]
- Ge, J.; Lin, J.; Lei, Y.; Fu, H. Location-related thermal history, microstructure, and mechanical properties of arc additively manufactured 2Cr13 steel using cold metal transfer welding. Mater. Sci. Eng. A 2017, 72, 144–153. [Google Scholar] [CrossRef]
- Kou, S. Welding Metallurgy, 2nd ed.; Wiley: Hoboken, NJ, USA, 2003; pp. 163–166. [Google Scholar]
- Li, W.; Yang, Q.; Zhang, Z.; Gao, D. Effect of weld curvature radius and tool rotation direction on joint microstructure in friction stir welding casting alloys. Mater. Des. 2014, 53, 124–128. [Google Scholar] [CrossRef]
- Wang, H.F.; Lai, W.X.; Zhang, H.O.; Wang, G.L. Effect of curvature curvature on the morphology of the accumulated layer. New Technol. New Process 2018, 8, 46–49. [Google Scholar]
- Zhou, X.M.; Zhang, H.O.; Wang, G.L.; Bai, X.W. Simulation of the influences of surface topography of deposited layer on arc shape and state in arc based additive forming. Acta Phys. Sin. 2016, 65, 331–342. [Google Scholar]
- Zhou, X.; Zhang, H.; Wang, G.; Bai, X. Three-dimensional numerical simulation of arc and metal transport in arc welding based additive manufacturing. Int. J. Heat Mass Transf. 2016, 103, 521–537. [Google Scholar] [CrossRef]


| Chemical Composition (wt %) | Wire Type | Substrate Material | |
|---|---|---|---|
| ER304 | ER50-6 | Q235 | |
| C | 0.10 | 0.06–0.15 | 0.12–0.20 |
| Si | 0.65 | 0.80–1.15 | ≤0.30 |
| Mn | 1.72 | 1.40–1.85 | 0.30–0.65 |
| Cr | 17.5 | ≤0.15 | − |
| Ni | 9.3 | ≤0.15 | − |
| P | − | ≤0.025 | ≤0.045 |
| S | − | ≤0.025 | ≤0.045 |
| Process Parameters | Wire Type | |
|---|---|---|
| ER304 | ER50-6 | |
| Welding voltage | 23 V | 20 V |
| Welding current | 125 A | 110 A |
| Welding speed | 5 mm/s | 5 mm/s |
| Protective gas type and composition | 95% Ar + 5% CO2 | 100% CO2 |
| Protective gas flow | 18 L/min | 16 L/min |
| Wire diameter | 10 mm | 10 mm |
© 2019 by the authors. Licensee MDPI, Basel, Switzerland. This article is an open access article distributed under the terms and conditions of the Creative Commons Attribution (CC BY) license (http://creativecommons.org/licenses/by/4.0/).
Share and Cite
Feng, T.; Wang, L.; Tang, Z.; Yu, S.; Bu, Z.; Hu, X.; Cheng, Y. Effect of Trajectory Curvature on the Microstructure and Properties of Surfacing Wall Formed with the Process of Wire Arc Additive Manufacturing. Coatings 2019, 9, 848. https://doi.org/10.3390/coatings9120848
Feng T, Wang L, Tang Z, Yu S, Bu Z, Hu X, Cheng Y. Effect of Trajectory Curvature on the Microstructure and Properties of Surfacing Wall Formed with the Process of Wire Arc Additive Manufacturing. Coatings. 2019; 9(12):848. https://doi.org/10.3390/coatings9120848
Chicago/Turabian StyleFeng, Tao, Lishi Wang, Zhongmin Tang, Shanwen Yu, Zhixiang Bu, Xinbin Hu, and Yihang Cheng. 2019. "Effect of Trajectory Curvature on the Microstructure and Properties of Surfacing Wall Formed with the Process of Wire Arc Additive Manufacturing" Coatings 9, no. 12: 848. https://doi.org/10.3390/coatings9120848
APA StyleFeng, T., Wang, L., Tang, Z., Yu, S., Bu, Z., Hu, X., & Cheng, Y. (2019). Effect of Trajectory Curvature on the Microstructure and Properties of Surfacing Wall Formed with the Process of Wire Arc Additive Manufacturing. Coatings, 9(12), 848. https://doi.org/10.3390/coatings9120848