Article

Study on Friction and Lubrication Characteristics of Surface with Unidirectional Convergence Texture

School of Mechanical Engineering, University of Jinan, Jinan 250022, China
*
Author to whom correspondence should be addressed.
Coatings 2019, 9(12), 780; https://doi.org/10.3390/coatings9120780
Submission received: 20 October 2019 / Revised: 12 November 2019 / Accepted: 20 November 2019 / Published: 21 November 2019

Abstract

:
In order to study the influence of texture on the wear and lubrication performance of the surface of the tools, three kinds of textures with unidirectional convergence morphology were processed on the surface of the samples, and each texture was designed with different area occupancy ratios. Simulation analysis shows that, owing to the reflow and convection effect of liquid in the texture, the lubricating film flowing through the textured surface has a high hydrodynamic pressure value, and the semicircular ring texture is the most prominent. By comparing the friction coefficient, when the area occupancy ratio of texture on the surface is 10%, the surface of the samples with different morphology has the lowest coefficient of friction; the friction coefficient of the semicircular ring textured surface is especially very low. Surface textures reduce the direct contact area between the friction pairs, and generate dynamic pressure lubrication and secondary lubrication, so that the surface friction coefficient of the samples is obviously reduced. The surfaces of the non-textured samples have abrasive wear and contact fatigue wear, and the surfaces of the textured samples have adhesive wear, abrasive wear, and cavitation.

1. Introduction

It is estimated that about one-third to one-half of the world’s energy consumption is caused by friction and wear. In conventional material removal processes such as turning, milling, and grinding, the relative motion between the friction pairs can cause severe wear on the surface of tools [1], thus affecting the life and performance of tools [2,3]. Also, for other non-machining manufacturing technologies such as metal forming processes, as a result of severe plastic deformation and high stresses of the processes such as drawing and extrusion, forming tools are exposed to excessive wear and fatigue. How to improve the wear resistance of the surface of tools has become an urgent problem in manufacturing technologies.
Ion implantation, shot peening, and surface coating methods have been applied to extend the service life of manufacturing tools. Other than ion implantation, shot peening, and surface coating methods, surface texturing and patterning methods have been widely studied recently, which has obvious effects on improving the surface friction performance of tools [4]. Studies have shown that, when the surface of tools has a certain texture, its wear resistance will be improved, and a certain non-smooth surface will improve the friction and lubrication properties of the lubricating fluid [5,6].
In 1942, Schlesinger [7] proposed that “the quality of the surface is extremely important for its correct function”, indicating that designers have long recognized that the mechanical, physical, and chemical properties of the surface can be improved by changing the surface morphology, such as surface texture.
In 1966, Hamilton [8] proposed the additional fluid dynamic pressure effect; that is, when the liquid flows through the pits or grooves machined on the surface of the friction pair, a small convergence wedge and a divergent wedge are formed. When the friction pair is in relative motion, the fluid in the convergence wedge generates a dynamic pressure effect, thereby forming a positive pressure; while in the divergent wedge, owing to the existence of the “cavitation” phenomenon, the “negative pressure” of the fluid is restrained. Therefore, additional hydrodynamic pressure is formed between the friction pairs, which improves the bearing capacity of the fluid.
Liu et al. [9] used a picosecond laser to achieve micro-texture on the surface of cast iron, and investigated the friction and wear properties of four different surfaces of smooth, pit textures, net textures, and intermittent textures. The study found that under the dry friction condition, the surface machined micro-texture can significantly improve the stability of the friction coefficient compared with a smooth surface, but different textures have different effects on the stability and initial value of the friction coefficient.
Gachot et al. [10] fabricated regular pits on the silicon surface by photolithography and wet etching, and tested the friction under boundary lubrication. The results show that the high-density pit morphology has a low coefficient of friction, and when the sliding direction and pit row of the cloth is at a 30 degree angle, the friction is reduced. Zeeshan Ur Rehman [11], Faiz Muhaffel [12], and Aliofkhazraei [13] have also done a lot of research in the field of coatings and textures. Etsion et al. [14] studied the potential use of laser surface texturing (LST) in the form of spherical micro-dimples for soft elasto-hydrodynamic lubrication (SEHL); they are pioneers in surface texturation by lubrication application.
Owing to too many factors affecting the texture performance, including texture morphology, geometric parameters, friction conditions, contact methods, lubricants, and environmental influences, at present, there is no certain optimal texture pattern, and most of studies are based on experiments, with a lack of good theoretical explanation.
The theoretical and experimental research of the predecessors has proven that the surface texture has excellent anti-wear and lubrication performance. However, few of them have studied textures with one-way convergence morphology, such as triangle. Also, studies mainly focus on one aspect that affects the texture properties, such as morphology. The predecessors mainly proved the friction and lubrication effects of the surface texture by experiments, but simulation analyses were very limited. In this experiment, simulation analysis was combined with the specific experimental methods, the simulation results were supplemented by experiments, and the effects of morphology and area occupancy ratio on the lubrication and friction characteristics of the textures were investigated.

2. Experimental Methods

According to the existing friction lubrication theory, three kinds of micro-textures with unidirectional convergence were designed on the surface of cemented carbide specimens, that is, triangular texture, triangular groove texture, and semicircular ring texture. The effects of micro-texture morphology and area occupancy ratio on the friction characteristics of the friction pairs surface were investigated.
The cemented carbide specimens were firstly ground by hand, mechanically polished, and ultrasonically cleaned, and then the microscopic textures were designed on the surface of the cemented carbide specimens using a femtosecond laser device. The processing depth was maintained at about 30 μm; Table 1 shows the selection of the relevant parameters of the femtosecond laser device.
In the friction and wear test, the ring-disk friction pairs were selected. The upper specimen was a quenched steel ring, and the lower specimen was a cemented carbide disc with textures; Table 2 and Table 3 are some related parameters of cemented carbide and steel, respectively.
The area of the friction and wear zone is as follows:
S = π R 1 2 π R 2 2
where R1 is the outer diameter dimension of the steel ring and R2 is the inner diameter dimension of the ring. R1 = 7.25 mm and R2 = 4.95 mm are substituted into the above formula, and the area of the wear zone is S = 28.06π mm2.

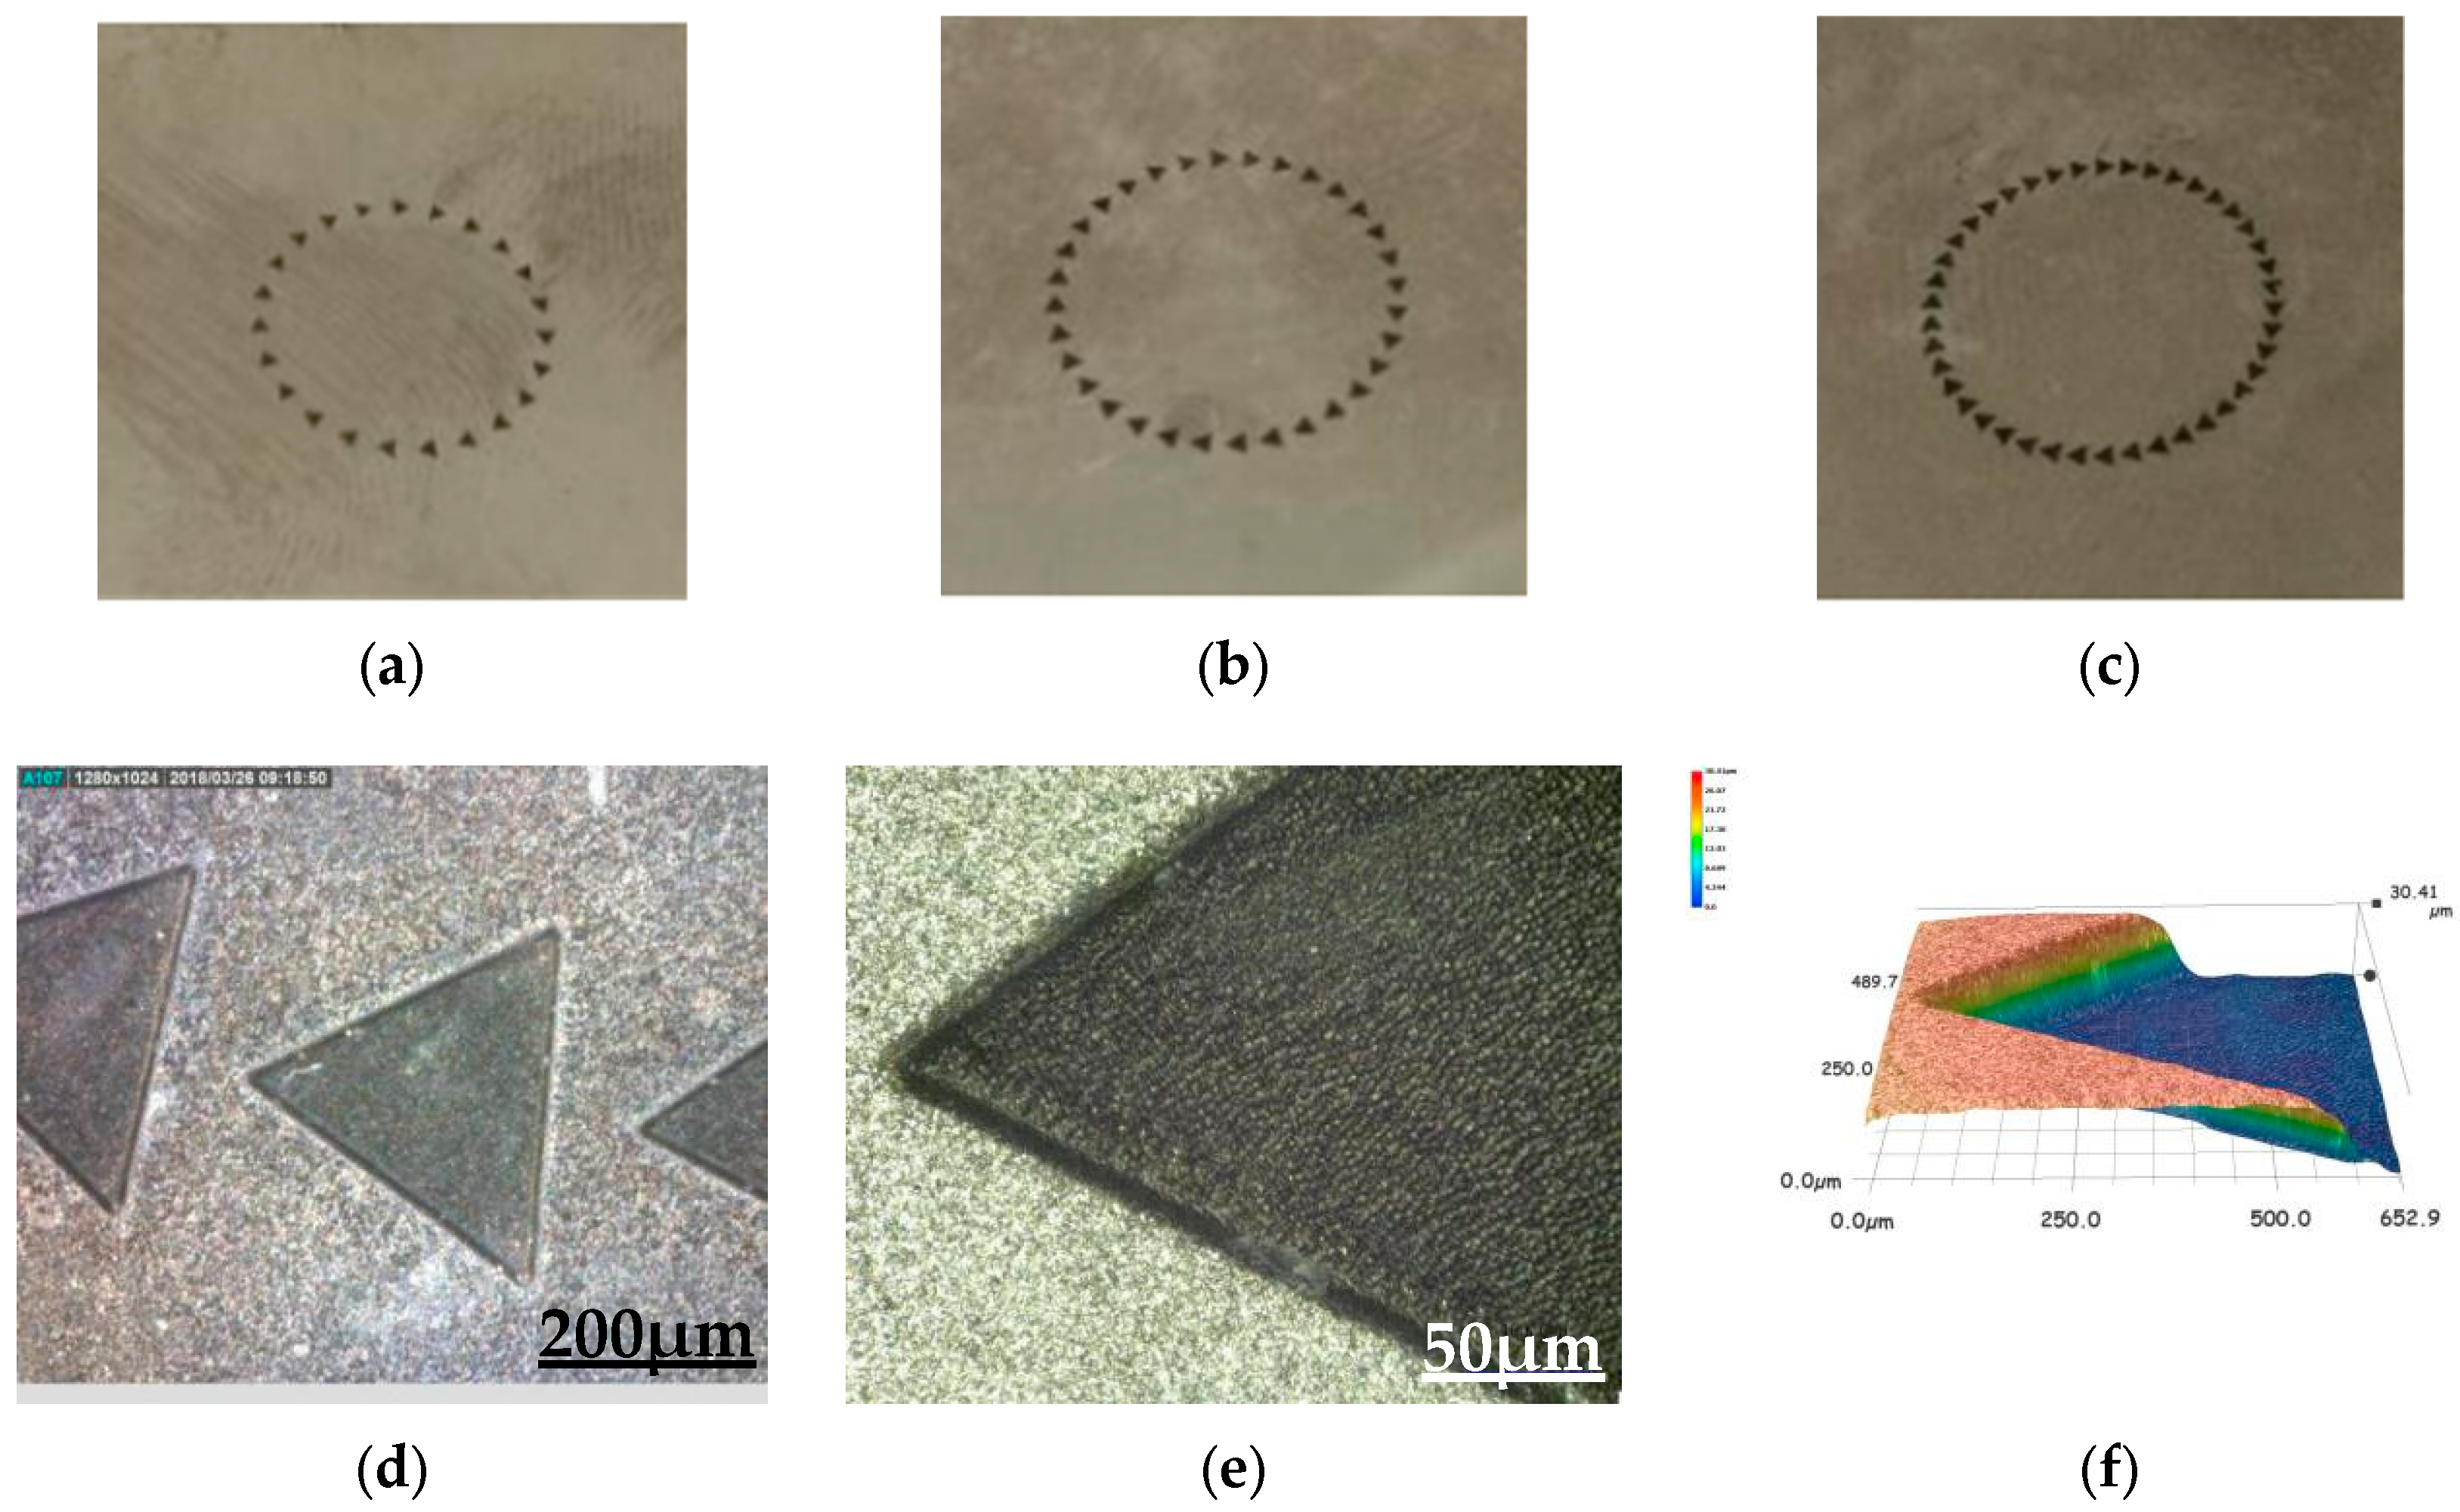
2.1. Design and Fabrication of Triangular Micro-Texture

Equilateral triangular textures with 0.8 mm edge lengths were fabricated on cemented carbide specimens and formed triangular micro-texture ring arrays. The area of triangular micro-texture is as follows:
S 1 = 3 4 a 2 = 3 4 0.8 2 = 0.277 m m 2
The area occupancy ratio of the triangular micro-texture array is calculated as follows:
η = n · S 1 S
where n represents the number of triangular micro-textures, and S1 = 0.277 mm2 and S = 28.06π mm2 are substituted into the above formula: η = n · 0.27 28.06 π .
The corresponding relationship between the number of triangular micro-textures and the area occupancy ratios of micro-texture arrays is shown in Table 4. Figure 1a–c depict triangular micro-texture arrays with area occupancy ratios of 7%, 10%, and 13%, respectively. Figure 1a–c show triangular micro-texture arrays with area occupancy ratios of 7%, 10%, and 13%, respectively. Figure 1d–f show the microscopic morphology of triangular micro-textures taken by the DINO-LITE microscope (Suzhou, China) and ultra-high accuracy microscope (Beijing, China).

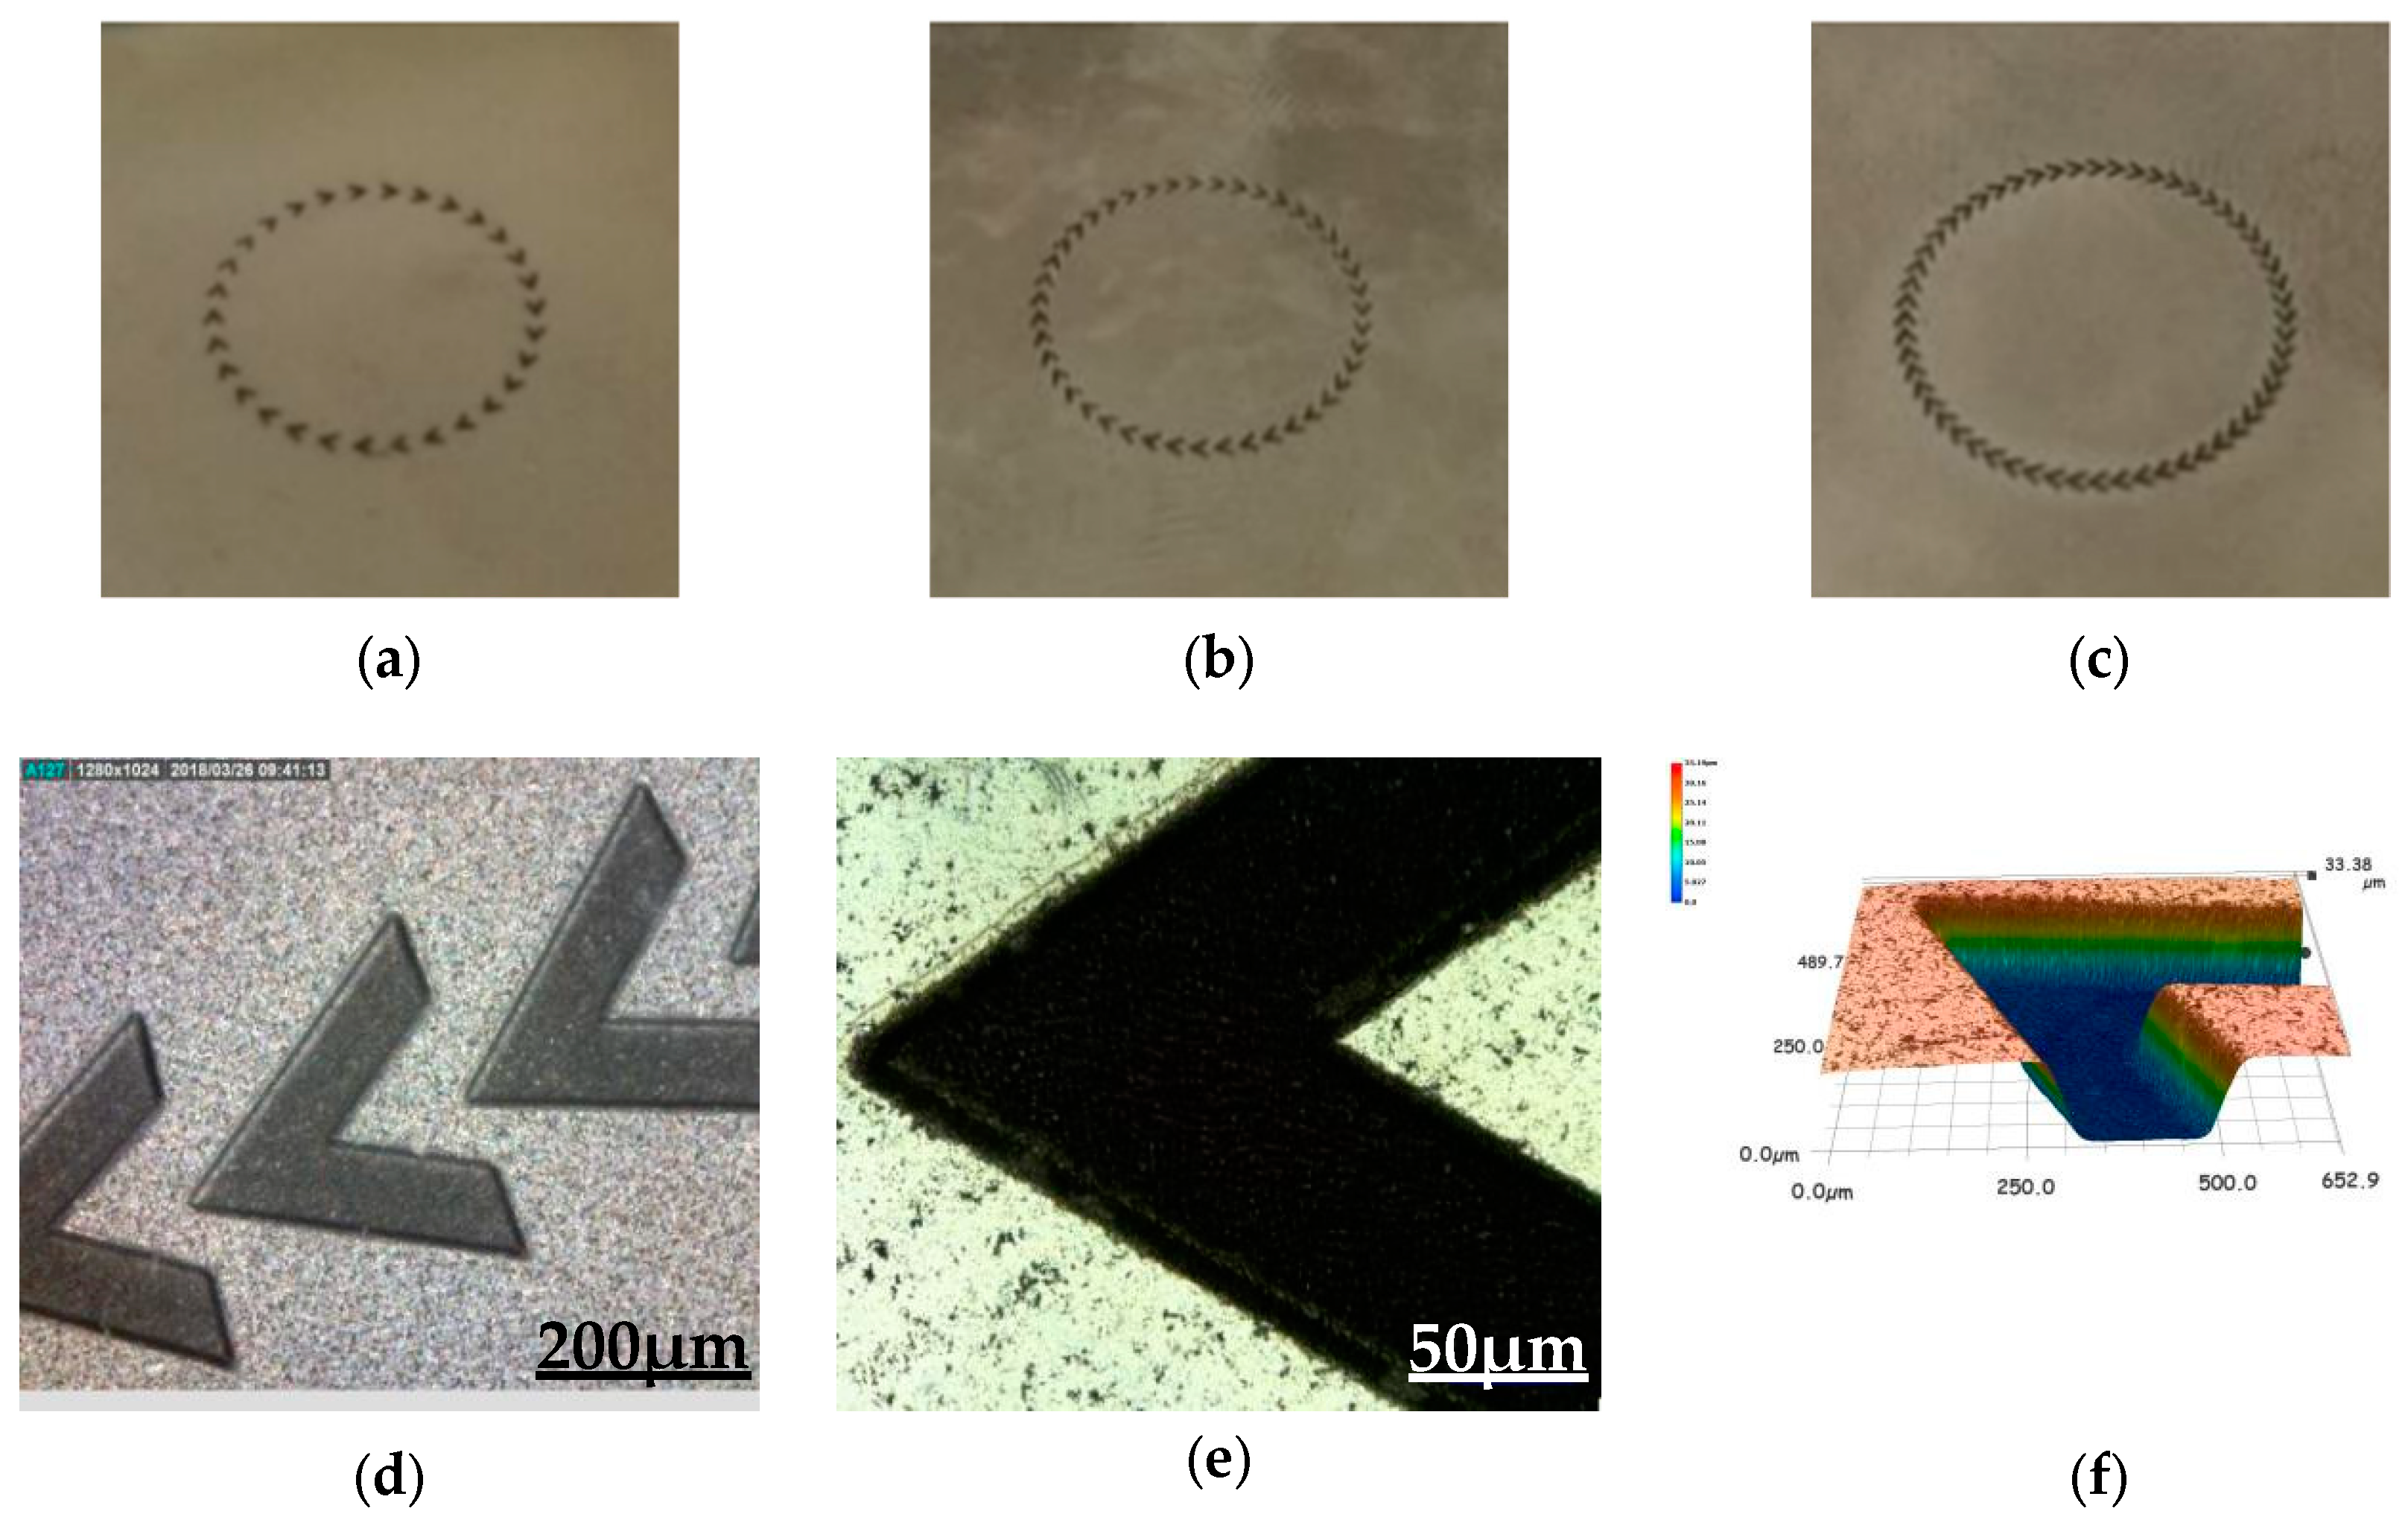
2.2. Design and Fabrication of Triangular Groove Micro-Texture

The triangular groove micro-texture is composed of two equilateral triangles with a side length of 0.8 mm and a side length of 0.4 mm. Its area is as follows:
S 2 = ( a 1 2 a 2 2 ) = 3 4 ( 0.8 2 0.4 2 ) = 0.208 m m 2
The area occupancy ratio calculation formula of the triangular groove micro-texture array is as follows:
η = n · S 2 S
where n represents the number of triangular groove micro-textures, and S2 = 0.208 mm2 and S = 28.06π mm2 are substituted into the above formula: η = n · 0.20 28.06 π .
The correspondence between the number of triangular groove micro-textures and the area occupancy ratios of the micro-texture arrays is shown in Table 5. Figure 2a–c show triangular groove micro-texture arrays with area occupancy ratios of 7%, 10%, and 13%, respectively. Figure 2d–f show the microscopic morphology of triangular groove micro-textures taken by the DINO-LITE microscope and ultra-high accuracy microscope.

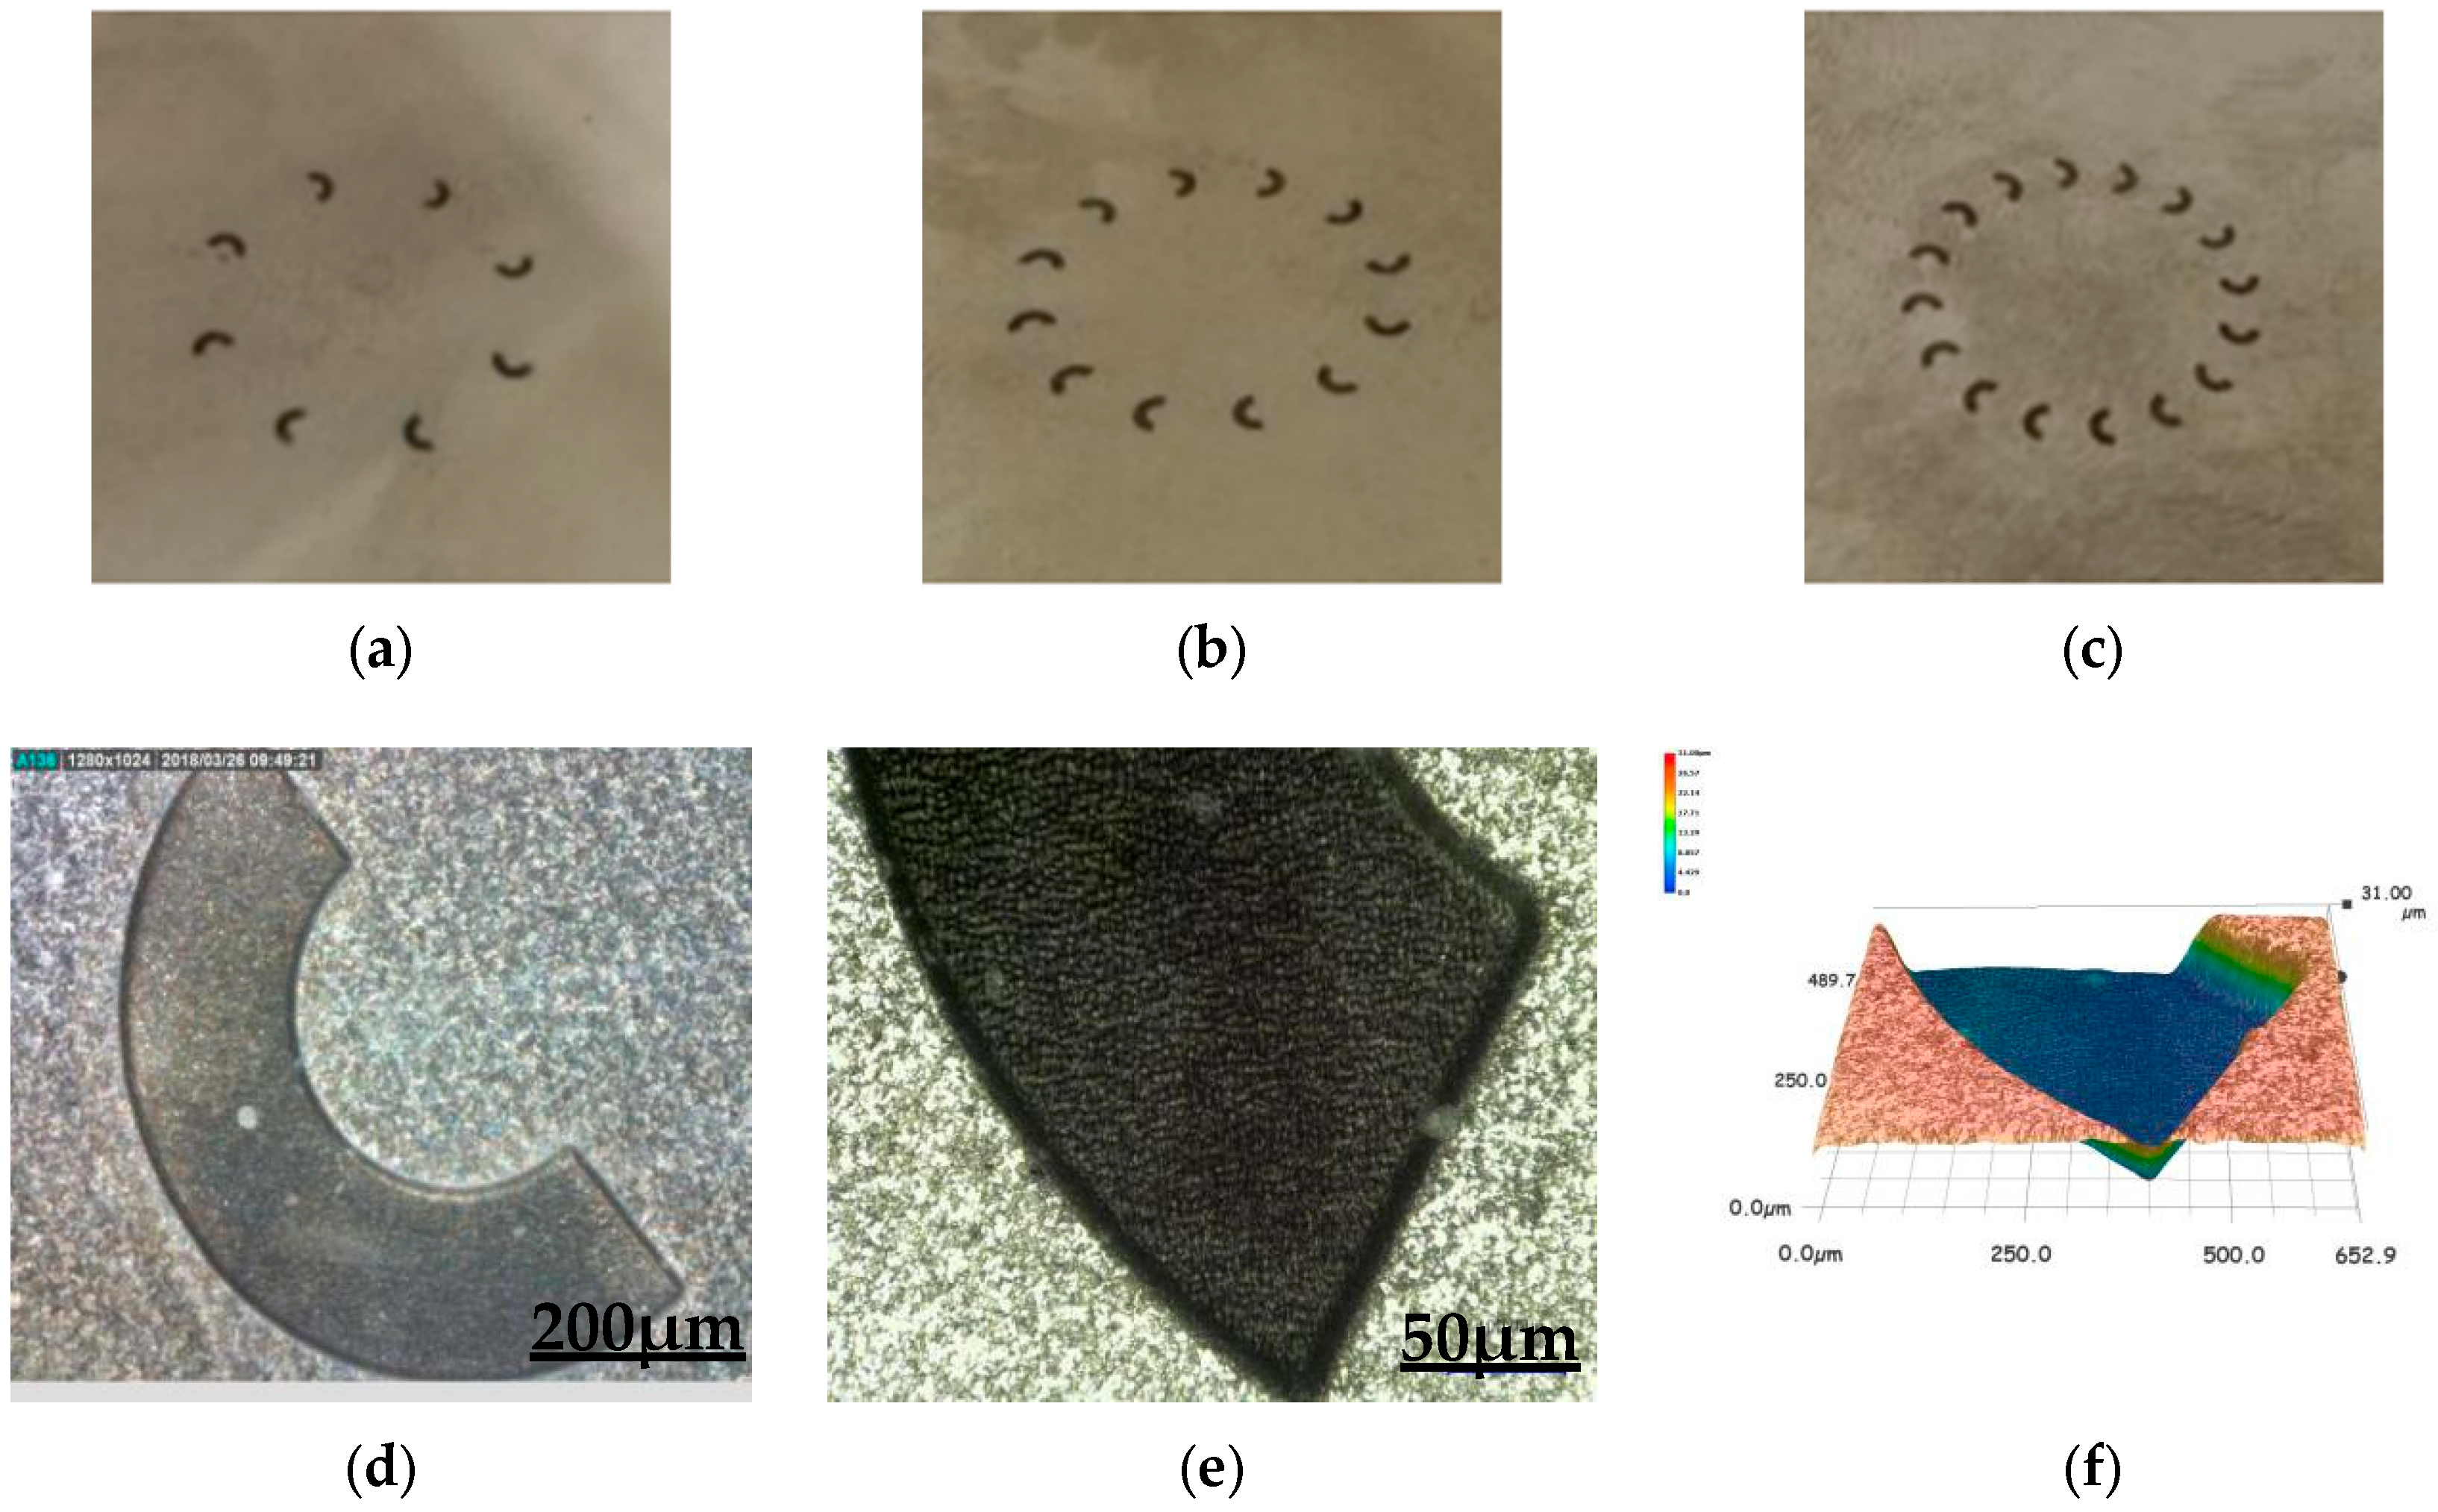
2.3. Design and Fabrication of Semicircular Ring Micro-Texture

The semicircular ring texture consists of an outer half circle with a radius of 0.8 mm and an inner half circle with a radius of 0.4 mm. The area of the texture is as follows:
S 3 = π 2 ( R 1 2 R 2 2 ) = π 2 ( 0.8 2 0.4 2 ) = 0.754 m m 2
The calculation formula for the area occupancy ratio of the semicircular ring micro-texture array is as follows:
η = n · S 3 S
where n represents the number of semicircular ring micro-textures, and S3 = 0.754 mm2 and S = 28.06π mm2 are substituted into the above formula: η = n · 0.75 28.06 π .
The correspondence between the number of semicircular ring micro-textures and the area occupancy ratios of the micro-texture arrays is shown in Table 6. Figure 3a–c show semicircular ring micro-texture arrays with area occupancy ratios of 7%, 10%, and 13%, respectively. Figure 3d–f show the microscopic morphology of semicircular ring micro-textures taken by the DINO-LITE microscope and ultra-high accuracy microscope.
It can be seen that the three kinds of micro-textures have very clear outlines of morphologies, and the bottoms of the textures are very flat, which meets the expected design requirements. It can be seen from the 3D displays taken by the ultra-high accuracy microscope that the surface around the textures does not fluctuate greatly and the roughness of the surface is relatively small. The change of the surface roughness caused by texture processing is not great, which has little influence on the later friction and wear tests.

3. Fluid Simulation Analysis of Micro-Texture

When there is lubricating fluid between the friction pairs, the bearing capacity of the lubricating film is an important factor affecting the friction and lubrication condition of the surface of the friction pairs. The convection effect and hydrodynamic pressure effect generated when the lubricating fluid flows through the micro-textures can increase the surface positive pressure value of the lubricating film at the convergence wedge of the micro-textures to a certain extent, thereby improving the bearing capacity of the lubricating film.
Fluent fluid simulation was carried out on the triangular texture, triangular groove texture, and semicircular ring texture; the hydrodynamic lubrication effects of the three micro-textures with unidirectional convergence were compared and analyzed.

3.1. Standard k-ε Model

When the fluid flows through the micro-textures, the adjacent flow layers display both a sliding in the velocity direction and a pulsation perpendicular to the direction of the flow velocity, so the fluid type is set to be turbulent. The k-ε two-equation model was proposed in 1974 by a research team led by Professor Spalding of the British Imperial College, and became the most widely used turbulence model. The k-ε model assumes that turbulent viscosity is related to turbulent kinetic energy and dissipation rate. The standard k-ε equation is of the following form [15]:
ρ d k d t = d t [ ( μ + μ t x i ) k x i ] + G k + G b ρ ε Y M
ρ d ε d t = x i [ ( μ + μ t σ ε ) ε x i ] + C l ε ε k ( G k + C 3 ε G b ) C 2 ε ρ ε 2 k
In the formula: k, ε are the turbulent kinetic energy and turbulent dissipation rate, respectively. ρ is the density; t is the time; and Gk and Gb are the turbulent flow energy affected by the velocity and buoyancy, respectively. μt is the viscosity coefficient; YM is the degree to which the dissipation rate is affected by the pulsation expansion; σk and σε represent the Prandtl numbers of the turbulent flow energy k and the dissipation rate ε, respectively. The constants C, C, and C are 1.44, 1.92, and 0.09 in Fluent, respectively.

3.2. Determination of Boundary Conditions

In order to study the hydrodynamic pressure effect generated when the fluid flows through the micro-textures, the fluid simulation was performed on the triangular texture, the triangular groove texture, and the semicircular ring texture under the same characteristic parameters.
The fluid parameters are set in the material properties. In order to correspond to the friction and wear test conditions, the fluid is Mobil No. 1 lubricant, which has a density of 900 kg/m3 and a viscosity of 0.045 Pa·s. The fluid type is set to turbulent flow and the standard k-ε model is selected. The boundary conditions are the inlet pressure and the outlet pressure, and the reference pressure at the inlet is calculated by P = F/S. Combined with the friction and wear test, the loading force F is 300 N, the wear area S is 28.06π mm2, the reference pressure at the inlet of the fluid is about 3.403 MPa, and the reference pressure at the outlet is taken as the atmospheric pressure of 101,325 Pa.

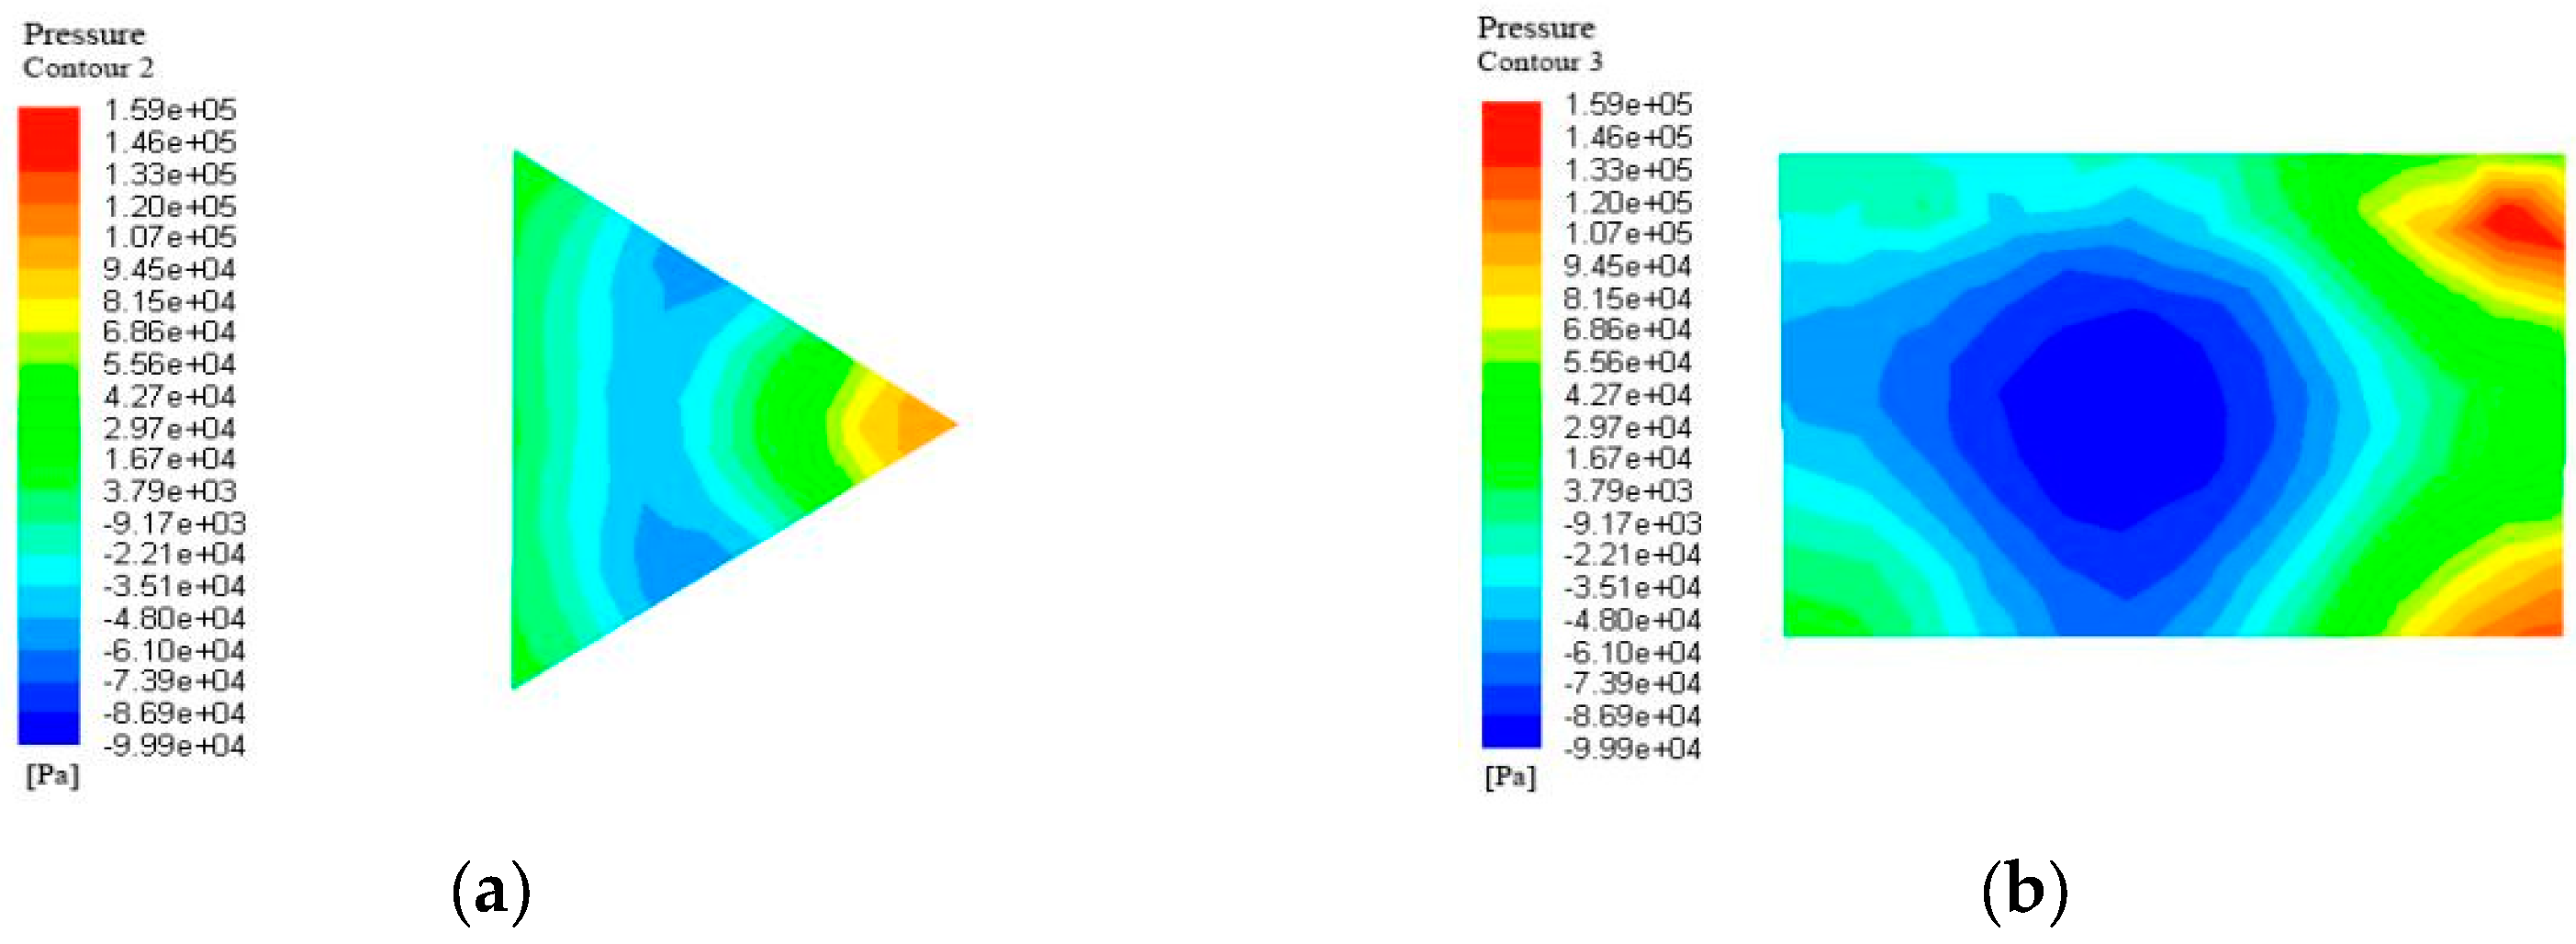
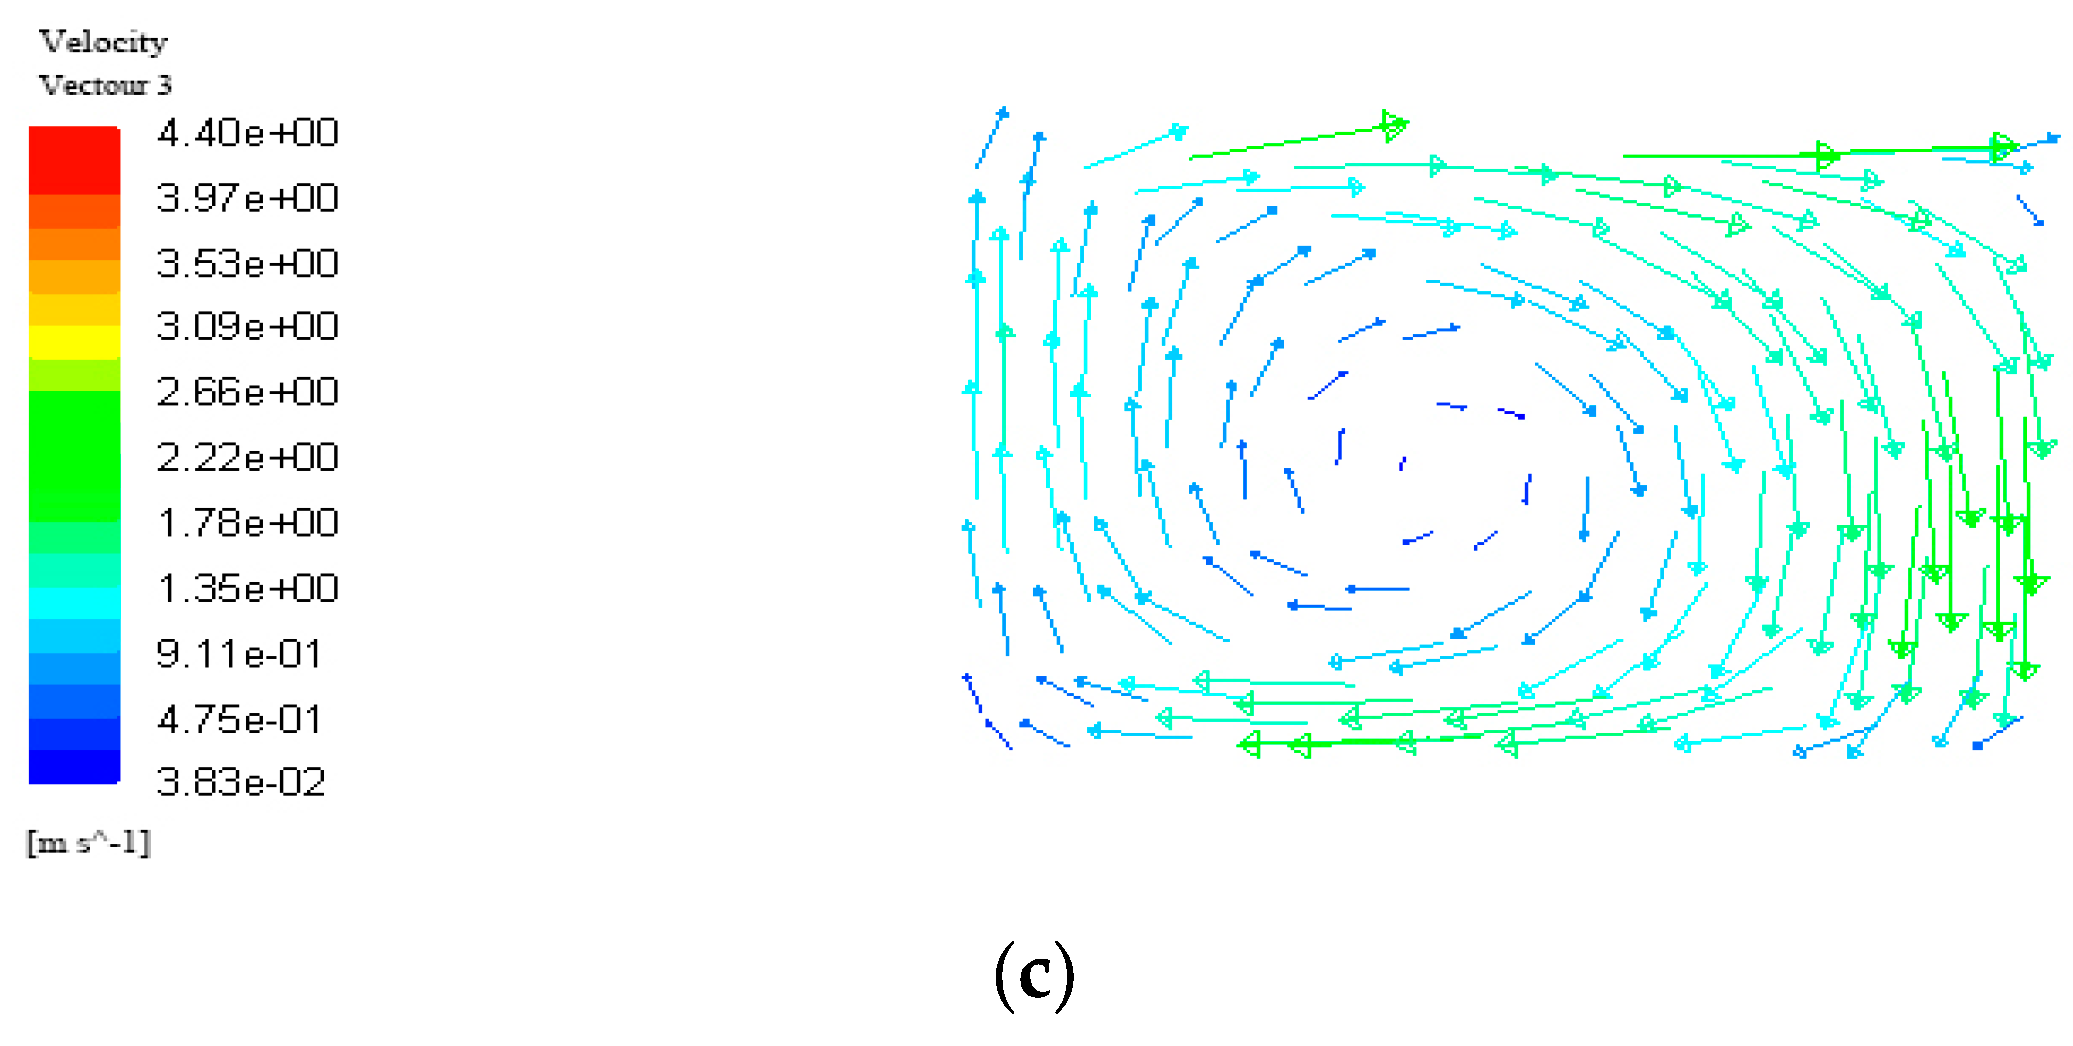
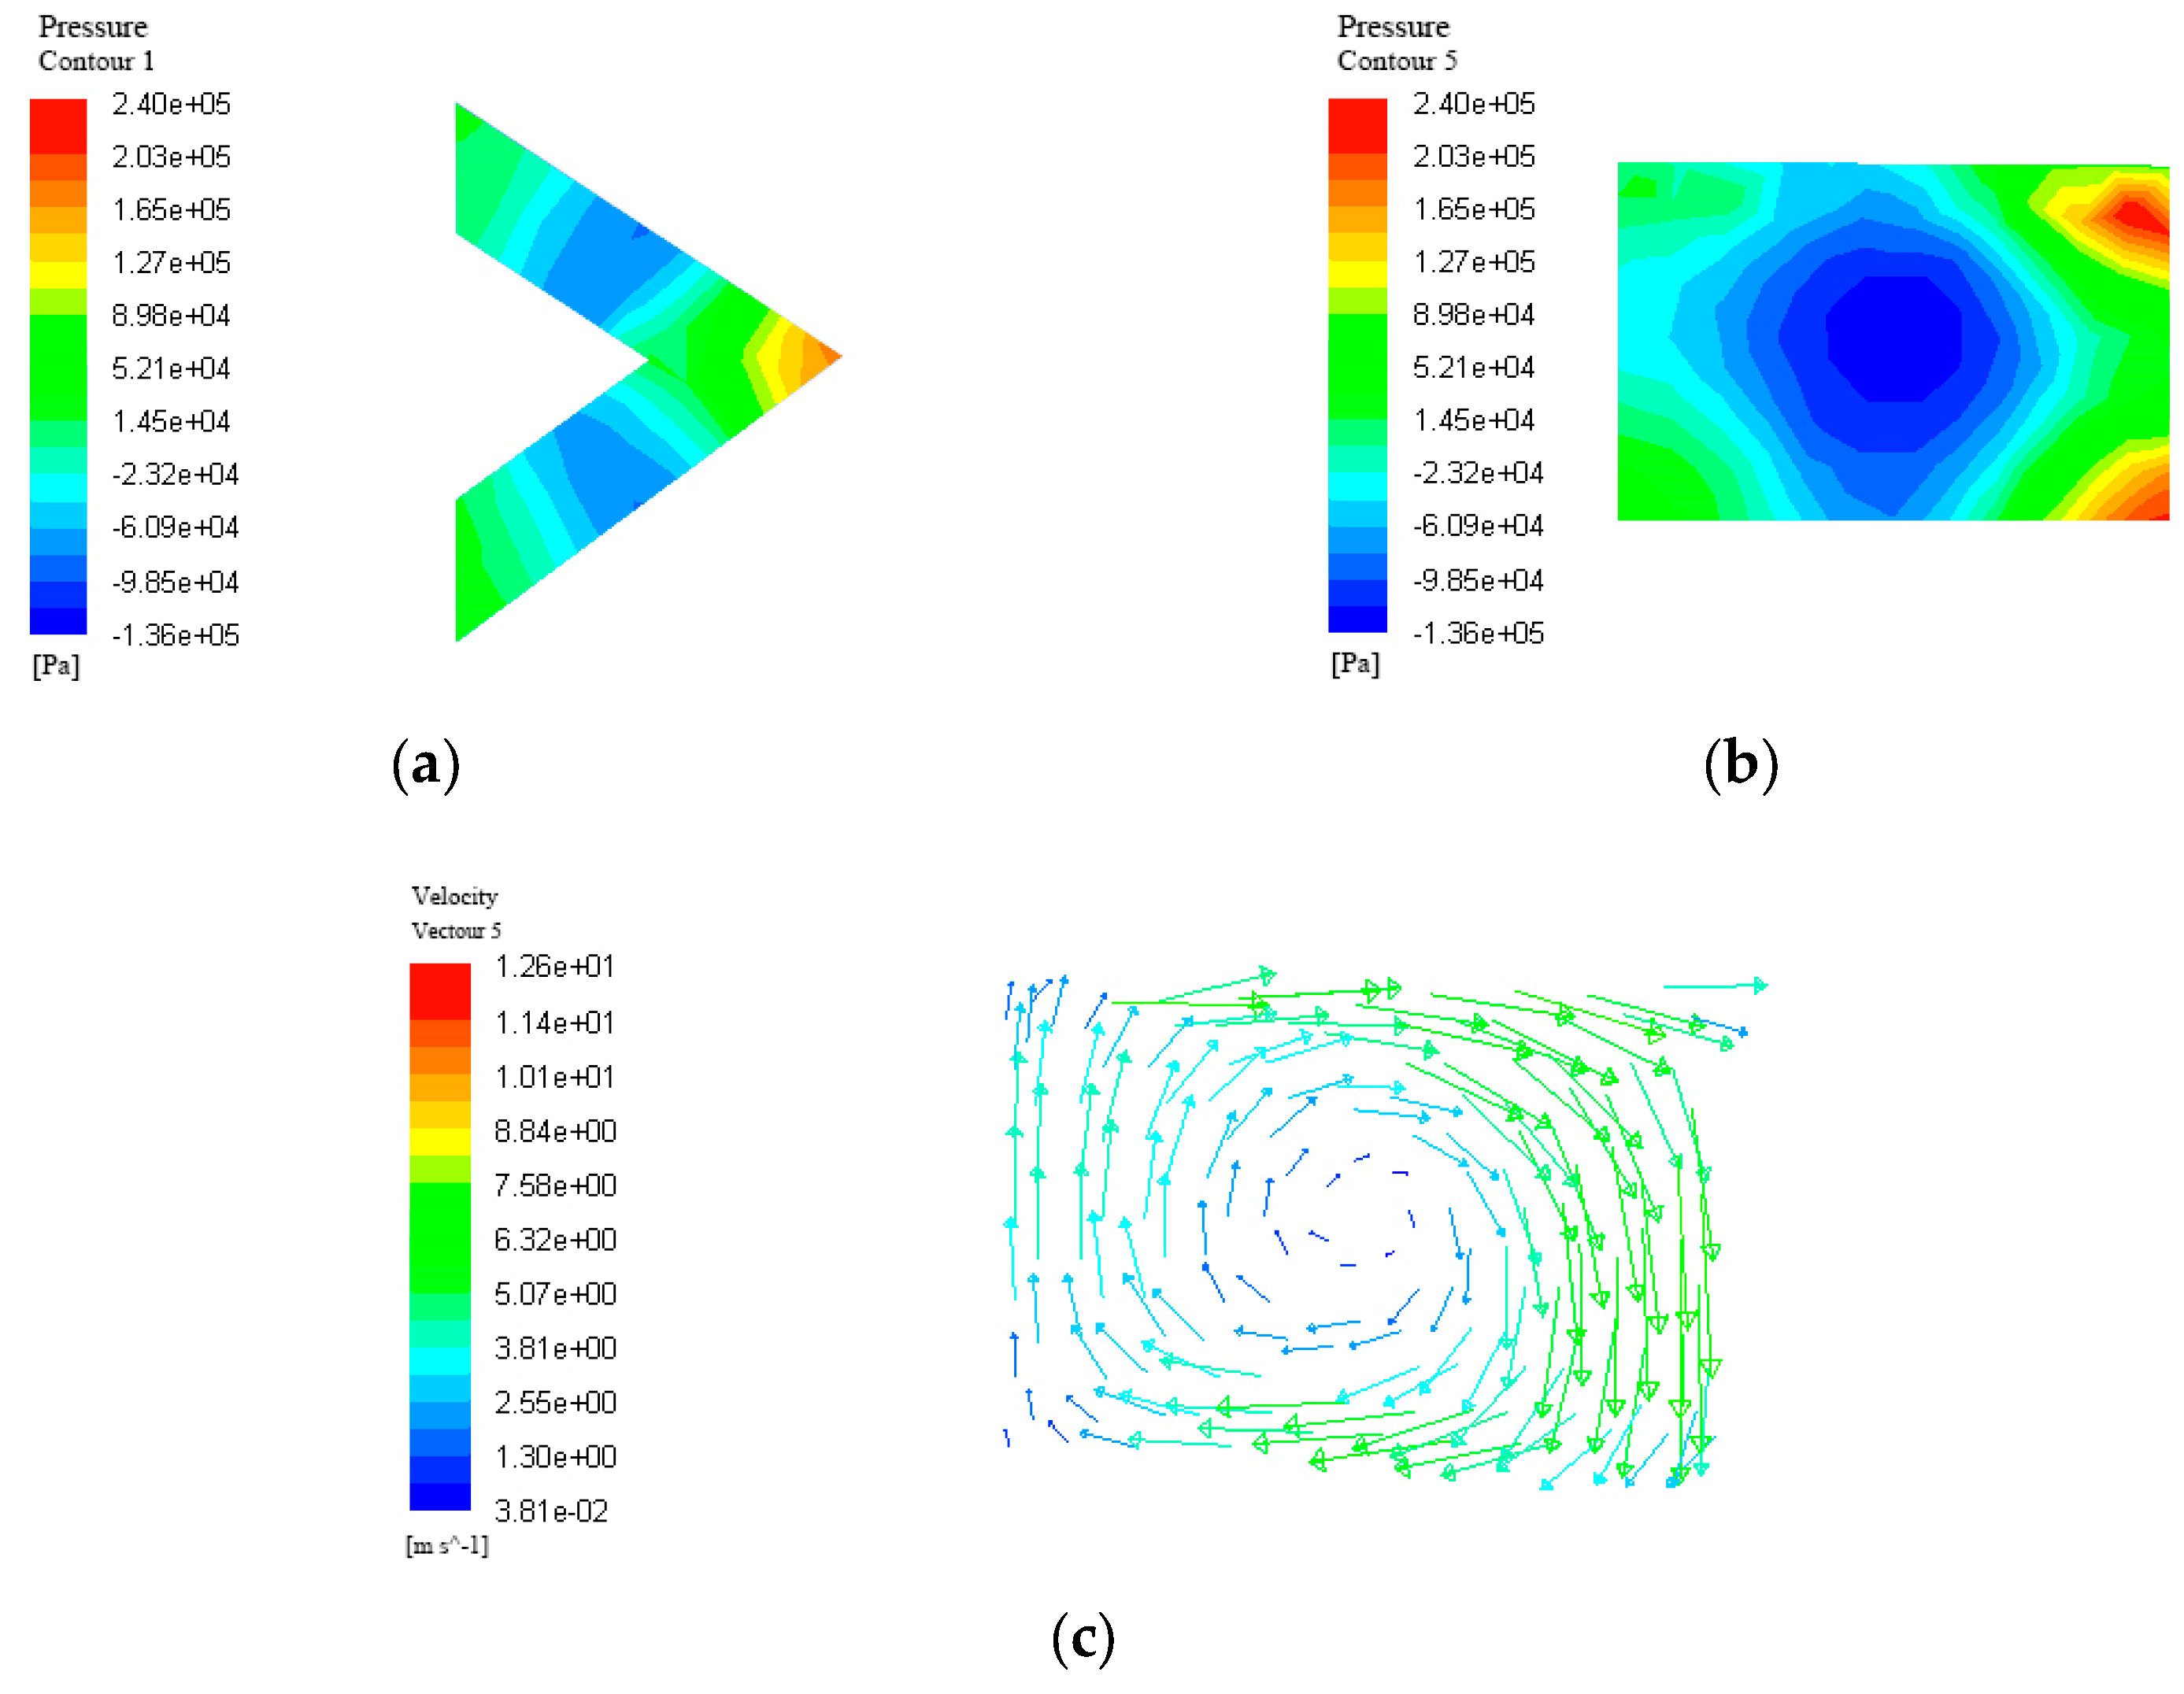
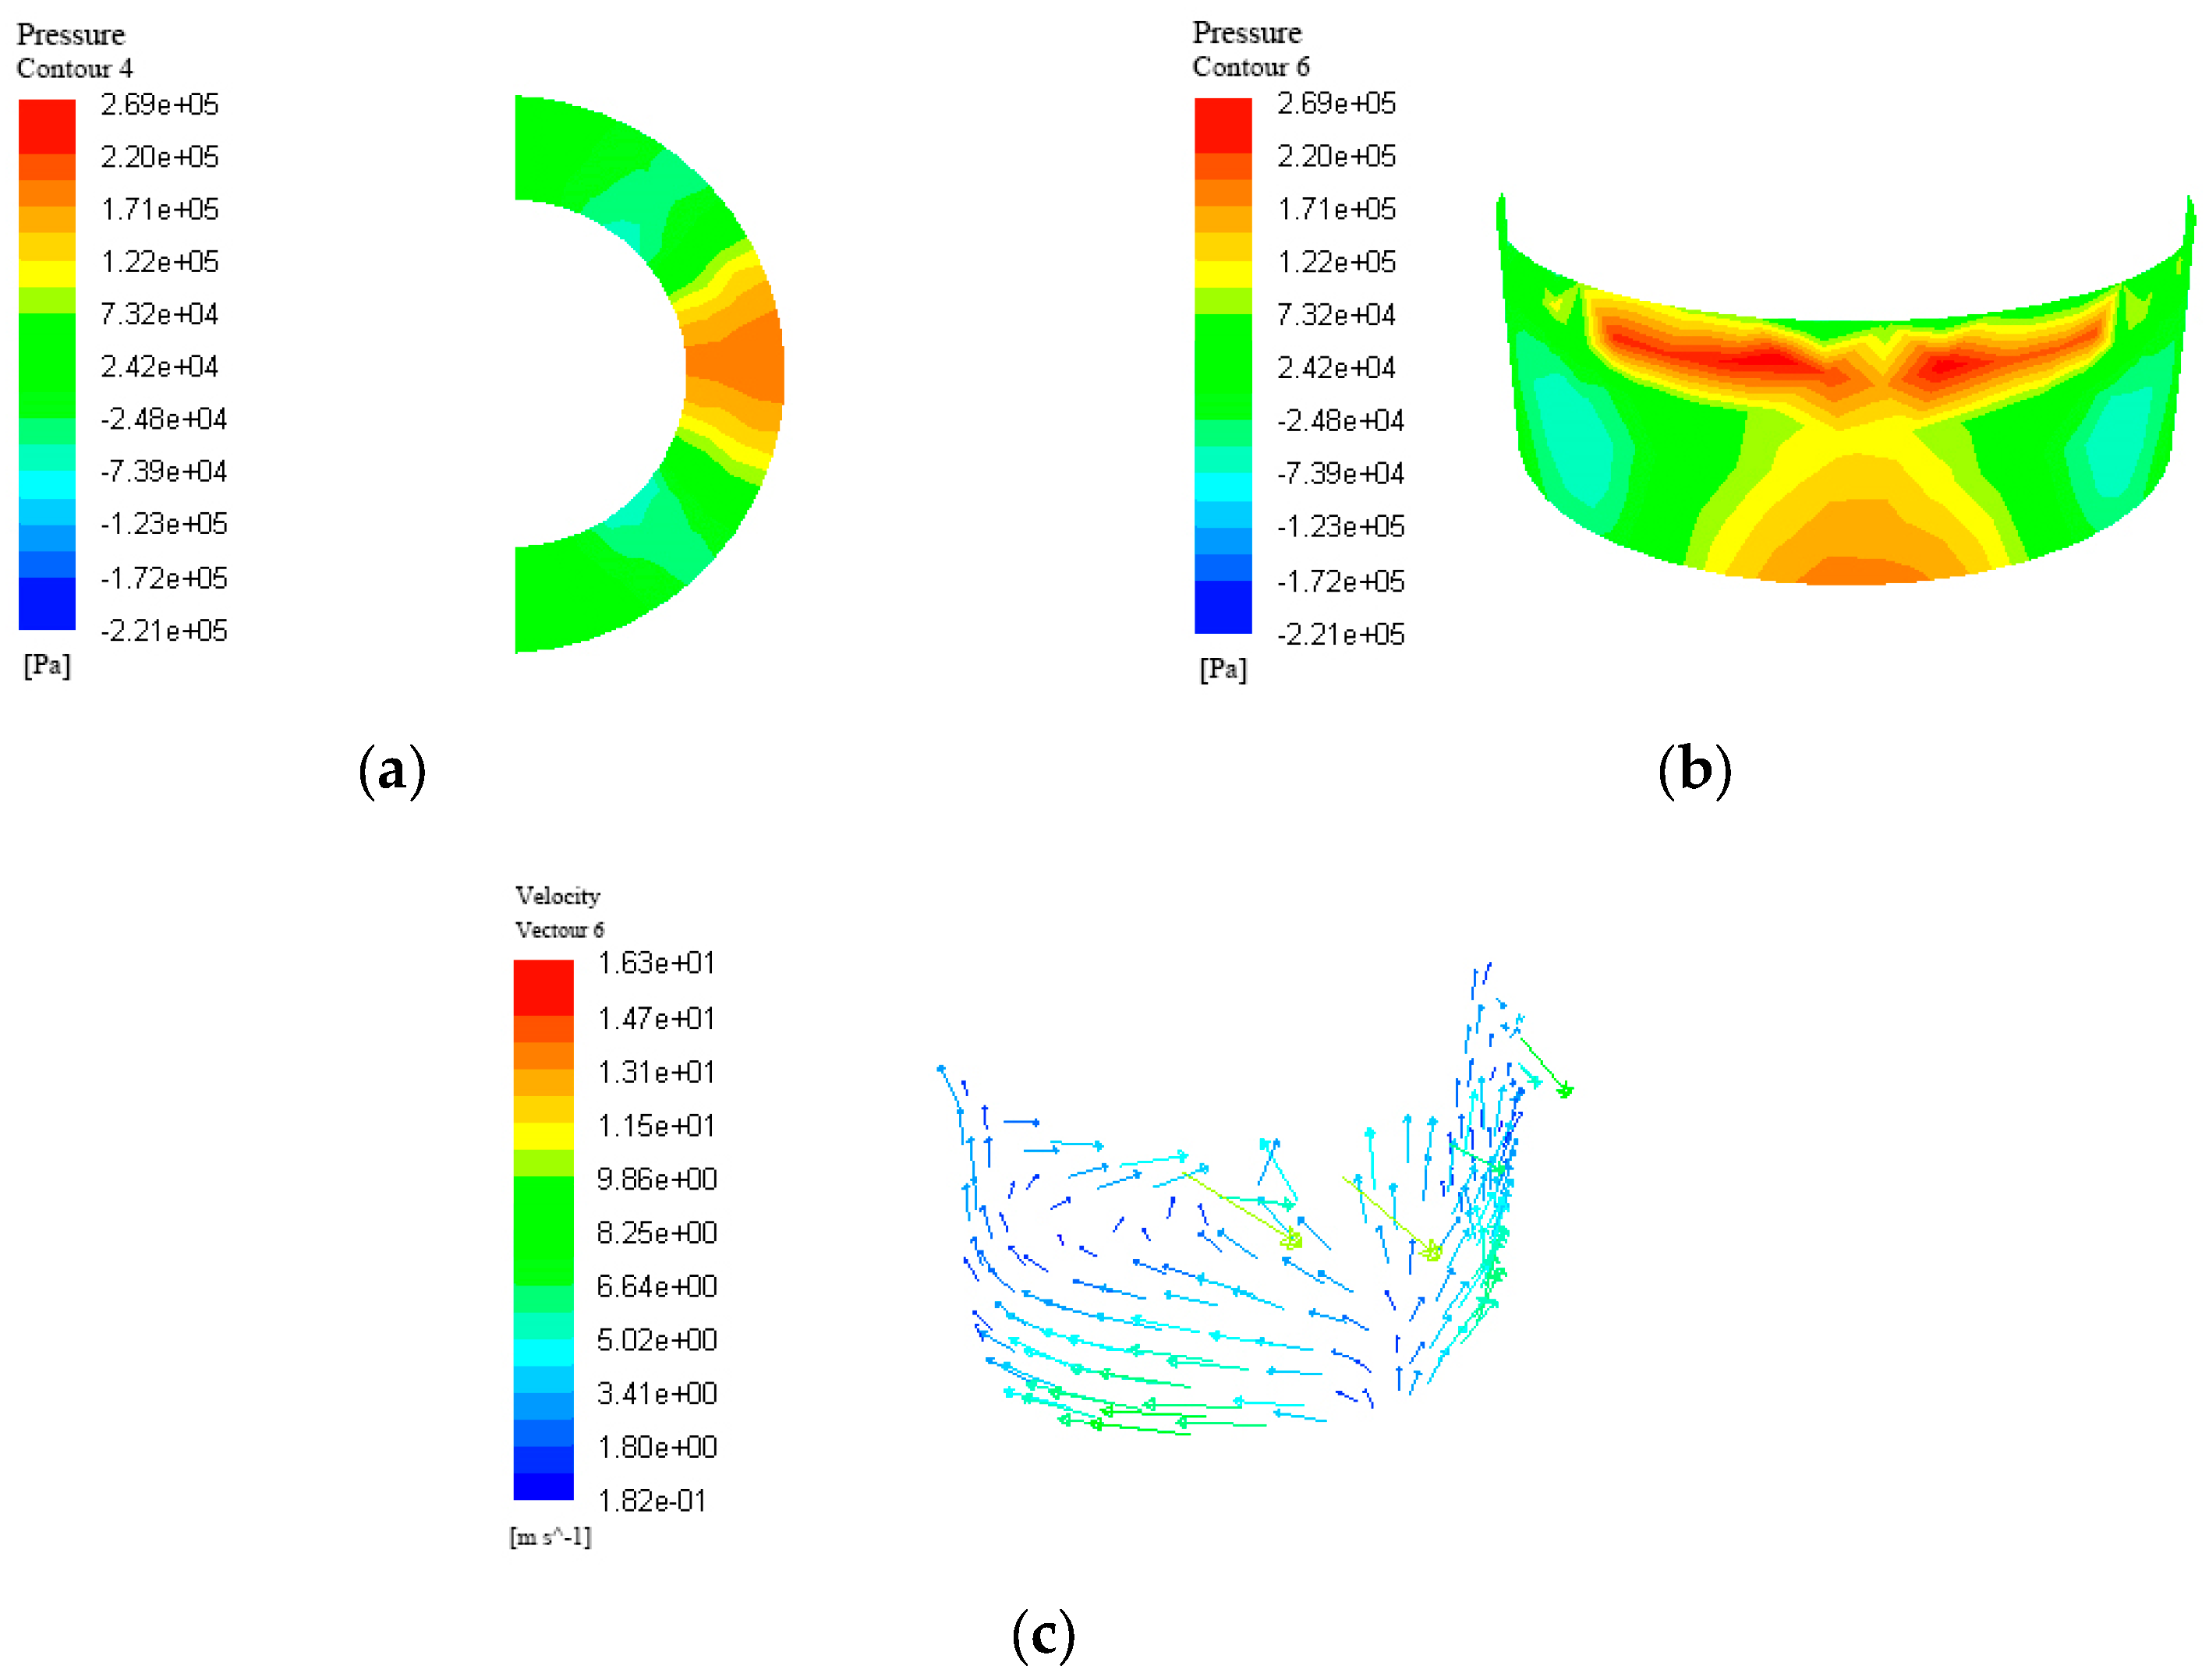
3.3. Pressure and Velocity Distribution of Fluid in Textures with Different Morphologies

The surface pressure and velocity of fluid flowing through different micro-textures were analyzed to compare the hydrodynamic lubrication effect of fluid in textures with different morphologies.
Figure 4 shows the distribution of fluid pressure and velocity vector in the cross-sectional and longitudinal section of fluid flowing through a triangular micro-texture. In Figure 4b, the longitudinal section passes through the vertex angle and the midpoint of the bottom edge of the texture, and the flow direction of the fluid is to the right. At the vertex angle of the triangular convergence wedge, the fluid has a relatively high positive pressure and a pressure gradient in the depth direction, a negative pressure occurs in the texture, and there is a backflow phenomenon. It can be seen from the speed vector distribution that a portion of the fluid flows to the right exit of the triangle and the remainder flows back into the texture.
From the cross-sectional pressure distribution of fluid in the triangular groove texture in Figure 5a, it can be seen that there is a distinct pressure gradient along the convergence direction of the triangular groove, and the positive pressure is higher at the vertex angle of the right side. Figure 5b shows the pressure distribution of the longitudinal section of the fluid in the triangular groove texture; the longitudinal section passes through the vertex angle and the midpoint of the bottom edge of the texture. There is an obvious reflux phenomenon in the texture, and there is a large positive pressure at the outlet of the convergent wedge, while the pressure at the divergent wedge is significantly lower than that at the convergent wedge, or even negative pressure. From the longitudinal section speed vector distribution of Figure 5c, the fluid velocity near the convergence wedge is significantly higher than the fluid velocity near the divergence wedge, and the flow direction is clockwise, resulting in the generation of backflow in the texture.
Figure 6 shows the distribution of pressure and velocity vector in the cross-section and longitudinal section of the fluid in the semicircular ring texture. The longitudinal section shown in Figure 6b is the outer annular surface of the semicircular ring texture. From Figure 6a, it is found that a significant fluid pressure gradient occurs in the direction of convergence of the semicircular ring, and the positive pressure value at the right exit convergence wedge position is higher. It can be seen from the longitudinal section pressure distribution in Figure 6b that the pressure at the top and bottom of the fluid is larger at the exit side of the texture, while the pressure at the middle portion is relatively small. Combined with the velocity and direction of the fluid in Figure 6c, this distribution of pressure and flow velocity further promotes the generation of backflow in the texture, and the convection effect in the semicircular ring texture is more pronounced.
In summary, when the fluid flows through the triangular micro-texture, the triangular groove micro-texture, and the semicircular ring micro-texture with unidirectional convergence, a pressure gradient is generated along the convergence direction, and there is a reflux phenomenon in the texture. The convection effect caused by the unidirectional convergence of the morphology also promotes the fluid reflux in the texture, and the pressure produced by the reflux is negative. The positive pressure at the convergent wedge of the semicircular ring outlet is larger than that at the triangular groove outlet, and the positive pressure at the triangular groove outlet is larger than that at the triangular outlet. There is a large negative pressure in the semicircular ring texture, triangular groove texture, and triangular texture, but the convergence wedge at the right exit of the semicircular ring has a relatively high positive pressure value, and the hydrodynamic pressure effect is more significant.

4. Friction and Wear Test of Textured Surface

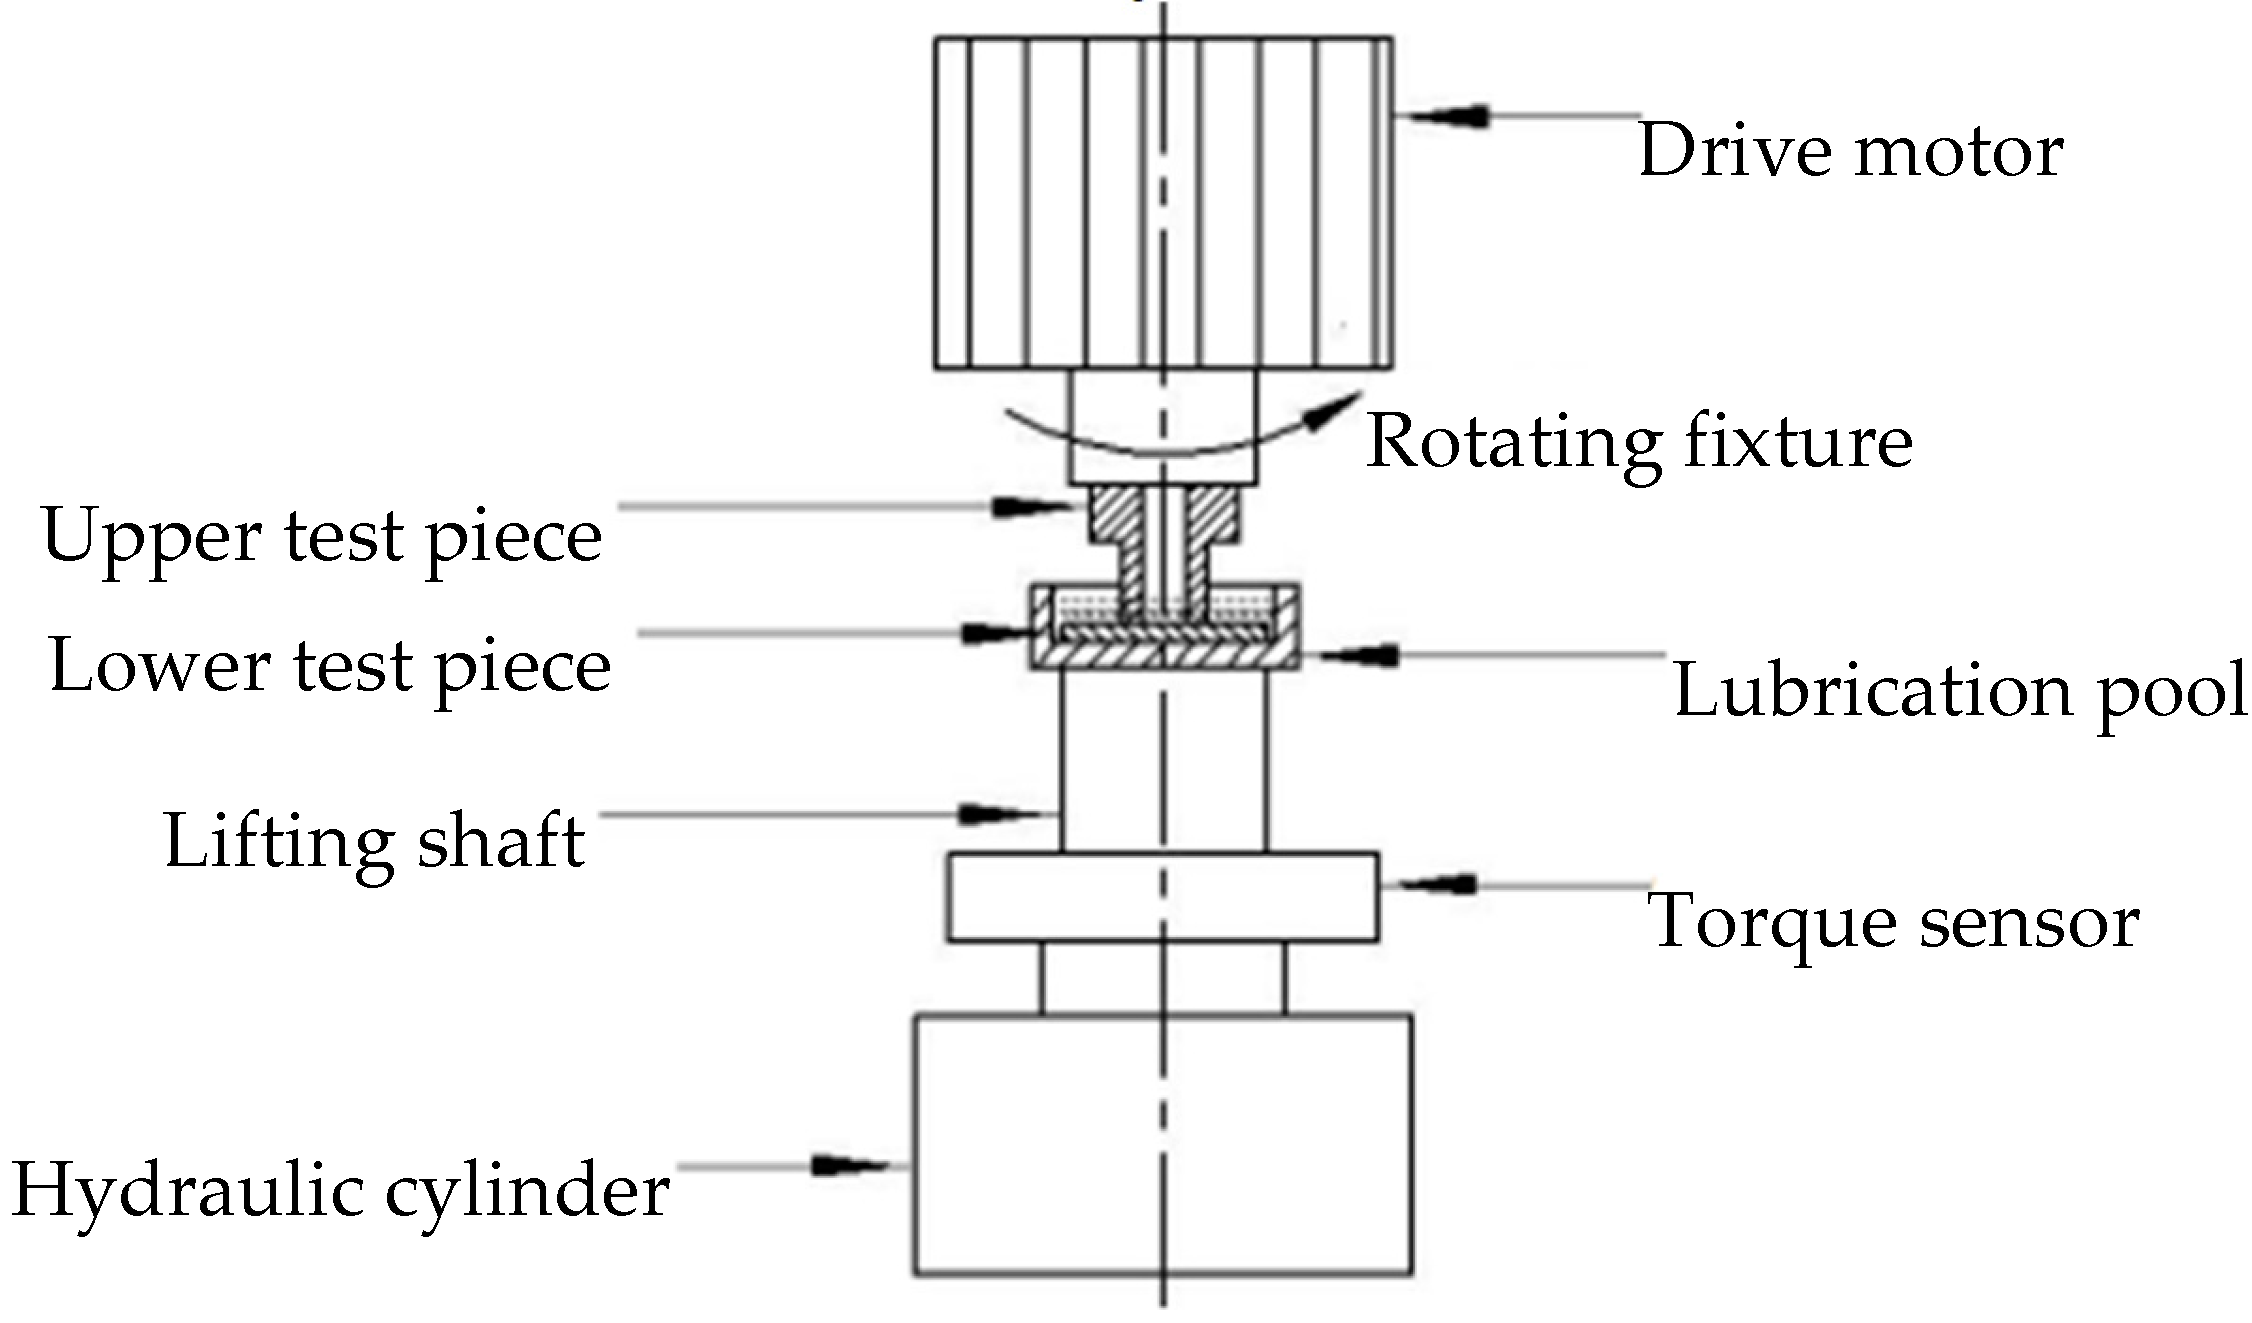
4.1. Friction and Wear Test Equipment

The surface particle detachment, the formation of the peeling pit, and the generation of cavitation during the wear process lead to complicated contact of the surface of the friction pairs, which has a certain degree of influence on the stability of the fluid, so the results obtained by simulation analysis are relatively one-sided and microscopic. The dynamic pressure lubrication effect produced by the texture arrays is not fully represented by the simulation results. Therefore, the friction and wear tests were carried out on the textured samples with different morphologies and area occupancy ratios, and the effects of micro-texture morphology and area occupancy ratio on the lubrication performance were analyzed.
MMG-10 friction and wear tester was selected to carry out the experiment; the working principle is shown in Figure 7. By comparing the surface friction coefficients of cemented carbide polished specimens and micro-textured specimens with different morphologies, the effects of micro-texture morphology, area occupancy ratio, experimental force, and rotational speed on the friction characteristics of the textured surface were analyzed.
In the friction and wear test, the spindle clamp and the steel ring rotated clockwise, which was consistent with the convergence direction of the texture array, and the textured specimens were immersed in the lubricating fluid. The device can record test data such as instantaneous load, friction, and friction coefficient in real time.

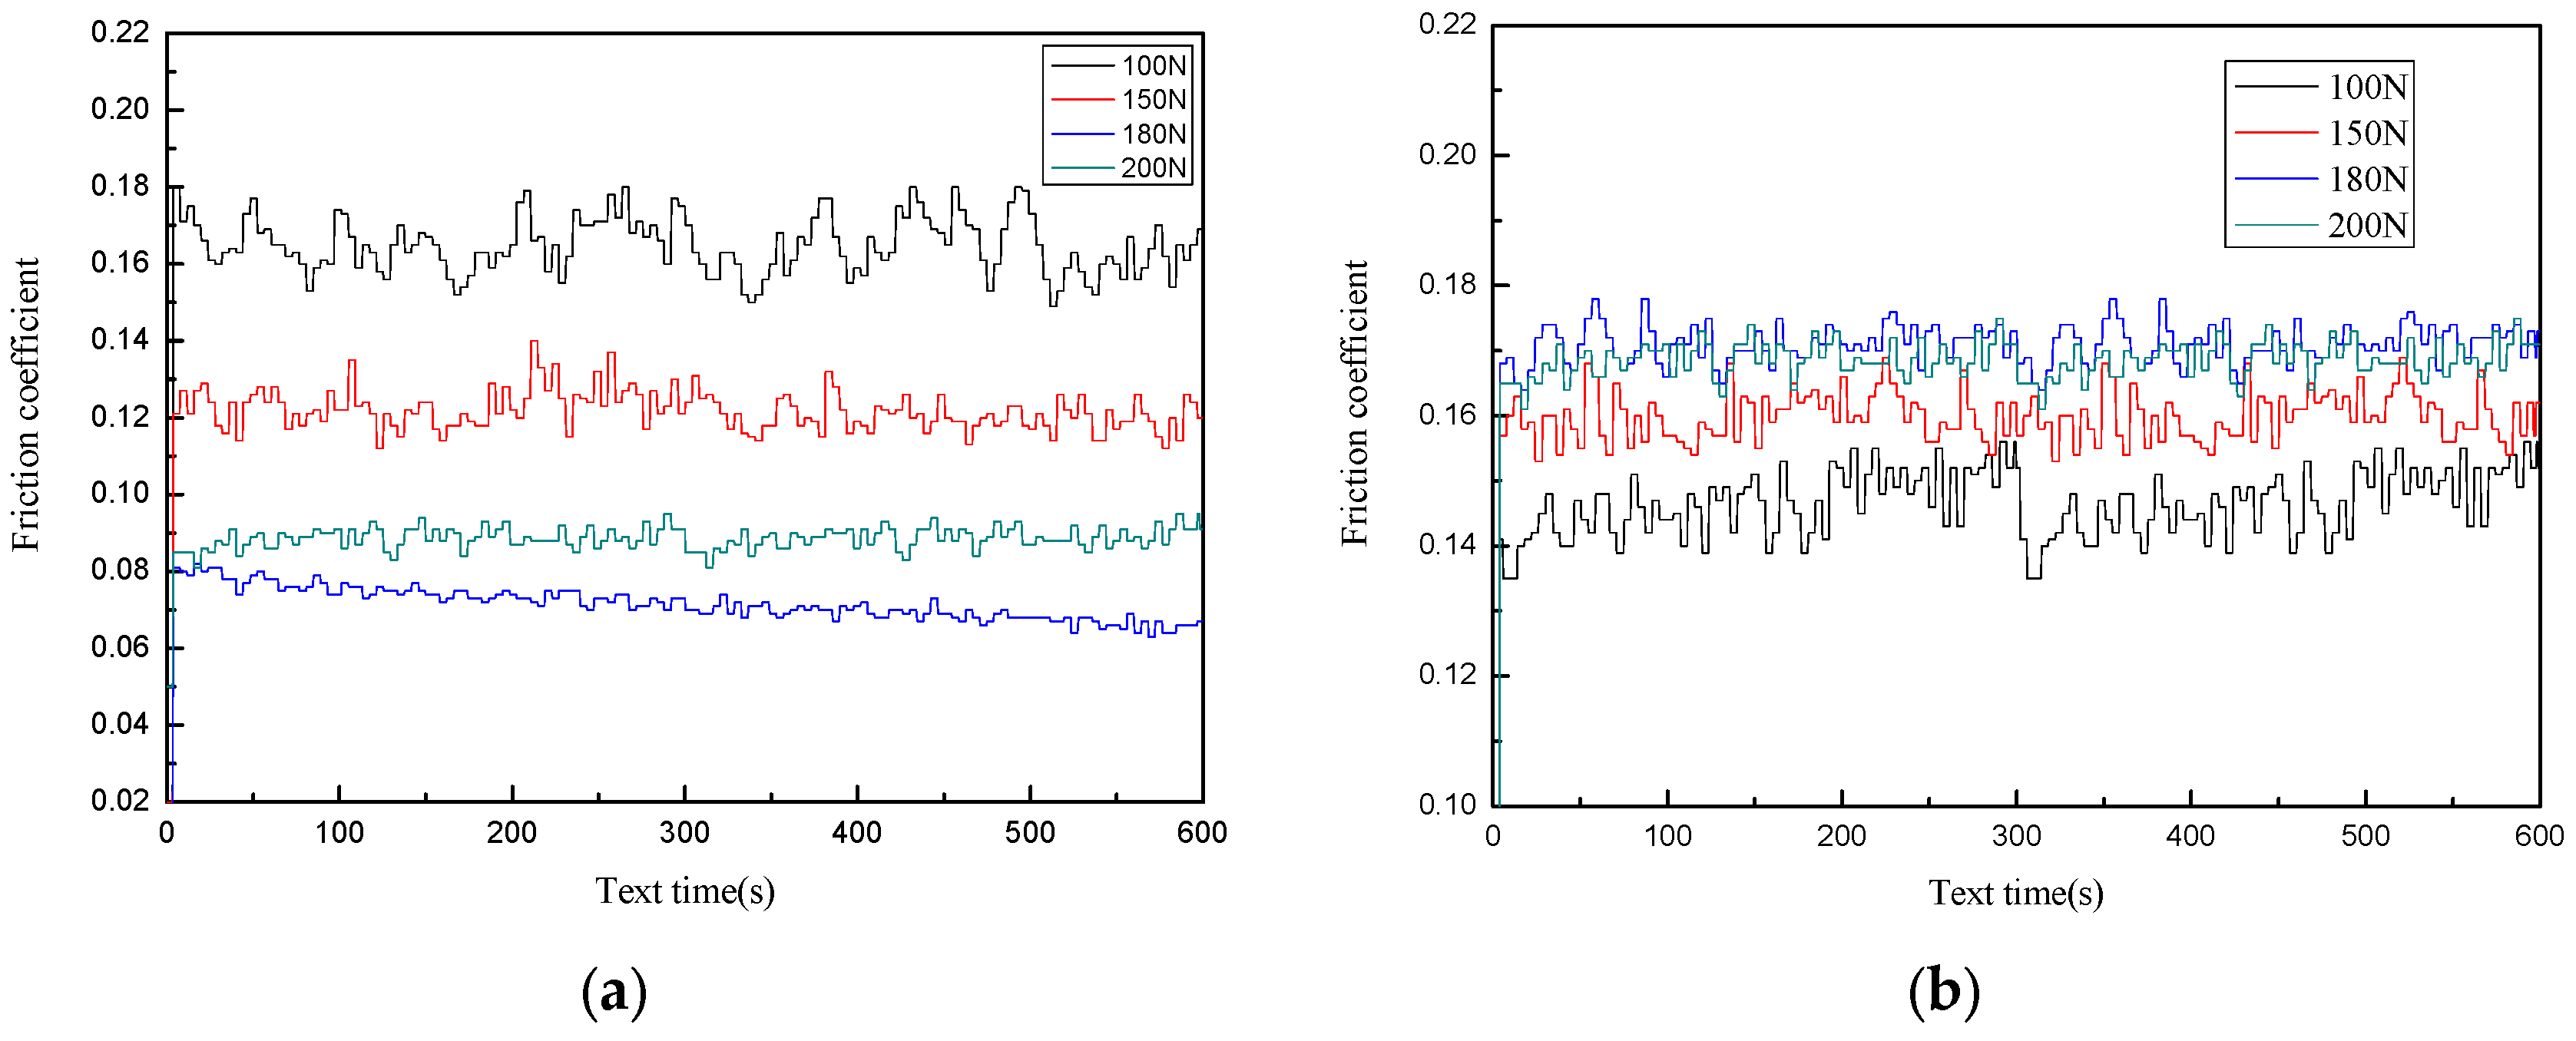
4.2. Friction Coefficients of Unpolished Sample and Polished Sample

The friction coefficients of unpolished samples and polished samples were compared under the condition of oil lubrication. The rotational speed was 150 rpm, and the influence of the surface roughness of the samples on the friction performance was analyzed. Figure 8 shows the surface friction coefficients of unpolished samples and polished samples.
In Figure 8, it can be seen that the friction coefficient of polished cemented carbide samples under different loads shows a similar trend as a whole under the condition of lubricating oil, and the specific value fluctuates between 0.14 and 0.18. When the experimental force is 180 N, the friction coefficient of the surface of the unpolished sample is about 0.07, and the friction coefficient of the surface of the polished sample is about 0.17. Because the unpolished sample has a high surface roughness, and the surface has a large number of irregular microscopic features, such as protrusions and depressions, it can promote the dynamic pressure lubrication effect of the fluid to a certain extent, so that the surface of the unpolished sample has better friction and lubrication characteristics. When the experimental force is 180 N and 200 N, the surface friction coefficient of the unpolished sample is less than 0.1, and when the experimental force is 100 N and 150 N, the friction coefficient is much higher than 0.1. The main reason is that, when the experimental force is high, the microscopic features provide a higher positive pressure for the lubrication film, and the lubrication performance of the fluid is better. Therefore, the polishing treatment of cemented carbide samples greatly reduces the errors caused by the excessive surface roughness of the samples on the test data.

4.3. Friction Coefficients of Textured Surface

Under different rotational speeds and loads, friction and wear tests were carried out on triangular, triangular groove, and semicircular ring micro-textured specimens with different area occupancy ratios, comparing and analyzing the influence of micro-texture morphology and area occupancy ratio on the friction and wear properties of specimens. The specific test plan and parameters are shown in Table 7.

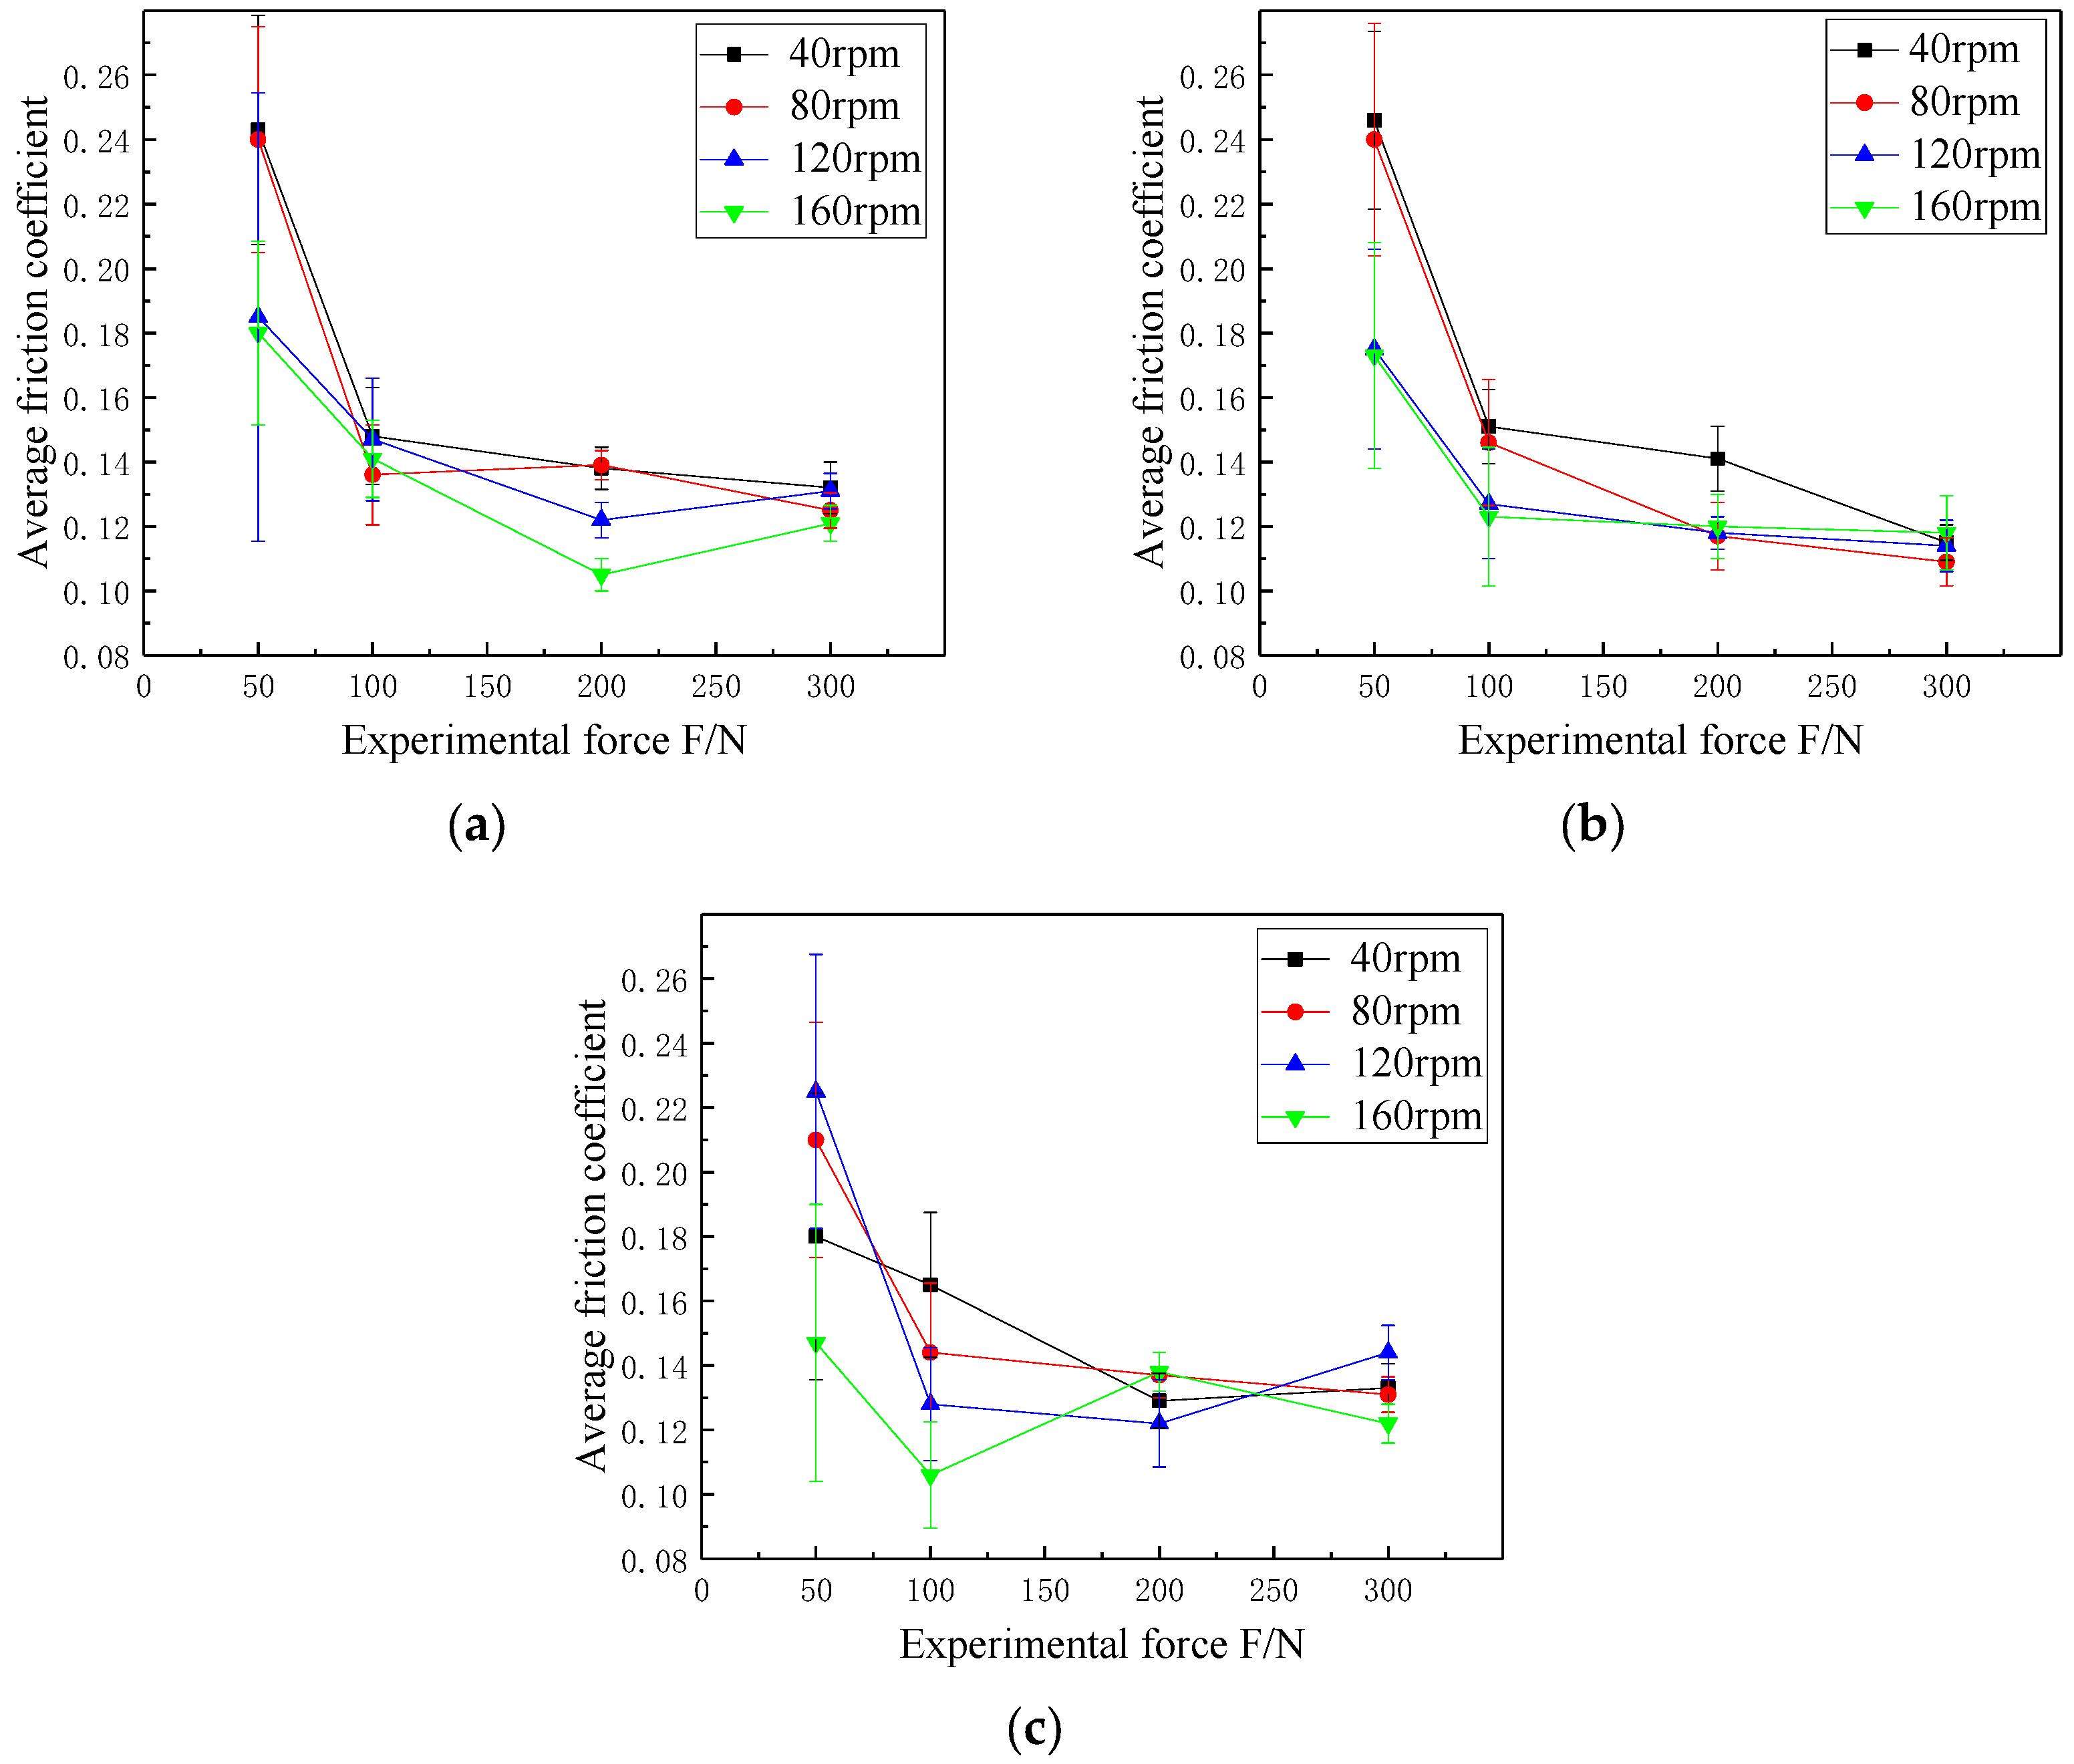
4.3.1. Friction Coefficients of Triangular Microtextures

By changing the experimental force and rotational speed of the friction and wear test process, the influence of the area occupancy ratio of micro-texture on the friction characteristics of textured surface was compared and analyzed. Under the same area occupancy ratio, the influence of micro-texture morphology on the friction characteristics of textured surface was explored. The surface of the specimens were kept in an oil immersed state and the lubricating oil in the lubrication pool was replaced after each test.
The figures below are changing trends of the friction coefficients of the surface of the triangular micro-textured specimens with area occupancy ratios of 7%, 10%, and 13% at different experimental forces and rotational speeds.
As shown in Figure 9a, at the same rotational speed, the fluctuation range of the friction coefficient of the surface of the triangular micro-textured specimen with the area occupancy ratio of 7% is greatly reduced with the increase of the experimental force, and the friction coefficient becomes more and more stable. When the experimental force is 50 N and the rotational speed is 120 rpm, the fluctuation range of the friction coefficient is the largest, and the value is between 0.11 and 0.25. When the experimental force is 300 N, the fluctuation range of the friction coefficient does not exceed 0.02 at different rotational speeds. In Figure 9b, the friction coefficient of the surface of the triangular micro-textured specimen with area occupancy ratio of 10% decreases with the increase of the experimental force at the same rotational speed. When the experimental force is less than 300 N, the friction coefficient decreases with the increase of the rotational speed. When the experimental force is 300 N, the friction coefficient at each rotational speed is close and relatively small. Compared with area occupancy ratios of 7% and 10%, the value and fluctuation range of friction coefficient of triangular textured specimen with area occupancy ratio of 13% are larger, as shown in Figure 9c.

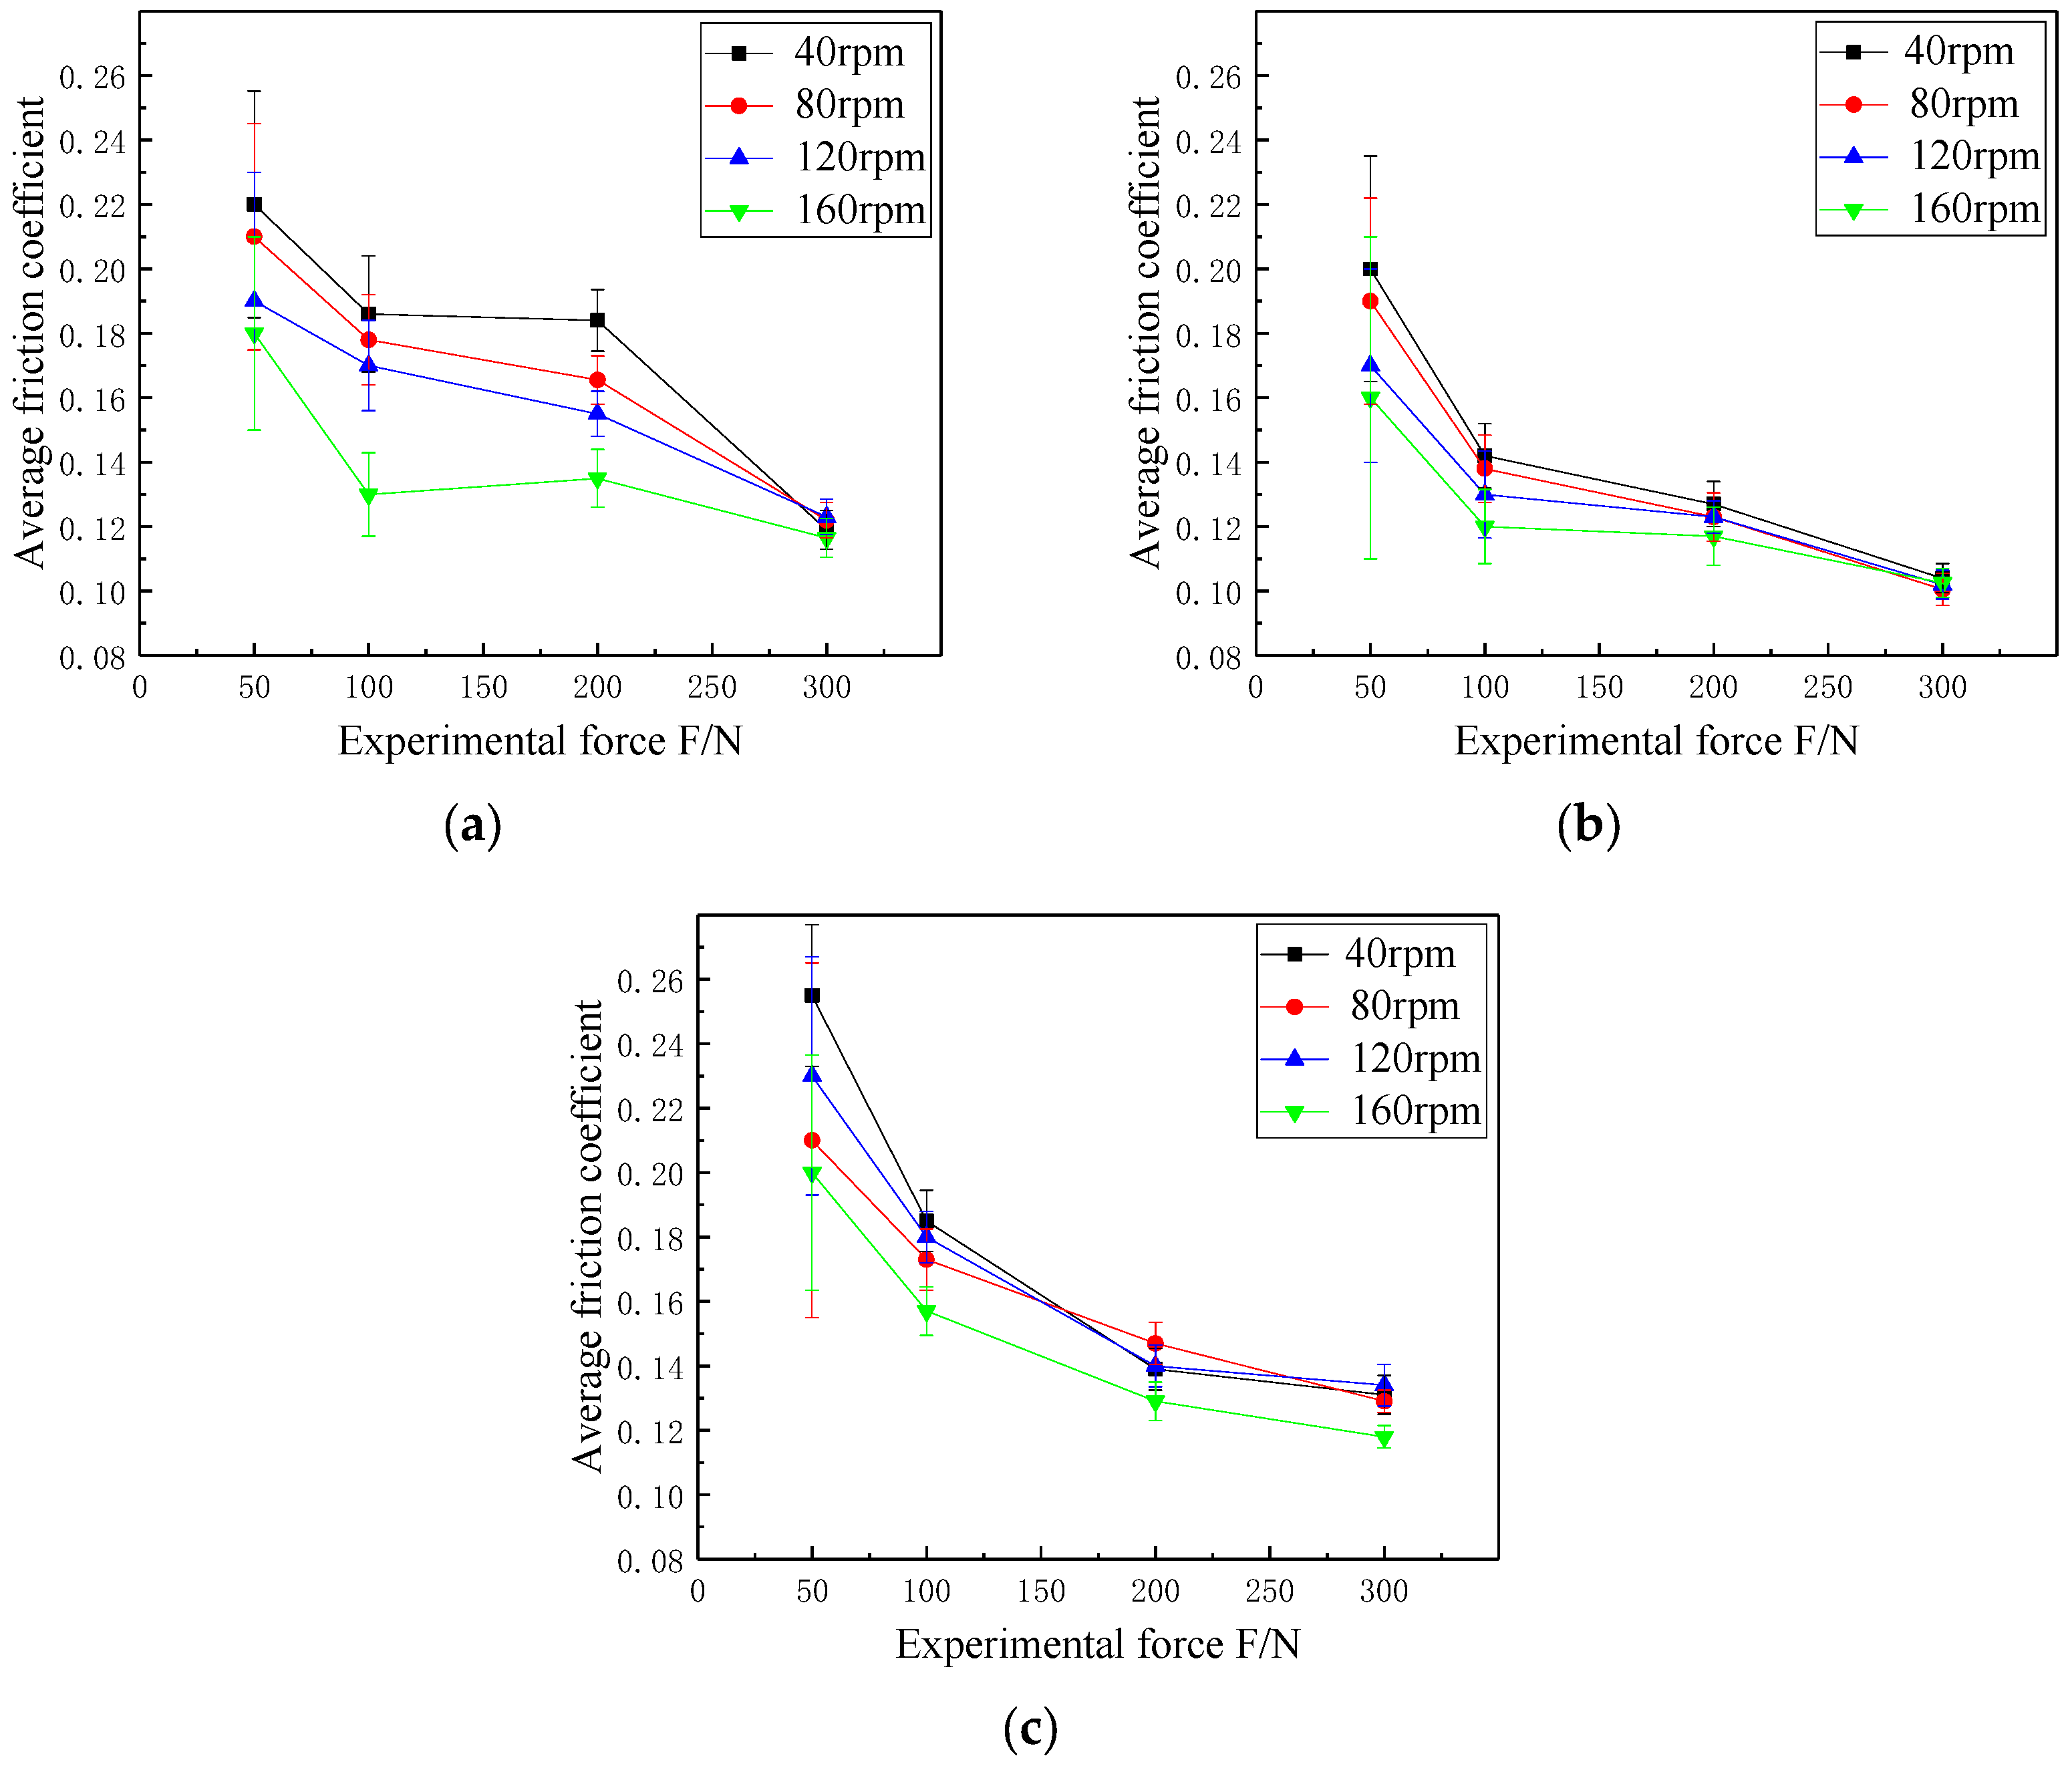
4.3.2. Friction Coefficients of Triangular Groove Microtextures

The figures below are changing trends of the friction coefficients of the surface of the triangular groove micro-textured specimens with area occupancy ratios of 7%, 10%, and 13% at different experimental forces and rotational speeds.
In Figure 10a, under the same experimental force, the friction coefficient of the surface of the specimen with area occupancy ratio of 7% decreases with the increase of the rotational speed. When the experimental force is 50 N, the friction coefficient decreases the most, and the numerical fluctuation range is also large. When the experimental force is 100 N and 200 N, the fluctuation range of the friction coefficient is reduced. Under the experimental force of 300 N, the friction coefficient is relatively stable. In Figure 10b, when the area occupancy ratio is 10%, the friction coefficient of the surface of the triangular groove micro-textured specimen decreases with the increase of the experimental force and the rotational speed, and the friction coefficient becomes more and more stable with the increase of the experimental force. In Figure 10c, the variation trend of the friction coefficient of the surface of triangular groove micro-textured specimen with area occupancy ratio of 13% is similar to that in Figure 10b, but the value is much higher under the same conditions.

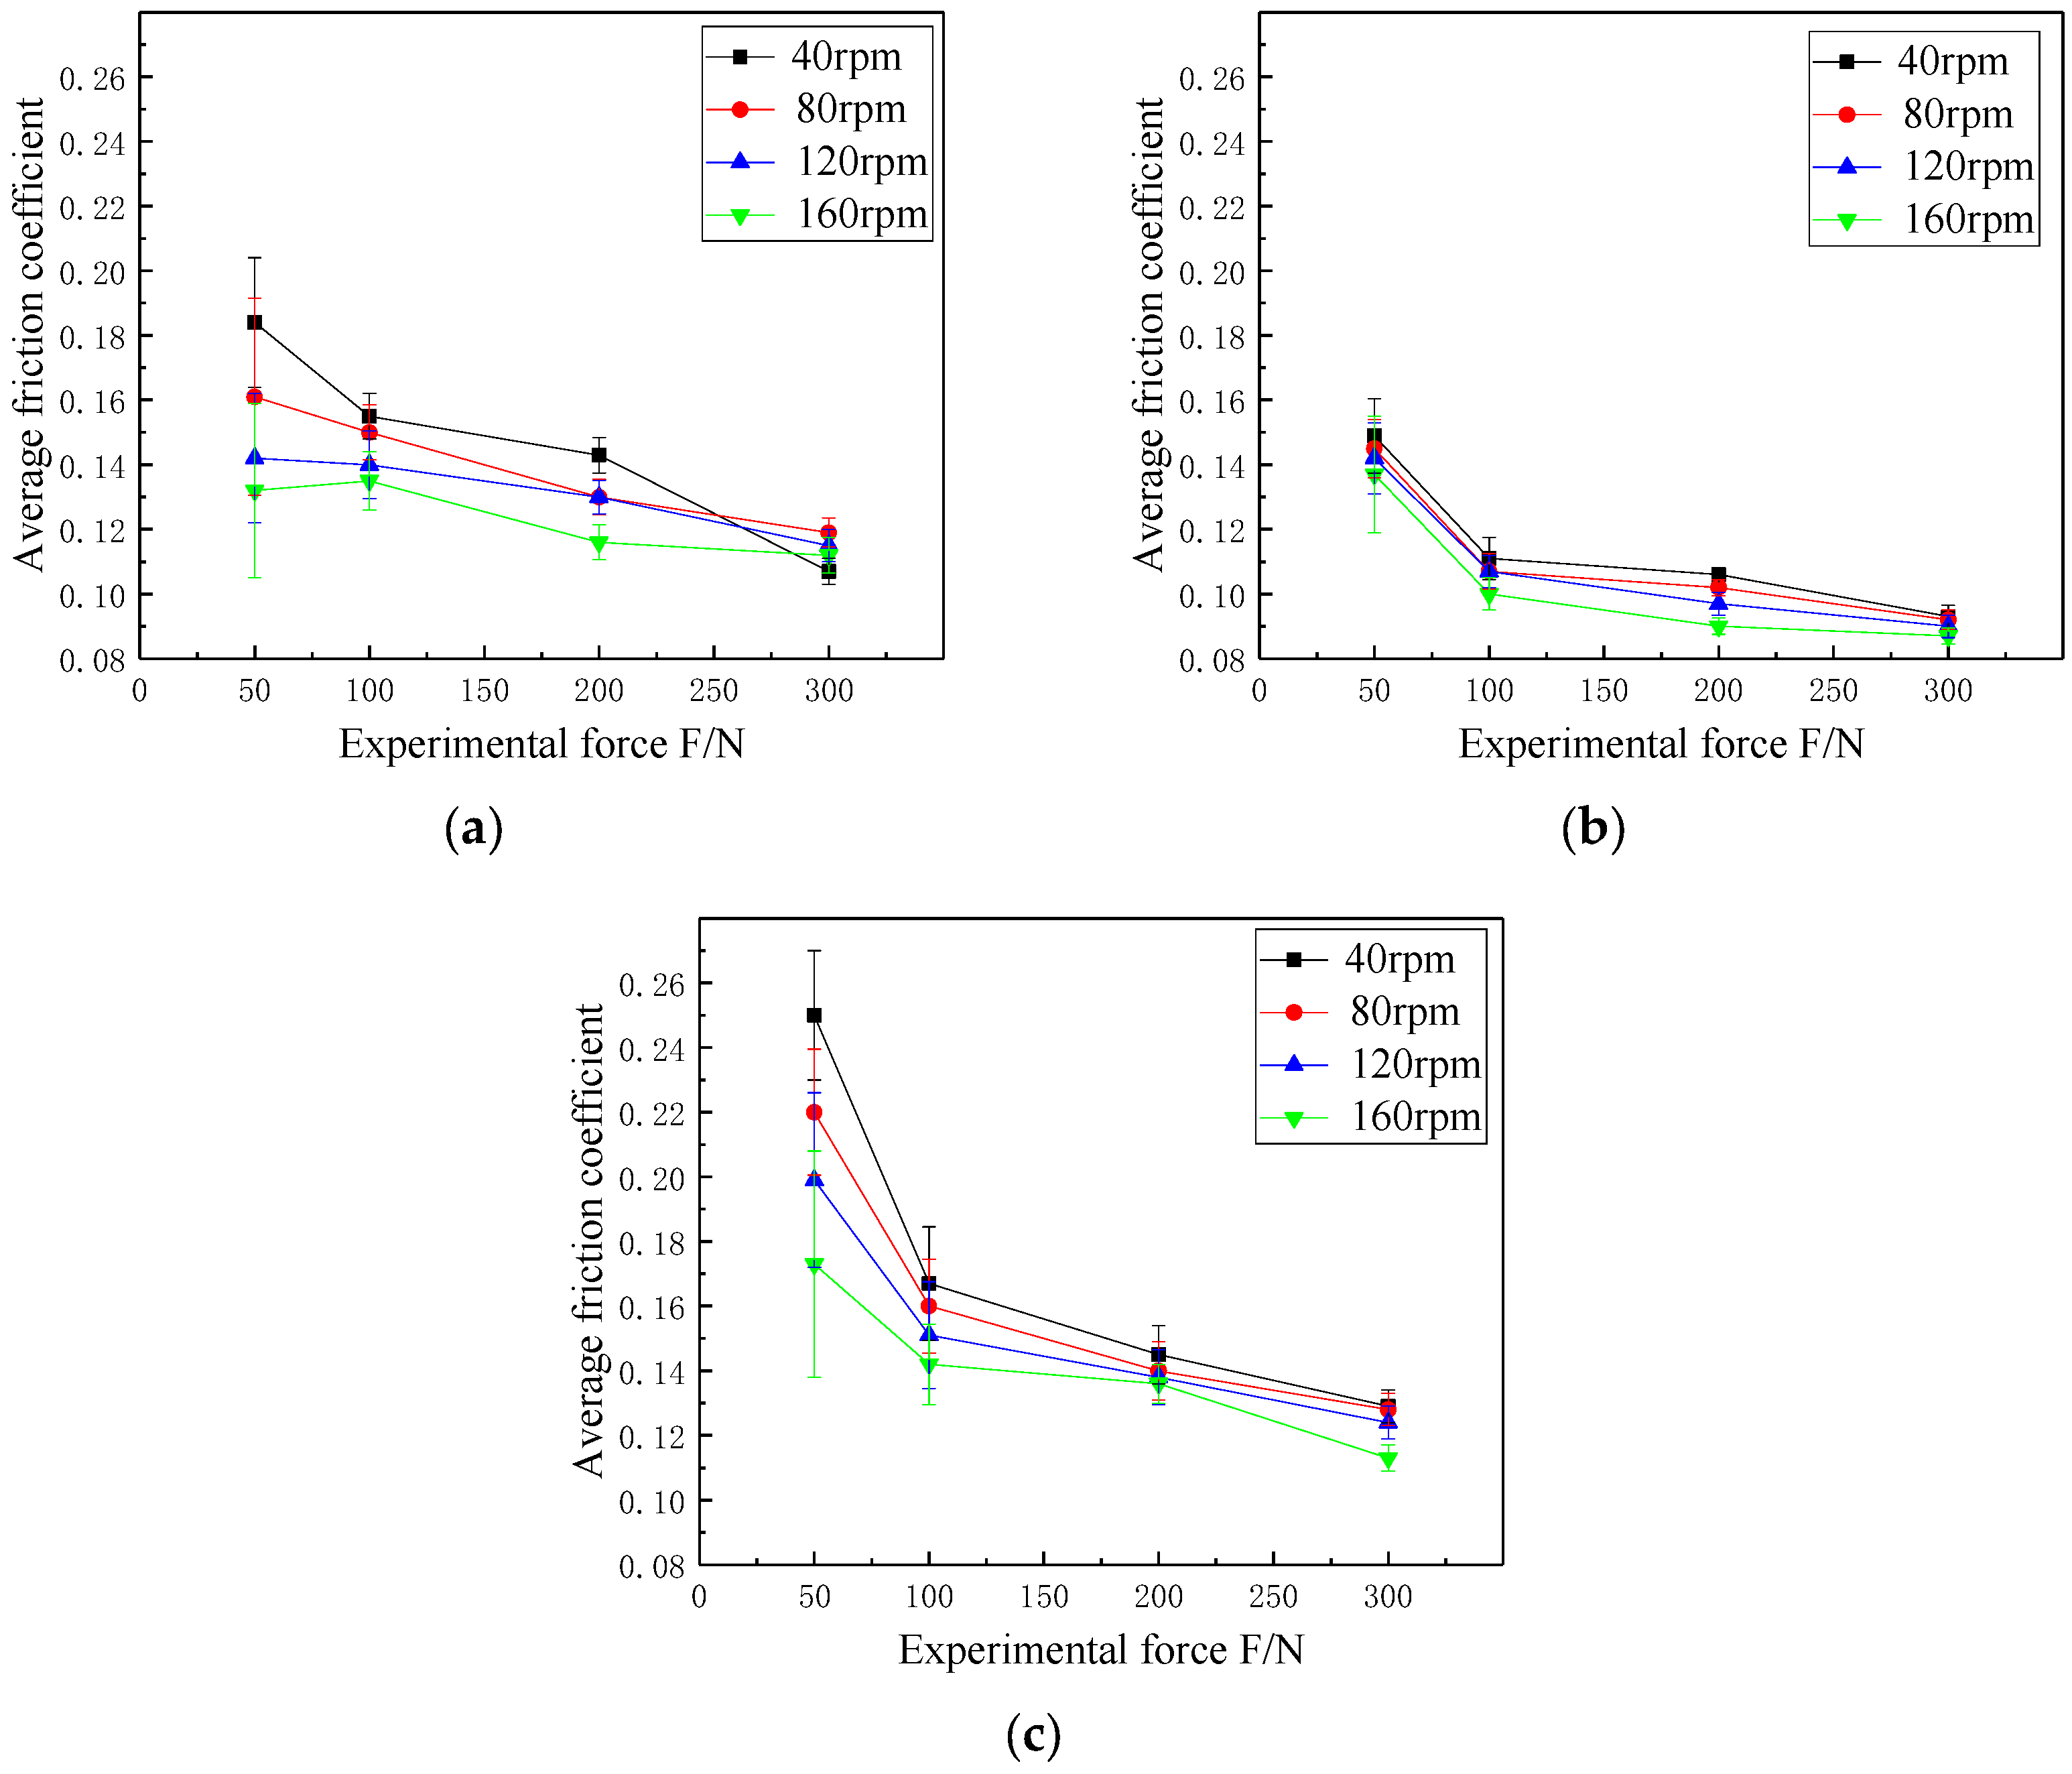
4.3.3. Friction Coefficients of Semicircular Ring Microtextures

The figures below show changing trends of the friction coefficients of the surface of the semicircular micro-textured specimens with area occupancy ratios of 7%, 10%, and 13% at different experimental forces and rotational speeds.
In Figure 11a, the friction coefficient of the surface of the specimen with an area occupancy ratio of 7% varies greatly at different rotational speeds under the experimental force of 50 N. With the increase of the experimental force, the magnitude and fluctuation range of the friction coefficient decrease obviously. In Figure 11b, when the experimental force increases to 100 N, 200 N, and 300 N, the friction coefficient of the surface of the specimen decreases significantly at four rotational speeds, and the fluctuation range becomes smaller than that at 50 N. In Figure 11c, the friction coefficient of the surface of the specimen is generally larger than that of the first two groups, the increase of roughness caused by the excessive number of micro-textures is the main reason for the increase of the friction coefficient.

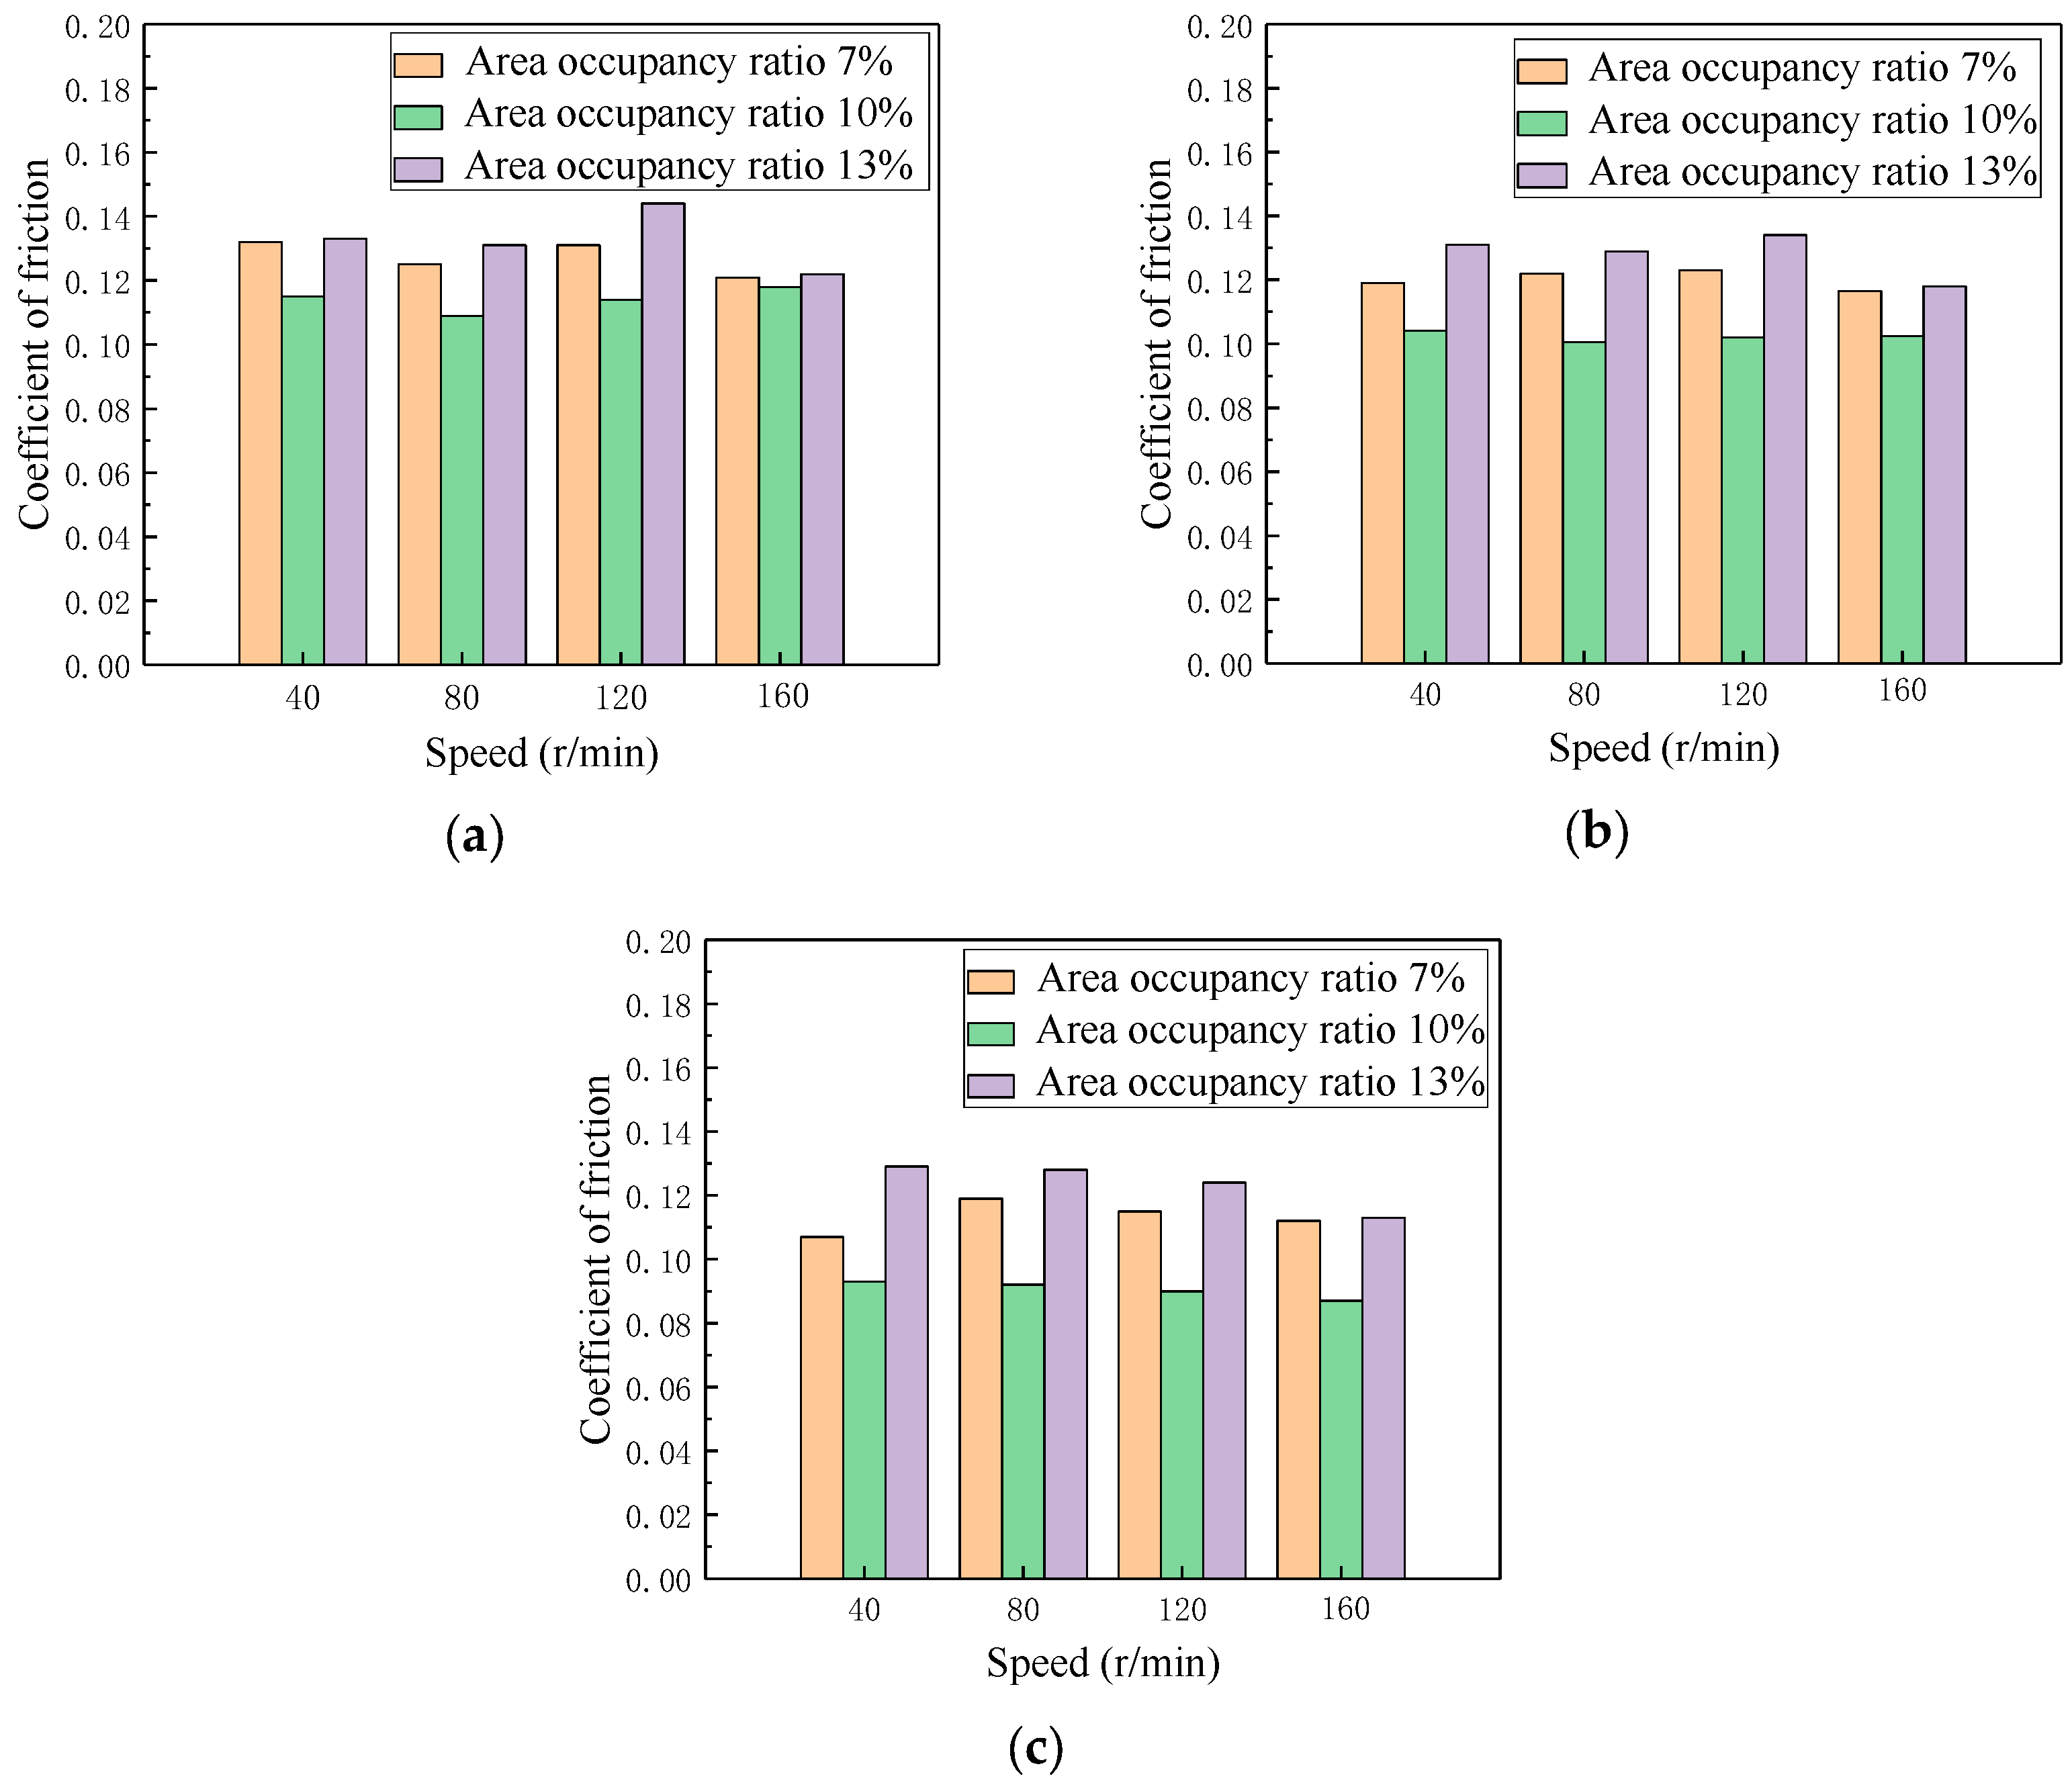
4.4. Effect of Area Occupancy Ratio on Friction Coefficient of Textured Surface

In order to investigate the influence of area occupancy ratio on the friction coefficients of different textured specimens, the average friction coefficients of different textured specimens under four rotational speeds at 300 N experimental force were compared, because the friction coefficients of each group of specimens at 300 N experimental force were the lowest and the most stable.
By comparing and analyzing the friction coefficients of triangular, triangular groove, and semicircular ring textured specimens with different area occupancy ratios in Figure 12, it can be seen that the friction coefficients of the surface of the specimens are the highest when the area occupancy ratio is about 13%, and the friction coefficients are the lowest when the area occupancy ratio is about 10%, regardless of the texture morphology. When the area occupancy ratio is about 7%, the friction coefficients of the surface of the specimens are between the two. The change of area occupancy ratio affects the number and distribution of micro-textures. When the area occupancy ratio is small, the number of textures is smaller, and the dynamic lubrication effect is weaker. When the area occupancy ratio is too large, although the number of micro-textures providing dynamic pressure lubrication is increased, the excessively dense textures will increase the surface roughness. At this time, the roughness becomes the key factor affecting the surface friction properties of textured specimens. A reasonable area occupancy ratio can make the surface of textured specimens have excellent lubrication performance.

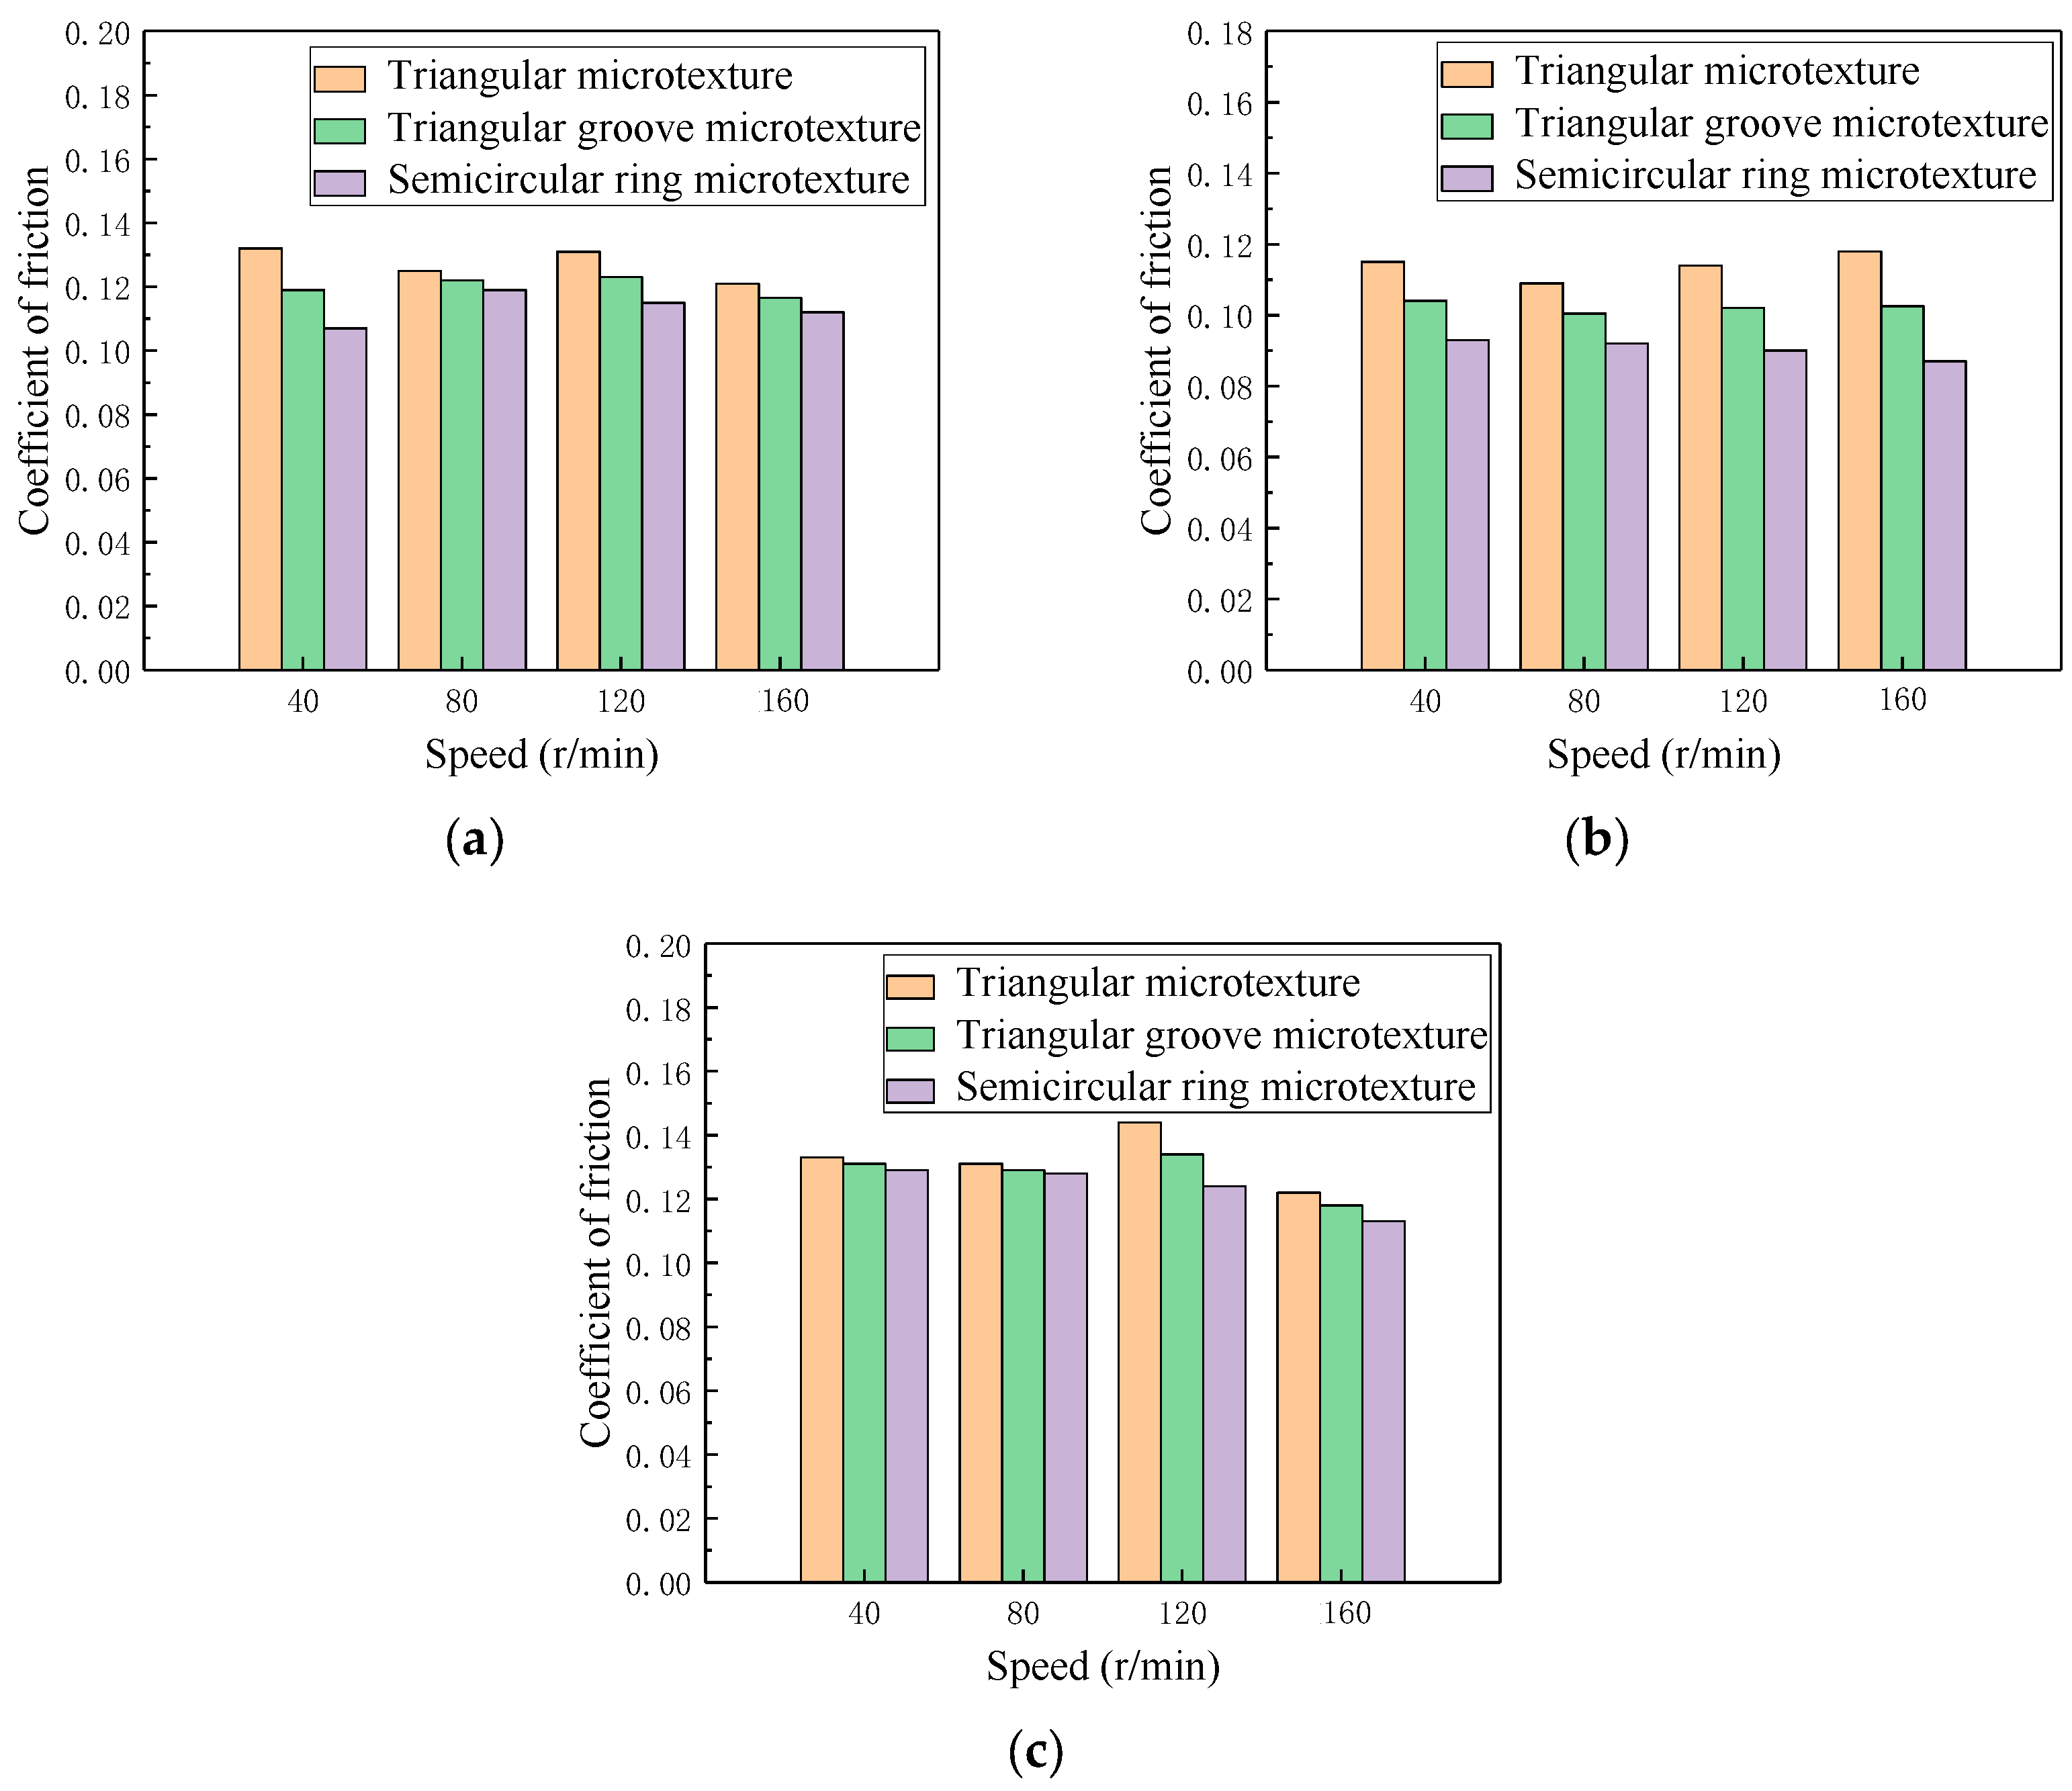
4.5. Effect of Texture Morphology on Friction Coefficient of Textured Surface

The micro-textures with three morphologies based on hydrodynamic lubrication theory were designed to enhance the hydrodynamic lubrication effect and the load-carrying capacity of lubricating film, thereby improving the friction characteristics of textured surface. Therefore, in order to study the effect of texture morphology on the friction properties of textured surface, under the premise of ensuring that the friction coefficient of the surface of the specimens is relatively minimal and stable, the relationship between the surface friction coefficient and micro-texture morphology of the specimens was analyzed by comparing the experimental data at different rational speeds under the experimental force of 300 N.
Figure 13 shows the comparison of friction coefficients of the surface of triangular, triangular groove, and semicircular ring textured specimens with area occupancy ratios of 7%, 10%, and 13%, respectively, at different rational speeds. The data analysis shows that, whether it is Figure 13a, Figure 13b, or Figure 13c, when the micro-textures have the same occupancy ratio and the experimental force and rotational speed remain unchanged, the morphology of micro-texture changes from triangle to triangular groove to semicircular ring, the friction coefficient of the textured surface is gradually reduced, and when the area occupancy ratio is about 10%, the friction coefficients of the three textured surface decrease most obviously. From the analysis of the surface pressure and velocity of fluid flowing through textures with different morphologies, it can be seen that, under the same parameters, the hydrodynamic lubrication and convection effects of triangular, triangular groove, and semicircular ring micro-textures are obvious, the semicircular ring texture is superior to the triangular groove and the triangular.

4.6. Wear Volume of Non-Textured Surface and Textured Surface

Before and after the test, the samples were put into the ultrasonic cleaning machine and washed with anhydrous ethanol, after which they were dried and the weight loss of wear before and after the test with an electronic balance with an accuracy of 0.0001 g was determined.
Table 8 shows the weight loss of non-textured specimens and textured specimens.
It can be seen from Table 8 that the weight loss of textured specimens is significantly lower than that of non-textured specimens, and when the area occupancy ratio is 10%, the weight loss of the semicircular ring textured sample is minimal.
Considering, comprehensively, that it is found that the semicircular ring micro-texture can produce better hydrodynamic lubrication effect wear reduction, and when the area occupancy ratio of the texture is 10%, the semicircular ring texture exhibits the best tribological properties.

5. Analysis of Wear Mechanism of Non-textured Specimen and Textured Specimens

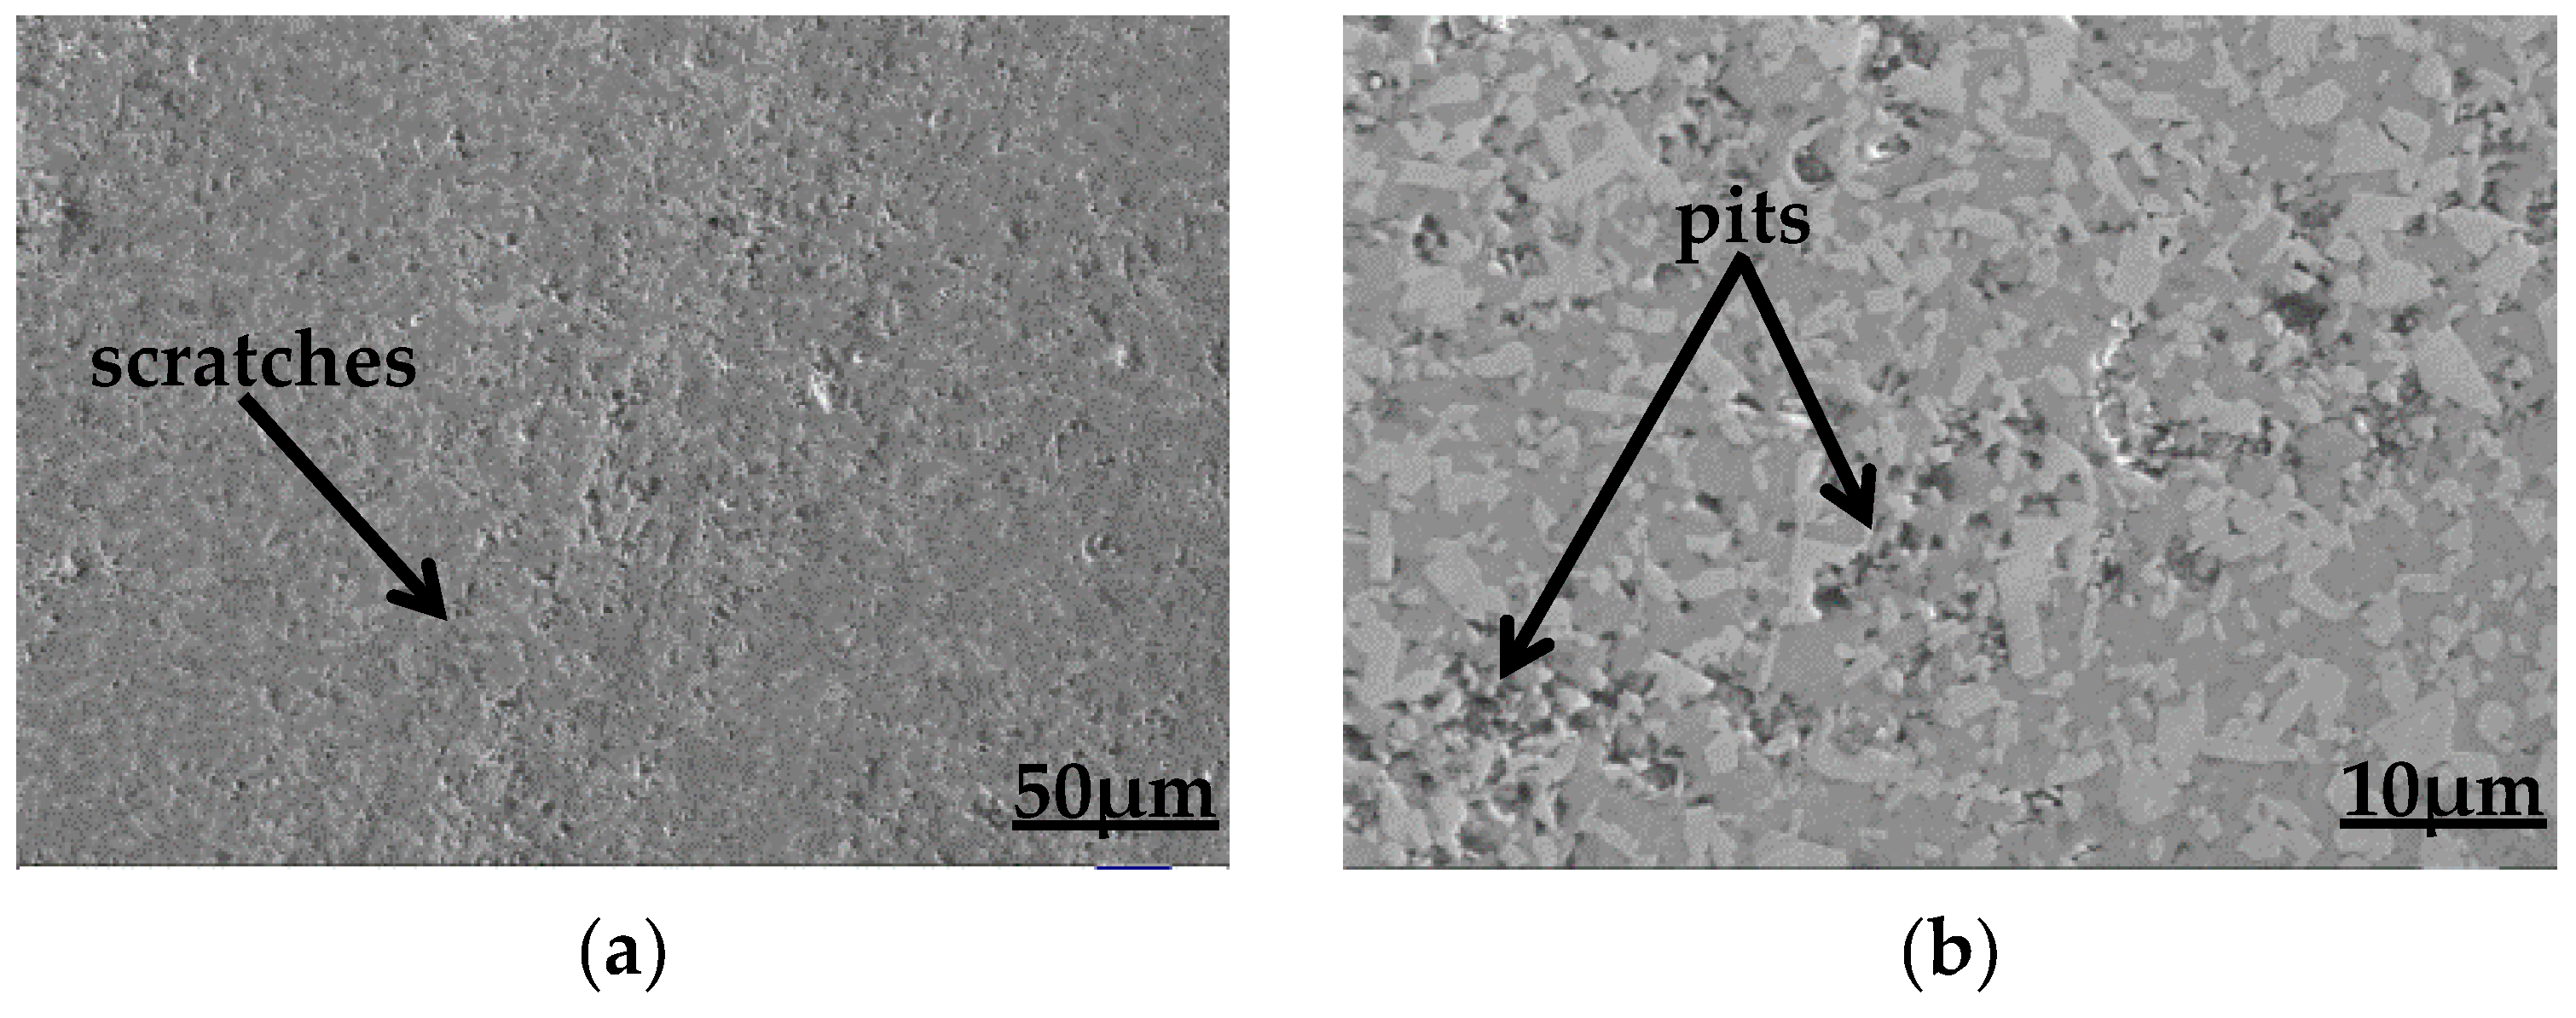
5.1. Analysis of Wear Mechanism of the Non-Textured Polished Specimen

Figure 14a,b show the wear morphology of the polished specimen with magnification of 500 and 1500, respectively. As can be seen from the figures, there are significant wear scratches and pits on the surface of the non-textured polished specimen. In the process of friction, owing to the hard particles and micro-protrusions on the surface of the friction pairs, the surface is pressed when particles and protrusions move along the surface of the friction pairs, causing loss of surface material and generating abrasive grains. Furthermore, the separated abrasive grains produce micro-cutting on the surface of the material, thereby generating grooved wear marks. In addition, under the action of high repeated contact compressive stress, the local surface of the friction pairs causes small pieces of material to peel off to form pits. Therefore, the surface of the non-textured polished specimen is abrasive wear and contact fatigue wear.

5.2. Analysis of Wear Mechanism of the Textured Specimens

In addition to the friction coefficient of the surface of the specimens, the wear form of the surface is also the focus of the tribological study of the textured specimens. Compared with the non-textured polished specimen, in the oil lubrication environment, the surface of the textured specimens can not only store lubricating oil, playing the role of “hydrodynamic lubrication” and “secondary oil supply”, but also reduce the direct contact area between friction pairs, storing free abrasive particles and impurities between friction pairs, thereby achieving the purpose of reducing wear.

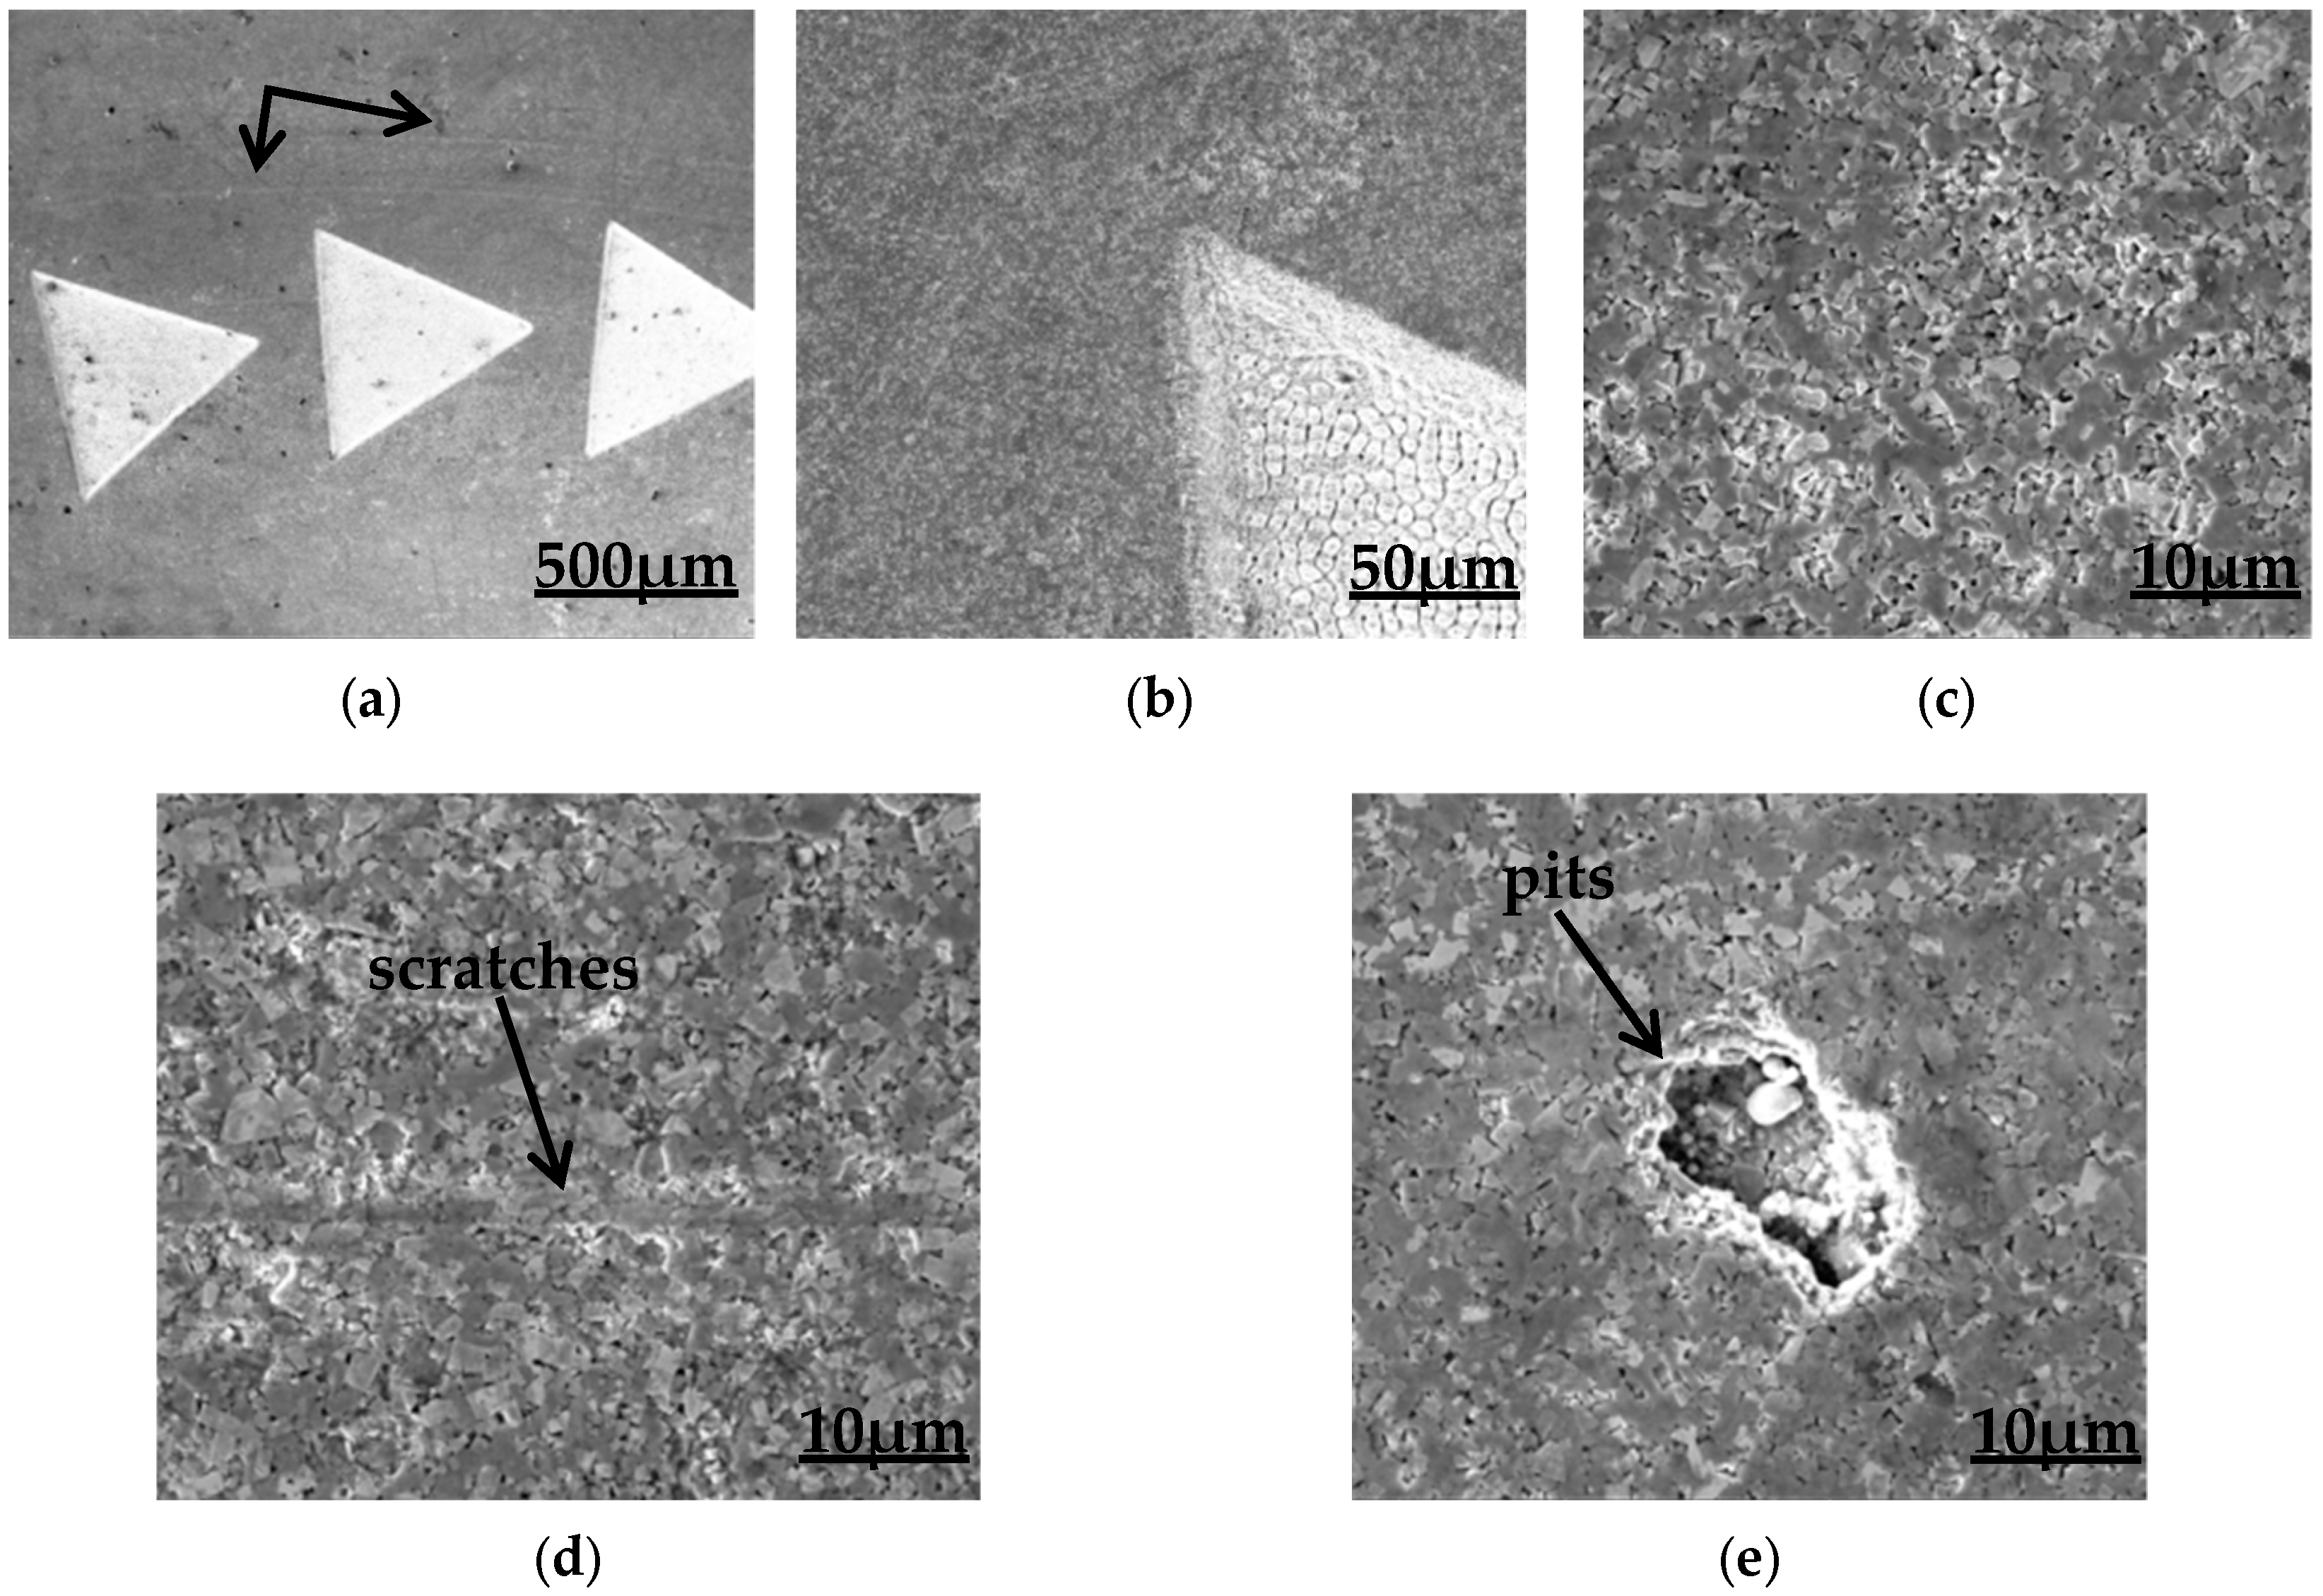
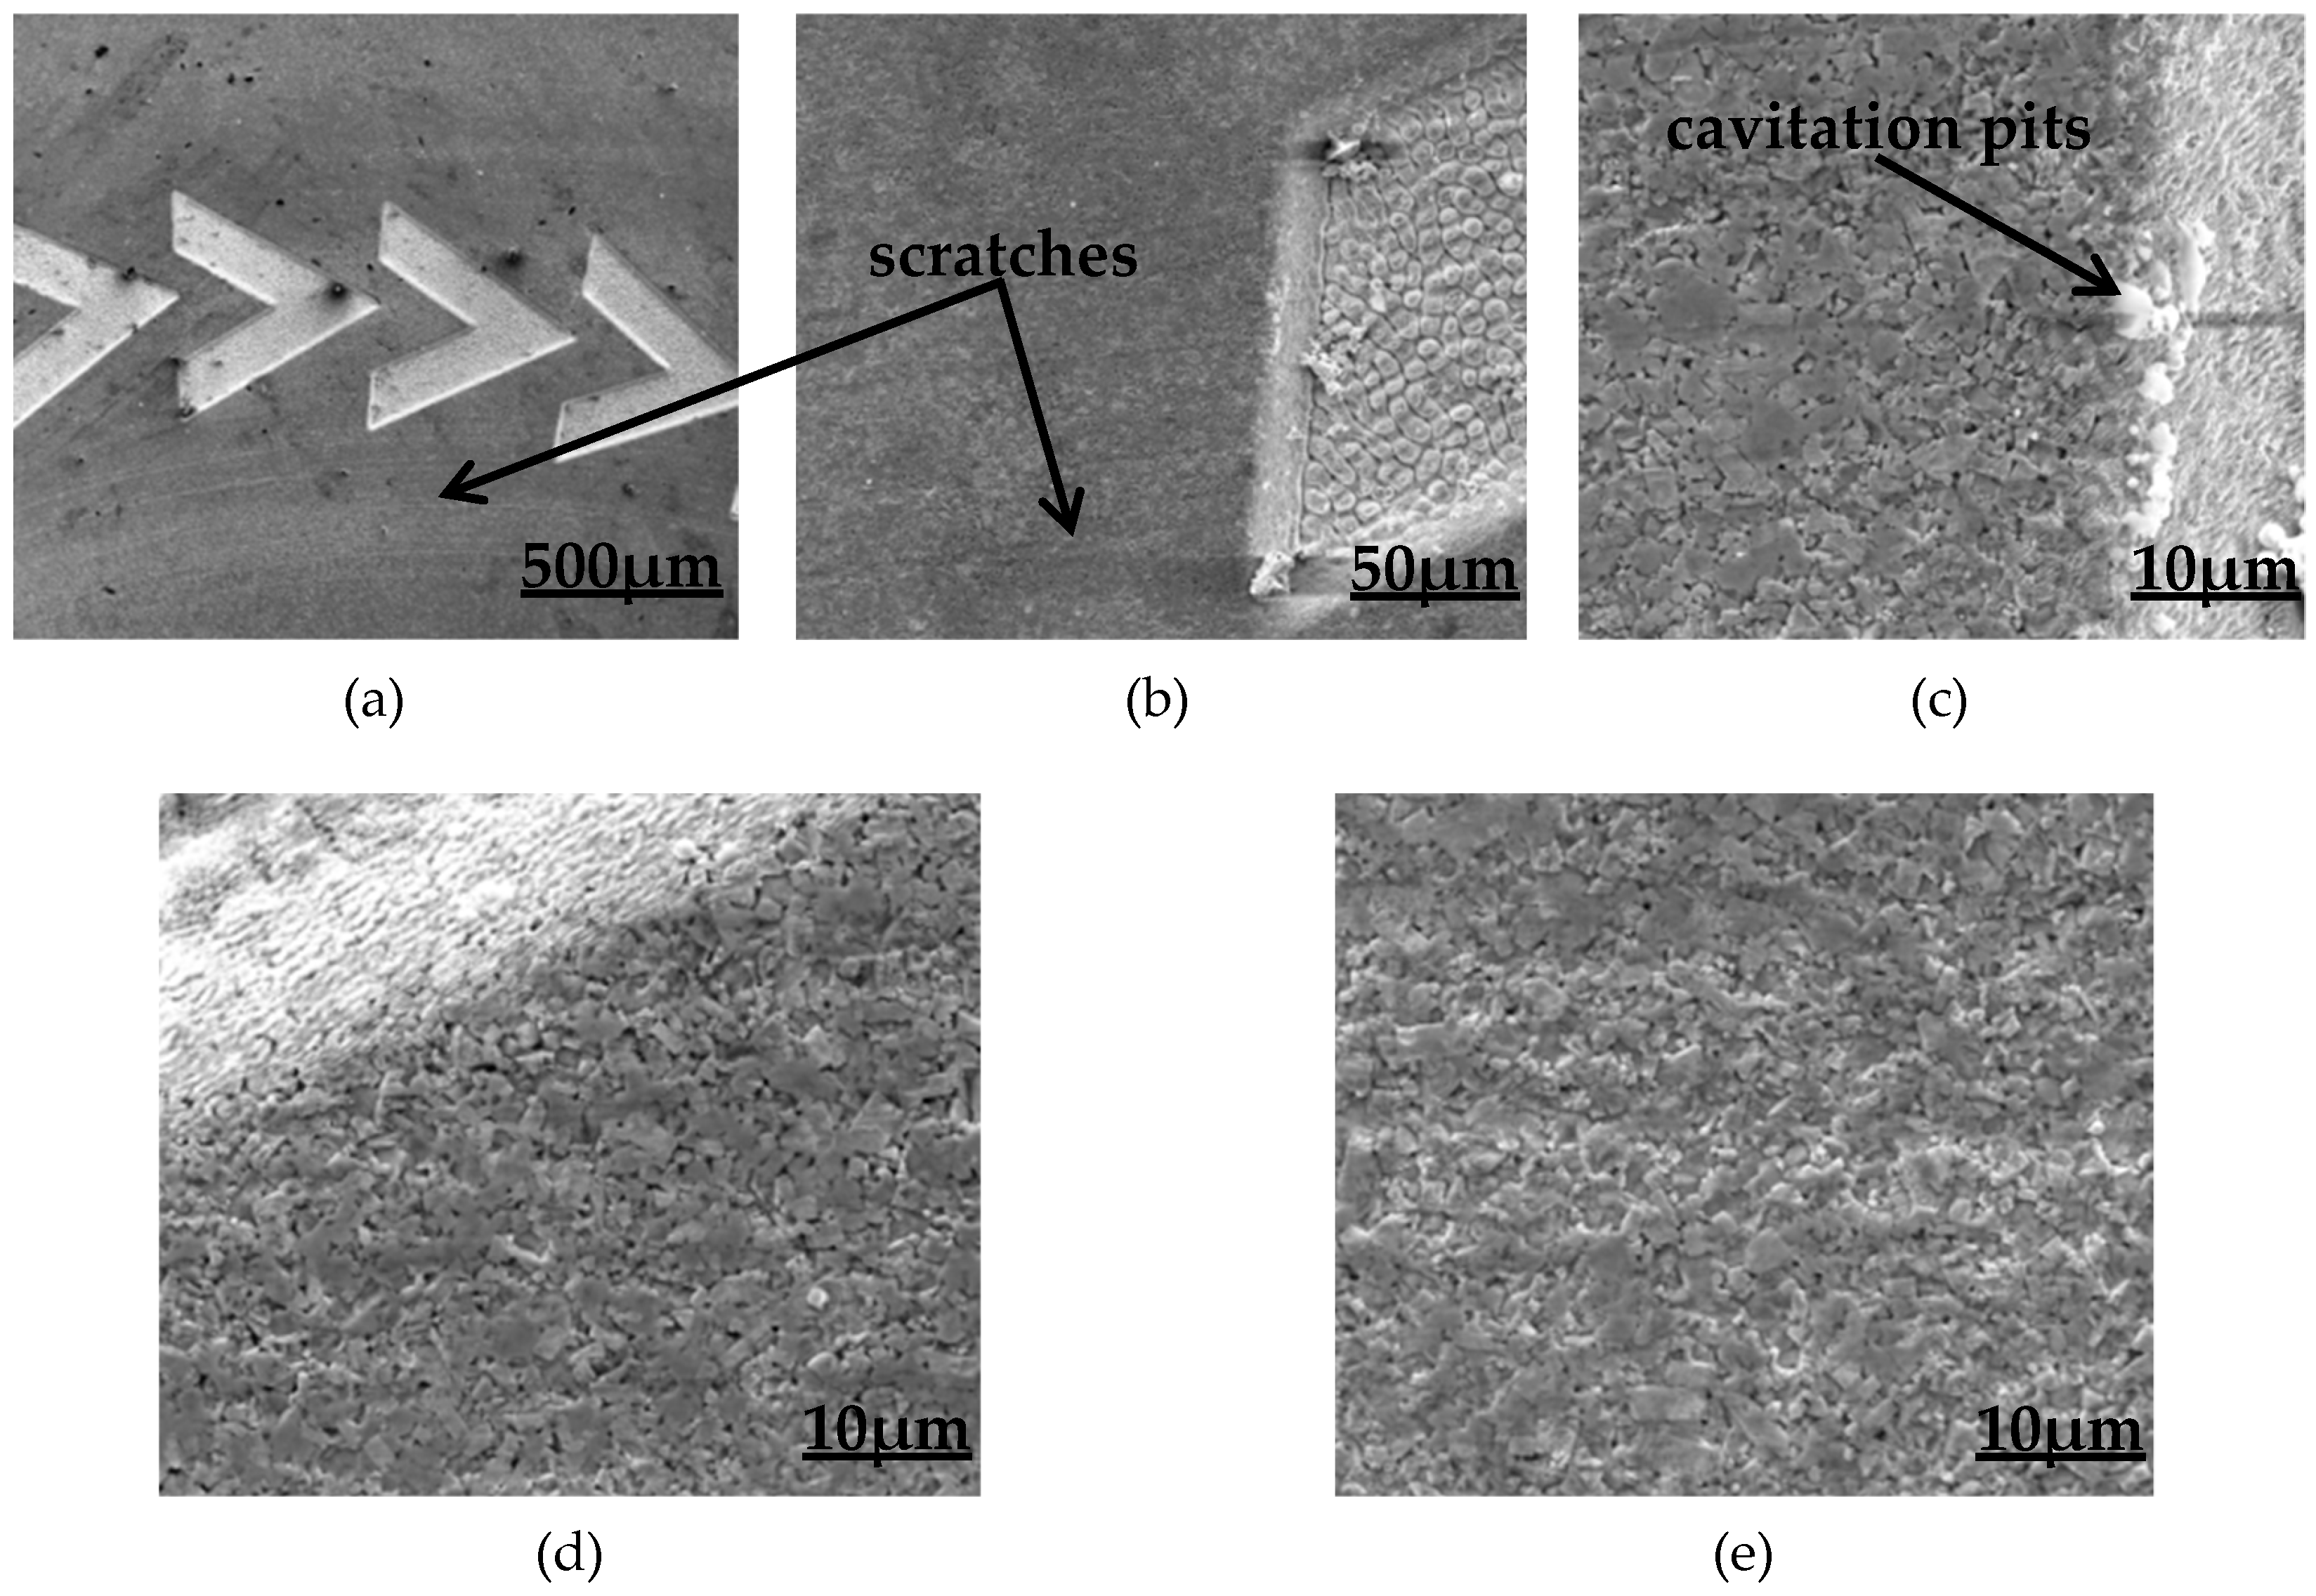
5.2.1. Surface Wear Morphology of Triangular Textured Specimens

Figure 15 shows the wear morphology of the surface of the triangular textured specimens; the surface of the specimens has obvious shallow scratches. The friction surface is magnified 2000 times, as shown in Figure 15d; the surface is mainly etched and peeled off. During the process of wear, the hard particles peeled off from the surface produce micro-cutting action between the relatively moving surfaces, and the hard particles are continuously squeezed, causing pits on the surface of the specimens, as shown in Figure 15e. Figure 15b shows the local adhesion and soldering on the surface of the specimens. Under the action of pressure, metal adhesion occurs in the contact area of the friction pairs, and then the adhesion is destroyed in relative motion. The bonding points are sheared and transferred to the surface of the friction pairs, and then fall off to form wear debris, causing loss of surface material, as shown in Figure 15c. Therefore, the surface of the triangular textured specimens mainly undergoes abrasive wear and adhesive wear.

5.2.2. Surface Wear Morphology of Triangular Groove Textured Specimens

Figure 16 shows the surface wear morphology of the triangular groove textured specimens. It can be seen from Figure 16a,d,e that the hard particles fall off and slide on the surface of the friction pairs to produce furrow effects, and the scratches along the rubbing direction are mostly distributed near the micro-textures. Compared with triangular micro-textures, the hydrodynamic lubrication effect of triangular groove micro-textures is more obvious. As can be seen from Figure 16b,c, cavitation micro-pits appear at the edge of triangular groove micro-textures. When the fluid flows through the micro-textures, owing to the cavitation effect, the bubbles are precipitated from the fluid and collapse in the high-pressure region, causing impacts on the texture wall to form cavitation micro-pits. Therefore, the surface of the triangular groove textured specimens mainly has abrasive wear and cavitation.

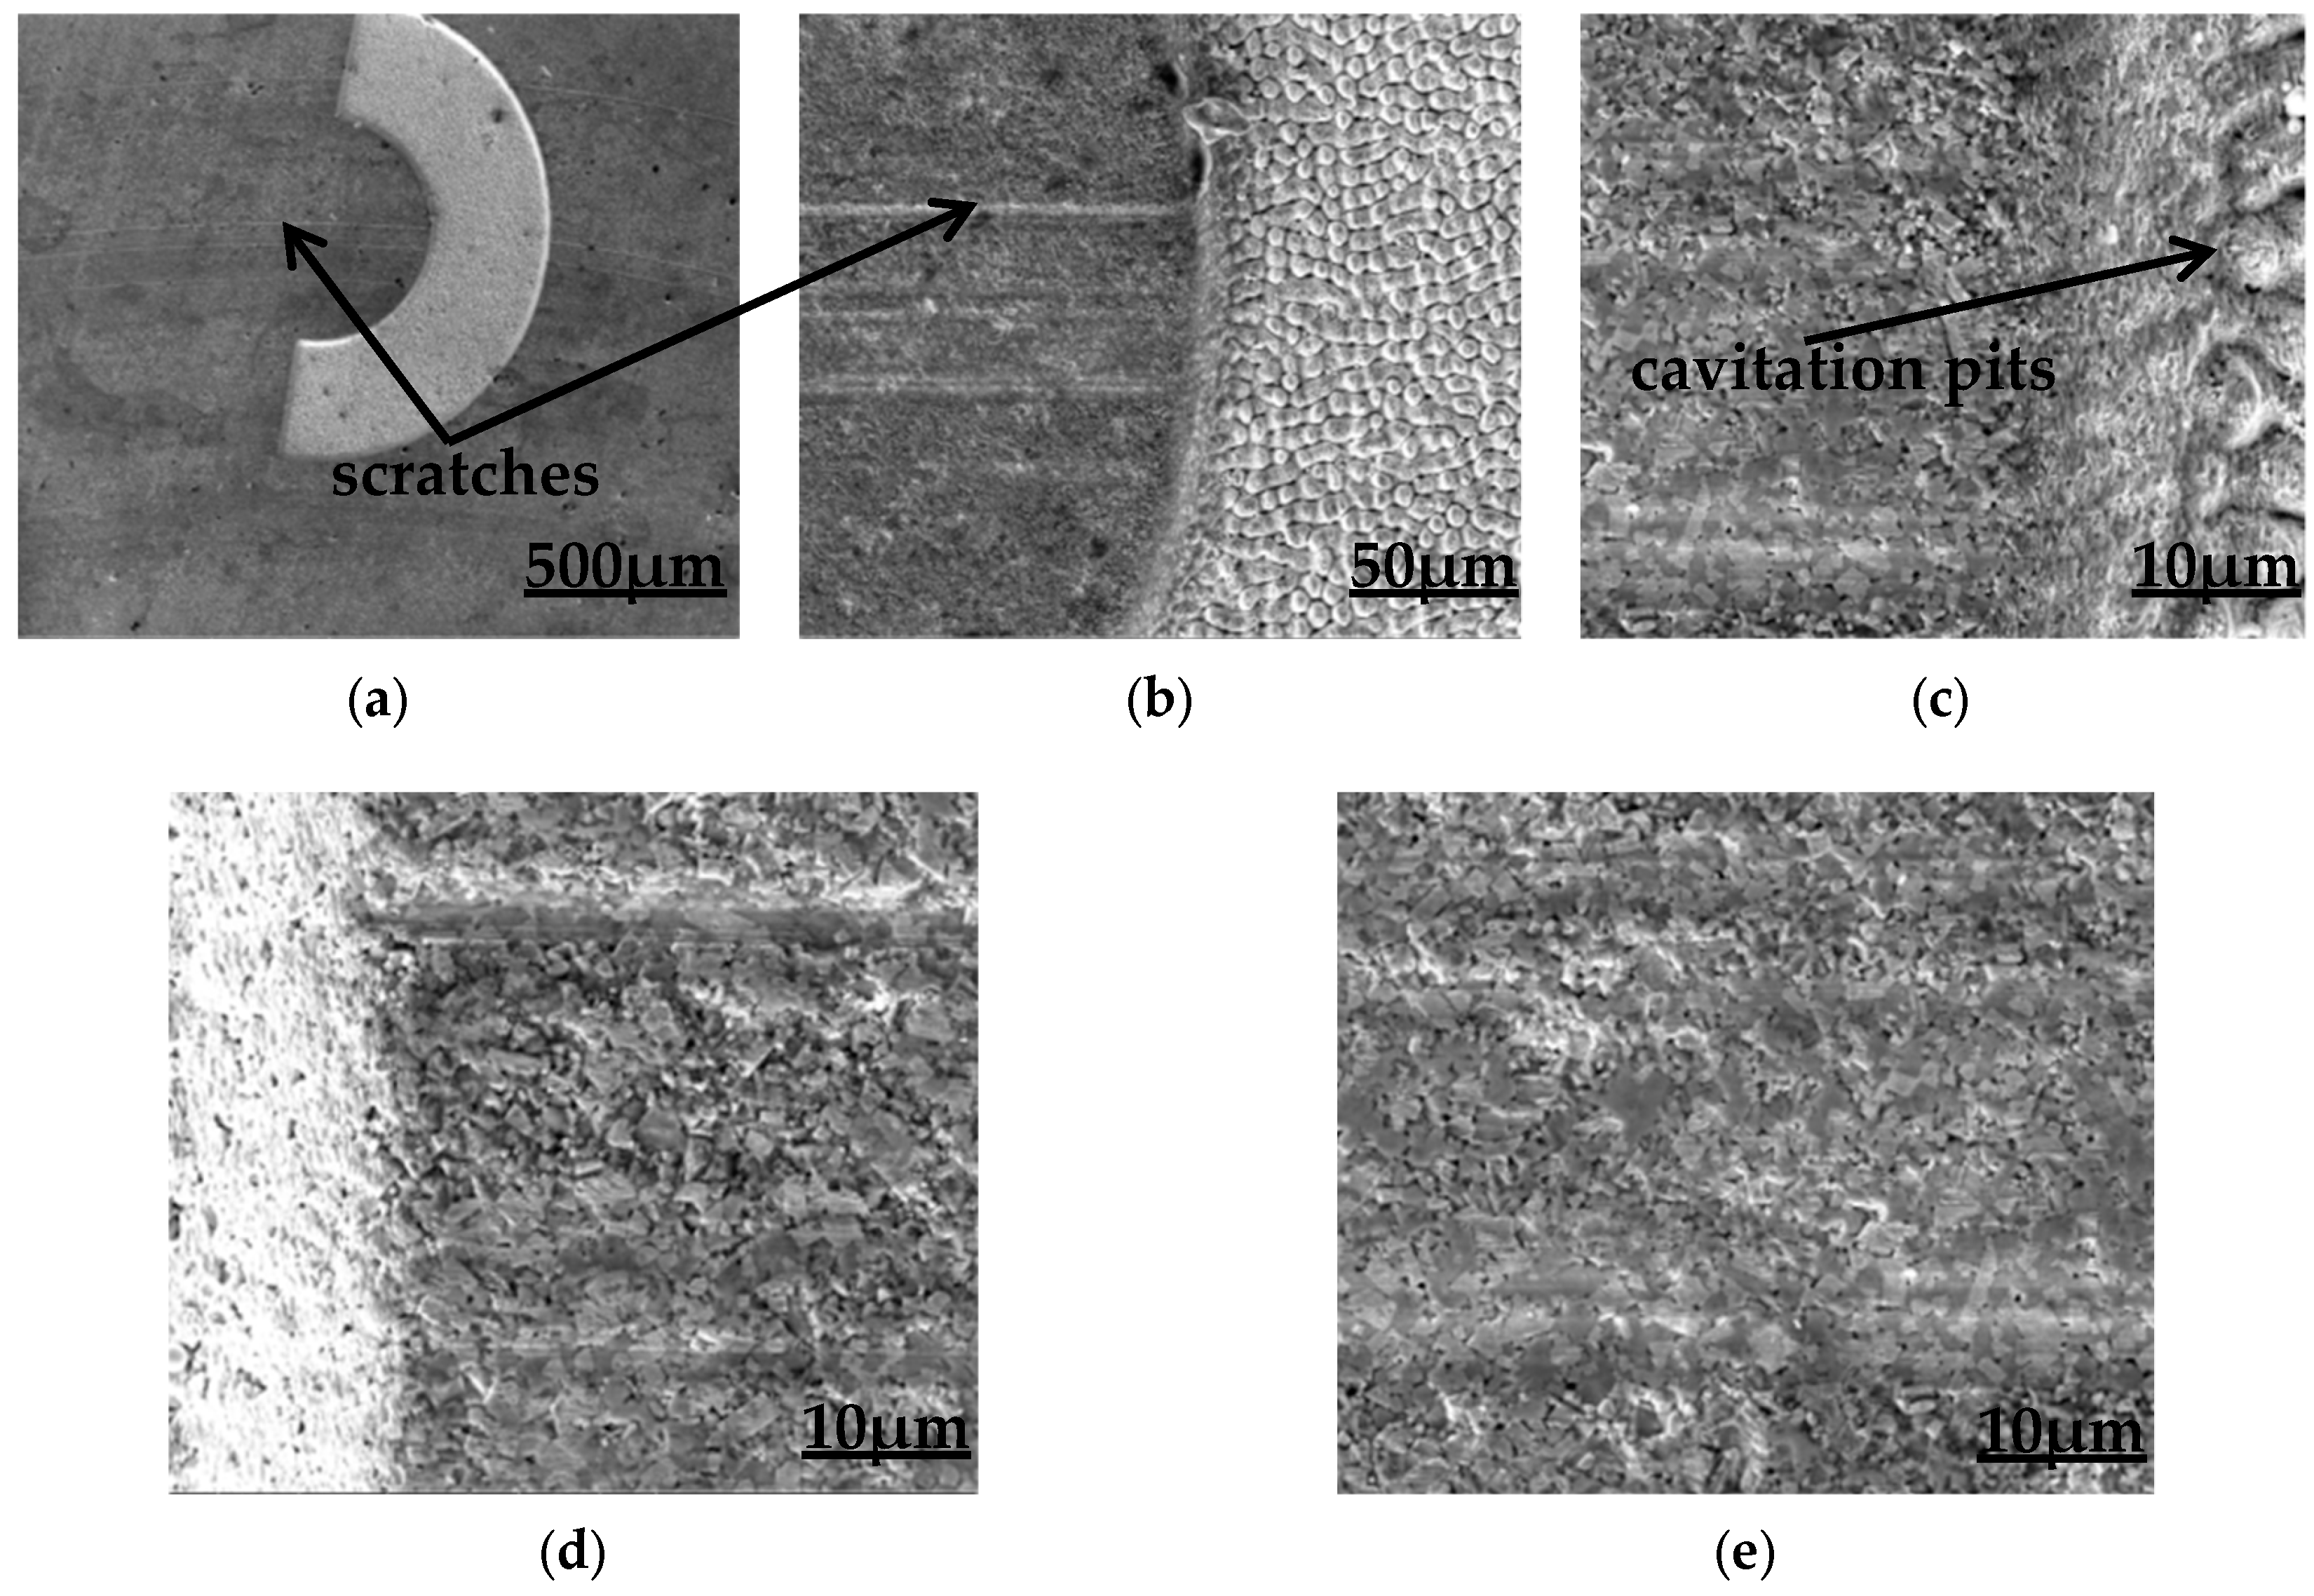
5.2.3. Surface Wear Morphology of Semicircular Ring Textured Specimens

Figure 17 shows the surface wear morphology of semicircular ring textured specimens. It can be seen from Figure 17a that the surface of the semicircular ring micro-textured specimens has very obvious scratches. Figure 17b,c show the wear morphology near the inner circle of the semicircular ring texture; it can be seen that there are obvious plough grooves near the edge of the micro-pits, and there are a few cavitation micro-pits at the edge. The cavitation pits are caused by cavitation in the process of the dynamic pressure effect; the bubbles gradually precipitate from the fluid and collapse in the vicinity of the wall of the micro-texture. Figure 17d,e show the wear morphology near the outer circle of the semicircular ring texture; it can be seen that there are many tiny pits gathering on the surface, and there are obvious adhesion phenomena. Hard particles are separated from the surface and plough grooves are drawn on the surface of the specimens by the extrusion of the relative moving friction pairs. Therefore, the surface of the semicircular ring textured specimens undergoes abrasive wear and adhesive wear, and cavitation occurs.
It can be seen from the surface morphology after wear that the surface scratches of the non-texture specimens are more obvious, the furrows are deeper and wider, and the pits are more dense. The scratches on the surface of textured specimens are thin and shallow, and the pits are less than that of non- textured specimens. Combined with the weight loss of specimens, it can be seen that the wear performance of textured specimens is better.

6. Conclusions

In this experiment, triangular micro-texture, triangular groove micro-texture, and semicircular ring micro-texture with unidirectional convergence were designed, and different area occupancy ratios were designed for each texture morphology, which were 7%, 10%, and 13%, respectively. The effects of texture morphology, area occupancy ratio, working load, and rotational speed on the tribological properties of the specimens were investigated by Fluent fluid simulation, friction and wear tests, and surface topography observations.
  • The pressure and velocity distribution of fluid in different micro-textures were analyzed by Fluent fluid simulation. The result shows that the surface lubrication film of semicircular ring micro-textured specimens has the best bearing capacity, and the dynamic pressure lubrication effect is the most prominent.
  • Comparing the friction coefficient of the surface of three textured specimens, the friction coefficient decreases with the increase of the experimental force at a certain rotational speed and becomes more and more stable. When the experimental force is 300 N, the friction coefficient is the lowest and most stable.
  • When the area occupancy ratio of the three textures is about 10%, three types of textured specimens have the lowest surface friction coefficient, and the semicircular ring textured specimens have lower surface friction coefficients than the triangular and triangular groove.
  • The wear forms of the non-textured polished specimen mainly include abrasive wear and contact fatigue wear generated under alternating contact stress. The wear forms of the surface of the triangular, triangular groove, and semicircular ring textured specimens are mainly abrasive wear and more or less adhesive wear, and cavitation pits are observed on the surface of the triangular groove and semicircular ring specimens.

Author Contributions

Conceptualization, X.Y.; Methodology, C.L. (Chenchen Li) and X.Y.; Validation, C.L. (Chenchen Li) and X.Y.; Data Curation, C.L. (Chenchen Li); Writing—Original Draft Preparation, C.L. (Chenchen Li); Writing—Review and Editing, X.Y.; Supervision, C.L. (Chongyang Lu) and J.C.; Project Administration, X.Y.; Please add the contributions of authors S.W. and Y.W.

Funding

This research was funded by the National Natural Science Foundation of China (grant No. 51575234, 51872122); the Postdoctoral Science Foundation of China [grant No. 2017M620286]; the Key Research and Development Program of Shandong Province, China [grant No. 2018CXGC0809]; the Agricultural Machinery Equipment Research and Development Innovation Plan of Shandong Province [grant No. 2018YF012]; and Experts from Taishan Scholars of Shandong Province.

Conflicts of Interest

The authors declare no conflict of interest

References

  1. Jianfei, S.; Shun, H.; Haitao, D.; Wuyi, C. Cutting performance and wear mechanism of Sialon ceramic tools in high speed face milling GH4099. Ceram. Int. 2019. [Google Scholar] [CrossRef]
  2. Datta, A.; Dutta, S.; Pal, S.K.; Sen, R. Progressive cutting tool wear detection from machined surfaceimages using Voronoi tessellation method. J. Mater. Proc. Technol. 2013, 213, 2339–2349. [Google Scholar] [CrossRef]
  3. Xuewei, Z.; Tianbiao, Y.; Ji, Z. Surface generation modeling of micro milling process with stochastic tool wear. Precis. Eng. 2019. [Google Scholar] [CrossRef]
  4. JingHui, Z.; LiZhi, Z.; Yuying, Y.; Jie, Z. Mechanical durability of superhydrophobic surfaces: The role of surface modification technologies. Appl. Surf. Sci. 2017, 392, 286–296. [Google Scholar] [CrossRef]
  5. Shota, I.; Kenta, T.; Shinya, S. Generation mechanism of friction anisotropy by surface texturing under boundary lubrication. Tribol. Int. 2019. [Google Scholar] [CrossRef]
  6. Boidi, G.; Tertuliano, I.S.; Profito, F.J.; de Rossi, W.; Machado, I.F. Effect of laser surface texturing on friction behaviour in elastohydrodynamically lubricated point contacts under different sliding-rolling conditions. Tribol. Int. 2019. [Google Scholar] [CrossRef]
  7. Hongzhi, Y.; Jianxin, D.; Dongliang, G.; Xuemu, L.; Yun, Z. Effect of surface texturing on tribological performance of sliding guideway under boundary lubrication. J. Manuf. Process. 2019, 47, 172–182. [Google Scholar] [CrossRef]
  8. Joaquin, A.; Jon-Emile, S.K.; Frederik, R.B.; Daniel, S.J.P. Dynamic prediction of fluid responsiveness during positive pressure ventilation: a review of the physiology underlying heart–lung interactions and a critical interpretation. Vet. Anaesth. Analg. 2019. [Google Scholar] [CrossRef]
  9. Weili, L.; Hongjian, N.; Hailong, C.; Peng, W. Numerical simulation and experimental investigation on tribological performance of micro-dimples textured surface under hydrodynamic lubrication. Int. J. Mech. Sci. 2019, 163. [Google Scholar] [CrossRef]
  10. Gachot, C.; Rosenkranz, A.; Hsu, S.M.; Costa, H.L. A critical assessment of surface texturing for friction and wear improvement. Wear. 2017, 372–373, 21–41. [Google Scholar] [CrossRef]
  11. Zeeshan, U.R.; Bon, H.K. Effect of Na2SiO.5H2O concentration on the secondary step coating produced on AZ91 magnesium alloy in the K2ZrF6-based el3ectrolyte solution. Surf. Coat. Technol. 2017, 317, 117–124. [Google Scholar]
  12. Faiz, M.; Mertcan, K.; Grzegorz, C.; Bora, D.; Adam, K.; Erdem, A.; Huseyin, C. Influence of alumina and zirconia incorporations on the structure and wear resistance of titania-based MAO coatings. Surf. Coat. Technol. 2019, 377. [Google Scholar] [CrossRef]
  13. Aliofkhazraei, M.; Sabour Rouhaghdam, A. Wear and coating removal mechanism of alumina/titania nanocomposite layer fabricated by plasma electrolysis. Surf. Coat. Technol. 2011, 205, S57–S62. [Google Scholar] [CrossRef]
  14. Shinkarenko, A.; Kligerman, Y.; Etsion, I. The effect of surface texturing in soft elasto-hydrodynamic lubrication. Tribol. Int. 2009, 42, 284–292. [Google Scholar] [CrossRef]
  15. Edeling, W.N.; Cinnella, P.; Dwight, R.P.; Bijl, H. Bayesian estimates of parameter variability in the k-ε turbulence model. J. Comput. Phys. 2014, 258, 73–94. [Google Scholar] [CrossRef] [Green Version]
Figure 1. Triangular micro-texture arrays obtained by laser processing and micro-morphology of triangular taken by DINO-LITE microscope and ultra-high accuracy microscope. (a) Triangular texture with an area occupancy ratio of 7%; (b) Triangular texture with an area occupancy ratio of 10%; (c) Triangular texture with an area occupancy ratio of 13%; (d) Triangular texture microscopic morphology with a scale of 200 μm; (e) Triangular texture microscopic morphology with a scale of 50 μm; (f) Triangle texture 3D morphology.
Coatings 09 00780 g001
Figure 2. Triangular groove micro-texture arrays obtained by laser processing and micro-morphology of triangular groove taken by DINO-LITE microscope and ultra-high accuracy microscope. (a) Triangular groove texture with an area occupancy ratio of 7%; (b) Triangular groove texture with an area occupancy ratio of 10%; (c) Triangular groove texture with an area occupancy ratio of 13%; (d) Triangular groove texture microscopic morphology with a scale of 200μm; (e) Triangular groove texture microscopic morphology with a scale of 50 μm; (f) Triangular groove texture 3D morphology.
Coatings 09 00780 g002
Figure 3. Semicircular ring micro-texture arrays obtained by laser processing and micro-morphology of semicircular ring taken by DINO-LITE microscope and ultra-high accuracy microscope. (a) Semicircular ring texture with an area occupancy ratio of 7%; (b) Semicircular ring texture with an area occupancy ratio of 10%; (c) Semicircular ring texture with an area occupancy ratio of 13%; (d) Semicircular ring texture microscopic morphology with a scale of 200μm; (e) Semicircular ring texture microscopic morphology with a scale of 50 μm; (f) Semicircular ring texture 3D morphology.
Coatings 09 00780 g003
Figure 4. Cross-sectional and longitudinal section pressure distribution and flow velocity vector distribution of fluid in triangular micro-textures: (a) cross-sectional pressure distribution; (b) longitudinal section pressure distribution; (c) longitudinal section speed vector distribution.
Coatings 09 00780 g004aCoatings 09 00780 g004b
Figure 5. Cross-sectional and longitudinal section pressure distribution and flow velocity vector distribution of fluid in triangular groove micro-textures: (a) cross-sectional pressure distribution; (b) longitudinal section pressure distribution; (c) longitudinal section speed vector distribution.
Coatings 09 00780 g005
Figure 6. Cross-sectional and longitudinal section pressure distribution and flow velocity vector distribution of fluid in semicircular micro-textures: (a) cross-sectional pressure distribution; (b) longitudinal section pressure distribution; (c) longitudinal section speed vector distribution.
Coatings 09 00780 g006
Figure 7. Schematic diagram of MMG-10 friction and wear test machine.
Coatings 09 00780 g007
Figure 8. Friction coefficients of the unpolished sample and polished sample: (a) friction coefficient of the unpolished sample; (b) friction coefficient of the polished sample
Coatings 09 00780 g008
Figure 9. Friction coefficients of triangular textured surface with different area occupancy ratios: (a) area occupancy ratio of 7%; (b) area occupancy ratio of 10%; (c) area occupancy ratio of 13%.
Coatings 09 00780 g009
Figure 10. Friction coefficients of triangular groove textured surface with different area occupancy ratios: (a) area occupancy ratio of 7%; (b) area occupancy ratio of 10%; (c) area occupancy ratio of 13%.
Coatings 09 00780 g010
Figure 11. Friction coefficients of semicircular ring textured surface with different area occupancy ratios: (a) area occupancy ratio of 7%; (b) area occupancy ratio of 10%; (c) area occupancy ratio of 13%.
Coatings 09 00780 g011
Figure 12. Friction coefficients of the surface of three textured specimens with different area occupancy ratios: (a) triangular textured surface; (b) triangular groove textured surface; (c) semicircular ring textured surface.
Coatings 09 00780 g012
Figure 13. Coefficients of friction of surface with different morphological textures: (a) area occupancy ratio of 7%; (b) area occupancy ratio of 10%; (c) area occupancy ratio of 13%.
Coatings 09 00780 g013
Figure 14. Wear morphology of the non-textured polished specimen: (a) magnification of 500; (b) magnification of 1500.
Coatings 09 00780 g014
Figure 15. Surface wear morphology of triangular textured specimens. (a) Triangular textured surface wear morphology with a scale of 500 μm; (b) Triangular textured surface wear morphology with a scale of 50 μm; (c) Triangular textured surface wear morphology with a scale of 10 μm; (d) Triangular textured surface wear morphology with a scale of 10 μm; (e) Triangular textured surface wear morphology with a scale of 10 μm.
Coatings 09 00780 g015
Figure 16. Surface wear morphology of triangular groove textured specimens. (a) Triangular groove textured surface wear morphology with a scale of 500 μm; (b) Triangular groove textured surface wear morphology with a scale of 50 μm; (c) Triangular groove textured surface wear morphology with a scale of 10 μm; (d) Triangular groove textured surface wear morphology with a scale of 10 μm; (e) Triangular groove textured surface wear morphology with a scale of 10 μm.
Coatings 09 00780 g016
Figure 17. Surface wear morphology of semicircular ring textured specimens. (a) Semicircular ring textured surface wear morphology with a scale of 500 μm; (b) Semicircular ring textured surface wear morphology with a scale of 50 μm; (c) Semicircular ring textured surface wear morphology with a scale of 10 μm; (d) Semicircular ring textured surface wear morphology with a scale of 10 μm; (e) Semicircular ring textured surface wear morphology with a scale of 10 μm.
Coatings 09 00780 g017
Table 1. Relevant parameters of Libra-HE femtosecond laser device
Average PowerPulse FrequencyPulse WidthLaser WavelengthNumber of Scans
250 mW10 kHz100 fs1000 nm10 times
Table 2. Main components and mechanical properties of cemented carbide.
IngredientIngredient Content (%)Hardness (HRA)Density (g/cm3)Bending Strength (MPa)
WC759711.81180
TiC16
Co9
Table 3. Contents of elements in steel
w(C)%w(Si)%w(Mn)%w(P)%w(S)%w(Cr)%w(Ni)%w(Cu)%
0.4–0.50.18–0.360.6–0.9≤ 0.035≤ 0.035≤ 0.25≤ 0.25≤ 0.25
Table 4. Correspondence between the number of triangular micro-textures and the area occupancy ratios of texture arrays.
Number of Triangular Textures(n)Area Occupancy Ratio/%
237
3210
4213
Table 5. Correspondence between the number of triangular groove micro-textures and the area occupancy ratios of texture arrays.
Number of Triangular Groove Textures (n)Area Occupancy Ratio/%
307
4310
5613
Table 6. Correspondence between the number of semicircular ring micro-textures and the area occupancy ratios of texture arrays.
Number of Semicircular Ring Textures(n)Area Occupancy Ratio/%
87
1210
1613
Table 7. Experimental scheme and the values of the relevant condition parameters
Types of Micro-TexturesArea Occupancy RatiosExperimental Force (N)Rational Speed (rpm)Form of Friction PairsLubrication Condition
Triangle
Triangular groove
Semicircular ring
About 7%
About 10%
About 13%
50
100
200
300
40
80
120
160
Face contact
(ring-disc
friction pairs)
25 °C
Atmospheric pressure,
Oil lubrication (Mobil 1 lubricant, viscosity 0–40 W)
Table 8. Weight loss of non-textured specimens and textured specimens.
Weight Loss of Non-Textured Specimens (mg)Unpolished Sample28.4
Polished Sample21.3
Weight loss of triangular textured specimens (mg)Area occupancy ratio 7%16.9
Area occupancy ratio 10%14.1
Area occupancy ratio 13%18.7
Weight loss of triangular groove textured specimens (mg)Area occupancy ratio 7%15.4
Area occupancy ratio 10%13.8
Area occupancy ratio 13%17.5
Weight loss of semicircular ring textured specimens (mg)Area occupancy ratio 7%13.9
Area occupancy ratio 10%11.7
Area occupancy ratio 13%14.2

