Article

ZnO Nanocrystal-Based Chloroform Detection: Density Functional Theory (DFT) Study

1
Promising Centre for Sensors and Electronic Devices (PCSED), Najran University, Najran 11001, Saudi Arabia
2
Department of Physics, Faculty of Science and Arts, Najran University, Najran 11001, Saudi Arabia
3
Physics Department, Faculty of Education, Ain Shams University, Cairo 11566, Egypt
4
Department of Chemistry, Faculty of Science and Arts, Najran University, Najran 11001, Saudi Arabia
5
Department of Applied Medical Science, Community College, King Saud University, Riyadh 11437, Saudi Arabia
6
Biomedical Engineering Department, Faculty of Engineering, Helwan University, P.O. Box, Helwan 11792, Egypt
7
Chemical Engineering Department, King Saud University, P. O. Box 800, Riyadh 11421, Saudi Arabia
*
Authors to whom correspondence should be addressed.
Coatings 2019, 9(11), 769; https://doi.org/10.3390/coatings9110769
Submission received: 5 October 2019 / Revised: 13 November 2019 / Accepted: 14 November 2019 / Published: 19 November 2019
(This article belongs to the Special Issue Mesoporous Metal Oxide Films)

Abstract

:
We investigated the detection of chloroform (CHCl3) using ZnO nanoclusters via density functional theory calculations. The effects of various concentrations of CHCl3, as well as the deposition of O atoms, on the adsorption over ZnO nanoclusters were analyzed via geometric optimizations. The calculated difference between the highest occupied molecular orbital and the lowest unoccupied molecular orbital for ZnO was 4.02 eV. The most stable adsorption characteristics were investigated with respect to the adsorption energy, frontier orbitals, elemental positions, and charge transfer. The results revealed that ZnO nanoclusters with a specific geometry and composition are promising candidates for chloroform-sensing applications.

1. Introduction

The rapid development of various important industries, such as automobiles, pharmaceuticals, textiles, food, and agriculture, has substantially contributed to environmental pollution [1]. The release of various toxic and harmful gases and chemicals from such industries has significantly disturbed the ecosystem, and poses a great threat not only to humans, but to all living beings [2,3]. Among the various toxic gases, chloroform, which is also known as tri-chloromethane or methyl-tri-chloride, is considered to be one of the most toxic gases, and evaporates quickly when exposed to air [4]. It is widely used by chemical companies and in paper mills. Chloroform lasts for a long time in the environment, and its breakdown products, such as phosgene and hydrogen chloride, are as toxic or even more toxic [5]. The exposure of humans to chloroform severely affects the central nervous system, kidneys, liver, etc. Long-term exposure may result in vomiting, nausea, dizziness, convulsions, depression, respiratory failure, coma, and even sudden death [6,7]. It is important to efficiently detect the release of chloroform because of its serious health hazards. Thus, various methods have been reported for detecting chloroform, which involve optical sensors, colorimetric sensors, fluorescent sensors, electrochemical sensors, resistive gas sensors, luminescent sensors, photo-responsive sensors, etc. [8,9,10,11,12,13].
Among the various sensing techniques, gas sensors have attracted considerable attention because of their facile manufacturing process, high sensitivity, and low detection limit [14,15,16,17]. The literature reveals that metal-oxide materials are the most widely used scaffold to fabricate gas sensors [15,16,17,18,19,20]. In particular, metal-oxide materials are widely utilized to fabricate sensors for toxic and explosive gases [20,21,22,23,24]. It has been observed that the nanocrystal interfaces can significantly influence the optical and electrical properties and charge-trapping phenomena [22,23,24,25]. Zinc oxide (ZnO) is one of the most important and functional materials because of its various significant properties, including its wide bandgap; high exciton binding energy, piezoelectricity, and pyroelectricity; high conductivity and electron mobility; good stability in chemical and thermal environments; and biocompatibility [26,27,28]. Therefore, to improve the gas-sensing performance of ZnO-based gas sensors, various approaches have been employed, such as doping, surface modification, and the fabrication of composites [26,29]. Although ZnO materials are used for various gas-sensing applications [30,31,32,33,34], there are few reports available on the use of ZnO materials for chloroform sensing. Ghenaatian et al. [35] investigated the Zn12O12 nanocage as a promising adsorbent and detector for CS2. Baie et al. examined the Zn12O12 fullerene-like cage as a potential sensor for SO2 detection [36]. Ammar [37] reported that the Zn12O12 nanocage is a potential sorbent and detector for formaldehyde molecules. Nanocrystalline ZnO thin-film gas sensors were investigated by Mayya et al. [38] for the detection of hydrochloric acid, ethanolamine, and chloroform. Additionally, it is important to examine various geometries and other electronic parameters in order to obtain the optimal sensing material based on ZnO.
In this study, we investigated the detection of chloroform (CHCl3) using ZnO nanoclusters via density functional theory (DFT) calculations implemented in a Gaussian 09 program. The effect of various concentrations of CHCl3, as well as the deposition of O atoms, on the adsorption over ZnO nanoclusters was analyzed via geometric optimizations. To fully exploit the ZnO nanocrystals, various calculations related to the gas-sensing properties were performed.

2. Methods and Computational Details

A quantum cluster consisting of 24 atoms (Zn12O12) was selected to study the interaction between the ZnO nanocage and the CHCl3 molecule. DFT calculations were performed with the Gaussian 09 suite of programs [39]. The calculations were conducted using Becke’s three-parameter B3 with the Lee, Yang, and Parr (LYP) correlation functional [40]. This B3LYP hybrid functional contains the exchange–correlation functional, and is based on the exact form of the Vosko–Wilk–Nusair correlation potential [41]. Originally, the functional B included the Slater exchange along with corrections involving the gradient of density [42]. The correlation functional LYP was that of Lee, Yang, and Parr, which includes both local and nonlocal terms [43,44]. For the ZnO nanocage, the standard LANL2DZ basis set [37,45] was used. For the CHCl3 and the deposited O atoms, a 6-31G (d, p) basis set was used. The adsorption energy (Eads) of the CHCl3 molecule on the surface of the Zn12O12 nanocage is defined as follows:
E ads = [ E ( CHCl 3 ) n / ZnO ( n E CHCl 3 + E ZnO ) ] / n ,
where E CHCl 3 , E ZnO and E ( CHCl 3 ) n / ZnO represent the energies of a single CHCl3 molecule, the pristine Zn12O12 nanocage, and the (CHCl3)n/Zn12O12 complex, respectively.
The adsorption energy (Eads) of an O atom on the surface of the Zn12O12 nanocage is defined as follows:
E ads = [ E O n / ZnO ( n E O + E ZnO ) ] / n ,
where E O and E O n / ZnO represent the energies of a single O atom and the O n / Zn 12 O 12 complex, respectively.
The adsorption energy (Ei) of a CHCl3 molecule on the deposited O on the Zn12O12 nanocage is defined as follows:
E i = [ E ( CHCl 3 ) n / O n / ZnO ( n E CHCl 3 + n E O + E ZnO ) ] / n ,
where E ( CHCl 3 ) n / O n / ZnO represents the energy of the ( CHCl 3 ) n / O n / ZnO complex.
The positive and negative values of Ei indicate the endothermic and exothermic processes, respectively. The binding energy (Eb) between the X and Y fragments of the XY complex is defined as follows:
E b = E XY ( E X + E Y ) ,
where EXY represents the total energy of the optimized molecule, and EX and EY represent the energies of the two fragments X and Y, respectively, having the same geometric structure as in the XY complex. The GaussSum 2.2.5 program was used to calculate the densities of states (DOSs) for the Zn12O12 nanocage, CHCl3, and other complex systems [46]. Full natural bond orbital (NBO; NBO version 3.1) analyses were used to estimate the charge distributions for the Zn12O12 nanocages, CHCl3, and other complex systems [47].

3. Results and Discussion

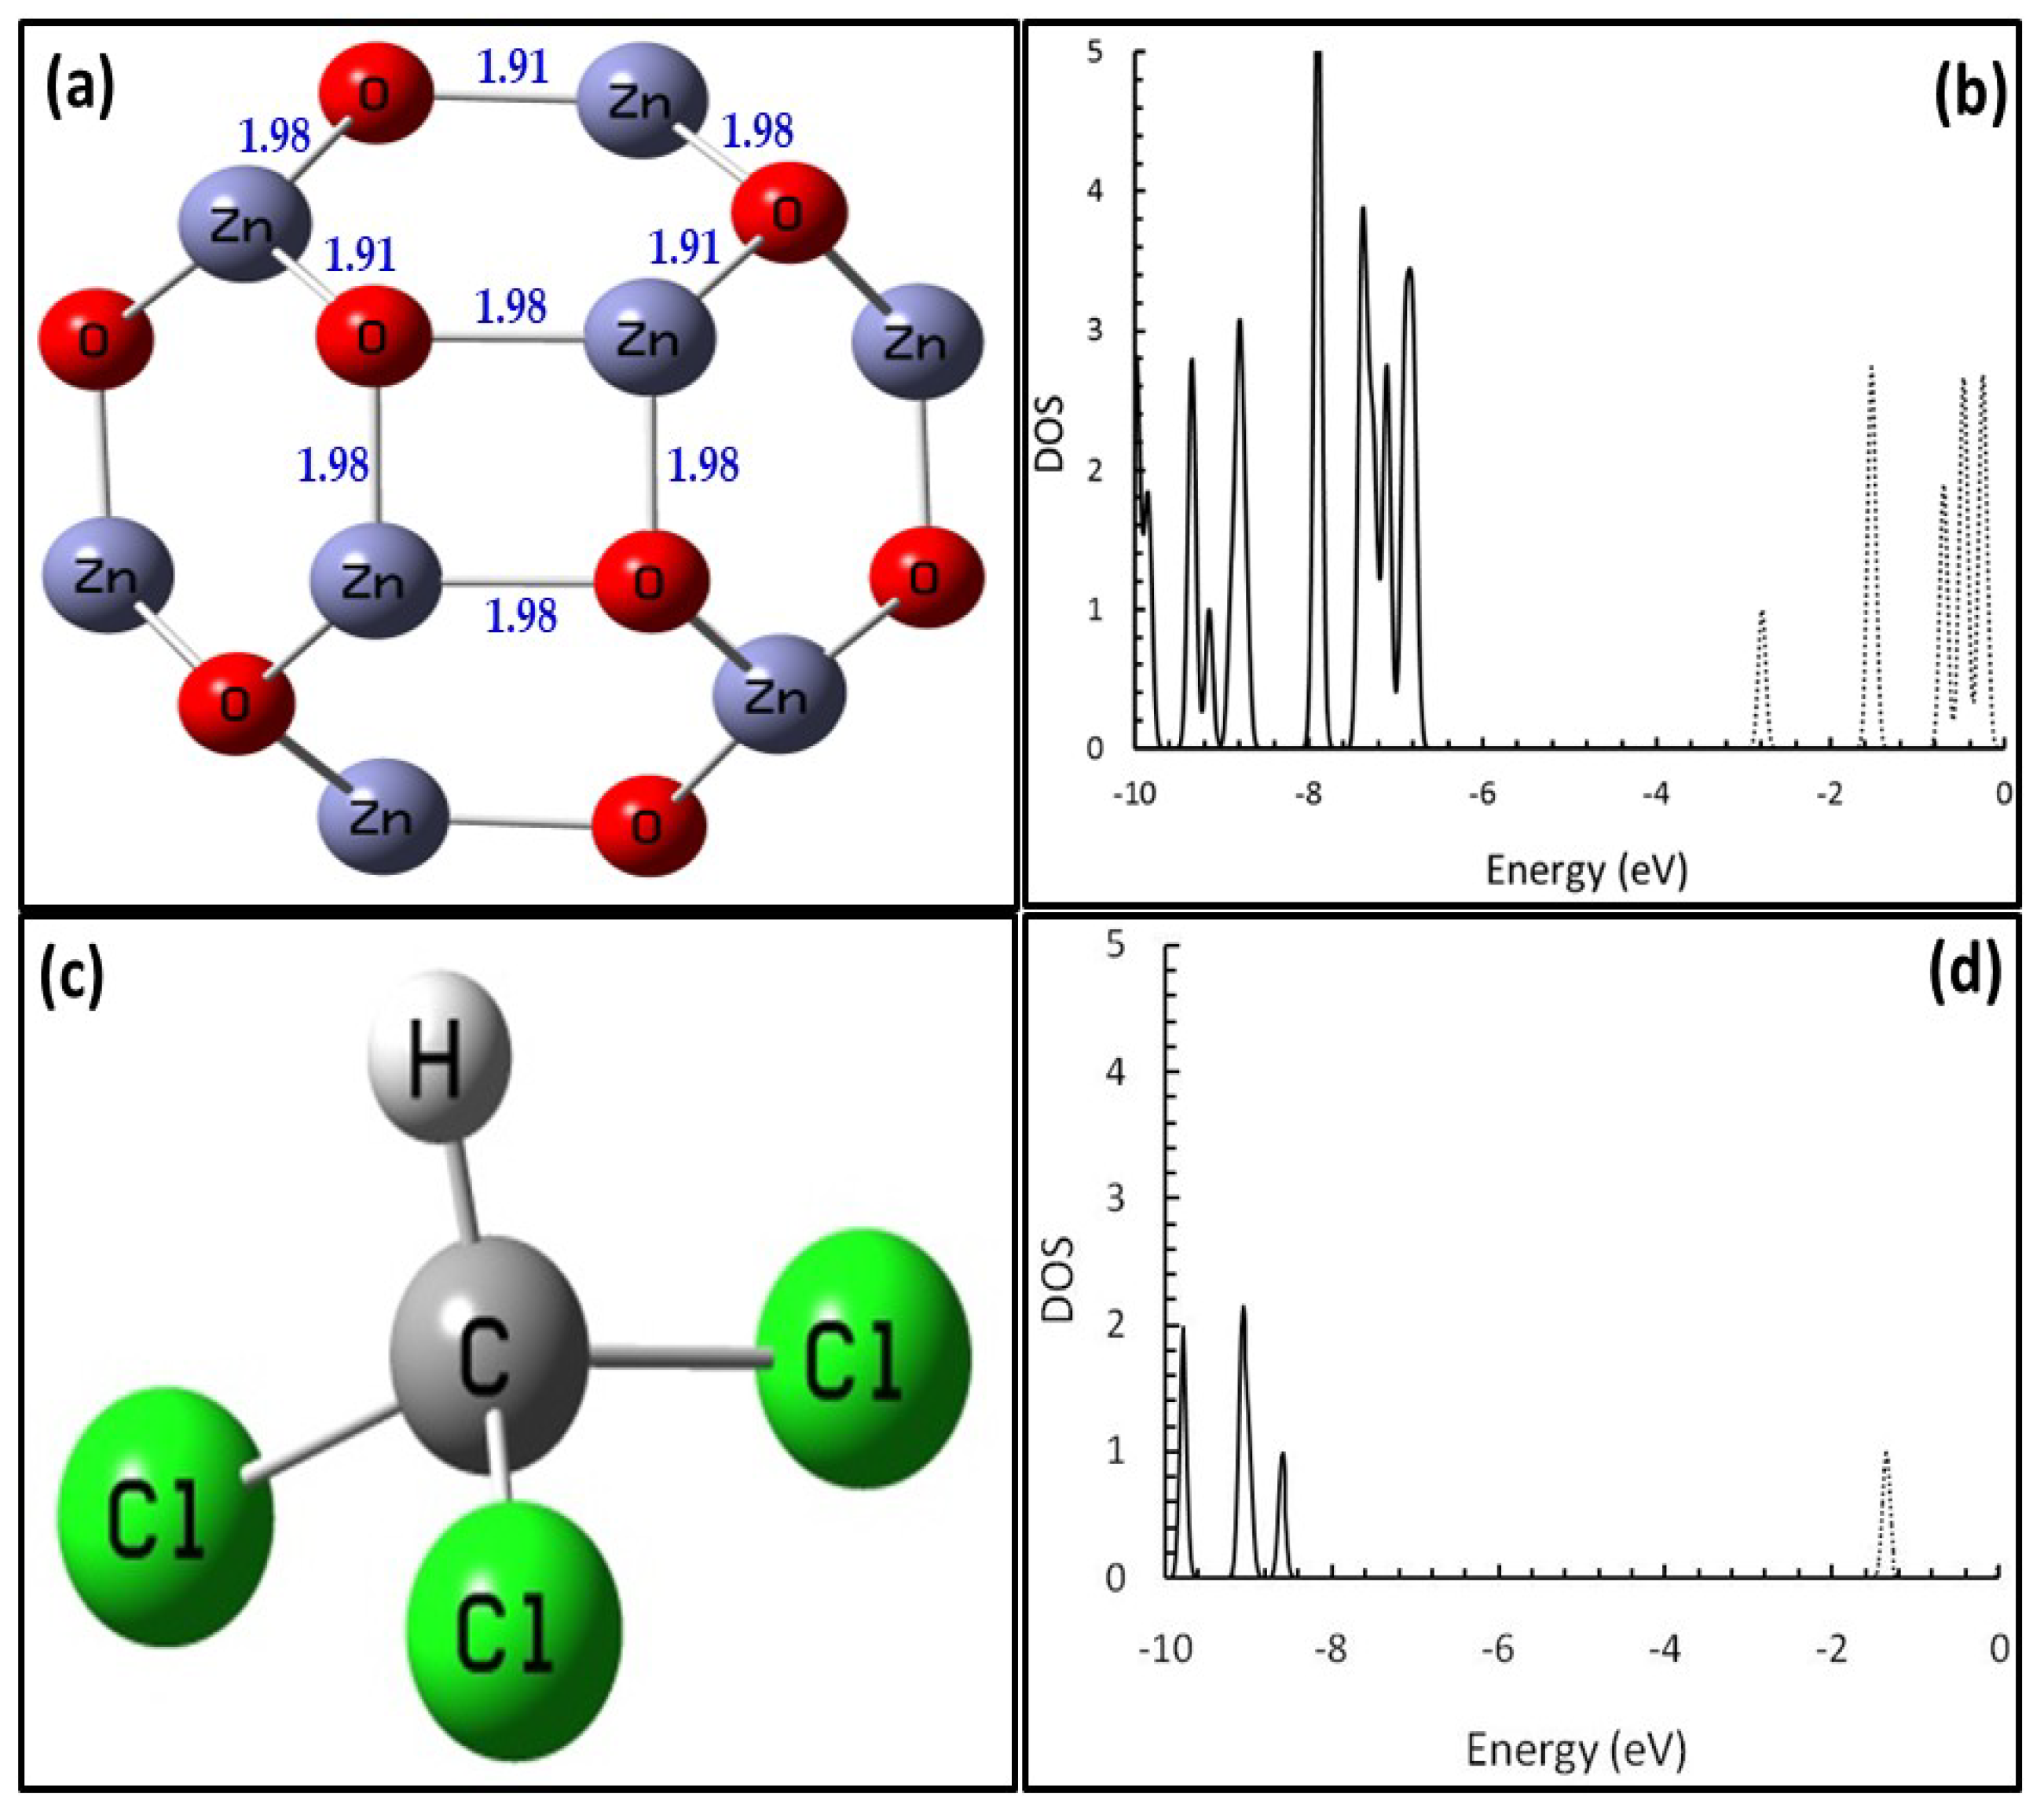
3.1. Geometric Optimization

The geometric optimization of a pristine Zn12O12 nanocage was performed. Zn12O12 is composed of eight (ZnO)3 and six (ZnO)2 rings, forming a cluster in which all of the Zn and O vertices are equivalent [48], as shown in Figure 1. The examined structural properties of the Zn12O12 nanocage agreed well with previous studies [37,45,49]. For example, the bond lengths RZn-O of 1.91 and 1.98 Å were close to the previously reported values of 1.91 and 1.98 Å, respectively [37,45], and 1.89 and 1.97 Å, respectively [47]. The calculated highest occupied molecular orbital (HOMO)–lowest unoccupied molecular orbital (LUMO) energy gap for ZnO was found to be 4.02 eV, which agrees well with a previous work [45].
The DOS of the Zn12O12 nanocage was calculated, as shown in Figure 1. A geometric optimization was performed for the chloroform molecule (CHCl3). It is a tetrahedral molecule, as shown in Figure 1. The calculated structural properties of CHCl3 indicated that bond lengths RC-H and RC-Cl were 1.09 and 1.79 Å, respectively, and angles AH-C-Cl and ACl-C-Cl were 107.5° and 11.4°, respectively. The energy gap (Eg) between the HOMO and LUMO was calculated to be 7.27 eV. The DOS for CHCl3 was calculated, and is presented in Figure 1.

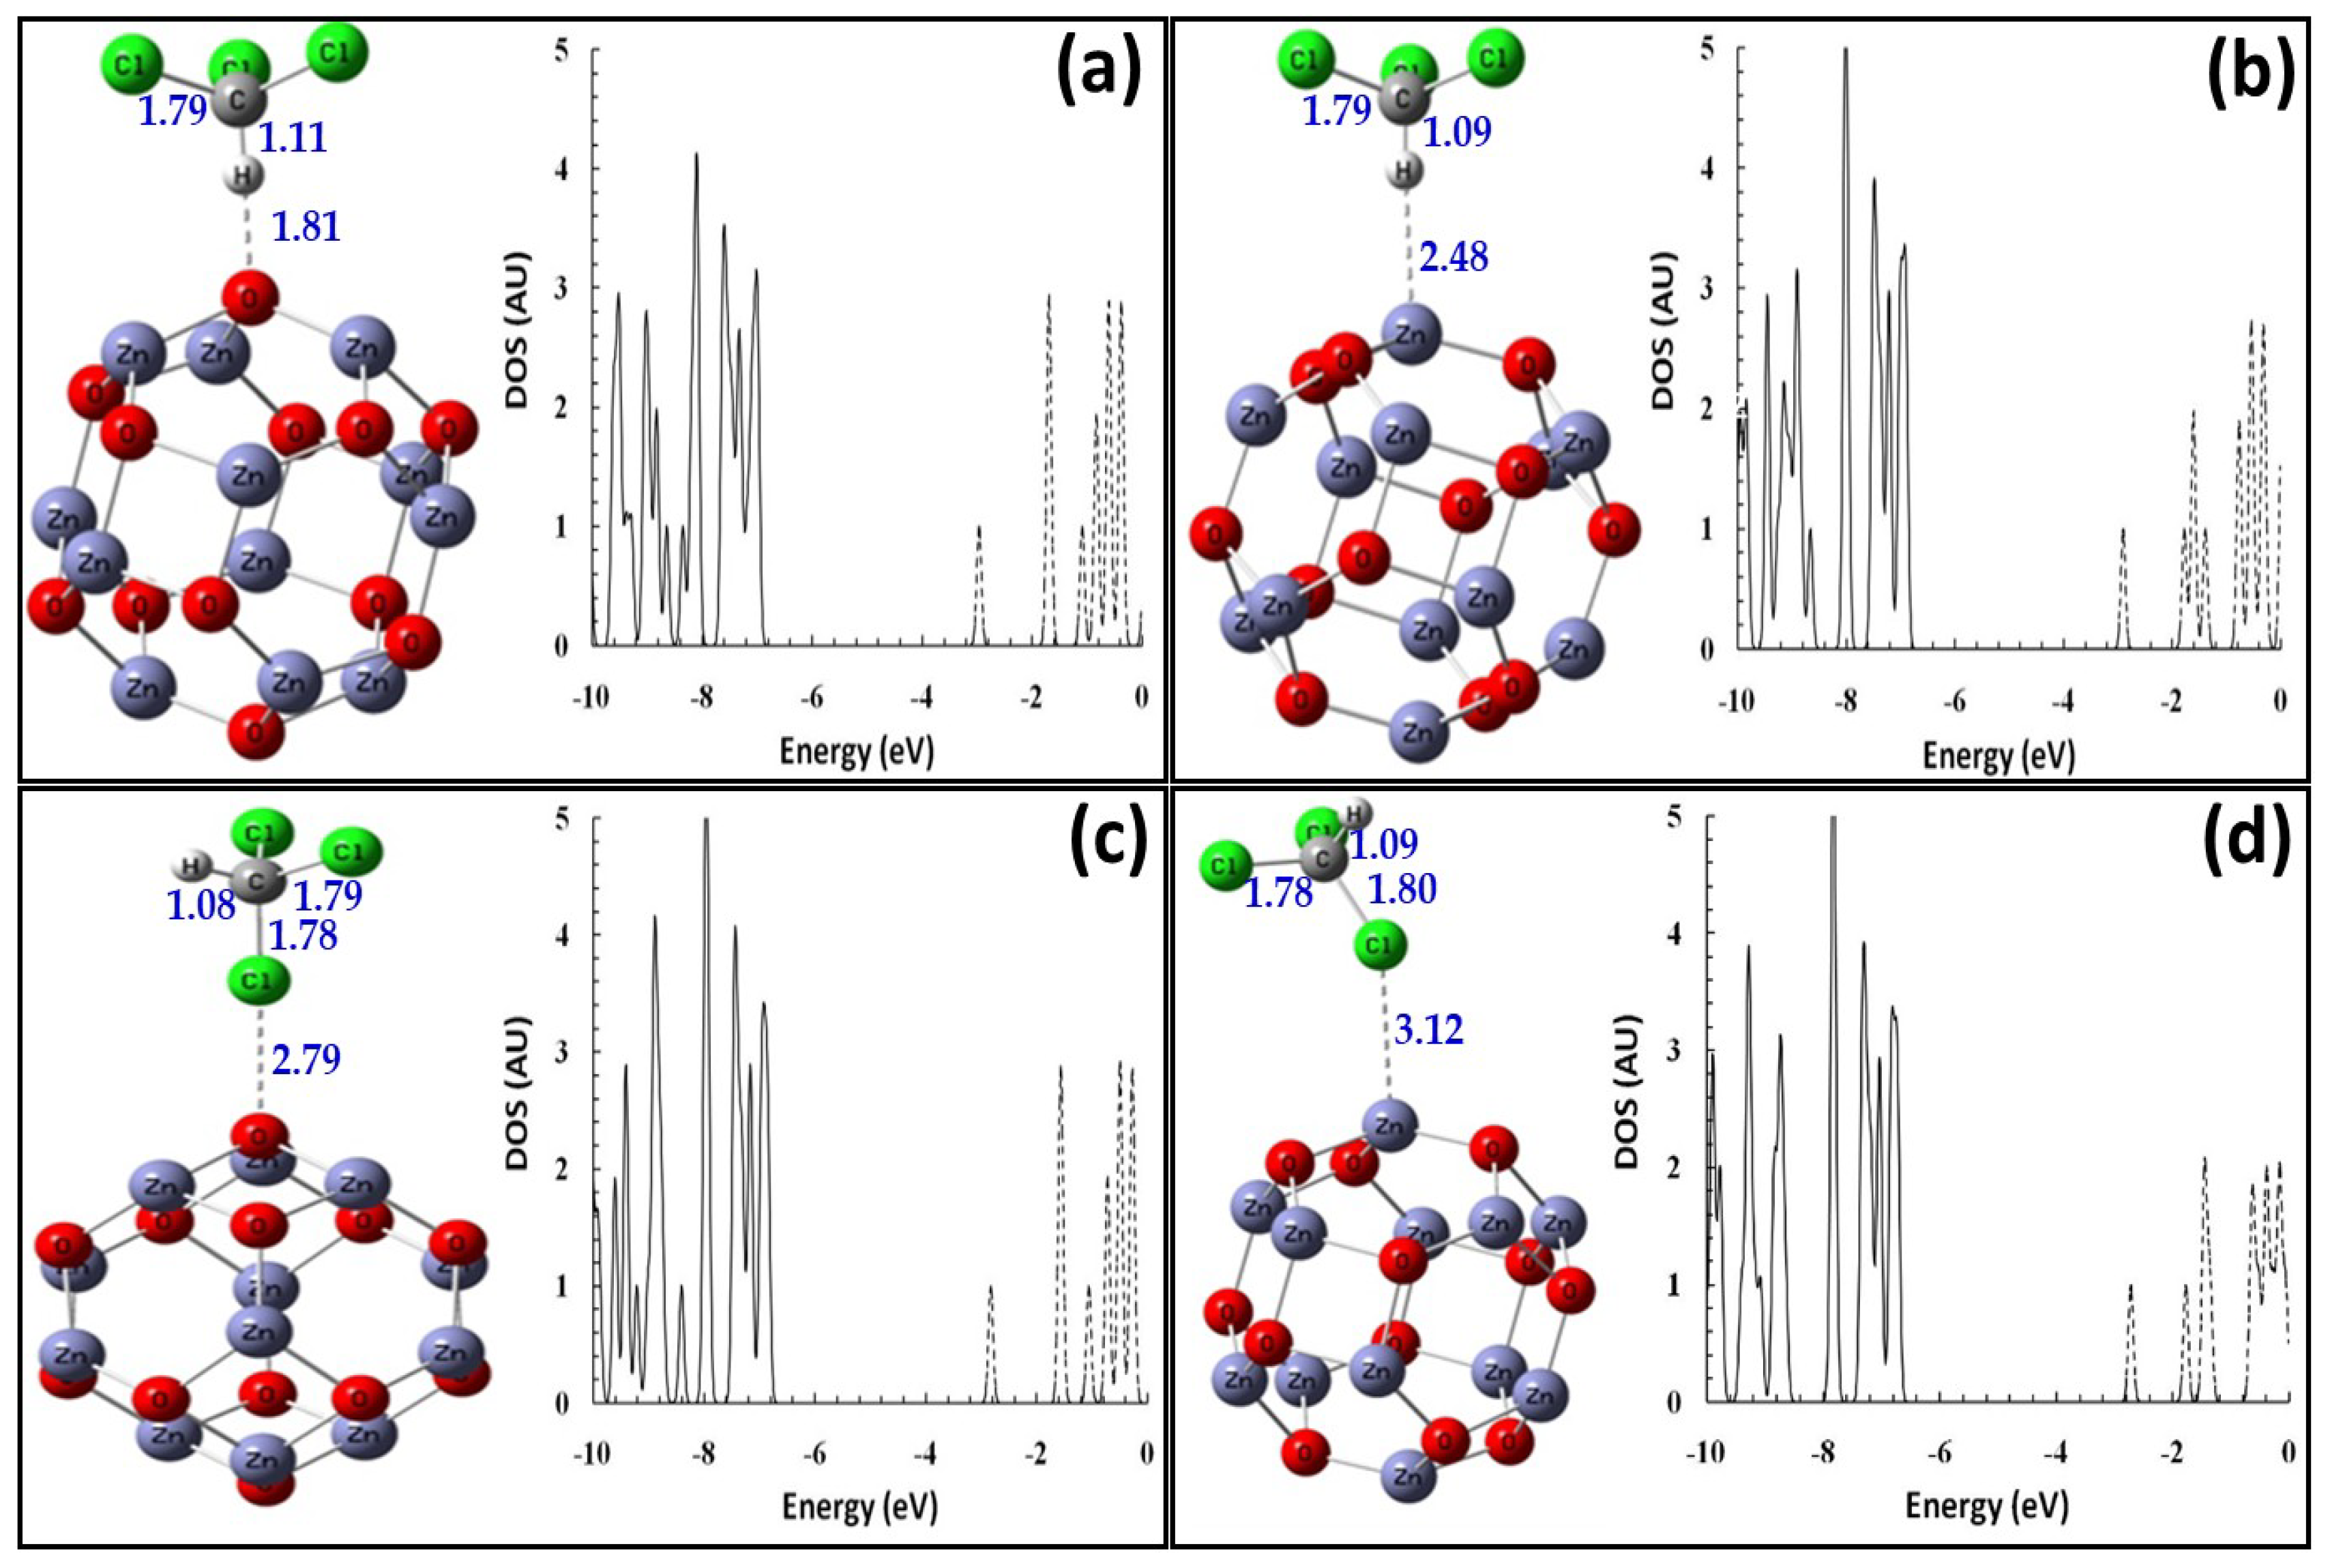
3.2. CHCl3 Interaction with the Zn12O12 Nanocage

The geometric optimizations for four probable orientations of CHCl3 on the surface of the Zn12O12 nanocage were investigated. Figure 2 shows the four orientations where the CHCl3 molecule may interact via its H head or Cl head, and may be absorbed over the O site or Zn site of the Zn12O12 nanocage. The adsorption energy was calculated using Equation (1). The electronic properties of the CHCl3 adsorption modes are presented in Table 1. For the first adsorption mode (a), the CHCl3 molecule was weakly chemically adsorbed, and for the other modes (b, c, and d), the CHCl3 molecule was physically adsorbed. The boundary value between the physical and chemical adsorption was considered to be 0.21 eV [50,51]. In mode (a), owing to the chemical interaction, the Fermi level (EFL) for the cluster was reduced by 0.17 eV, and the dipole moment (D) was increased to 3.05 Debye. There was no noticeable change in the HOMO–LUMO energy gap. In all of the adsorption modes, it was found that the HOMO–LUMO energy gaps of the CHCl3/ZnO complexes were in the range of 4.00–4.03 eV. Consequently, the adsorption of CHCl3 on the ZnO nanocage had no significant effect on the HOMO–LUMO energy gap.
Additionally, to investigate the effect of the CHCl3 concentration on the adsorption over the Zn12O12 nanocage, we performed geometric optimizations for n CHCl3 molecules (n = 1, 2, 3, and 4) adsorbed simultaneously over the Zn12O12 nanocage to form (CHCl3)n/ZnO complexes. All of the CHCl3 molecules had an orientation in which the H head of the CHCl3 molecule was directed toward an O site of the Zn12O12 nanocage, which is the most energetic stable orientation, as presented in Figure 2. The adsorption energies (Eads) were calculated using Equation (1), and are presented in Table 2.
The optimized structures of (CHCl3)n/ZnO and their DOSs are shown in Figure 3. As indicated by Table 2, after the second molecule was adsorbed, the adsorption energy (Eads) increased as n—the number of adsorbed CHCl3 molecules—increased. Additionally, as the number of adsorbed CHCl3 molecules increased, the Fermi level decreased. Furthermore, although there were no significant changes in the average acquired charge ( Q CHCl 3 ) on the CHCl3 molecules, the dipole moment was sensitive to the number of adsorbed CHCl3 molecules. The HOMO–LUMO energy gap (Eg), compared with that of the pristine Zn12O12 nanocage (4.02 eV), was not affected by the number of adsorbed CHCl3 molecules.

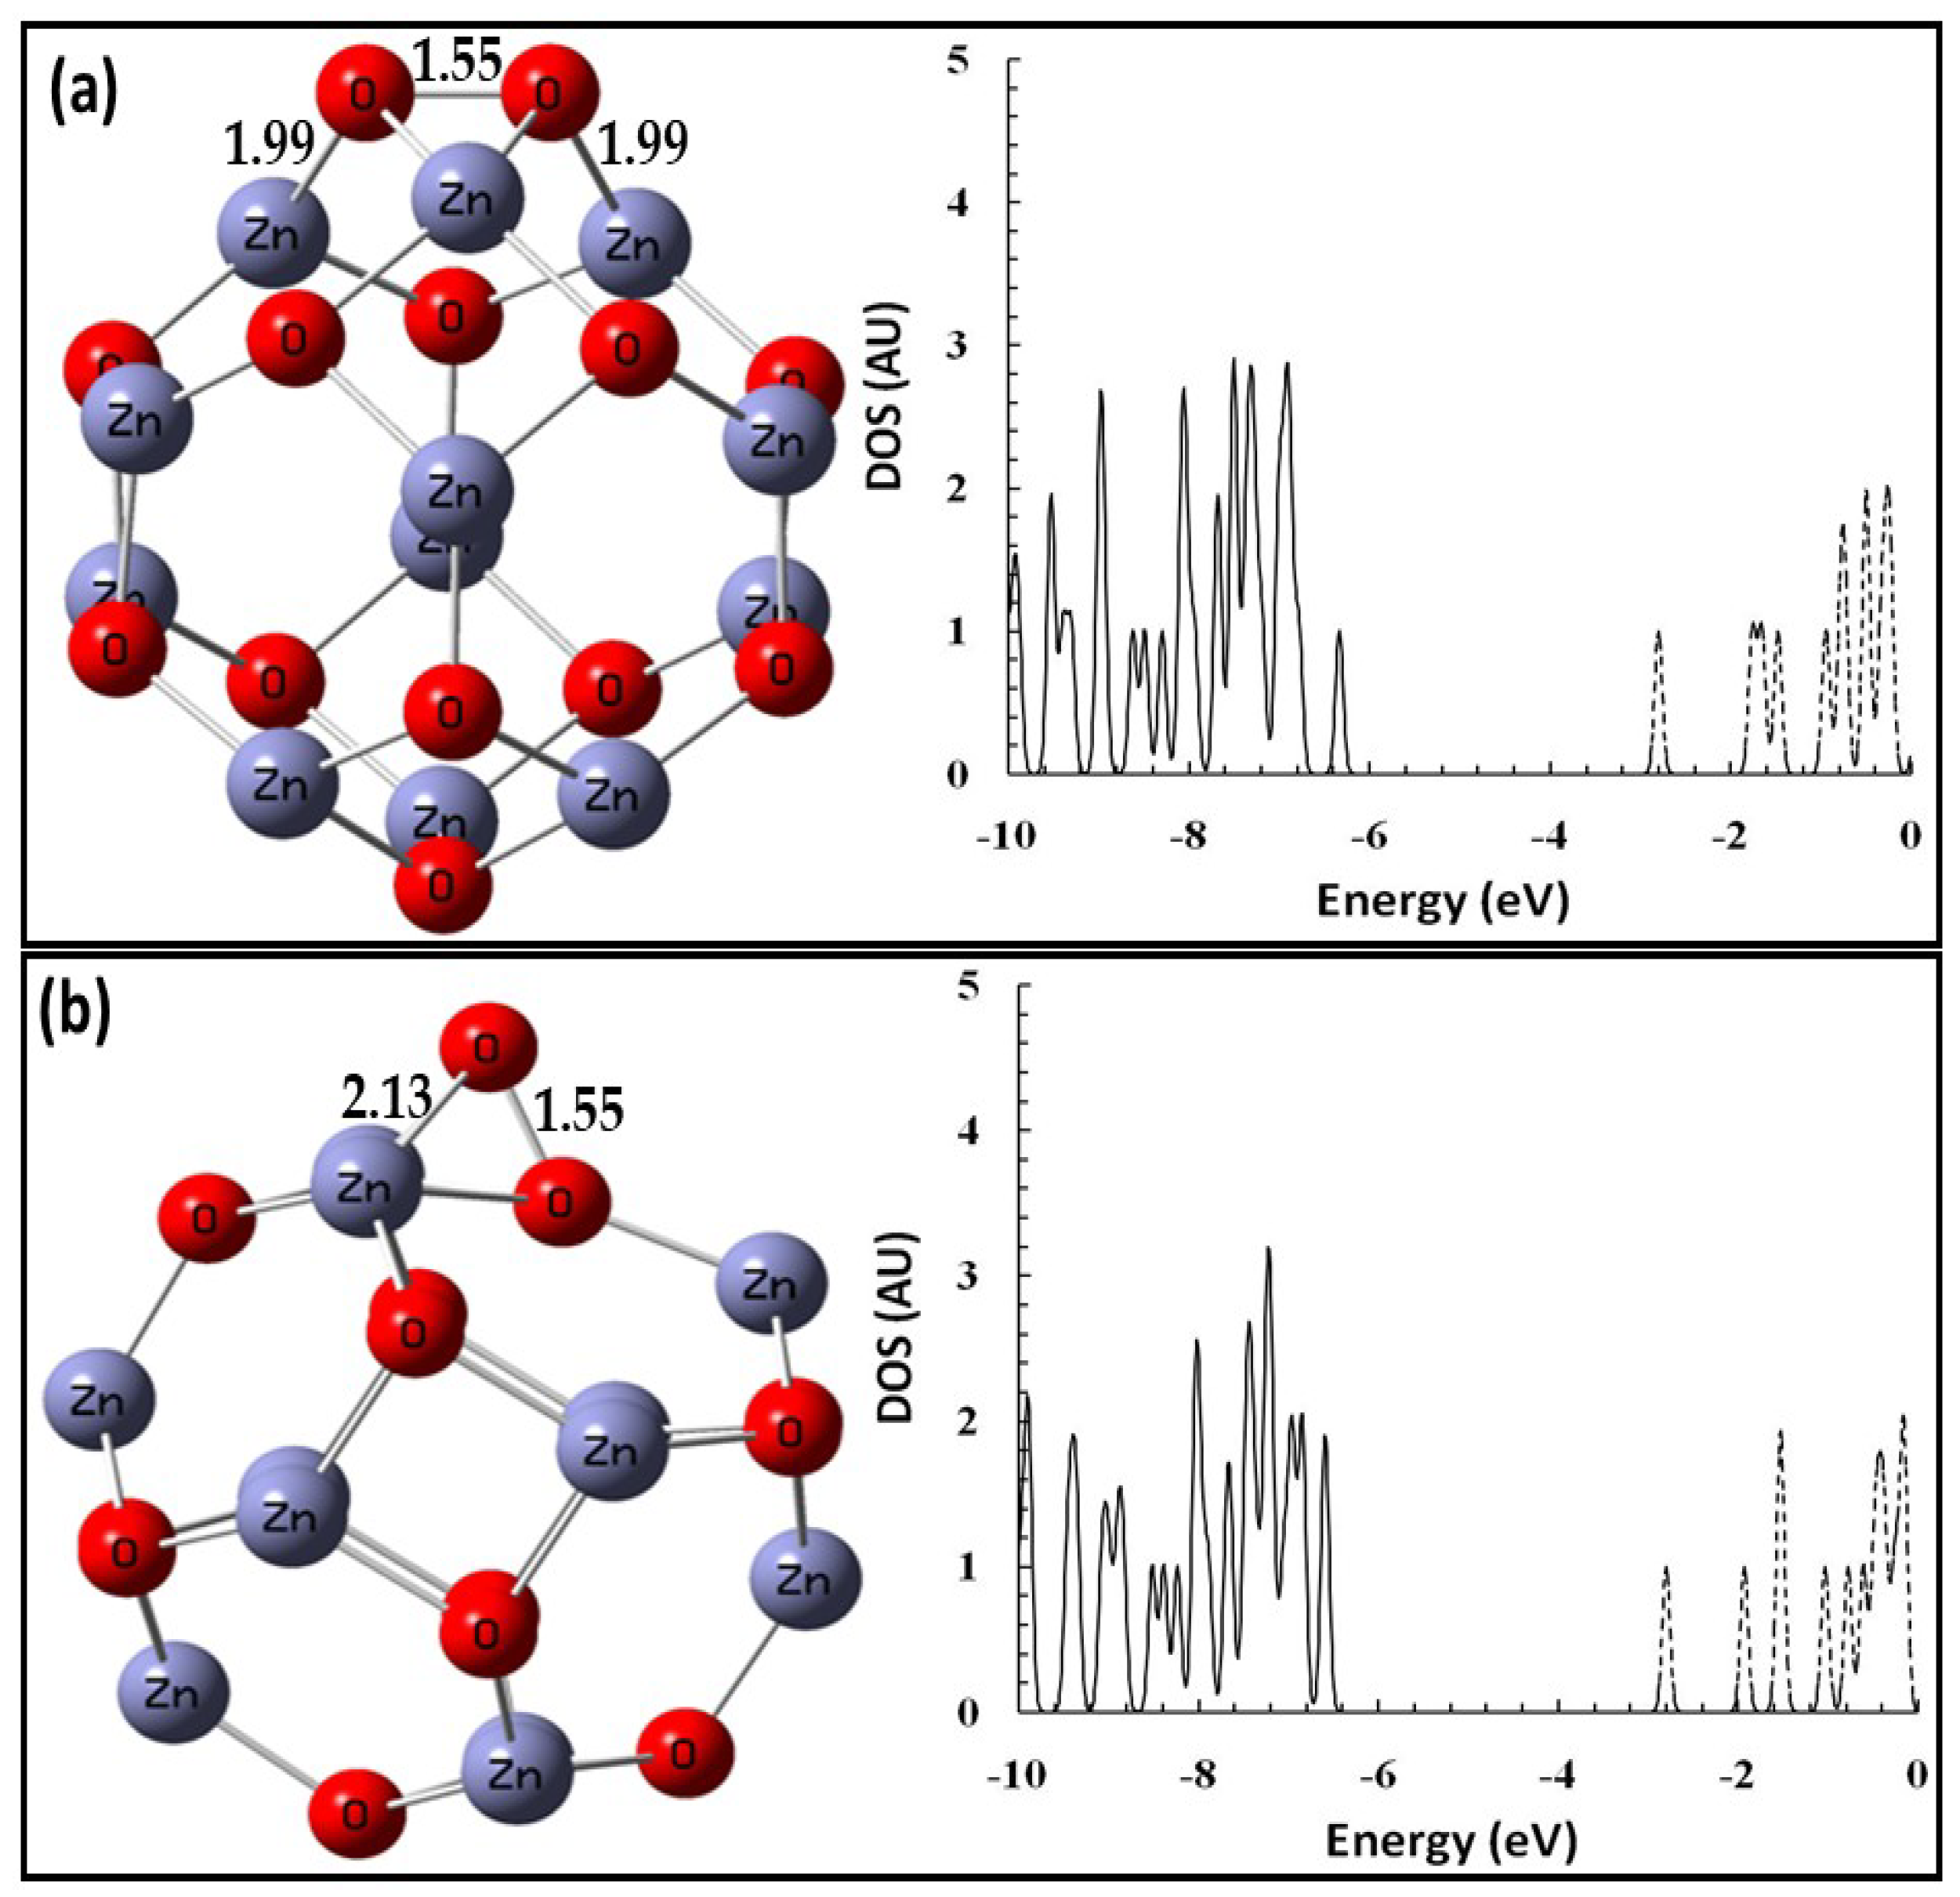
3.3. O Atom Interaction with the Zn12O12 Nanocage

To improve the sensitivity of Zn12O12 to the CHCl3 molecules, an O atom was deposited onto the cluster. To investigate the ability of the Zn12O12 nanocage to adsorb an O atom, the O atom was added at three different sites, namely: an O site, a Zn site, and the middle of the ZnO bond. Then, a full geometric optimization was performed for the O/Zn12O12 complexes. With the optimization, there are only two possible O/Zn12O12 complexes, as shown in Figure 4. The Eads were calculated using Equation (2). As shown in Table 3, the Eads values of the O atom on the Zn12O12 nanocage were −1.98 and −1.62 eV for complexes (a) and (b), respectively. This indicated that a chemical bond was formed between the O atom and the Zn12O12 cluster. Additionally, the NBO analysis indicated that the O atom gained negative charges (QO) of −0.71|e| and −0.61|e| for complexes (a) and (b), respectively.
This strong interaction is attributed to the charge transfer from the Zn12O12 nanocage to the adsorbed O atom. As indicated by the DOS in Figure 4, the HOMO–LUMO energy gaps (Eg) of O/Zn12O12 for complexes (a) and (b) were reduced (to 3.53 and 3.78 eV, respectively) compared with that of the pristine Zn12O12 nanocage (4.02 eV; Table 1). Furthermore, for O/Zn12O12 complexes (a) and (b), increases of 0.24 and 0.12 eV, respectively, were observed for the Fermi level (EFL), and the dipole moment increased to 2.03 and 0.72, respectively. This indicated that the deposited O atom significantly affected the electronic properties of the Zn12O12 nanocage, and consequently may have affected its ability to adsorb CHCl3 molecules.

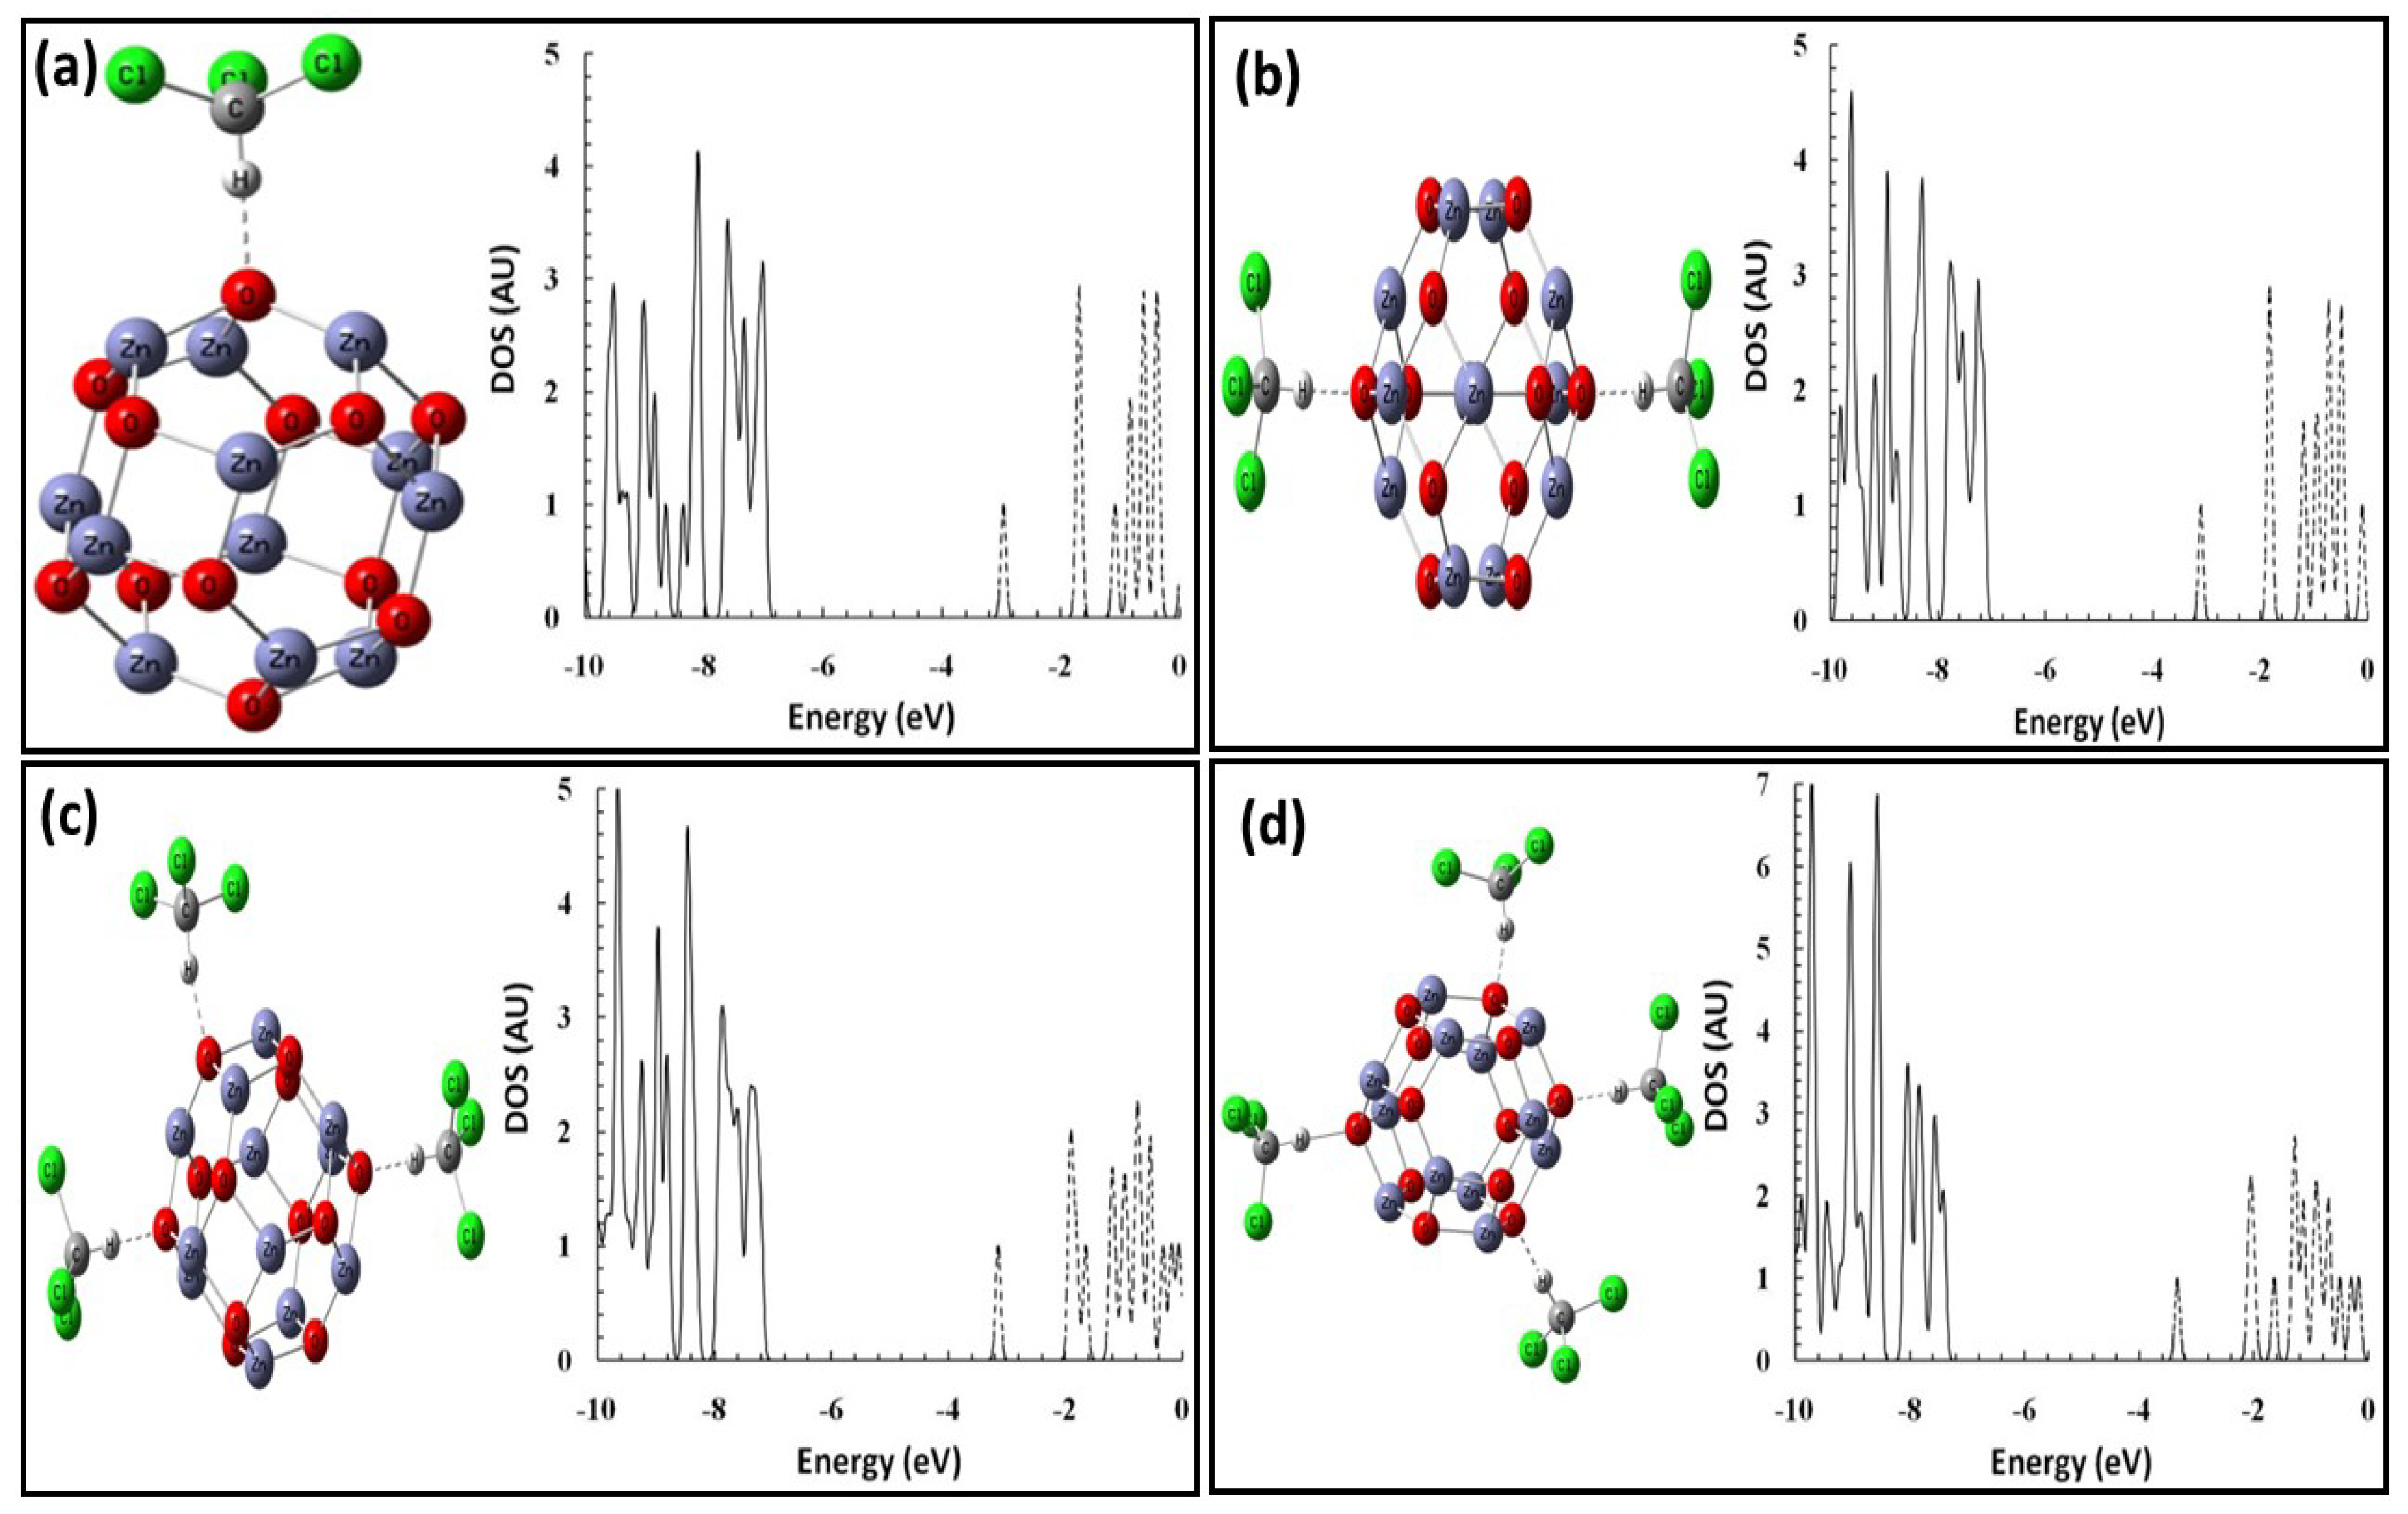
3.4. CHCl3 Interaction with O Atoms Deposited on the Zn12O12 Nanocage

The CHCl3 molecule could interact via its H head or Cl head, and the O atom could be deposited on the Zn or O sites of the nanocage; thus, there were four possible geometric structures for the CHCl3/O/Zn12O12 complexes. Consequently, we performed geometric optimization for the four aforementioned CHCl3/O/Zn12O12 complexes. During the optimization process, we found only three stable CHCl3/O/Zn12O12 complexes, as shown in Figure 5. The properties of the interaction among the CHCl3 molecule, deposited O atom, and Zn12O12 nanocage are presented in Table 4.
The adsorption energies (Eads) for the complexes ranged from −0.92 to −2.44 eV. These values indicate a chemical interaction, which may have been due to a charge transfer. This can be explained by the NBO analysis, which revealed that in complexes (a) and (b), the deposited O atom gained negative charges of −0.63|e| and −0.62|e|, respectively. These charges were mainly transferred from the Zn12O12 nanocage, which gained positive charges of 0.56|e| and 0.59|e|, respectively. Additionally, there was a small charge from the CHCl3 molecule, which gained positive charges of 0.07|e| and 0.03|e|, respectively. However, in complex (c), the charge was transferred from the CHCl3 molecule, which gained a positive charge of 0.86|e|, to both the Zn12O12 nanocage and the deposited O atom, which gained negative charges of −0.10|e| and −0.76|e|, respectively. Clearly, the nature of the interaction in complex (c) was significantly different from those for complexes (a) and (b). This led to different binding energies between the CHCl3 fragment and the O/Zn12O12 fragment of the CHCl3/O/Zn12O12 complexes, which were −0.68, −0.15, and −2.46 eV for complexes (a), (b), and (c), respectively. Such interactions between CHCl3 and the O/Zn12O12 nanocage led to an increase in the Fermi level (EFL), from −4.64 to −4.49 eV, as well as a reduction of the HOMO–LUMO energy gaps (Eg), from 3.27 to 3.64 eV for the CHCl3/O/Zn12O12 complexes, compared with 4.02 eV for the pristine Zn12O12 nanocage.
To examine the effect of the CHCl3 concentration on the interaction with the O/Zn12O12 nanocage, we performed geometric optimizations for n CHCl3 molecules (n = 1, 2, 3, and 4), adsorbed simultaneously over n deposited O atoms on the Zn12O12 nanocage. Each CHCl3 molecule interacted via its Cl head with a deposited O atom on the Zn site of the Zn12O12 nanocage. This orientation yielded the highest binding energy between the CHCl3 molecule and O/Zn12O12. The interaction energies were calculated using Equation (3). The optimized structures of (CHCl3)n/O/Zn12O12 and their DOSs are shown in Figure 6.
The interaction energies are presented in Table 5. The adsorption energy remained relatively constant (approximately −0.96 eV) for the first three CHCl3 interacting molecules, and decreased for the fourth CHCl3 molecule (to −0.86 eV). Furthermore, as the number of adsorbed CHCl3 molecules increased, the average acquired positive charges on CHCl3 ( Q CHCl 3 ) decreased, and the negativity of the average charges on the deposited O atom ( Q O ) decreased, while the negativity of the charges on the Zn12O12 nanocage increased. Additionally, with the increasing number of adsorbed CHCl3 molecules, the Fermi level (EFL) increased and the HOMO–LUMO energy gap (Eg) decreased, compared with the pristine Zn12O12 nanocages. The dipole moment of (CHCl3)n/O/Zn12O12 was sensitive to the number of CHCl3 molecules.

3.5. Zn12O12 Nanocage as a Sensor for CHCl3

It has been observed that during the adsorption process, the change in the HOMO–LUMO energy gap (Eg) is related to the sensitivity of the sorbent for the adsorbate. However, the reduction of Eg of the cluster significantly affects the electrical conductivity, as indicated by the following equation [52]:
σ e ( E g / 2 K T )
where σ represents the electrical conductivity, K represents Boltzmann’s constant, and T represents the temperature. According to Equation (5) and the Eg values in Table 1 and Table 2, the adsorption of the CHCl3 molecule in the gas phase did not lead to significant changes in the Eg of the Zn12O12 nanocage. According to Table 4 and Table 5, the CHCl3 molecule adsorption over the oxygenated ZnO significantly reduced the Eg values.
The energy difference between the nucleophile HOMO and electrophile LUMO is one of the important factors for HOMO–LUMO interactions. As previously mentioned, the chemical bonding between CHCl3 and the oxygenated ZnO cluster in the CHCl3/O/Zn12O12 complexes is due to the charge-transfer mechanism. It can be explained as the contribution from the HOMO of the O/Zn12O12 cluster to the vacant LUMO of the CHCl3 molecule. Figure 7 shows the surfaces of the frontier molecular orbitals (FMOs; HOMO/LUMO) for CHCl3, Zn12O12, O/Zn12O12, and CHCl3/O/Zn12O12. The HOMO and the LUMO of the Zn12O12 cluster are localized on the Zn and O sites, respectively. Thus, the Zn sites are electrophilic centers, whereas the O sites are nucleophilic centers. This explains why the H atom of CHCl3 is attached to the O site in the most stable structure of the CHCl3/Zn12O12 complex. Additionally, the HOMO of the O/Zn12O12 cluster is localized around the deposited O atom. This explains why CHCl3 is attracted to the deposited atom of the O/Zn12O12 cluster.
Figure 8 shows the energy diagrams of the FMOs (HOMO/LUMO) for CHCl3, Zn12O12, O/Zn12O12, and CHCl3/O/Zn12O12. Our FMO studies revealed that the deposited O atom increased the HOMO of the ZnO cluster from −6.81 to −6.32 eV. Consequently, the energy gap between the HOMO of ZnO and the LUMO of CHCl3 decreased, making the charge transfer from the O/Zn12O12 cluster to the CHCl3 easier than that from the pristine Zn12O12 cluster. Thus, the O/Zn12O12 cluster is more sensitive to the CHCl3 molecule than the pristine Zn12O12 cluster.

4. Conclusions

A DOS study of chloroform sensing, based on ZnO nanocrystals, was performed via calculations implemented using the Gaussian 09 suite of programs. A geometric optimization was performed for the ZnO nanocrystal. The DOS for the ZnO nanocrystal was calculated. The calculated gap between the HOMO and the LUMO was found to be 4.02 eV. Furthermore, the effect of the concentration of CHCl3 on its adsorption over the ZnO nanocrystals was investigated. The results indicated that the electrical properties of ZnO were not affected by the concentration of CHCl3. Additionally, the effect of depositing O atoms on the ZnO adsorption properties was examined. The results indicated that the adsorption of CHCl3 on the oxygenated ZnO reduced its bandgap. The findings of this study confirm that the deposition of O on a ZnO nanocluster increases its sensitivity to CHCl3, and may facilitate CHCl3 removal or detection.

Author Contributions

Conception and design of the experiments, H.Y.A., H.M.B. and A.U.; implementation of the experiments, H.Y.A., H.M.B. and A.U.; analysis of the data, contribution of the analysis tools, and writing and revision of the paper, H.Y.A., H.M.B., A.U., H.F. and O.Y.A.

Funding

This work is funded by Deanship of Scientific Research at King Saud University under the research groups grant (No. RG-1435-052).

Acknowledgments

The authors would like to extend their sincere appreciation to the Deanship of Scientific Research at King Saud University for funding this research group (No. RG-1435-052). The authors thank RSSU at King Saud University for their technical support.

Conflicts of Interest

The authors declare no conflict of interest.

References

  1. Batzill, M.; Diebold, U. The surface and materials science of tin oxide. Prog. Surf. Sci. 2005, 79, 47–154. [Google Scholar] [CrossRef]
  2. Wang, Z.-H.; Yang, C.-C.; Yu, H.-C.; Peng, Y.-M.; Su, Y.-K. Electron emission enhanced properties of gold nanoparticle-decorated ZnO nanosheets grown at room temperature. Sci. Adv. Mater. 2018, 10, 1675–1679. [Google Scholar] [CrossRef]
  3. Kim, E.-B.; Lee, J.-E.; Akhtar, M.S.; Ameen, S.; Fijahi, L.; Seo, H.-K.; Shin, H.-S. Electrical sensor based on hollow ZnO spheres for hydrazine detection. J. Nanoelectron. Optoelectron. 2018, 13, 1769–1776. [Google Scholar] [CrossRef]
  4. Bader, C. The dangers of chloroform, etc., and the nitrite of amyl. Lancet 1875, 105, 644. [Google Scholar] [CrossRef]
  5. Featherstone, P.J.; Ravindran, H. Townley’s chloroform inhaler. J. Anesth. Hist. 2018, 4, 103–108. [Google Scholar] [CrossRef] [PubMed]
  6. Verma, P.; Tordik, P.; Nosrat, A. Hazards of improper dispensary: Literature review and report of an accidental chloroform injection. J. Endod. 2018, 44, 1042–1047. [Google Scholar] [CrossRef]
  7. Selby, R. Chloroform-Its benefits and its dangers. Lancet 1848, 51, 190. [Google Scholar] [CrossRef]
  8. Zhang, K.; Zhang, H.; Liu, R.; Yang, Z.; Yuan, Y.; Wang, F. Fabrication of aluminum doped zinc oxide thin films with various microstructures for gas sensing application. Sci. Adv. Mater. 2018, 10, 367–372. [Google Scholar] [CrossRef]
  9. Ahad, I.Z.M.; Harun, S.W.; Gan, S.N.; Phang, S.W. Polyaniline (PAni) optical sensor in chloroform detection. Sens. Actuators B Chem. 2018, 261, 97–105. [Google Scholar] [CrossRef]
  10. Sheng, K.; Lu, H.; Sun, A.; Wang, Y.; Liu, Y.; Chen, F.; Bian, W.; Li, Y.; Kuang, R.; Sun, D. A naked-eye colorimetric sensor for chloroform. Chin. Chem. Lett. 2019, 30, 895–898. [Google Scholar] [CrossRef]
  11. Sharma, S.; Nirkhe, C.; Pethkar, S.; Athawale, A.A. Chloroform vapour sensor based on copper/polyaniline nanocomposite. Sens. Actuators B Chem. 2002, 85, 131–136. [Google Scholar] [CrossRef]
  12. Wang, K.; Li, S.; Jiang, Y.; Hu, M.; Zhai, Q.G. A pillar-layered metal-organic framework as luminescent sensor for selective and reversible response of chloroform. J. Solid State Chem. 2017, 247, 39–42. [Google Scholar] [CrossRef]
  13. Zhang, K.; Zhang, H.; Sun, S.; Yang, Z.; Yuan, Y.; Wang, F. Enhanced gas sensing properties based on ZnO-decorated nickel oxide thin films for formaldehyde detection. Sci. Adv. Mater. 2018, 10, 373–378. [Google Scholar] [CrossRef]
  14. Kumar, R.; Al-Dossary, O.; Kumar, G.; Umar, A. Zinc oxide nanostructures for NO2 gas sensor applications: A review. Nano Micro Lett. 2015, 7, 97–120. [Google Scholar] [CrossRef] [PubMed]
  15. Jia, R.; Xie, P.; Feng, Y.; Chen, Z.; Umar, A.; Wang, Y. Dipole-modified graphene with ultrahigh gas sensibility. Appl. Surf. Sci. 2018, 440, 409–414. [Google Scholar] [CrossRef]
  16. Zhou, Q.; Xu, L.; Umar, A.; Chen, W.; Kumar, R. Pt nanoparticles decorated SnO2 nanoneedles for efficient CO gas sensing applications. Sens. Actuators B Chem. 2018, 256, 656–664. [Google Scholar] [CrossRef]
  17. Umar, A.; Alshahrani, A.A.; Algarni, H.; Kumar, R. CuO nanosheets as potential scaffolds for gas sensing applications. Sens. Actuators B Chem. 2017, 250, 24–31. [Google Scholar] [CrossRef]
  18. Al-Hadeethi, Y.; Umar, A.; Ibrahim, A.A.; Al-Heniti, S.H.; Kumar, R.; Baskoutas, S.; Raffah, B.M. Synthesis, characterization and acetone gas sensing applications of Ag-doped ZnO nanoneedles. Ceram. Int. 2017, 43, 6765–6770. [Google Scholar] [CrossRef]
  19. Umar, A.; Lee, J.-H.; Kumar, R.; Al-Dossary, O. Synthesis and characterization of CuO nanodisks for high-sensitive and selective ethanol gas sensor applications. J. Nanosci. Nanotechnol. 2017, 17, 1455–1459. [Google Scholar] [CrossRef]
  20. Al-Hadeethi, Y.; Umar, A.; Al-Heniti, S.H.; Kumar, R.; Kim, S.H.; Zhang, X.; Raffah, B.M. 2D Sn-doped ZnO ultrathin nanosheet networks for enhanced acetone gas sensing application. Ceram. Int. 2017, 43, 2418–2423. [Google Scholar] [CrossRef]
  21. Nam, G.; Leem, J.Y. A new technique for growing ZnO nanorods over large surface areas using graphene oxide and their application in ultraviolet sensors. Sci. Adv. Mater. 2018, 10, 405–409. [Google Scholar] [CrossRef]
  22. Zhang, N.; Yu, K.; Li, Q.; Zhu, Z.Q.; Wan, Q.J. Room-temperature high-sensitivity H2S gas sensor based on dendritic ZnO nanostructures with macroscale in appearance. Appl. Phys. 2008, 103, 104305. [Google Scholar] [CrossRef]
  23. Jimenez, I.; Arbiol, J.; Dezanneau, G.; Cornet, A.; Morante, J.R. Crystalline structure, defects and gas sensor response to NO2 and H2S of tungsten trioxide nanopowders. Sens. Actuators B Chem. 2003, 93, 475–485. [Google Scholar] [CrossRef]
  24. Chen, Z.; Wang, J.; Umar, A.; Wang, Y.; Li, H.; Zhou, G. Three-dimensional crumpled graphene-based nanosheets with ultrahigh NO2 gas sensibility. ACS Appl. Mater. Interfaces 2017, 9, 11819–11827. [Google Scholar] [CrossRef]
  25. Umar, A.; Akhtar, M.S.; Al-Assiri, M.S.; Al-Salami, A.E.; Kim, S.H. Composite CdO-ZnO hexagonal nanocones: Efficient materials for photovoltaic and sensing applications. Ceram. Int. 2018, 44, 5017–5024. [Google Scholar] [CrossRef]
  26. Umar, A. Encyclopedia of Semiconductor Nanotechnology; American Scientific Publishers: Los Angeles, CA, USA, 2017. [Google Scholar]
  27. Choi, H.J.; Lee, Y.M.; Boo, J.H. Well-aligned ZnO nanorods assisted with close-packed polystyrene monolayer for quartz crystal microbalance. Sci. Adv. Mater. 2018, 10, 610–615. [Google Scholar] [CrossRef]
  28. Yang, J.; Yi, W.; Zhang, L.; Li, T.; Chao, Z.; Fan, J. Facile fabrication of ZnO nanomaterials and their photocatalytic activity study. Sci. Adv. Mater. 2018, 10, 1721–1728. [Google Scholar] [CrossRef]
  29. Umar, A.; Hahn, Y.B. Metal Oxide Nanostructures and Their Applications; American Scientific Publishers: Los Angeles, CA, USA, 2010. [Google Scholar]
  30. Wang, J.X.; Sun, X.W.; Yang, Y.; Huang, H.; Lee, Y.C.; Tan, O.K.; Vayssieres, L. Hydrothermally grown oriented ZnO nanorod arrays for gas sensing applications. Nanotechnology 2006, 17, 4995–4998. [Google Scholar] [CrossRef]
  31. Paraguay, F.; Miki-Yoshida, M.; Morales, J.; Solis, J.; Estrada, L.W. Influence of Al, In, Cu, Fe and Sn dopants on the response of thin film ZnO gas sensor to ethanol vapour. Thin Solid Films 2000, 373, 137–140. [Google Scholar] [CrossRef]
  32. Chaudhary, S.; Kaur, Y.; Umar, A.; Chaudhary, G.R. Ionic liquid and surfactant functionalized ZnO nanoadsorbent for recyclable proficient adsorption of toxic dyes from waste water. J. Mol. Liq. 2016, 224, 1294–1304. [Google Scholar] [CrossRef]
  33. Guo, R.; Cheng, X.; Gao, S.; Zhang, X.; Xu, Y.; Zhao, H.; Huo, L. Highly selective detection of saturated vapors of abused drugs by ZnO nanorod bundles gas sensor. Appl. Surf. Sci. 2019, 485, 266–273. [Google Scholar] [CrossRef]
  34. Shao, C.; Chang, Y.; Long, Y. High performance of nanostructured ZnO film gas sensor at room temperature. Sens. Actuators B Chem. 2014, 204, 666–672. [Google Scholar] [CrossRef]
  35. Ghenaatian, H.R.; Baei, M.T.; Hashemian, S. Zn12O12 nano-cage as a promising adsorbent for CS2 capture. Superlattices Microstruct. 2013, 58, 198–204. [Google Scholar] [CrossRef]
  36. Baei, M.T.; Tabar, M.B.; Hashemian, S. Zn12O12 fullerene-like cage as a potential sensor for SO2 detection. Adsorpt. Sci. Technol. 2013, 3, 469–476. [Google Scholar] [CrossRef] [Green Version]
  37. Ammar, H.Y. CH2O adsorption on M (M = Li, Mg and Al) atom deposited ZnO nano-cage: DFT study. Key Eng. Mater. 2018, 786, 384. [Google Scholar] [CrossRef]
  38. Mayya, D.S.; Prasad, P.; Kumar, J.R.N.; Aswanth, P.; Mayur, G.; Aakanksha, M.; Bindushree, N. Nanocrystalline zinc oxide thin film gas sensor for detection of hydrochloric acid, ethanolamine, and chloroform. Int. J. Adv. Res. Sci. Eng. Technol. 2018, 7, 809–818. [Google Scholar]
  39. Frisch, M.J.; Trucks, G.W.; Schlegel, H.B.; Scuseria, G.E.; Robb, M.A.; Cheeseman, J.R.; Montgomery, J.A., Jr.; Vreven, T.; Kudin, K.N.; Burant, J.C.; et al. Gaussian 09; Gaussian, Inc.: Wallingford, CT, USA, 2004. [Google Scholar]
  40. Becke, A.D. Density-functional thermochemistry. III. The role of exact exchange. J. Chem. Phys. 1993, 98, 5648. [Google Scholar] [CrossRef] [Green Version]
  41. Vosko, S.H.; Wilk, L.; Nusair, M. Accurate spin-dependent electron liquid correlation energies for local spin density calculations: A critical analysis. Can. J. Phys. 1980, 58, 1200–1211. [Google Scholar] [CrossRef] [Green Version]
  42. Becke, A.D. Density-functional exchange-energy approximation with correct asymptotic behavior. Phys. Rev. A 1988, 38, 3098. [Google Scholar] [CrossRef]
  43. Lee, C.; Yang, W.; Parr, R.G. Development of the Colle-Salvetti correlation-energy formula into a functional of the electron density. Phys. Rev. B 1988, 37, 785. [Google Scholar] [CrossRef] [Green Version]
  44. Miehlich, B.; Savin, A.; Stoll, H.; Preuss, H. Results obtained with the correlation energy density functionals of becke and Lee, Yang and Parr. Chem. Phys. Lett. 1989, 157, 200–206. [Google Scholar] [CrossRef]
  45. Beheshtian, J.; Peyghan, A.A.; Bagheri, Z. Adsorption and dissociation of Cl2 molecule on ZnO nanocluster. Appl. Surf. Sci. 2012, 258, 8171. [Google Scholar] [CrossRef]
  46. Boyle, N.M.O.; Tenderholt, A.L.; Langner, K.M. Cclib: A library for package-independent computational chemistry algorithms. J. Comp. Chem. 2008, 29, 839. [Google Scholar] [CrossRef] [PubMed]
  47. Glendening, E.D.; Reed, A.E.; Carpenter, J.E.; Weinhold, F. NBO Program, Version 3.1; University of Wisconsin: Madison, WI, USA, 2001. [Google Scholar]
  48. Narayanaswamy, A.; Xu, H.F.; Pradhan, N.; Peng, X.G. Crystalline nanoflowers with different chemical compositions and physical properties grown by limited ligand protection. Angew. Chem. Int. Ed. 2006, 45, 5361. [Google Scholar] [CrossRef] [PubMed]
  49. Joshi, P.; Shewale, V.; Pandey, R.; Shanker, V.; Hussain, S.; Karna, S.P. Site specific interaction between ZnO nanoparticles and tryptophan: A first principles quantum mechanical study. Phys. Chem. Chem. Phys. 2011, 13, 476. [Google Scholar] [CrossRef] [PubMed]
  50. Shalabi, A.S.; Abdel Aal, S.; Kamel, M.A.; Taha, H.O.; Ammar, H.Y.; Abdel Halim, W.S. The role of oxidation states in FA1 Tl n+ (n = 1, 3) lasers and CO interactions at the (1 0 0) surface of NaCl: An ab initio study. Chem. Phys. 2006, 328, 8–16. [Google Scholar] [CrossRef]
  51. Shalabi, A.S.; Abdel Aal, S.; Ammar, H.Y. Artificial polarization effects on FA1:Sr2+ lasers and NO interactions at NaCl (001) surface: First principles calculations. J. Mol. Struct. Theochem. 2007, 823, 47–58. [Google Scholar] [CrossRef]
  52. Li, S. Semiconductor Physical Electronics, 2nd ed.; Springer: New York, NY, USA, 2006. [Google Scholar]
Figure 1. Optimized structures and densities of states (DOSs) of the ZnO nanocage (Zn12O12) and CHCl3 used in the calculations. (a,b) Optimized structure and DOS of the ZnO nanocage; (c,d) optimized structure and DOS of CHCl3. The distances are in Å, and the DOS is in arbitrary units. The solid and dashed lines represent the occupied and virtual states, respectively.
Coatings 09 00769 g001
Figure 2. Optimized structures and DOSs of the CHCl3 molecule adsorption on the Zn12O12 nanocage. (a) adsorption mode a, (b) adsorption mode b, (c) adsorption mode c, and (d) adsorption mode d. The distances are in Å, and the DOS is in arbitrary units. The solid and dashed lines represent occupied and virtual states, respectively.
Coatings 09 00769 g002
Figure 3. Optimized structures and DOSs for the (CHCl3)n/Zn12O12 nanocage. (a) CHCl3/Zn12O12, (b) (CHCl3)2/Zn12O12, (c) (CHCl3)3/Zn12O12, and (d) (CHCl3)4/Zn12O12. The distances are in Å, and the DOS is in arbitrary units. The solid and dashed lines represent the occupied and virtual states, respectively.
Coatings 09 00769 g003
Figure 4. Optimized structures and DOSs of O atom adsorption on the Zn12O12 nanocage. (a) complex a, and (b) complex b. The distances are in Å, and the DOS is in arbitrary units. The solid and dashed lines represent the occupied and virtual states, respectively.
Coatings 09 00769 g004
Figure 5. Optimized structures and DOSs for the CHCl3/O/Zn12O12 nanocage. (a) complex a, (b) complex b, and (c) complex c. The distances are in Å, and the DOS is in arbitrary units. The solid and dashed lines represent the occupied and virtual states, respectively.
Coatings 09 00769 g005
Figure 6. Optimized structures and DOSs for the (CHCl3)n/On/Zn12O12 nanocage. (a) CHCl3/O/Zn12O12, (b) (CHCl3)2/O2/Zn12O12, (c) (CHCl3)3/O3/Zn12O12, and (d) (CHCl3)4/O4/Zn12O12. The distances are in Å, and the DOS is in arbitrary units. The solid and dashed lines represent the occupied and virtual states, respectively.
Coatings 09 00769 g006
Figure 7. Frontier molecular orbital (FMO) surfaces (HOMO–LUMO) for CHCl3, Zn12O12, O/Zn12O12, and CHCl3/O/Zn12O12.
Coatings 09 00769 g007
Figure 8. Energy diagram of the FMOs (HOMO/LUMO) for CHCl3, Zn12O12, O/Zn12O12, and CHCl3/O/Zn12O12.
Coatings 09 00769 g008
Table 1. Electronic properties of the isomeric configurations of the CHCl3/Zn12O12 complexes, namely: adsorption energy (Eads; eV), HOMO (eV), LUMO (eV), Fermi level (EFL; eV), HUMO–LUMO energy gap (Eg; eV), natural bond orbital (NBO) charge (Q; au), and dipole moment (D; Debye).
SystemBare Z12O12(a)(b)(c)(d)
Eads−0.380.07−0.09−0.04
EHOMO−6.81−6.98−6.90−6.84−6.71
ELUMO−2.79−2.96−2.89−2.82−2.71
EFL−4.80−4.97−4.90−4.83−4.71
Eg4.024.034.004.024.00
QCHCl3−0.020.00−0.010.02
D0.003.051.411.332.17
Table 2. Electronic properties of the (CHCl3)n/Zn12O12 complexes, namely: adsorption energy (Eads; eV), HOMO (eV), LUMO (eV), Fermi level (EFL; eV), HUMO–LUMO energy gap (Eg; eV), NBO charge (Q; au), and dipole moment (D; Debye).
System(a)(b)(c)(d)
n = 1n = 2n = 3n = 4
Eads−0.38−0.38−0.60−0.76
EHOMO−6.98−7.14−7.19−7.39
ELUMO−2.96−3.10−3.14−3.32
EFL−4.97−5.12−5.16−5.36
Eg4.034.044.054.07
QCHCl3−0.02−0.02−0.02−0.01
D3.050.461.181.64
Table 3. Electronic properties of the isomeric configurations of the O/Zn12O12 complexes, namely: adsorption energy (Eads; eV), HOMO (eV), LUMO (eV), Fermi level (EFL; eV), HUMO–LUMO energy gap (Eg; eV), NBO charge (Q; au), and dipole moment (D; Debye).
SystemO/Zn12O12O/Zn12O12
(a)(b)
Eads−1.98−1.62
EHOMO−6.32−6.57
ELUMO−2.79−2.79
EFL−4.56−4.68
Eg3.533.78
QO−0.71−0.61
D2.030.72
Table 4. Electronic properties of the isomeric configurations of the CHCl3/O/Zn12O12 complexes, namely: adsorption energy (Eads; eV), binding energy (Eb; eV), HOMO (eV), LUMO (eV), Fermi level (EFL; eV), HUMO–LUMO energy gap (Eg; eV), NBO charge (Q; au).
System(a)(b)(c)
Eads−2.44−1.98−0.92
Eb−0.68−0.15−2.46
EHOMO−6.45−6.13−6.30
ELUMO−2.81−2.85−2.98
EFL−4.63−4.49−4.64
Eg3.643.273.32
QCHCl30.070.030.86
QO−0.63−0.62−0.76
QZnO0.560.59−0.10
D1.922.358.26
Table 5. Electronic properties of the (CHCl3)n/(O)n/Zn12O12 complexes, namely: adsorption energy (Eads; eV), HOMO (eV), LUMO (eV), Fermi level (EFL; eV), HUMO–LUMO energy gap (Eg; eV), NBO charge (Q; au), and dipole moment (D; Debye).
System(a)(b)(c)(d)
n = 1n = 2n = 3n = 4
Eads−0.92−0.96−0.96−0.86
EHOMO−6.30−6.03−5.65−5.19
ELUMO−2.98−2.81−2.57−2.51
EFL−4.64−4.42−4.11−3.85
Eg3.323.223.082.68
QCHCl30.860.770.740.74
QO−0.76−0.61−0.59−0.58
QZnO−0.10−0.33−0.47−0.62
D8.263.264.156.45

