Abstract
Pure Zn and Zn–ERGO composite coatings were prepared by direct current electrodeposition on 304 stainless steel. Samples were characterized by X-ray diffraction (XRD), scanning electron microscopy coupled with energy dispersive X-ray spectroscopy (SEM/EDS), and laser Raman spectroscopy (Raman). Results obtained have shown that the concentration of GO sheets in zinc sulfate electrolyte has an important effect on the preferred crystal orientation and the surface morphology of Zn–ERGO composite coatings. A study of the corrosion behavior of the coatings by Tafel polarization and electrochemical impedance spectroscopic (EIS) methods leads to the conclusion that the Zn-1.0 g/L ERGO composite coating possesses the best corrosion resistance compared to the pure Zn coating and other composite coatings in this study.
1. Introduction
By providing a barrier or sacrificial protection, Zn coating plays an important role in protecting steel substrates in the traditional steel anticorrosion field. However, Zn coating can be destroyed because of the formation of white rusty products in air, especially in humid environments [1]. Chromating the Zn coating surface or using organic molecules as chelating agents can provide a barrier between the Zn surface and aggressive media and thus prevent the formation of white rusty products. But chromium and organic molecules are harmful to the environment [2,3,4]. Therefore, designing novel zinc based composite coatings by adding second-phase particles into the Zn matrix has become a focus point of research on this material [5,6,7]. A series of Zn-matrix composite coatings with different second-phase particles, such as TiO2 [8], ZrO2 [2], WO3 [9], SiC [10], NiO [11], carbon nanotube [12], and graphene [13] were successfully prepared by different methods. These Zn matrix composite coatings have enhanced corrosion resistance behavior with improved mechanical properties compared to pure zinc coatings.
Graphene is a two-dimensional sp2 hybridized carbon that is a single atom thick which has attracted considerable attention due to its extremely superior properties, especially its excellent corrosion resistance [14,15,16,17]. Chen et al. [18] have demonstrated that graphene can inhibit the oxidation of Cu and Cu/Ni alloys in an atmospheric environment. Holt et al. [19] showed that the surfaces of sp2 carbon allotropes can form a natural diffusion barrier between the protected metal and reactants. Subsequently, graphene was shown to be able to act as second phase material to generate highly corrosion-resistant composite coatings. Kumar et al. [20] reported that the Ni/graphene composite coating fabricated by the electrochemical method holds a higher corrosion resistance compared to a pure Ni coating. However, the use of graphene is limited in many fields owing to its poor ability of dispersion and easy agglomeration in solvents. Graphene oxide (GO), as an intermediate product of graphene preparation, contains hydrophilic and reactive oxygen functional groups on the sheet surface and shows excellent dispersion stability in water and most solvents compared to graphene [21]. Furthermore, GO can be directly reduced to graphene by the electrochemical reduction method [22]. This graphene can be called electrochemically reduced graphene oxide (ERGO). Owing to the similar properties to graphene and availability of less equipment-intensive chemical methods for producing large quantities of GO by oxidation of low cost and abundant graphite powder [23,24], GO has been used as a reinforcement to fabricate corrosion resistant metal matrix composite coatings. In fact, related research results have already shown that GO as second-phase material improves mechanical, thermal, and electrical properties of metal matrix materials [13,25,26,27].
Preparation methods of metal matrix composite coatings include chemical vapor deposition method [22], the chemical reduction method [23], and the electrochemical deposition method [13,26,27]. Compared to the above-mentioned methods, the direct current electrodeposition technique has been broadly used because of its simple preparation equipment, easy operation, low cost, and easy industrialized promotion. Liu et al. [28] used graphene oxide instead of graphene as a second phase to construct the Co–REGO composite coating by the electrochemical method, and as a result, this composite coating exhibited better corrosion resistance than the pure Co coating. Raghupathy et al. [29] prepared the Cu–REGO composite coating by electro-deposition with chemically synthesized GO dispersed into a Cu electrolytic bath; the analysis of the electrochemical corrosion test results revealed that steels coated with Cu–REGO were invariably more corrosion resistant compared to both bare steel and pure Cu-coated steel. Qiu et al. [30] prepared the Mg–GO coatings by a self-assembly method; the composite coating could significantly decrease the corrosion rate compared with a pure Mg coating in 3.5 wt% NaCl solution. Li et al. [27] prepared the Zn–REGO composite coatings by pulse electrodeposition in ChCl/urea-based deep eutectic solvent; the composite coating showed higher stability and better corrosion resistance than the pure Zn coating.
The above studies have all shown that the introduction of GO is beneficial to improving the corrosion resistance of the matrix through a single comparative experiment of the composite coating with a fixed composition and the corresponding pure matrix. It should be noted that majority of reports on the corrosion resistance of metal–GO/REGO composite coatings focus mainly on the changes in coating morphology and electrochemical properties with a relatively low concentration of GO from 0.05 to 0.50 g/L in electrolyte. However, the effect of higher concentrations of GO on the morphology and corrosion resistance of the coating remains unexplored. To our knowledge, there is no report yet on the investigation of the effect of high GO concentrations in plating solutions on the preferred crystal orientation, the surface morphologies, and the corrosion resistance of Zn–ERGO composite coatings. Hence, efforts are required to understand the correlation between the relatively high concentration of GO in plating solutions and corrosion resistance property of the composite coatings. In this paper, the direct current electrodeposition method was used to prepare Zn–ERGO composite coatings and investigate the effects of different concentrations of GO sheets in electrolytes on the corrosion resistance of Zn–ERGO composite coatings.
2. Materials and Methods
2.1. Preparation of Zn–ERGO Composite Coatings
Chemically pure ZnSO4, Na2SO4, H3BO3, and hexadecyltrimethy ammonium bromide (CTAB) as well as high purity water were used to prepare electrolyte. GO made from graphite powders via the modified Hummers’ method [31] was adequately dispersed in the electrolyte by a magnetic stirrer after sonication for three hours to prepare electrolytes with four different GO concentrations: 0, 0.2, 0.50, and 1.0 g/L, (marked as pure Zn, Zn-0.25 g/L GO, Zn-0.5 g/L GO, Zn-1.0 g/L GO, respectively). When GO concentration is greater than 1.0 g/L, the composite coating surface is rough due to the poor liquidity of the electrolyte under the same agitation. Using zinc plate (99.97% purity, 60 × 50 × 3 mm3) as an anode and 304 stainless steel plate (40 × 40 × 2 mm3) as a cathode, Zn and Zn–ERGO composite coatings were fabricated by the direct current electrodeposition method in a conventional two-electrode cell under agitation. Before electrodeposition, the Zn plate was activated by immersing it into 10% HCl solution for 10 s, then washed with high purity water. In addition, 304 stainless steel plate was abraded by grit paper, cleaned by 10% HCl and washed with distilled water. The chemical compositions of the electrolytes and the electrodepositing parameters are listed in Table 1 and Table 2, respectively.

Table 1.
The chemical composition of the electrolyte.
Table 2.
The electrodepositing parameters.
2.2. Electrochemical Tests
Electrochemical tests were performed using a CHI660D electrochemical workstation (Chinstruments, Shanghai, China) at 25 ± 2 °C. The corrosion resistance of the deposits was assessed by electrochemical impedance spectroscopy (EIS) and the Tafel polarization curve with a conventional three electrode cell (1 × 1 cm2 area of Zn/Zn–ERGO composite deposits as a working electrode, 3 × 3 cm2 area of graphite flake as an auxiliary electrode, and Ag/AgCl as the reference electrode ) in 3.5% NaCl solution as corrosive media. Before the impedance and polarization measurements, the open-circuit potential (OCP) was recorded for 1 h until it was stabilized. The impedance experiments were carried out at the open-circuit potential in the frequency range from 100kHz to 100 mHz with a sinusoidal signal amplitude of ±5 mV, and repeated three times to confirm reproducibility of the results. Electrochemical impedance data was fitted using ZSimp Win 3.21 software. The potentiodynamic polarization was performed from −1.7 to −0.5 V (referred to as the saturated calomel electrode) at a scanning rate of 1 mV s−1.
2.3. Coating Characterization
XRD analysis of electrodeposits was carried out using an X-pertpro X-ray diffractometer (PANalytical, Eindhoven, Holland) employing a Cu Kα radiation (λ = 0.1540 nm) source. The surface morphology of the GO sheets, Zn/Zn–ERGO composite coatings, and the distribution of RGO sheets were observed using a scanning electron microscopy (SEM, JEOL, JSM-5600LV, Tokyo, Japan) with energy dispersive spectroscopy (EDS, Kevex). Raman spectrums from the samples were obtained using a microscope setup (Horiba, Kyoto, Japan) consisting of a diode-pumped solid-state laser operating at 514 nm with a charge coupled detector.
3. Results
3.1. The XRD and SEM Analysis of GO Sheets
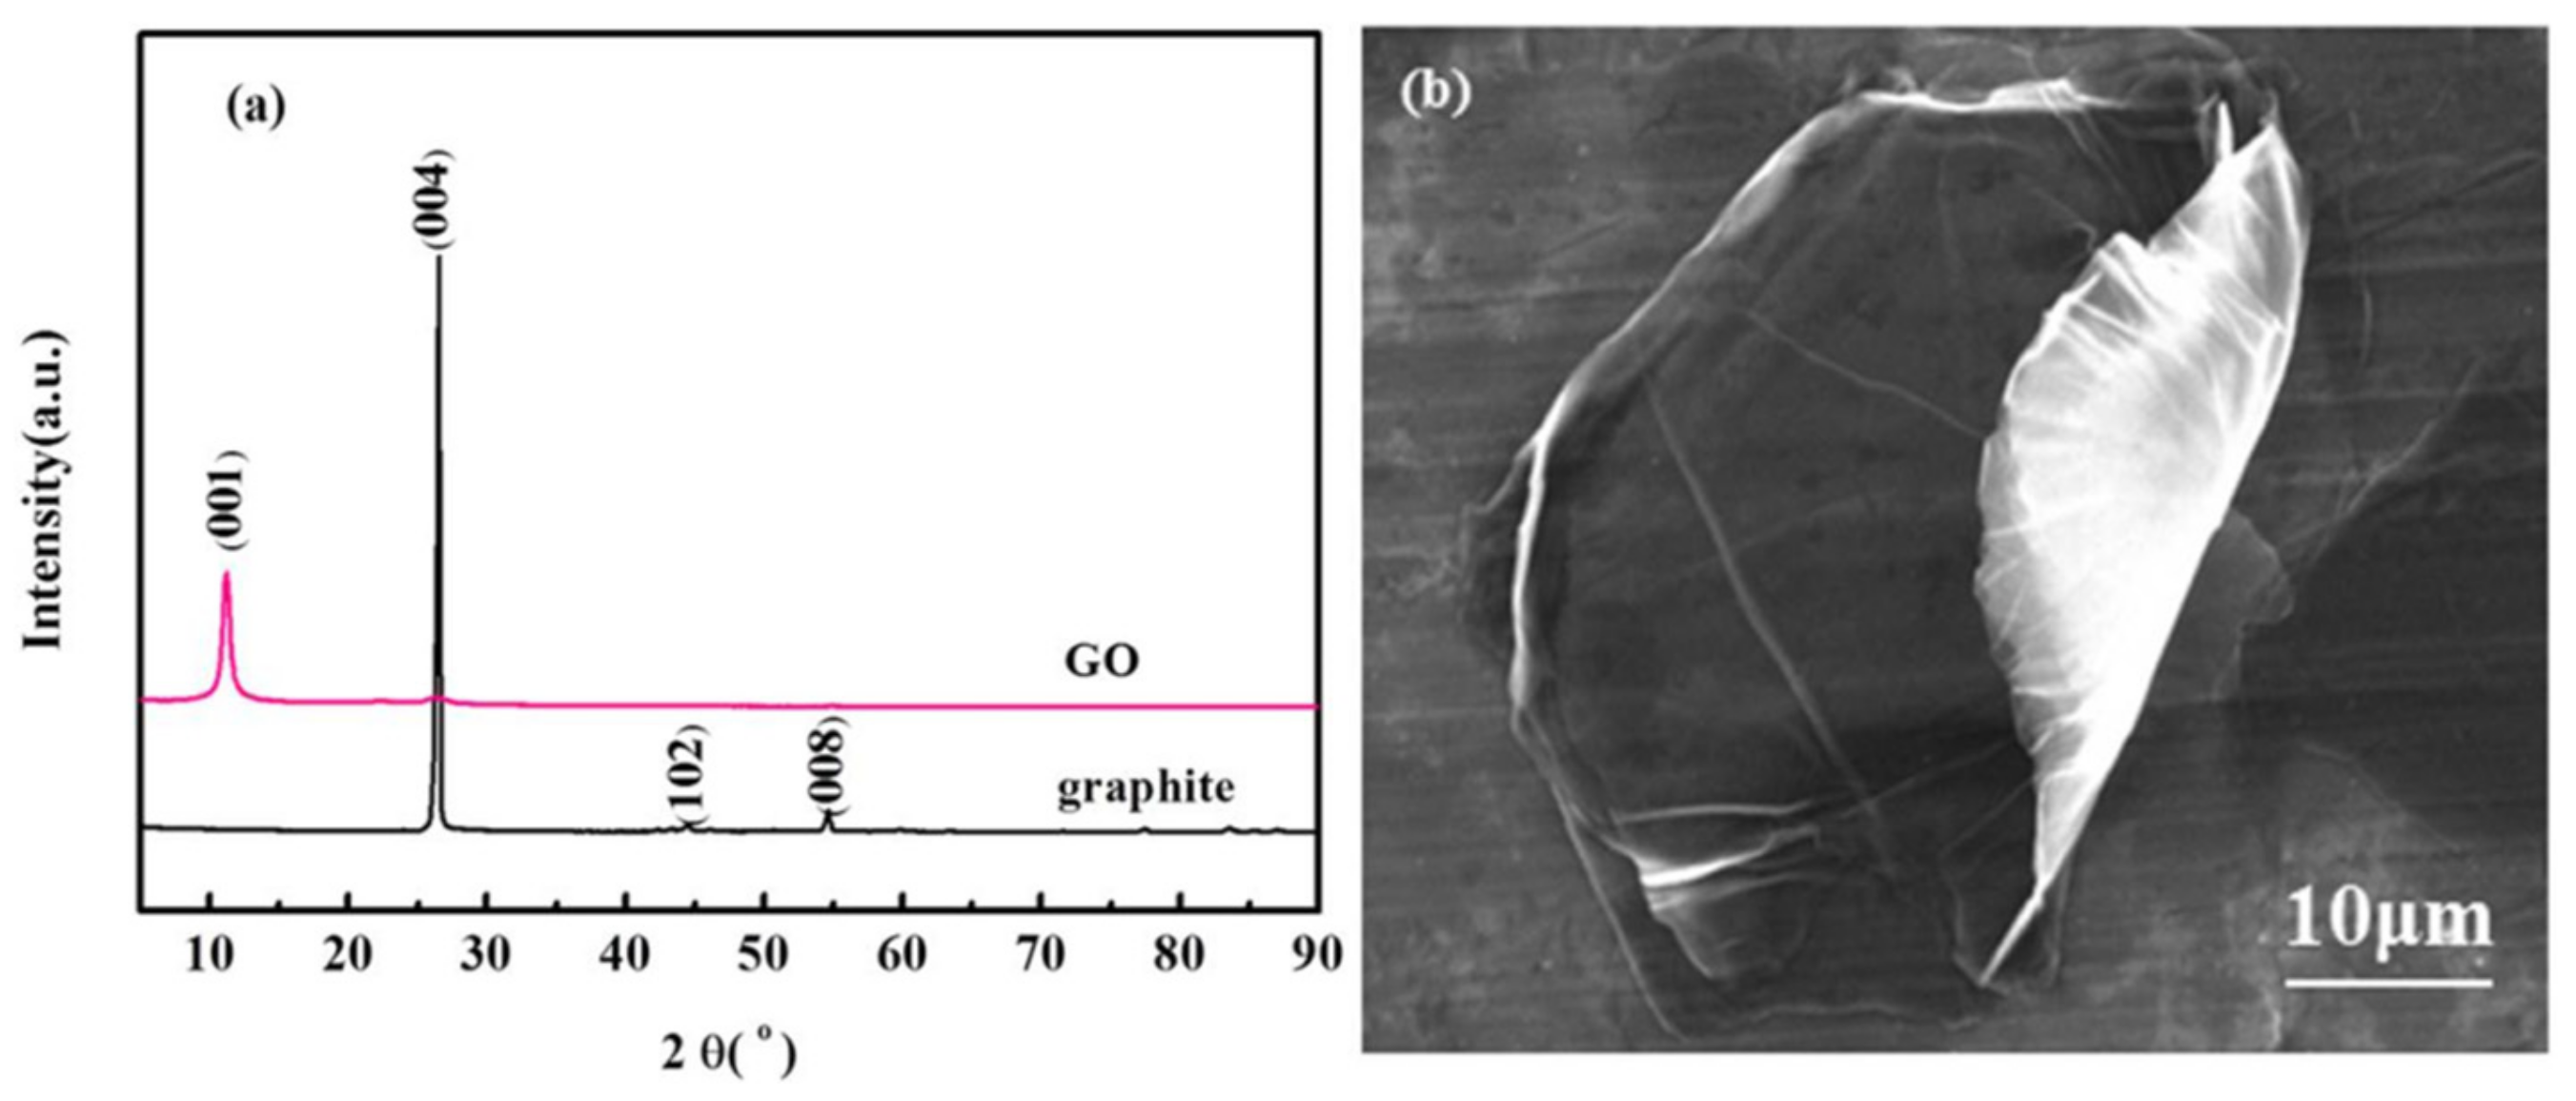
Figure 1a shows the XRD patterns of graphite as a raw material and GO sheets synthesized by the modified Hummers’ method. The characteristic diffraction peaks appearing in Figure 1a near 2θ = 26.5°, 44.5°, 54.6°, correspond to the (004), (102), (008) diffraction crystal planes of graphite, respectively. For GO, the only diffraction peak at 2θ around 11.2° represents the (001) interlayer spacing of 0.396 nm [32,33,34]. No other characteristic diffraction peaks were found in the XRD patterns of GO. It indicates that graphite was completely converted to GO after the oxidation reaction process.

Figure 1.
XRD patterns of graphite and graphene oxide (GO) (a); and GO surface SEM micrograph (b).
Figure 1b displays the SEM image of GO. It can be seen that GO prepared by the modified Hummers’ method consists of many tiny sheets, which are almost transparent and have quite smooth surfaces with small wrinkles on the edge. It is believed that the appearance of crimp reduces the free energy of the system. Both of the XRD profile and SEM image indicated that the quality of GO prepared in this study is very good.
3.2. XRD and Raman Analysis of Zn and Zn–ERGO Composite Coatings
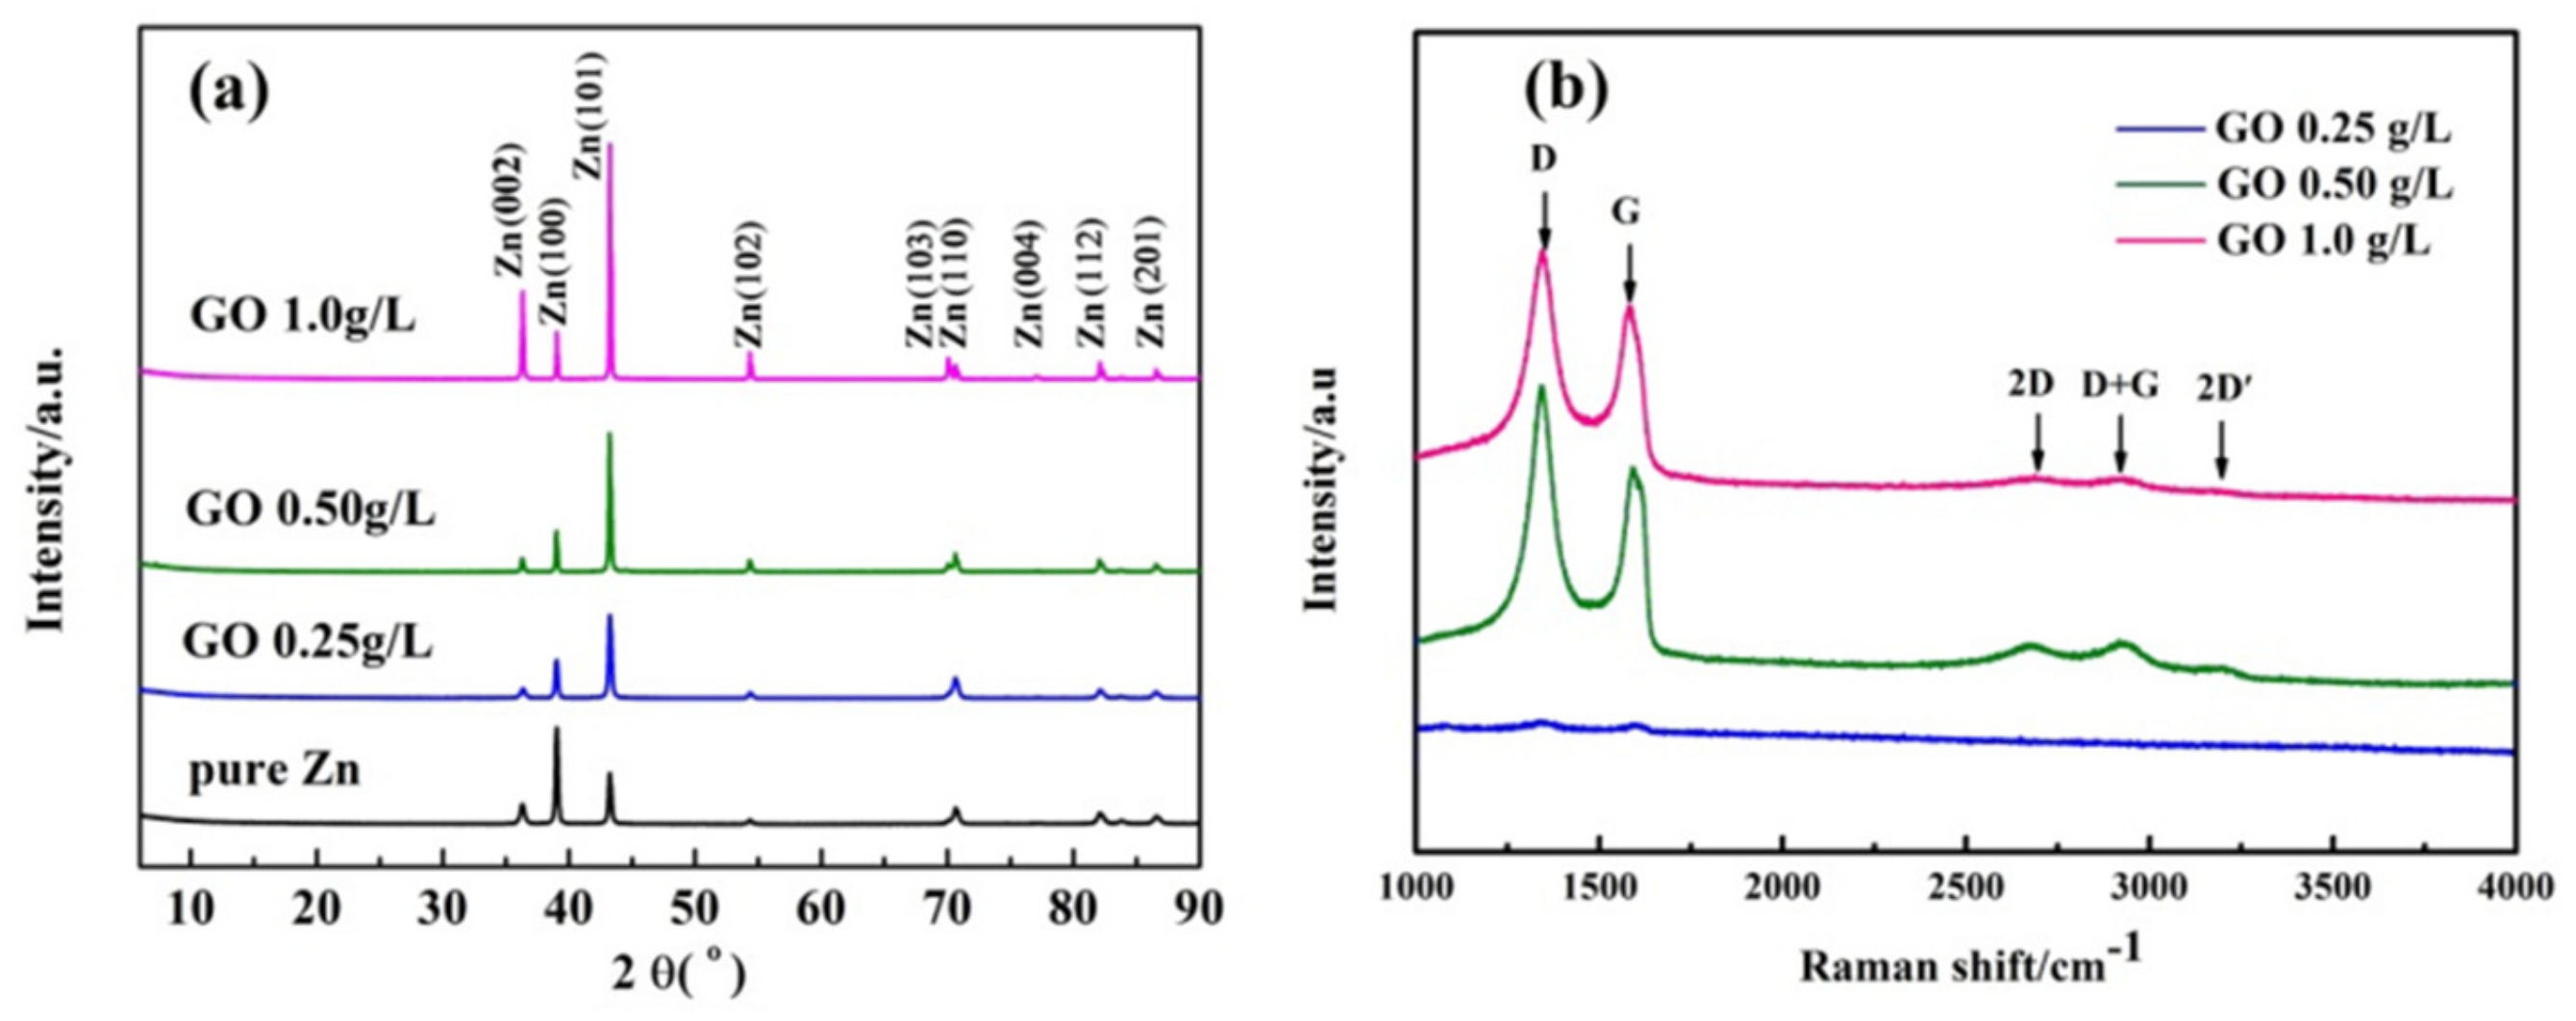
The XRD patterns and Raman spectrums for Zn and Zn–ERGO composite coatings are separately presented in Figure 2a,b. All diffraction peaks of the composite coating specimens in Figure 2a can be confirmed as hexagonal crystal structures of pure Zn coating by JCPDS (card No. 65-3358). No characteristic diffraction peaks of graphene were detected because of its relatively low amount. For pure Zn, one intensive peak at 2θ = 39.1° and three weak peaks at 2θ = 36.3°, 43.2°, and 54.3° correspond to the (100), (002), (101), and (102) crystal planes, respectively. However, with increasing amount of GO sheets, deposited coatings show an obvious change in the characteristics of the diffraction patterns. It is well known that the texture coefficient (TC) can be used to represent the change of the preferred crystal orientation. Therefore, the TC of each crystal plane [(100), (002), (101), and (102)] was calculated according to the following formula:
where, I(hkl) is the intensity obtained from textured sample and I0(hkl) is the intensity of the standard oriented sample (i.e., from JCPDS data). The determined texture coefficient is shown in Figure 3. With the increase of GO concentration in electrolyte from 0 to 1.0 g/L, the TC value of the (100) crystal plane decreased, whereas TC values of (101), (102), and (002) crystal planes remarkably increased. The changes of TC values can be related to a modification of the composition between nucleation and crystal growth of Zn due to the addition of GO sheets in electrolyte. In summary, Figure 3 clearly reveals that the preferred crystal orientation of deposited coatings changes from the (100) crystal plane to (002), (101), and (102) crystal planes. The analysis of diffractograms shows that the concentration of GO sheets in electrolyte play an important role in the crystal orientation of the deposits. The change of the preferred orientation of Zn coatings can be attributed to the change of the surface energy differences, which is the driving force for the growth of grains. The result shows that the (101), (002), and (102) planes of Zn in the presence of GO have relatively lower surface energy. This phenomena can be ascribed to embedded second phase materials that can enhance nucleation by creating disorder in the incorporation of adatoms into the lattice or inhibit surface diffusion of adatoms towards growing centers and exert a detrimental effect on the crystal growth. The increase of GO concentration changes the driving force for grain growth and thus affects the preferred orientation of the metal matrix [35,36].
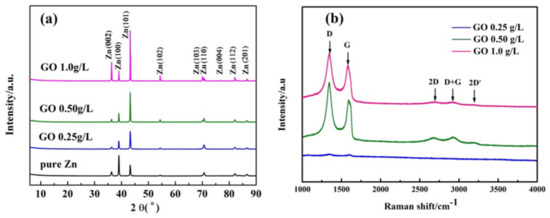
Figure 2.
XRD pattern (a) and Raman spetra (b) of Zn and Zn–ERGO composite coatings, respectively.
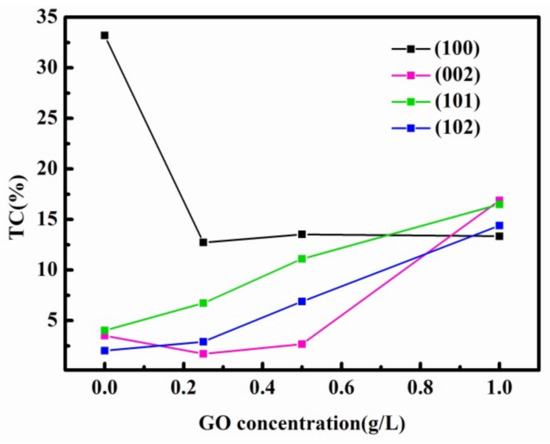
Figure 3.
Preferential orientation of Zn crystallites of pure Zn coating and Zn-0.25 gL ERGO, Zn-0.50 gL ERGO, and Zn-1.0 gL ERGO composite coatings.
Figure 2b shows Raman spectrums of Zn–ERGO composite coatings. Raman spectrums of Zn-0.5 g/L ERGO and Zn-1.0 g/L ERGO composite coatings display a D band at around 1350 cm−1, a G band near 1580 cm−1, a 2D band around 2680 cm−1, and a D+G band near 2870 cm−1. The appearance of these four Raman peaks proves that GO has been reduced to RGO during electrodeposition. This illustrates that Zn2+ and GO in electrolyte can be simultaneously reduced on the cathode plate. The Raman spectra also show that the Zn–ERGO composite coating can be successfully prepared in a zinc sulphate electrolyte system containing GO by direct current electrodeposition.
3.3. Morphologies of Zn and Zn–ERGO Composite Coatings
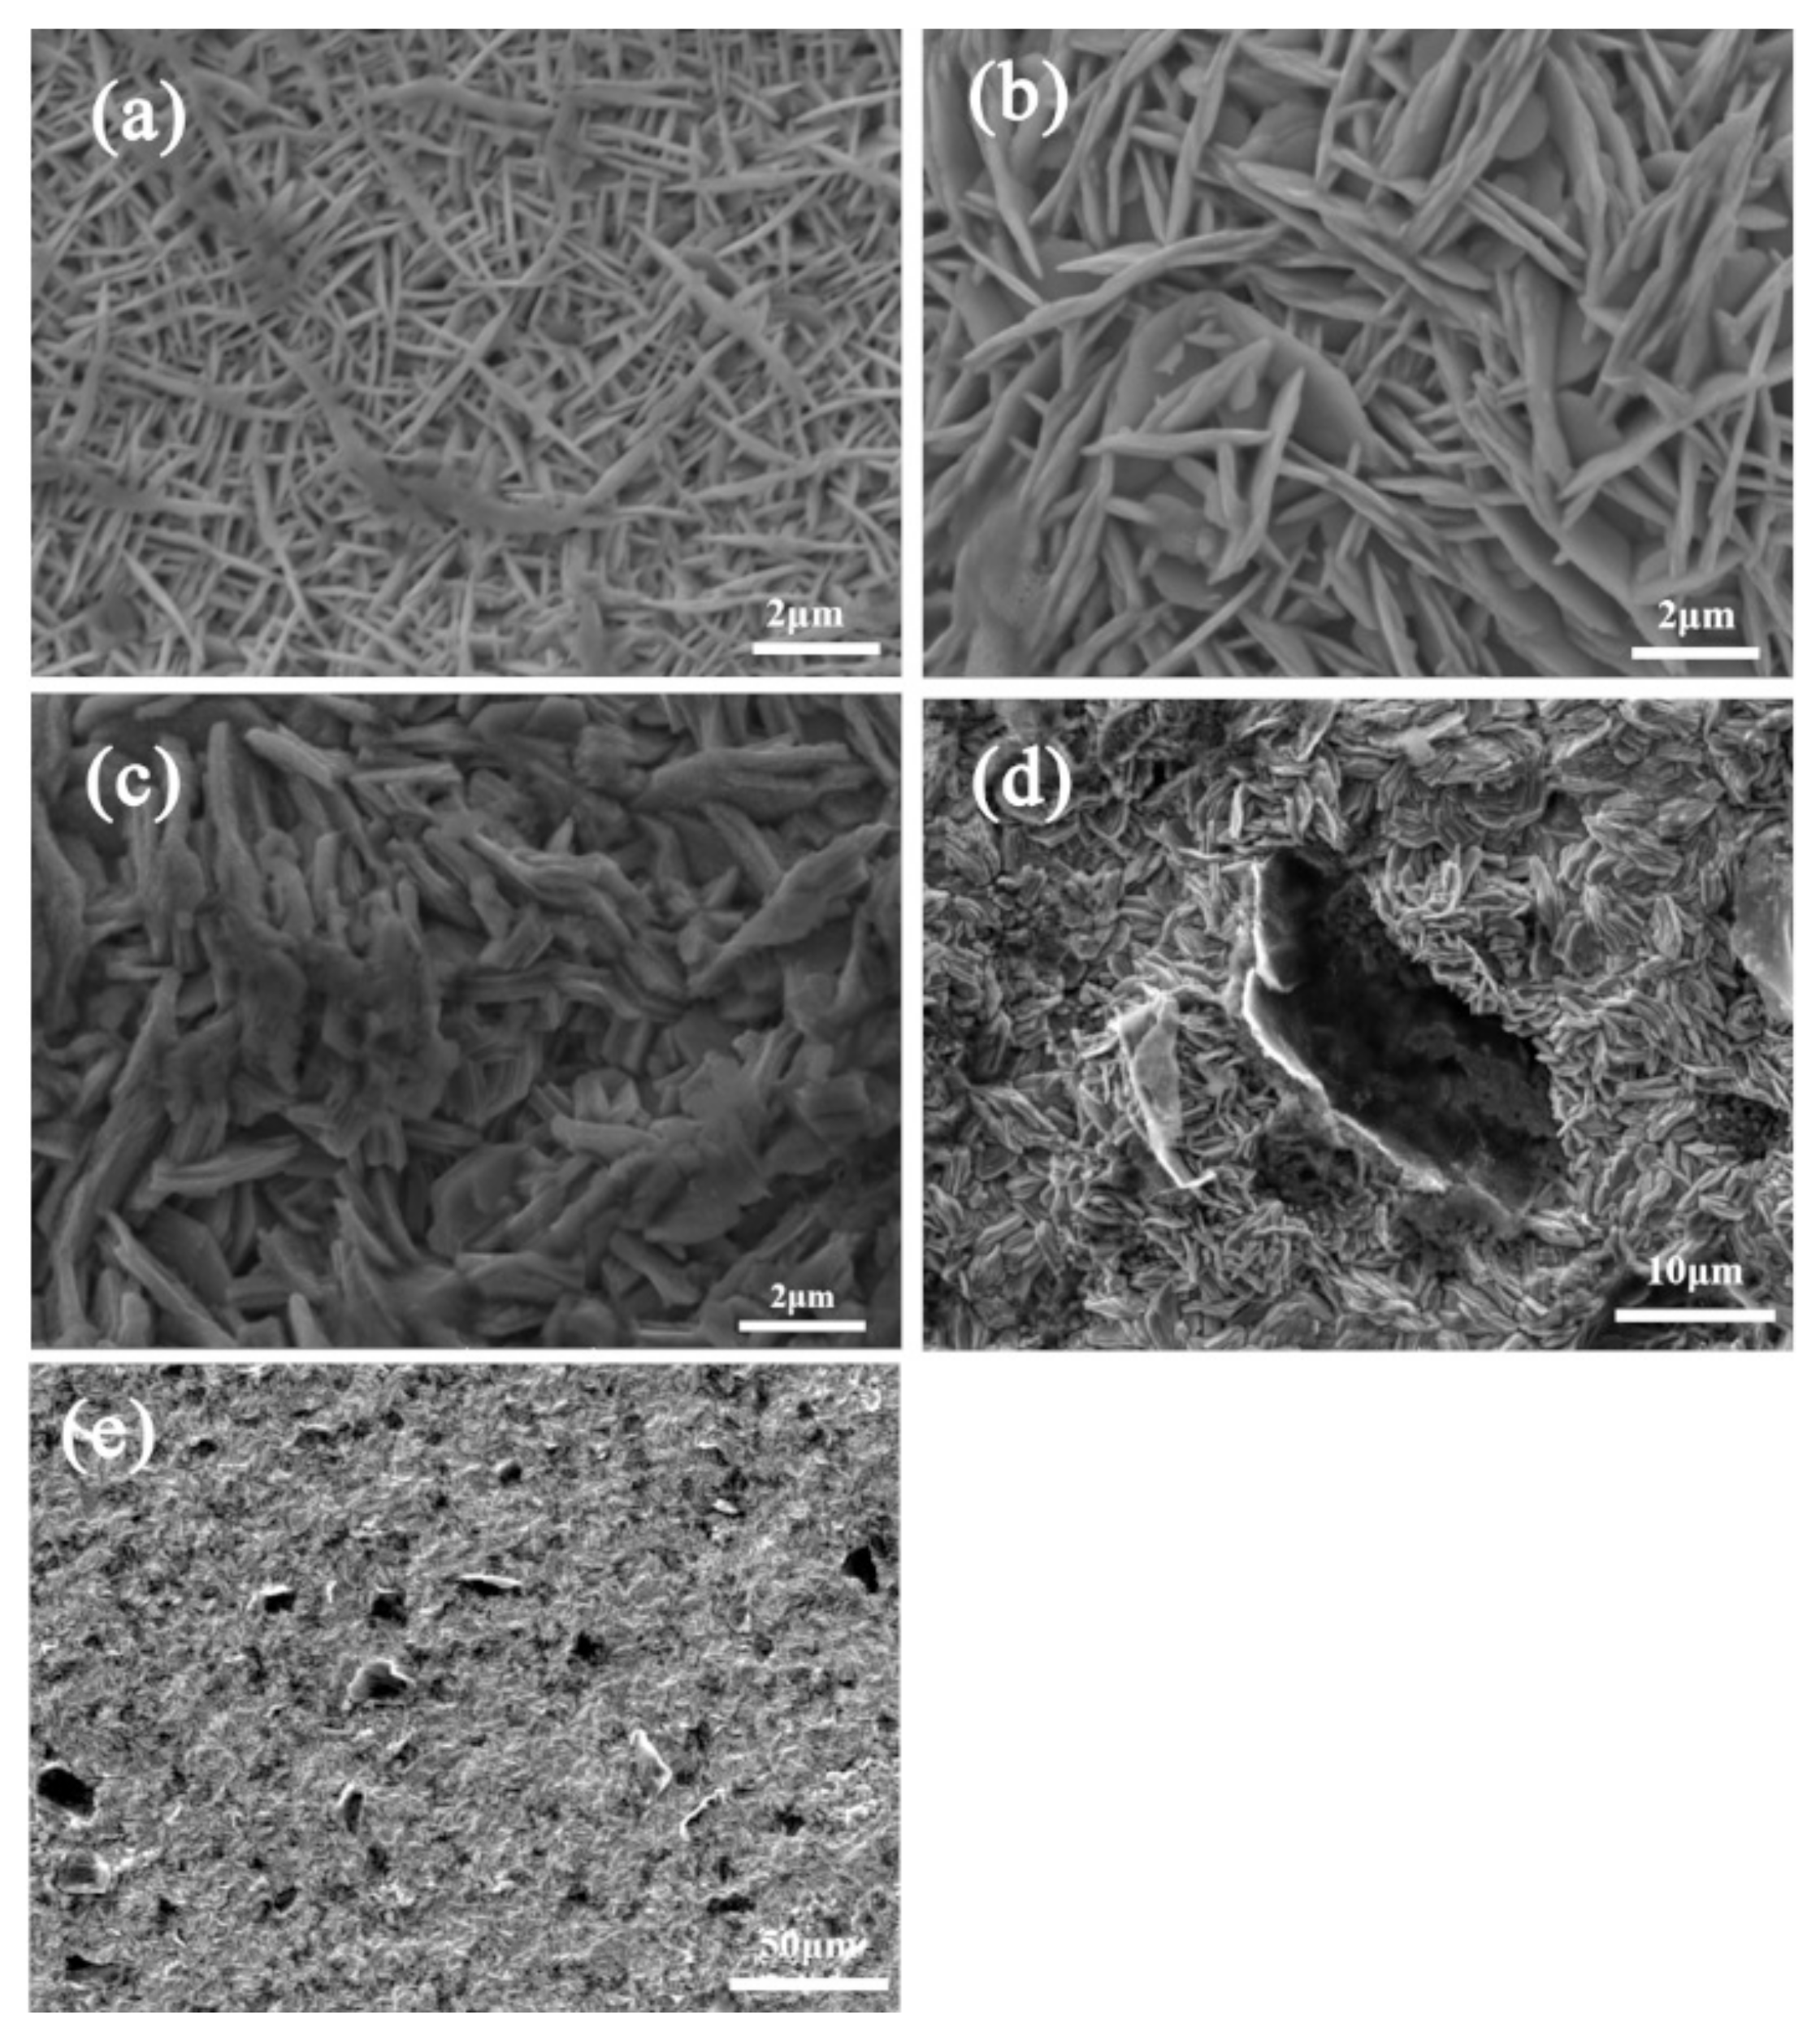
The surface morphologies of pure Zn and Zn–ERGO composite coatings with different concentrations of GO sheets before the corrosion measurements are shown in Figure 4. Without GO sheets in the plating solution, the Zn coating prepared by electrodeposition shows a needle-like structure (Figure 4a). It can be attributed to a strong blocking effect of CTAB as a cationic surfactant, which leads to an increase of nuclei number and needle growth. This is consistent with the results reported in literature [36]. Morphology of the Zn-0.25 g/L ERGO composite coating shows a structure of platelets (thickness of less than 100 nm), which are intersecting with each other in various directions and loosely packed with each other (Figure 4b). With the GO concentration of sheets in the electrolyte increasing from 0.5 to 1.0 g/L, a laminar structure consisting of many plates can be clearly observed (Figure 4c,d). Nanometer-sized graphene thin sheets uniformly inserted into the Zn matrix can be seen in the Zn-1.0 g/L ERGO composite coating (Figure 4e). This is more clearly shown in Figure 4d at a larger magnification. In the electrolysis process, GO dispersed in the electrolyte is deposited on the cathode plate together with zinc ions due to interaction between the positively charged Zn ions and the negatively charged GO. As the thickness of the coating increases, the previously attached RGO sheets are covered and embedded inside the coating. In addition, Figure 4 shows that with increasing addition of GO sheets in the electrodeposition solution, the grain size of the Zn matrix gets bigger and bigger. This implies that the active surface area of the composite coatings is reducing.

Figure 4.
SEM micrographs of the surface of pure Zn coating (a); Zn-0.25 gL ERGO coating (b); Zn-0.5 gL ERGO coating (c); Zn-1.0 gL ERGO coating (d); and the low magnification SEM micrographs of Zn-1.0 gL ERGO (e).
Further, EDS analysis reveals the presence of Zn, C, and O in the Zn-1.0 g/L ERGO composite coating and C is evenly distributed in the Zn matrix (as is shown in Figure 5). The presence of C in the Zn matrix proves the existence of ERGO in the composite coating. The presence of oxygen could be due to the oxygen-containing functional groups of ERGO and passivation of the zinc matrix in the composite coating. Therefore, the EDS maps have proved that the thin sheets in Figure 4d,e are ERGO sheets.
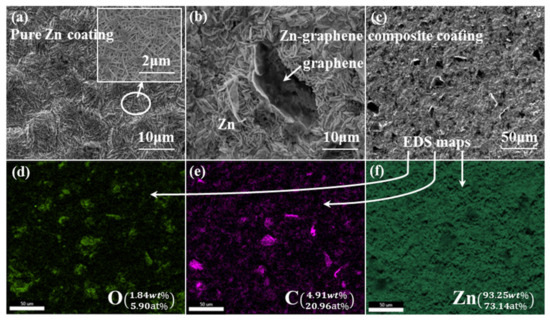
Figure 5.
SEM micrographs of the surface of pure Zn coating (a); Zn-1.0 g/L GO composite coating (b); the low magnification SEM micrographs of Zn-1.0 g/L GO composite coating (c); and EDS maps of surface morphology for (c) Zn-1.0 g/L GO composite coating (d–f).
Whether the surface morphology of coatings is flake-like or lamellar, both the platelets and the laminae are perpendicular to the substrate. The reason for this is that there is a difference between the consumption rate of Zn2+ ions at the cathode and the diffusion rate of Zn2+ ions from bulk solution to the cathode during the electrodeposition process. This difference leads to the formation of an ion deficient area. It is speculated that the addition of GO sheets in the plating solution expands this ion deficient area due to the increase in cathode overpotential. Consequently, the growing points of the Zn–ERGO composite coatings must face higher Zn2+ ionic concentrations than the lateral surfaces. Hence, it should grow at a higher rate in a perpendicular direction to the substrate surface.
As described above, GO sheets play an important role in the surface morphologies of Zn–ERGO composite coatings. This can be explained by the fact that GO sheets in electrolyte affect the nucleation/growth process of Zn crystalline grains during the electrodeposition process. Surface morphology changes of the composite coatings can be ascribed to two possible reasons. Firstly, the formation of Zn–O chemical bonds, which are composed of the partial unsaturated oxygen atoms of ERGO and the absorbed Zn atoms, can change the charge transfer rate [37,38]. Secondly, the Zn deposition overpotential can be modified because GO sheets are adsorbed on the active sites on cathode surface. At last, crystal orientation of the deposits can affect the direction of Zn crystal growth. Both changes of the charge transfer rate, the Zn deposition overpotential, and crystal orientation have synergistically a large influence on crystallization and the growth process of Zn grains.
3.4. Electrochemical Corrosion Behavior of Zn and Zn–ERGO Composite Coatings
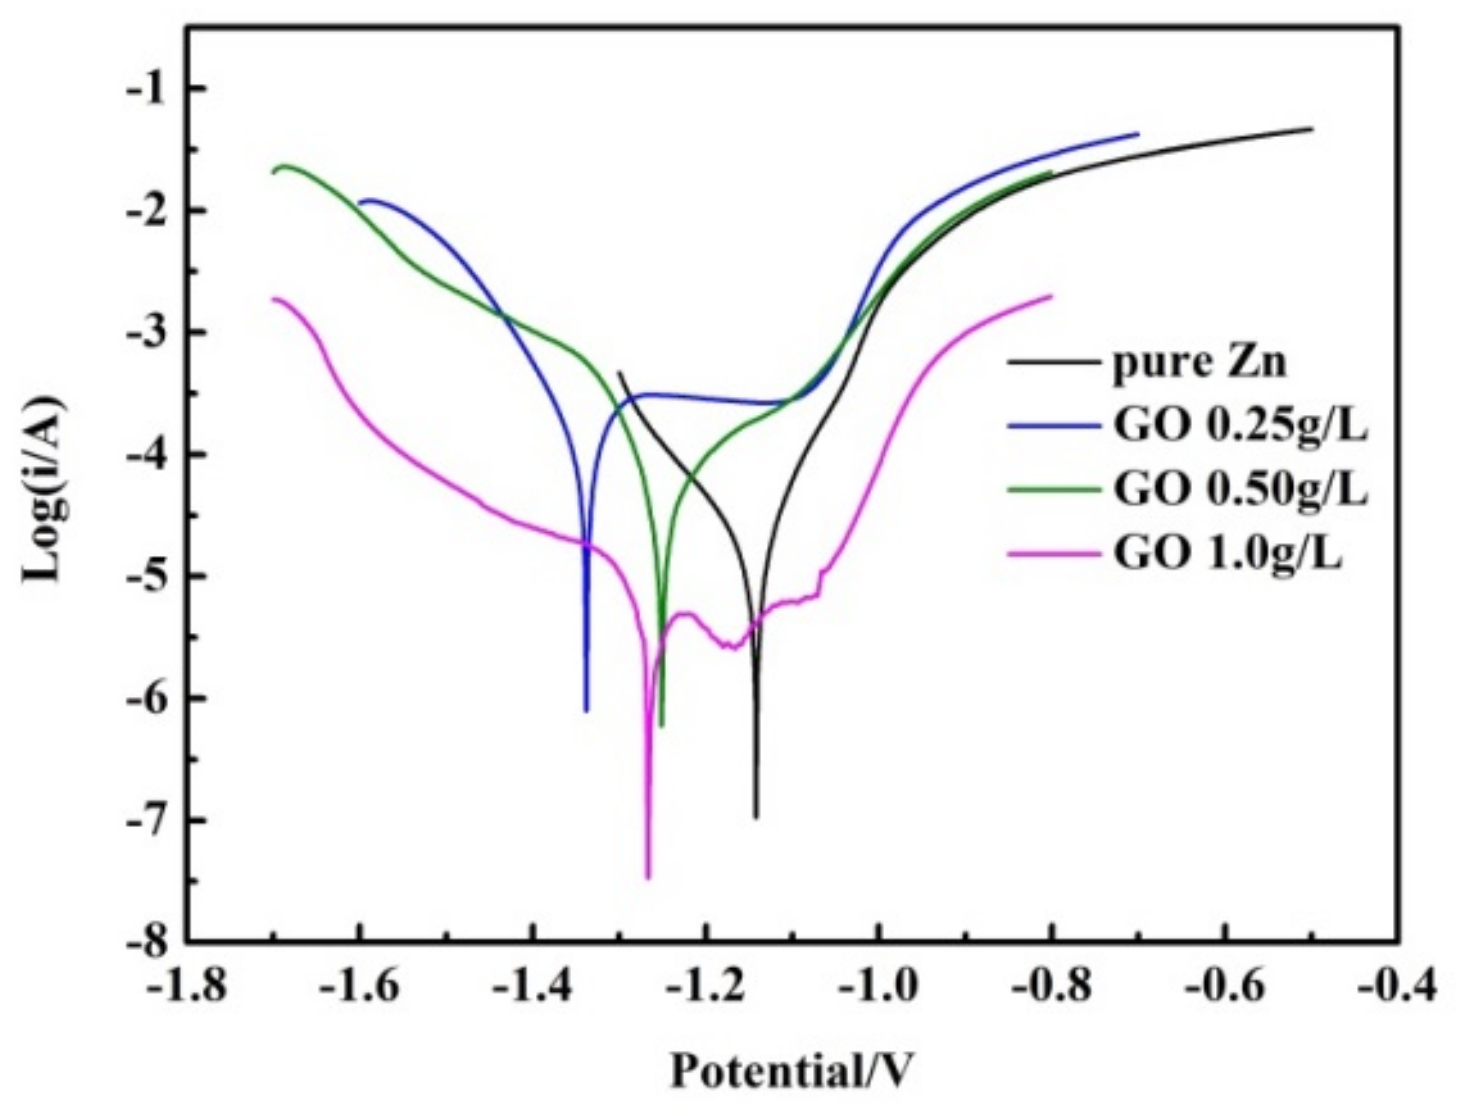
In order to evaluate the corrosion resistance of Zn and Zn–ERGO composite coatings, electrochemical measurements were carried out. Figure 6 shows the polarization curves of pure Zn and Zn–ERGO composite coatings exposed to 3.5% NaCl corrosive media. The corrosion potential (Ecorr) and corrosion current (icorr) of the samples were fitted by Tafel extrapolation from the polarization curves and the results are shown in Table 3. It can be seen from the Figure 6 and Table 3 that the corrosion current for Zn-0.25 g/L ERGO and Zn-0.50 g/L ERGO composite coatings are higher than for the pure Zn coating. A higher corrosion current implies a faster corrosion process. The higher corrosion current for Zn-0.25 g/L ERGO and Zn-0.50 g/L ERGO composite deposits may be ascribed to chemical heterogeneities generated in the zinc matrix due to nonuniform distribution of the embedded agglomerated graphene sheets. Adriana Vlasa et.al [36] have reported similar results. The corrosion current of the Zn-1.0 g/L ERGO composite coating is the lowest comparing to a pure zinc coating and other composite coatings, indicating that the Zn-1.0 g/L ERGO composite coating exhibits the best anticorrosive behavior. In addition, passivation areas appear in anode polarization curves of all Zn–ERGO composite coatings. Especially, there are two passivation areas in the anode polarization curve of the Zn-1.0 g/L ERGO composite coating. They are formed by Zn2+ cations combined with graphene and the zinc oxidation film, the formation of two stable passivation layers can effectively prevent corrosive species from coming into the metal matrix. This is why the Zn-1.0 g/L ERGO composite coating shows a superior anticorrosive behavior.
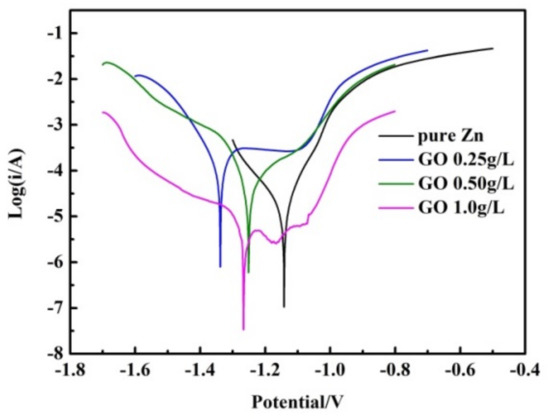
Figure 6.
Effects of the concentration of GO sheets in Zn sulphate electrolyte on the potentiodynamic polarization behavior of Zn and Zn–ERGO composite coatings in 3.5 wt % NaCl solution.
Table 3.
Electrochemical data of the pure Zn and Zn–ERGO composite coatings derived from the polarization tests in 3.5 wt % NaCl solution.
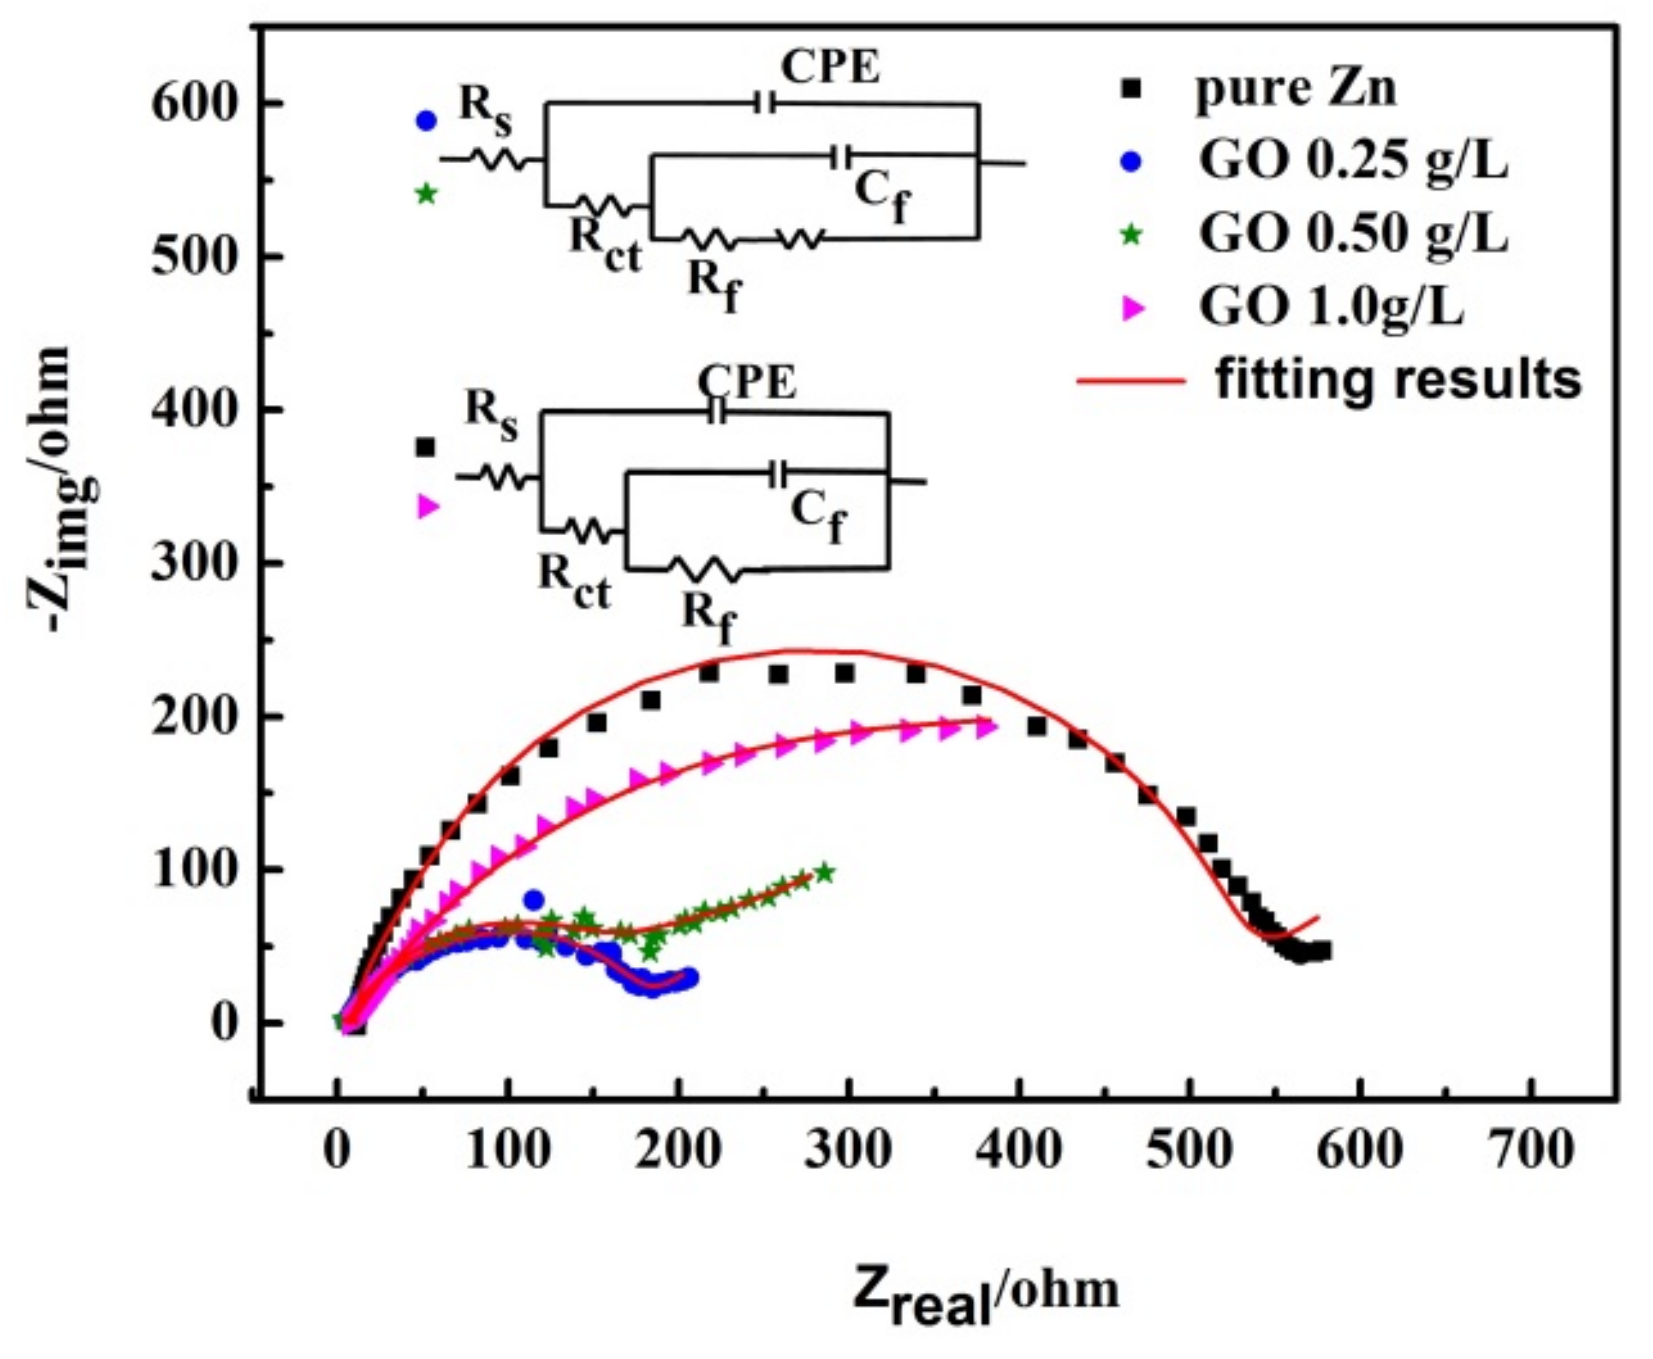
EIS measurements were carried out to further study the characteristics and kinetics of the electrochemical process occurring at the interface between the coatings and corrosive media. The well and suitably fitted electrical equivalent circuit (EEC) was obtained by using ZSimpWin software version 3.6.0 to simulate EIS data. This helps to understand the electrochemical process occurring at the surface. Figure 7 shows the impedance results exhibited by Nyquist plots and the EEC. The fitted results of circuit elements are listed in Table 4. The Nyquist plots of the pure Zn coating and Zn-1.0 g/L ERGO composite coating are characterized by two capacitive loops, whereas the Nyquist plots of Zn-0.25 g/L ERGO and Zn-0.50 g/L ERGO composite coatings are characterized by one capacitive loop in the high frequency region and by one linear component in the low frequency region. The linear component is ascribed to the diffusion process of reacting chemical species through the coating.

Figure 7.
Impedance Nyquist plots and fitting results for Zn and Zn–ERGO composite coatings.
Table 4.
EIS fitting results of the specimens in 3.5 wt % NaCl solution.
In the equivalent circuit presented in Figure 7, Rs is the electrolyte resistance appearing between the reference electrode and the surface of the coated specimen. For all coating specimens, the high-frequency contribution is attributed to the double layer capacitance (CPE) at the electrolyte/coated surface interface coupled with charge transfer resistance (Rct). For pure Zn coatings, there is a slight rise in the low frequency region of the capacitive arc of pure Zn coating in Figure 7. This phenomenon is caused by a small amount of corrosion products on the coating surface; the corrosion products became a "protective layer" to prevent further corrosion. So, the low-frequency contribution is ascribed to the dielectric character of the thin surface layer formed from the corrosion products (Cf) and its electrical leakage from ionic conduction through its pores (Rf). For Zn-0.25 g/L ERGO and Zn-0.50 g/L ERGO composite coatings, due to the low content of RGO in the coating and the micro electrolyzer formed by RGO and the zinc matrix, the amount of corrosion products on the coating surface increases relatively, so the low-frequency contribution is also from corrosion products, and there is also a slight rise in the low frequency region of the capacitive arc of the two composite coatings, which is more obvious than that of a pure Zn coating. For Zn-1.0 g/L ERGO composite coatings, because of the high concentration of GO in the electrolyte, the number of RGO sheets embedded in the coating increased significantly, and a large number of embedded RGO sheets formed a "corrosion shield" effect with the Zn matrix. So, the EIS of the coating is a relatively complete and smooth capacitive arc without the rise of a low frequency region.
In most cases, the corrosion property of the deposits in aggressive media can be evaluated by considering the charge transfer resistance, Rct. As seen from Table 4, the Rct value of a pure Zn deposit is 413.8 Ω, and the Rct values of the Zn–ERGO composite deposits prepared by electrodeposition from zinc sulphate electrolyte partly containing 0.25, 0.50, and 1.0 g/L GO sheets are 121.6, 188.4, and 638.4 Ω, respectively. It is obvious that the Zn-1.0 g/L ERGO composite coating shows the best corrosion resistance compared to the other coatings. The enhancement of the corrosion resistance of the Zn-1.0 g/L ERGO composite coating can be attributed to three aspects. First, the surface morphology of the Zn-1.0 g/L ERGO composite coating is a laminar structure (Figure 4c,d), where the active surface area is smallest compared to the surface morphology of needle-like structures (Figure 4a) and platelets structures (Figure 4b). This means that the surface activity of the Zn-1.0 g/L ERGO composite coating is lowest. Hence, corrosion species do not easily react with the Zn matrix. Second, the distribution of graphene sheets in the Zn-1.0 g/L ERGO composite coating is uniform and this is beneficial to the improvement of corrosion resistance. Third, the micro electrolytic cells and the two passivation layers, which are formed with graphene and the zinc matrix, prevent the corrosion of the Zn matrix.
4. Conclusions
In the present study, Zn–ERGO composite coatings on 304 stainless steel were successfully prepared by direct current electrodeposition using zinc sulfate electrolytes with different GO concentrations at room temperature. The surface morphology and the preferred crystal orientation of deposited coatings change distinctly with different GO concentrations. With increasing GO concentration, the active surface area of the composite coatings was reducing and the preferred crystal orientation of deposited coatings change from the (100) crystal plane to the (002), (101), (102) crystal planes. Distinct changes of the surface morphology, the preferred crystal orientation and the “corrosion shield” between embedded RGO sheets and the Zn matrix at high concentrations of GO in the electrolyte, played an important role in the corrosion resistance behavior of deposited coatings. The Zn-1.0 g/L ERGO composite coating has shown the best corrosion resistance in comparison to the other coatings.
Author Contributions
Conceptualization, B.Y.; Data curation, G.W. and X.C.; Formal analysis, B.Y. and J.X.; Investigation, P.Z., A.W. and S.W.; Writing–original draft, B.Y.
Funding
This research was funded by National Natural Science Foundation of P.R. China (51801055, U1504516), National Science and Technology Major Project of P.R. China (2017ZX02408003), Henan Provincial Department of Science and Technology Research Project(182102210288), Key Scientific Research Projects of Higher Education Institutions of Henan Province(16A430017), Postdoctoral Research Grant in Henan Province(001703039).
Conflicts of Interest
The authors declare no conflict of interest.
References
- Prabhu, R.A.; Venkatesha, T.V.; Shanbhag, A.V.; Praveen, B.M.; Kulkarni, G.M.; Kalkhambar, R.G. Quinol-2-thione compounds as corrosion inhibitors for mild steel in acid solution. Mater. Chem. Phys. 2008, 108, 283–289. [Google Scholar] [CrossRef]
- Vathsala, K.; Venkatesha, T.V. Zn-ZO2 nanocomposite coatings: Elecrodeposition and evaluation of corrosion resistance. Appl. Surf. Sci. 2011, 257, 8929–8936. [Google Scholar] [CrossRef]
- Paramonov, V.A.; Filatova, N.G. Passivation of chrome-plated sheet iron in electrolytes based on chromium(III). Prot. Met. 2002, 38, 475–478. [Google Scholar] [CrossRef]
- Shihab, M.S.; Al-Doori, H.H. Experimental and theoretical study of [N-substituted] paminoazobenzene derivatives as corrosion inhibitors for mild steel in sulfuric acid solution. J. Mol. Struct. 2014, 1076, 658–663. [Google Scholar] [CrossRef]
- Vaezi, M.R.; Sadrnezhaad, S.K.; Nikzad, L. Electrodepositionof Ni-SiC nanocomposite coatings and evaluation of wear and corrosion resistance and electroplating characteristics. Colloids Surf. 2008, A315, 176–182. [Google Scholar] [CrossRef]
- Sancakoglu, O.; Culha, O.; Toparli, M.; Agaday, B.C.; Clik, E. Co-deposited Zn-submicron sized Al2O3 composite coatings: Production, characterization and micromechanical properties. Mater. Des. 2011, 32, 4054–4061. [Google Scholar] [CrossRef]
- Chen, W.; Wang, L.; Gao, W. Synthesis of Zn-Bi nanocomposite coatings by an ionic co-discharge process. Chem. Eng. 2012, 192, 242–245. [Google Scholar] [CrossRef]
- Kumar, M.K.; Venkatesha, T.V.; Pavithra, M.K.; Nithyanandashetty, A. A study on corrosion behavior of electrodeposited Zn-Rutile TiO2 composite coatings. Synth. React. Inorg. Metal Org. Nano Met. Chem. 2012, 42, 1426–1434. [Google Scholar] [CrossRef]
- Erten, U.; Unal, H.I.; Zor, S.; Atapek, S.H. Structural and electrochemical characterization of Zn-TiO2 and Zn-WO3 nano composite coatings electrodeposited on St 37 steel. J. Appl. Electrochem. 2015, 45, 991–1003. [Google Scholar] [CrossRef]
- Sajjadnejad, M.; Mozafari, A.; Omidvar, H.; Javanbakht, M. Preparation and corrosion resistance of pulse electrodeposited Zn and Zn-SiC nanocomposite coatings. Appl. Surf. Sci. 2014, 300, 1–7. [Google Scholar] [CrossRef]
- Chandrappa, K.G.; Venkatesha, T.V.; Nayana, K.O.; Punithkumar, M.K. Generation of nanocrystalline NiO particles by solution combustion method and its Zn–NiO composite coating for corrosion protection. Mater. Corros. 2012, 63, 445–455. [Google Scholar] [CrossRef]
- Ranganatha, S.; Venkatesha, T.V. Fabrication and electrochemical characterization of Zn-halloysite nanotubes composite coatings. RSC Adv. 2014, 4, 31230–31238. [Google Scholar] [CrossRef]
- Punithkumar, M.K.; Mahander, P.S.; Chandan, S. Electrochemical behavior of Zn-grapheme composite coatings. RSC Adv. 2015, 5, 25603–25608. [Google Scholar] [CrossRef]
- Scarpa, F.; Adhikari, S.; Phani, A.S. Effective elastic mechanical properties of single layer graphene sheets. Nanotechnology 2009, 20, 065709. [Google Scholar] [CrossRef] [PubMed]
- Kirkland, N.T.; Schiller, T.; Medhekar, N.; Birbilis, N. Exploring graphene as a corrosion protection barrier. Corros. Sci. 2012, 56, 1–4. [Google Scholar] [CrossRef]
- Singhraman, R.K.; Banerjee, P.C.; Lobo, D.E.; Gullapalli, H.; Sumandasa, M.; Kumar, A.; Choudhary, L.; Tkacz, R.; Ajayan, P.M.; Majumder, M. Protecting copper from electrochemical degradation by graphene coating. Carbon 2012, 50, 4040–4045. [Google Scholar] [CrossRef]
- Schriver, M.; Regan, W.; Gannett, W.J.; Zaniewski, A.M.; Crommie, M.F.; Zett, A. Graphene as a long-term metal oxidation barrier: Worse than nothing. ACS Nano 2013, 7, 5763–5768. [Google Scholar] [CrossRef] [PubMed]
- Chen, S.; Brown, L.; Levendorf, M. Oxidation resistance of graphene-coated Cu and Cu/Ni Alloy. ACS Nano 2011, 5, 1321–1327. [Google Scholar] [CrossRef]
- Holt, J.K.; Park, H.G.; Wang, Y.M.; Stadermann, M.; Artyukhin, A.B.; Grigoropoulos, C.P.; Noy, A.; Bakajin, O. Fast mass transport through sub-2-nanometer carbon nanotubes. Science 2006, 312, 1034–1037. [Google Scholar] [CrossRef]
- Praveen kumar, C.P.; Venkatsha, T.V.; Shabadi, R. Preparation and corrosion behavior of Ni and Ni-graphene composite coatings. Mater. Res. Bull. 2013, 48, 1477–1483. [Google Scholar] [CrossRef]
- Perera, S.D.; Mariano, R.G.; Vu, K.; Nour, N.; Seitz, O.; Chabal, Y. Hydrothermal synthesis of graphene-TiO2 nanotube composites with enhanced photocatalytic activity. ACS Catal. 2012, 2, 949–956. [Google Scholar] [CrossRef]
- Stoller, M.D.; Park, S.; Zhu, Y.; An, J.; Ruoff, R.S. Graphene-based ultracapacitors. Nano Lett. 2008, 8, 3498–3502. [Google Scholar] [CrossRef] [PubMed]
- Luo, Z.J.; Geng, H.Z.; Zhang, X.; Du, B.; Ding, E.X.; Wang, J.; Lu, Z.; Sun, B.; Wang, J.; Liu, J. A timesaving, low-cost, high-yield method for the synthesis of ultrasmall uniform graphene oxide nanosheets and their application in surfactants. Nanotechnology 2016, 27, 055601–055609. [Google Scholar] [CrossRef] [PubMed]
- Luo, Z.T.; Lu, Y.; Somers, A.L.; Johnson, A.T.C. High yield preparation of macroscopic graphene oxide membranes. J. Am. Chem. Soc. 2009, 131, 898–899. [Google Scholar] [CrossRef]
- Moussa, S.; Siamaki, A.R.; Gupton, B.F.; Eishall, M.S. Pd-partially reduced graphene oxide catalysts(Pd/PRGO): Laser synthesis of Pd nanoparticles supported on PRGO nanosheets for carbon-carbon cross coupling reactions. ACS Catal. 2012, 2, 145–154. [Google Scholar] [CrossRef]
- Maharana, H.S.; Rai, P.K.; Basu1, A. Surface-mechanical and electrical properties of pulse electrodeposited Cu–graphene oxide composite coating for electrical contacts. J. Mater. Sci. 2017, 52, 1089–1105. [Google Scholar] [CrossRef]
- Li, R.Q.; Liang, J.; Hou, Y.Y.; Chu, Q.W. Enhanced corrosion performance of Zn coating by incorporating graphene oxide electrodeposited from deep eutectic solvent. RSC Adv. 2015, 5, 60698–60707. [Google Scholar] [CrossRef]
- Liu, C.; Su, F.; Liang, J. Producing cobalt-graphene composite coating by pulse electrodeposition with excellent wear and corrosion resistance. Appl. Surf. Sci. 2015, 351, 889–896. [Google Scholar] [CrossRef]
- Raghupathy, Y.; Kamboj, A.; Rekha, M.Y.; Narasimha, N.P.; Chandan, S. Copper-graphene oxide composite coatings for corrosion protection of mild steel in 3.5% NaCl. Thin Solid Films 2017, 636, 107–115. [Google Scholar] [CrossRef]
- Qiu, Z.Z.; Wang, R.; Wu, J.Z.; Zhang, Y.S.; Qu, Y.F.; Wu, X.H. Graphene oxide as a corrosion-inhibitive coating on magnesium alloys. RSC. Adv. 2015, 5, 44149–44159. [Google Scholar] [CrossRef]
- Du, D.; Liu, J.; Zhang, X.; Cui, X.; Lin, Y. One-step electrochemical deposition of a graphene–ZrO2 nanocomposite: Preparation, characterization and application for detection of organophosphorus agents. J. Mater. Chem. 2011, 21, 8032–8037. [Google Scholar] [CrossRef]
- Perret, P.G.; Malenfant, P.R.; Bock, C.; Macdougall, B. Electro-deposition and dissolution of MnO2 on a grapheme composite electrode for its utilization in an aqueous based hybrid supercapacitor. J. Electrochem. Soc. 2012, 159, A1554–A1557. [Google Scholar] [CrossRef]
- Hu, J.; Li, H.; Wu, Q.; Zhao, Y.; Jiao, Q. Synthesis of TiO2 nanowire/reduced graphene oxide nanocomposites and their photocatalytic performances. Chem. Eng. J. 2015, 263, 144–150. [Google Scholar] [CrossRef]
- Cui, P.; Lee, J.; Wang, E.H.; Lee, H. One-pot reduction of graphene oxide at subzero temperatures. Chem. Commun. 2011, 47, 12370–12372. [Google Scholar] [CrossRef] [PubMed]
- Ranganatha, S.; Venkatesha, T.V.; Vathsala, K.; Punithkumar, M.K. Electrochemical studies on Zn/nano-CeO2 electrodeposited composite coatings. Surf. Coat. Technol. 2012, 208, 64–72. [Google Scholar] [CrossRef]
- Adriana, V.; Simona, V.; Aurel, P.; Caius, B. Electrodeposited Zn-TiO2 nanocomposite coatings and their corrosion behavior. J. Appl. Electrochem. 2010, 40, 1519–1527. [Google Scholar] [CrossRef]
- Gomes, A.; Pereira, M.I. Pulsed electrodeposition of Zn in the presence of surfactants. Electrochim. Acta. 2006, 51, 1342–1350. [Google Scholar] [CrossRef]
- Tu, W.Y.; Xu, B.S.; Dong, S.Y.; Wang, H.D.; Bin, J. Chemical and electrocatalytical interaction: Influence of nano-electroactive ceramic nanopartic on nickel electrodeposition and composite coating. J. Mater. Sci. 2008, 43, 1102–1108. [Google Scholar] [CrossRef]


© 2019 by the authors. Licensee MDPI, Basel, Switzerland. This article is an open access article distributed under the terms and conditions of the Creative Commons Attribution (CC BY) license (http://creativecommons.org/licenses/by/4.0/).