Article

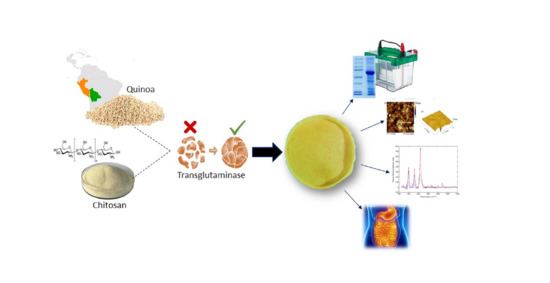
Effect of Transglutaminase Cross-Linking in Protein Isolates from a Mixture of Two Quinoa Varieties with Chitosan on the Physicochemical Properties of Edible Films

by
Monserrat Escamilla-García
1,
Luis Felipe Delgado-Sánchez
1,
Raquel Adriana Ríos-Romo
1,
Blanca E. García-Almendárez
1,
Georgina Calderón-Domínguez
2,
Juan Vicente Méndez-Méndez
3,
Aldo Amaro-Reyes
1,
Prospero Di Pierro
4 and
Carlos Regalado-González
1,*
1
Facultad de Química, Departamento de Investigación y Posgrado en Alimentos, Universidad Autónoma de Querétaro, C.U., Cerro de las Campanas S/N, Col. Las Campanas, Querétaro 76010, Mexico
2
Departamento de Ingeniería Bioquímica, Instituto Politécnico Nacional, Av. Wilfrido Massieu Esq. Cda. Miguel Stampa S/N, Gustavo A. Madero, Ciudad de Mexico 07738, Mexico
3
Centro de Nanociencias y Micro y Nanotecnologías, Instituto Politécnico Nacional, Av. Luis Enrique Erro s/n, Nueva Industrial Vallejo, Ciudad de Mexico 07738, Mexico
4
Department of Chemical Sciences, University of Naples “Federico II”, 80126 Naples, Italy
*
Author to whom correspondence should be addressed.
Coatings 2019, 9(11), 736; https://doi.org/10.3390/coatings9110736
Submission received: 18 September 2019 / Revised: 31 October 2019 / Accepted: 1 November 2019 / Published: 6 November 2019
(This article belongs to the Special Issue Edible Films and Coatings: Fundamentals and Applications)

Abstract

:
The growing demand for minimally processed foods with a long shelf life and environmentally friendly materials has forced industry to develop new technologies for food preservation and handling. The use of edible films has emerged as an alternative solution to this problem, and mixtures of carbohydrates and proteins, may be formulated to improve their properties. The objective of this work was to evaluate the effect of protein cross-linking with transglutaminase (TG) of two varieties of quinoa protein isolate (Chenopodium quinoa) [Willd (QW), and Pasankalla (QP)] on the physicochemical and barrier properties of edible films based on chitosan (CT)-quinoa protein. The evaluated properties were water vapor permeability (WVP), solubility, adsorption, roughness determined by atomic force microscopy, and the interactions among the main film components determined by Raman spectroscopy. The results indicated that TG interacted with lysine of QW and QP. CT:QW (1:5, w/w) showed the lowest solubility (14.02 ± 2.17% w/w). WVP varied with the composition of the mixture. The WVP of CT:quinoa protein ranged from 2.85 to 9.95 × 10⁻¹¹ g cm Pa−1 cm−2 s−1 without TG, whereas adding TG reduced this range to 2.42–4.69 × 10⁻¹¹ g cm Pa−1 cm−2 s−1. The addition of TG to CT:QP (1:10, w/w) reduced the film surface roughness from 8.0 ± 0.5 nm to 4.4 ± 0.3 nm. According to the sorption isotherm, the addition of TG to CT-QW films improved their stability [monolayer (Xm) = 0.13 ± 0.02 %]. Films with a higher amount of cross-linking showed the highest improvement in the evaluated physical properties, but interactions among proteins that were catalyzed by TG depended on the protein source and profile.

Graphical Abstract

1. Introduction

Edible films and coatings have attracted great interest due to their ability to preserve the quality and safety of foods, maintaining their flavor, color, and nutritional value during storage [1]. Edible coatings are defined as a thin layer of material that is used to coat foods to prolong their shelf life, which can be consumed along with it [2]. Edible films that are based on proteins are transparent and show good gas barrier properties; the most popular are zein, collagen, whey protein concentrate or isolate, wheat gluten, egg white protein, myofibrillar protein, keratin, and quinoa protein [3]. Quinoa is a pseudocereal with a relatively high protein content and better essential amino acid balance than cereals, providing (per 100 g of protein) high levels of lysine (4–7.8 g), methionine (0.3–9.1 g), histidine (2.4–5.4 g), and threonine (2.1–8.9 g) [4]. Quinoa protein concentrate has been used in edible films to extend the shelf life of food products, showing good extensibility due to its plasticizing effect [5]. These films display good mechanical properties, but poor water vapor barrier, thus lipids have been incorporated into the matrix. However, lipids have demonstrated an adverse effect on mechanical properties [6] and, for this reason, some studies have focused on chitosan-quinoa protein mixtures, since chitosan (CT) allows the formation of hydrogen bonds and other intermolecular interactions with quinoa protein producing films with enhanced mechanical properties [5].
CT is a linear copolymer of 2-acetamido-2-deoxy-β-d-glucopyranose and 2-amino-2-deoxy-β-d-glucopyranose linked by β-(1→4) bonds; this polysaccharide is obtained from chitin deacetylation [6]. CT is a polymer that is capable of forming edible films with a range of mechanical, barrier, and antimicrobial properties, which depend on the source and solvents that are used for its extraction. One report shows that quinoa protein can interact through anionic sulfide groups with chitosan protonated amino groups, generating a synergistic effect on the mechanical and barrier properties of films [7]. Plasticizers and cross-linking agents have been used to improve the mechanical and barrier properties of films [3]. Cross-linking is a process whereby polymer chains are linked through covalent or non-covalent bonds and it has been applied in protein based films, which can be mixed with carbohydrate biopolymers. Cross-linking improves the mechanical and barrier properties of films due to the reduction of polymer mobility, water solubility, and free volume, which hinders biodegradation [8].
Transglutaminase (TG) is a transferase enzyme (EC 2.3.2.13) that is used as cross-linking agent that catalyzes covalent and intermolecular bond formation between glutamine and lysine. The optimum pH of TG is between 5 and 7, and it has residual activity at pH 4 and 9 [9]. Some studies have shown that films that are made from CT-quinoa protein are poor water vapor barriers, whereas the addition of lipid compounds has a negative effect on the mechanical properties [5]. Thus, the aim of this work was to evaluate the effect of protein cross-linking of two different varieties of quinoa on the physicochemical and barrier properties of edible films based on CT-quinoa protein.

2. Materials and Methods

2.1. Material

Peruvian quinoa (Chenopodium quinoa Willd; QW) was acquired from Hanseatik (Puno, Peru), while Bolivian quinoa (C. quinoa Pasankalla; QP) was supplied by Tiqua quinoa (La Paz, Bolivia). Chitosan (Cat. 417963), sorbitol (Cat. W302902), pepsin from porcine gastric mucosa (Cat. 107192), trypsin (Cat. D4793), and α-chymotrypsin (Cat. 102307) from bovine pancreas were all purchased from Sigma-Aldrich (St. Louis, MO, USA). Microbial transglutaminase that was derived from Streptoverticillium sp., with 92 IU/g (Active WM) was obtained from Ajinomoto (Paris, France). All other chemicals were of analytical grade and purchased from Sigma-Aldrich.

2.2. Methods

2.2.1. Extraction of Quinoa Protein

The two varieties of quinoa seeds were ground while using a coffee grinder (Krups Model GX410011, Solingen, Germany) and passed through a sieve with a 200-μm pore opening (No. 9, Tyler standard). The flour was degreased three times while using a 2:1 (v/v) chloroform:methanol solution in a 10:1 (w/w) solution:flour ratio and then stirred at 300 rpm (Thermolyne SP-131325, Waltham, MA, USA) for 2 h at room temperature [4]; the extraction was carried out according to Ruiz [10]. The defatted flours were suspended in distilled water (10%, w/v), adjusted to pH 11 using 1N NaOH, followed by stirring on a hot plate (Thermolyne) for 1 h at room temperature (25 °C). Subsequently, the samples were centrifuged at 3200× g, at 10 °C for 30 min. The supernatant pH was adjusted to 4.5, followed by centrifugation for 30 min. under the same conditions. The precipitate was resuspended in distilled water and neutralized with 2N NaOH, and the extracts were dried at 50 °C in an oven (ED, Binder, Tuttlingen, Germany). Finally, the protein isolates were ground using a coffee mill (Krups), for 2 min. and passed through a No. 9 mesh (Tyler standard).

2.2.2. Moisture and Protein Content

Moisture was evaluated by using a thermobalance (Precisa, XM 50, Dietikon, Switzerland). Protein was determined by the Kjeldahl method [11] while using a conversion factor of N × 5.54.

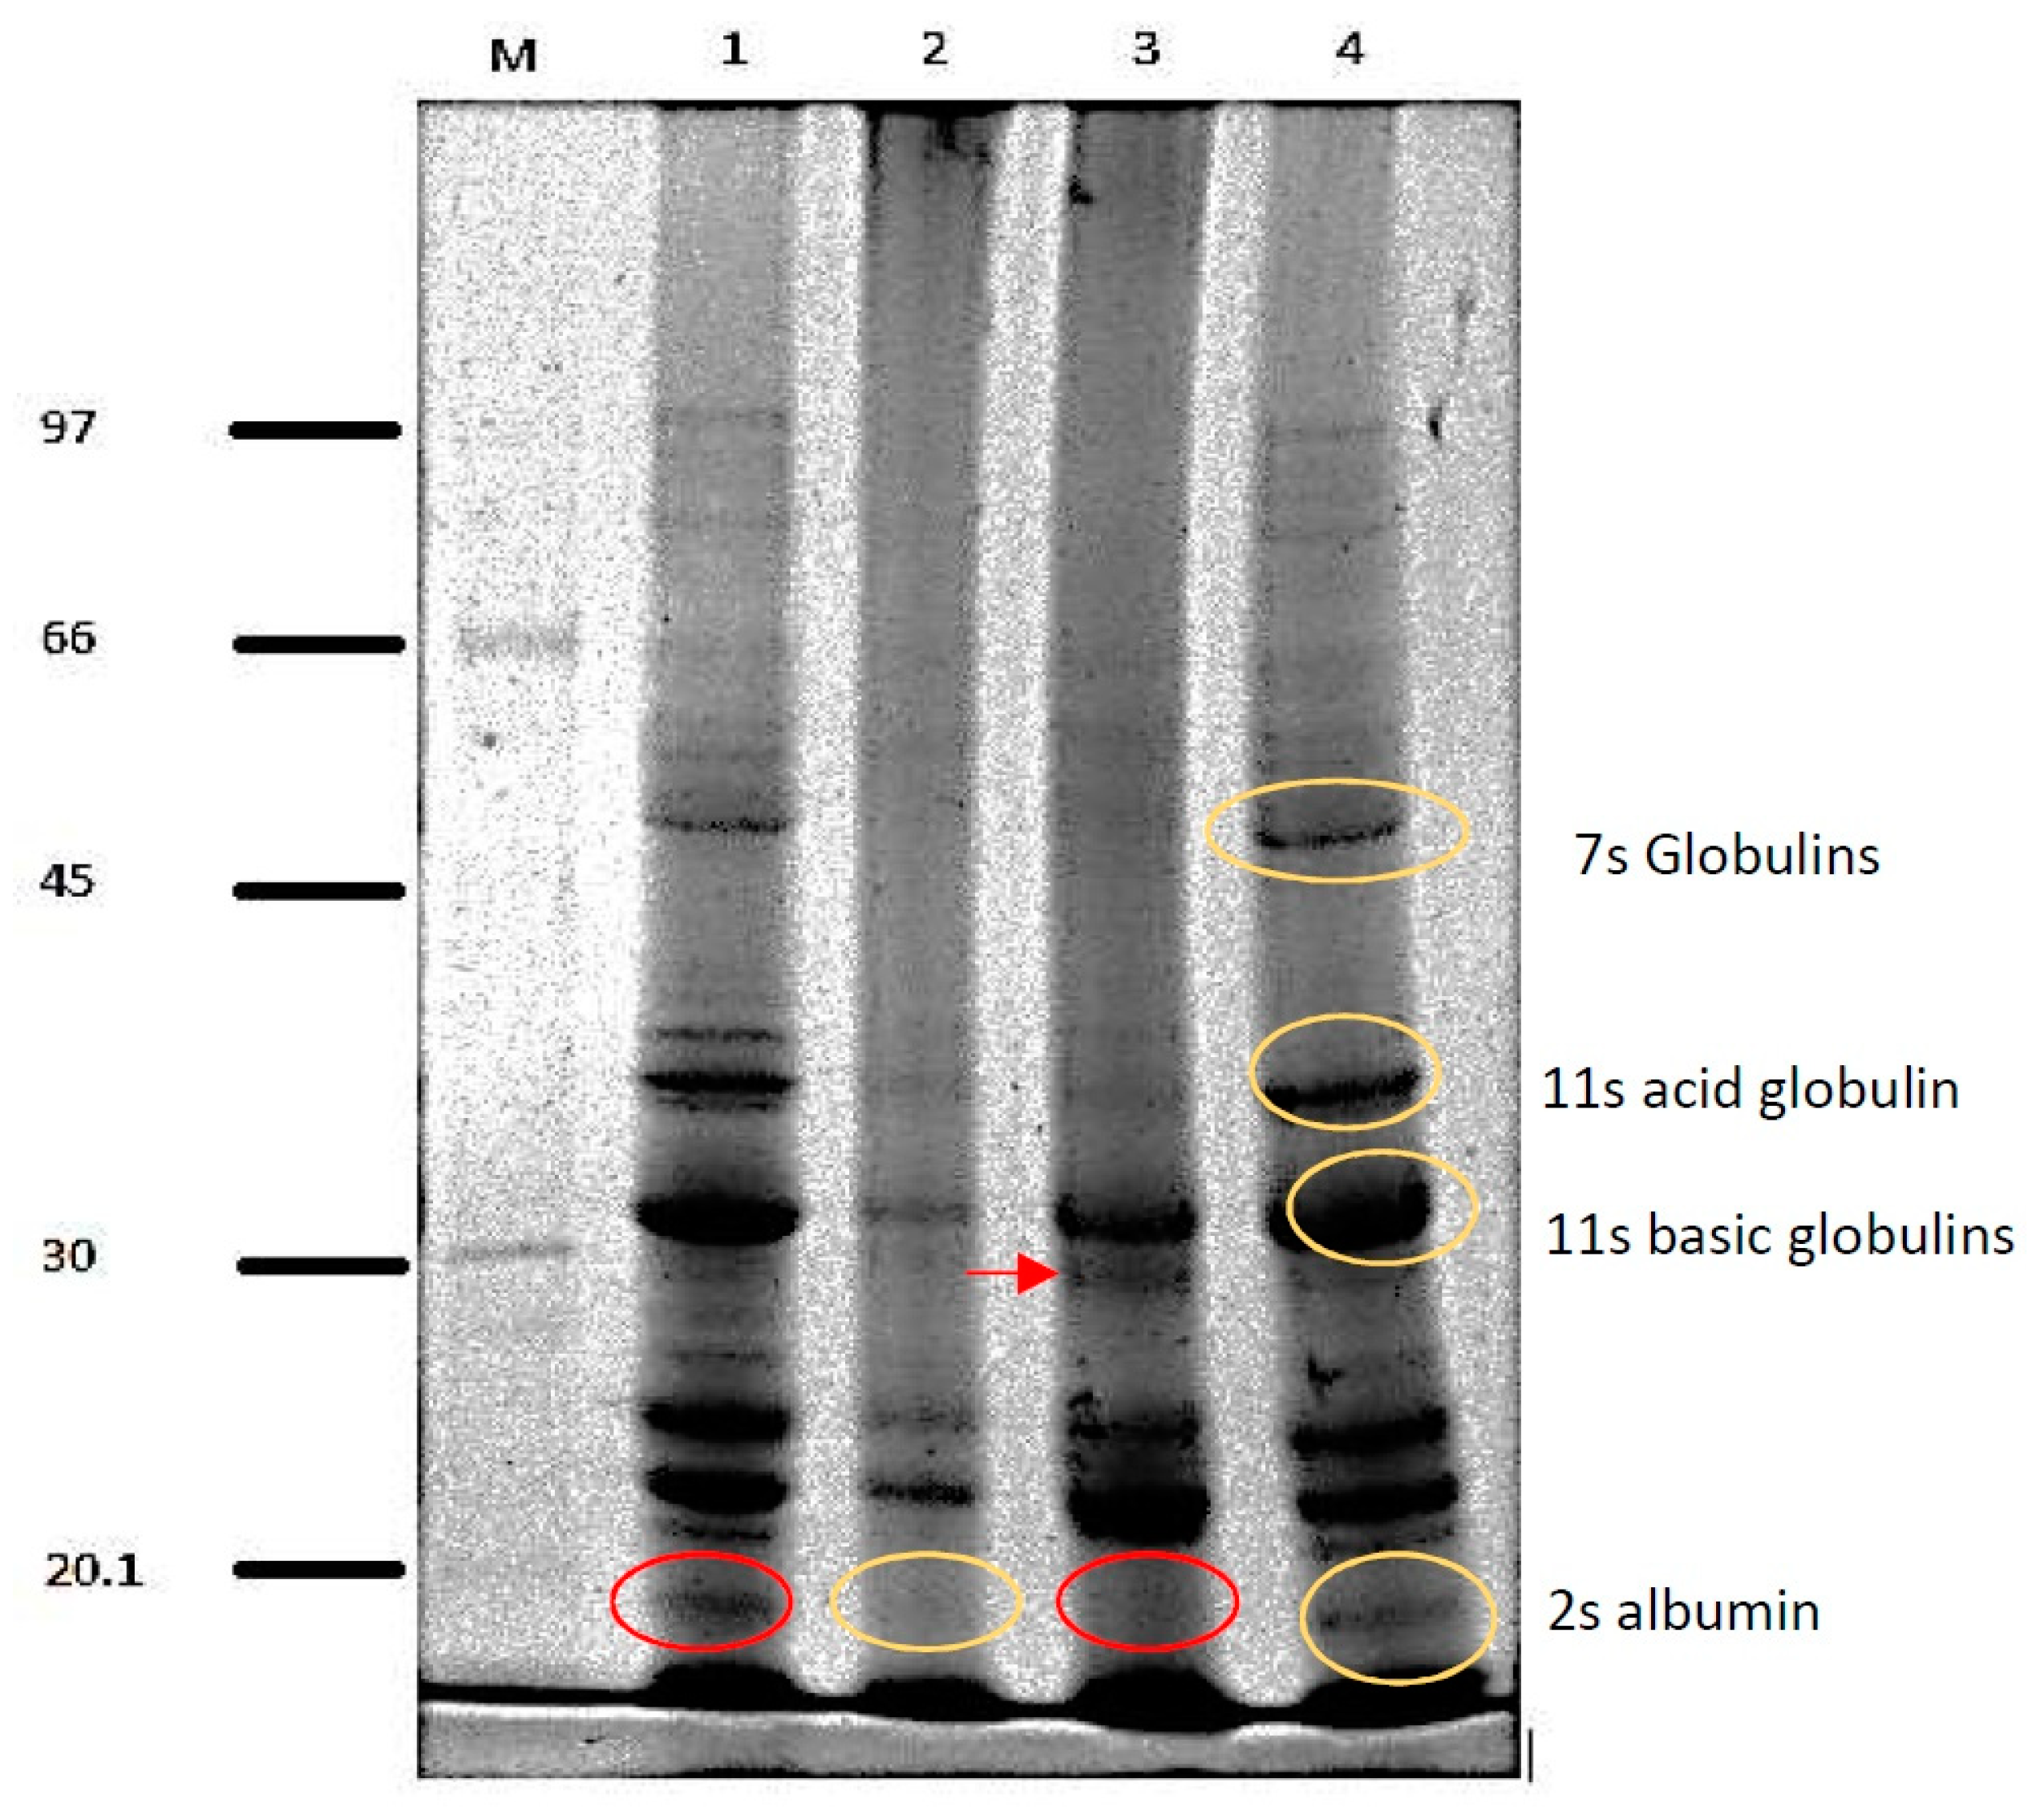
2.2.3. Electrophoresis (SDS-PAGE)

The protein profiles of concentrates were evaluated by sodium dodecyl sulfate polyacrylamide gel electrophoresis (SDS-PAGE), using 12 T (weight % acrylamide in the mixture acrylamide plus bis-acrylamide). The samples were separated in a Bio-Rad chamber (Mini-PROTEAN II, Hercules, CA, USA) at 100 V for 15 min. and then at 150 V for 45 min., and low molecular weight markers (GE Healthcare, Little Chalfont, Bucks, UK) were used. Gels were subjected to a digital imaging system (ProteinSimple, AlphaImager, Kent, UK), and analysis was carried out using the Gelanalyzer 2010a software [12].

2.2.4. Quinoa Protein Edible Films

Two protein suspensions (QP and QW) were prepared (2% w/v) in distilled water and adjusted to pH 11 with 1 N NaOH, and the same procedure was used to produce films. The suspensions were heated in a water bath at 70 °C for 30 min. and then sorbitol was added as plasticizer (40% w/w, based on protein). Finally, the films were produced by the casting method and dried (T = 40 °C, relative humidity (HR) = 50%, 24 h) [13].

2.2.5. Chitosan Edible Films

Chitosan films were produced according to Escamilla-García [14] with some modifications. A chitosan suspension (1% w/v) in lactic acid (0.5% w/v) was prepared with constant stirring for 1 h at 80 °C. After cooling, sorbitol was added in a 1:1 (w/w) ratio and then stirred for 10 min. Film was formed by the casting method and dried at 40 °C and 50% RH for 24 h in a climatic chamber (Binder, KBF 115, Tuttlingen, Germany).

2.2.6. Chitosan-Quinoa Protein Films

Quinoa and chitosan protein solutions (with and without TG), as described in Section 2.2.4 and Section 2.2.5, respectively, were mixed in ratios (chitosan:protein, w/w) of 1:5, 1:10, 1:15, and 1:20; plasticizer addition and film formation were conducted as directed in the respective sections.

2.2.7. Determination of the Extent of Cross-Linking

The degree of cross-linking was determined according to Al-Hassan and Prasertsung [15,16]. 1 mL of 0.5% (w/v) 2,4,6 trinitrobenzene sulfonic acid (TNBS) and 1 mL of 4% (w/v) sodium bicarbonate solution (pH 8.5) were added to 5 mg of film, and the mixture was heated at 40 °C for 2 h. Subsequently, 2 mL of 6 N HCl was added and the solution was stirred at 60 °C for 1.5 h, cooled to 25 °C, and absorbance was measured at 415 nm in a microplate reader (GENESYS UV-Vis, Thermo Scientific, Waltham, MA, USA). Non-crosslinked amino groups react with TNBS to form a soluble yellow complex. The degree of cross-linking (%CTG) was calculated while using Equation (1) and expressed as mean ± standard deviation (n = 4).
% C TG = 1 A wTG A oTG × 100
where AwTG = absorbance of crosslinked protein in the film and AoTG = absorbance of non-crosslinked protein in the film.

2.2.8. Edible Film Characterization

• Thickness and Solubility
Film thickness was determined while using a micrometer (Mitutoyo, Series 293 Imp, IL, USA). Portions of films (2 cm × 2 cm) were dried at 70 °C for 24 h and the initial weight of each film was recorded. The films were placed in 20 mL of sodium benzoate solution (0.01% w/w) and stirred in a water bath for 24 h at 25 °C. The solutions were passed through a filter paper previously subjected to constant weight and they were dried at 70 °C for 24 h, and then the filter paper and film residue were weighed. Solubility was determined by Equation (2) [17].
% SP = P 1 s P 2 s P 1 s × 100
where %SP is percentage solubility, P1s is initial weight of dry film, and P2s is final weight of the dry film.
• Water Vapor Permeability
Water vapor permeability (WVP) was determined according to Escamilla-García [18]. In this test, the permeability cells of known cross sectional area (A) were used. Films of known thickness (L) were placed on top of cells containing a saturated NaCl solution (HR = 75%) and then placed in a desiccator containing saturated KNO3 solution (HR = 95.6%) to generate a pressure difference (ΔP). The weight increase (ΔW) was registered every 15 min. until equilibrium was reached at time t and constant temperature (25 °C). WVP was obtained from Equation (3).
WVP = Δ W t   A × L Δ P
• Adsorption Isotherms
Saturated solutions of lithium chloride, potassium acetate, magnesium chloride, potassium carbonate, magnesium nitrate, sodium bromide, sodium chloride, and potassium chloride were prepared and placed in different desiccators to obtain water activity (aw) of 0.11, 0.23, 0.33, 0.43, 0.58, 0.76, and 0.85, respectively. Before the test, the initial moisture content of films was determined by using a thermobalance (Precisa XM 50). Film sections of 1.5 cm × 1.5 cm were cut and conditioned at RH = 53% and 23 ± 1 °C. Afterwards, the films were placed in different desiccators and weight variations were recorded until equilibrium was reached [19]. The data were fitted to the Guggenheim-Anderson-de Boer (GAB) sorption isotherm model (Equation (4)).
X = X m C K a w ( 1 K a w ) ( 1 K a w + C K a w )
where X is the moisture content (kg water/kg dry solid); Xm is the monolayer value (kg water/kg dry solid), C is the Guggenheim constant characteristic of the films and related to the heat of adsorption of the monolayer, and K is a correction factor that is related to the multilayer heat of sorption.
• Atomic Force Microscopy
Atomic force microscopy (AFM) was used to evaluate the surface roughness of edible films, following Escamilla-García et al. [18], while using an atomic force microscope (di Multimode V, Veeco, Plainview, NY, USA) in contact mode. Images were obtained by measuring force changes between the cantilever and samplewhile using silicon tips (Bruker RTESP Cantilever, Karlsruhe, Germany). Film portions of 0.5 cm × 0.5 cm were used, and the resonance frequency of scanning was 286–362 kHz with a spring constant of 20–80 N m−1, scanning speed of 1 Hz, and resolution of 256 × 256 pixels. The results were analyzed while using the Gwyddion Version 2.53 software (Okružní, Czech Republic).
From images of edible films, roughness was obtained by estimating the square root of the deviation from an average plane of the peaks and surface valleys (Rq) (Equation (5)). The mean absolute value of surface height deviations, as measured from the middle plane (Ra), was calculated by using Equation (6).
R q = Z i 2 N
R a = 1 N j = 1 N Z j
where Ra and Rq are the roughness values (nm), Zi and Zj are height difference of i and j relative to the average of the heights, and N is the number of points on the image.
• Raman Spectroscopy
The interactions of film components were evaluated while using a Raman spectrometer (Olympus BX41 Horiba, Yvon, Kyoto, Japan), coupled to a microscope (Olympus BX 41). The samples were radiated with a 735 nm laser with a 50× objective, aperture number 0.55, and diffraction limit of 702 nm. Spectral resolution was 0.16 cm−1, with 1800 g/mm while using a Charge Coupled Device (CCD) detector with a spectral range of 450 to 950 nm. Confocal opening and the monochromator inlet slit were set at 400 μm. Readings were obtained in the spectral range of 500 to 3500 cm−1, and data were processed while using the Spectragraph 1.1.2 program [14].

2.2.9. Simulated Gastric and Duodenal Digestion

Five milligrams of each film was placed in 600 μL of simulated salivary fluid (SSF), comprising 4 mM urea in 150 mM NaCl at pH 6.9 and incubated at 37 °C for 5 min. under constant agitation (170 rpm). Afterwards, 75 μL of films previously incubated in SSF were combined with 100 μL of simulated gastric fluid (SGF) containing 0.15 M NaCl, pH = 2.5, and digestion was started by adding pepsin solution at a 1:20 enzyme:protein (w/w) ratio. Simulated gastric digestion was evaluated at minutes 1, 2, 5, 10, 20, 40, and 60, while using a control without pepsin, and the reaction was stopped by adding 40 μL of 0.5 M NH4(HCO3). After 60 min. of gastric digestion, the samples were adjusted to pH = 6.5 with 0.5 M bis-Tris HCl and simulated duodenal fluid (SDF) was prepared by dissolving NaCl to 0.15 M and bile salts (sodium taurocholate and glycodeoxycholate) to 4 mM and pre-incubated at 37 °C for 10 min. Subsequently, trypsin and chymotrypsin were added in a ratio of 1:400 and 1:100 (w/w) (enzyme:quinoa protein), respectively. Aliquots were taken during proteolysis at minutes 1, 2, 5, 10, 20, 40, and 60, and duodenal proteolysis was stopped by the addition of trypsin-chymotrypsin Bowmann-Birk inhibitor [20]. The extent of hydrolysis was determined by SDS-PAGE, as depicted in Section 2.2.3.

2.2.10. Statistical Analysis

All the tests were conducted in triplicate and, when edible film samples were analyzed, measurements were taken at five different points (ends and center). Data were evaluated by one-way analysis of variance (ANOVA) while using the Sigma Stat 3.5 software program (San Jose, CA, USA). Significant differences were determined by using the Tukey test, with a p < 0.05 level of significance.

3. Results and Discussion

3.1. Protein Isolate Characterization

From SDS-PAGE electrophoresis, changes in QW and QP proteins were identified, together with the extent of cross-linking. Differences were found between the QP and QW protein profiles in the presence and absence of TG (Figure 1). Both quinoa varieties clearly showed cross-linking, the WP protein profile is shown in lane 1 and, after TG addition (lane 3), the first band of lane 1 (about 97 kDa) disappeared, whereas a faint band was noticed close to the top of the gel (lane 3: >97 kDa), and a distinct band appeared at about 30 kDa (see arrow, Figure 1). The QP profile (lane 4) showed a similar band close to 30 kDa after TG addition. Although cross-linking is observed in both quinoa varieties, the newly formed protein bands showed different molecular weights.
Characteristic bands of globulin fractions are observed for both quinoa varieties in the presence and absence of TG (Figure 1), such as 11S basic subunit (28 kDa), 11S acid (40.5 kDa), 7s (43 kDa), and the 2S fraction of albumin (<20 kDa). These results coincide with Kaspchak et al. [20], who found polypeptides of 59 kDa, 43 kDa, 35 kDa, 26 kDa, 24 kDa, and 22 kDa in quinoa protein, which are characteristic of acidic and basic subunits of 11S quinoa globulin [21]. QW showed bands of molecular weight >66 kDa that were not observed in the QP variety, in addition to clearly defined bands of 58.4 kDa, 40.5 kDa, and three more bands close to 27 kDa, which are characteristic of this quinoa variety (Figure 1) [22].
The different protein profiles of QP and QW are reflected in the physical properties of the produced edible films. The addition of TG to QW resulted in the disappearance of the 11S fraction, commonly known as chenoponide, which is rich in glutamine/glutamic acid, asparagine/aspartic acid, arginine, serine, leucine, and glycine and it has a low content of sulfur-containing amino acids (methionine and cysteine) [23,24]. The 11S fraction (acidic and basic) contains about 2.7%–2.9% lysine [25] and, thus, TG could have catalyzed covalent bond formation between glutamine and lysine of these units. The changes that were observed in bands of molecular weight ~50 kDa may also be associated with TG-catalyzed intra- and inter-molecular cross-linking between lysine and glutamine of varying extent, according to the variety of quinoa used [26]. A similar behavior was observed by Basman et al. [27], who conducted cross-linking of soy protein with TG that mainly affected acidic subunits, because basic subunits are not easily accessible to TG.
Pereira et al. [28], reported that the nutritional and biological properties of quinoa seed depend on the natural conditions, where they are cultivated (atmospheric pressure, climate, salinity, among others). The protein content of QW isolate was higher than that of QP isolate (Table 1), and both values are slightly lower than those that were reported for the same varieties ranging from 74.3% to 76.3% [22]. The moisture content agrees with Pereira et al. [28], who reported values between 4% and 13% (p/p) for QW, while Elsohaimy [4] reported 11.09%–12.72% for QP.

3.2. Cross-Linking

Films that were made from QP showed higher degree of cross-linking (61.45 ± 3.73%) than those made from QW (40.55 ± 3.61%) (Table 2). However, the addition of chitosan favored the cross-linking of QW, since the film made from CT-QW (1:15 w/w) showed the highest degree of cross-linking (67.61 ± 3.28%), but it did not significantly differ (p > 0.05) from that of CT:QW 1:10 (w/w) film. It has been reported that the degree of cross-linking is related to the number of free amino groups, which in turn depend on steric and conformational restrictions [15]. High molecular weight polypeptides are formed when TG is added to QP, but they are not observed when it is added to QW, which indicates a larger cross-linking effect on QP (Figure 1).

3.3. Physical Properties

The films are intended to be used as coating materials, being eaten together with the food product (mainly perishable foods), and thus the materials should partly dissolve in the tongue to avoid the sensation of a solid material which is not the food product. This is achieved by designing a partially soluble and relatively thin film, which in contact with the tong starts to dissolve and goes unnoticed by the consumer. Figure 2 shows an image showing the appearance of films produced from QW and QP.
The thicknesses of films that were made from a combination of CT with QW or QP varieties were not significantly different, but films that were made from quinoa protein only tended to be thinner than those made from protein-CT mixtures (Table 3). Films produced with a higher protein concentration (1:20 w/w), were the thinnest for both quinoa varieties.
The WVP of both quinoa protein varieties decreased in the presence of TG, but permeability significantly increased (p > 0.05) with the addition of CT (Table 3). The highest WVP was obtained for the CT:QW film (1:5, w/w), which decreased by 70% upon the addition of TG. Nonetheless, the QP variety showed superior barrier properties. The effect of cross-linking on WVP was lower in QP than QW, and the largest difference was found in the film made from CT:QP (1:5, w/w), changing from 4.97 ± 0.82 to 3.23 ± 0.43 × 10⁻¹³ g cm Pa−1 cm−2 s−1 in the presence of TG.
Cross-linking with TG creates a crosslinked spatial network decreasing intermolecular spaces that inhibit water molecule migration [29]; therefore, films undergoing a higher degree of cross-linking are expected to be superior water vapor barriers. Although cross-linking improved the WVP barrier, the addition of CT produced the opposite effect, which was probably due to a permeation mechanism occurring in CT films that comprises adsorption and diffusion. Initially, water is easily adsorbed in the polymer matrix by free hydrophilic groups of the chitosan structure followed by its diffusion. The hydrophilic groups of chitosan decrease when covalent and/or hydrogen bonds are formed, which affects the film’s affinity for water molecules, improving its diffusion. This might explain why increasing protein concentration generates hydrogen bond formation that allows for reduction in the WVP barrier [30]. Solubility decreased in the presence of CT and TG for both quinoa protein varieties. The most soluble film was QP (71.84 ± 1.58%) and the least soluble was CT-QW (1:5, w/w) film combined with TG (14.02 ± 2.17%) (Table 3). Protein films (QW and QP) showed the highest solubility values due to the pH used to produce the films because protein solubility depends on this value. At pH 11, 90% albumin and 50% globulins reach maximum solubility, and protein is negatively charged due to carboxyl group ionization and amino group deprotonation, which also favors solubility [23]. CT is semi-crystalline in nature, being mainly derived from inter- and intramolecular hydrogen bonds and thus, it is soluble at pH < 6 only [31]. TG decreases film solubility because cross-linking leads to the reduction of intermolecular spaces that inhibit water molecule diffusion [29]. QP comprises a larger number of highly soluble low molecular weight fractions than QW; therefore, edible films that were made from QP were more soluble than those made from QW [15].

3.4. Edible Film Sorption Isotherms

Good agreement was observed between experimental and modeled GAB isotherm values. Xm indicates the amount of water molecules that are attached to active sites present on the substrate surface and it is considered the optimal value to ensure stability of a substrate material. The lower the value of Xm, the higher the stability [32].
The lowest Xm determination coefficient (r2) was 0.90 for CT:QW 1:5 (w/w) films, whereas those showing the highest Xm were CT-quinoa protein (1:15 and 1:20, w/w) for both quinoa protein varieties (Table 4). However, the addition of TG produced CT-QW 1:20 (w/w) films showing the highest Xm, whereas its effect on CT-QP (1:20, w/w) was the opposite. Molecular interactions of quinoa proteins with CT could decrease the polar groups and, in turn, active sites on the film surface, modifying the monolayer value [33]. K values for both quinoa protein varieties were < 1, and the highest K value was obtained by the CT:QP 1:5 (w/w) film. The Guggehnheim constant C was higher for films without chitosan and it generally tended to decrease for both proteins when the CT proportion was increased in combinations of CT-QP and CT-QW, probably due to a decrease in hydrophilic groups. An exception was noticed for the mixture CT:QP 1:5 (w/w), which showed the highest C value for all CT-quinoa protein mixtures, irrespective of TG addition, whose effect was unclear. The constant C represents energy that is related to the difference in chemical potential of molecules adsorbed on the monolayer and superior sorption layers. K and C are temperature dependent constants that can be used to construct sorption isotherms at different temperatures [34]. The high value of C constant shows that water molecules are more strongly adsorbed onto matrix active sites [35], whereas K provides a measure of molecular interactions between the multilayers and adsorbent [36].

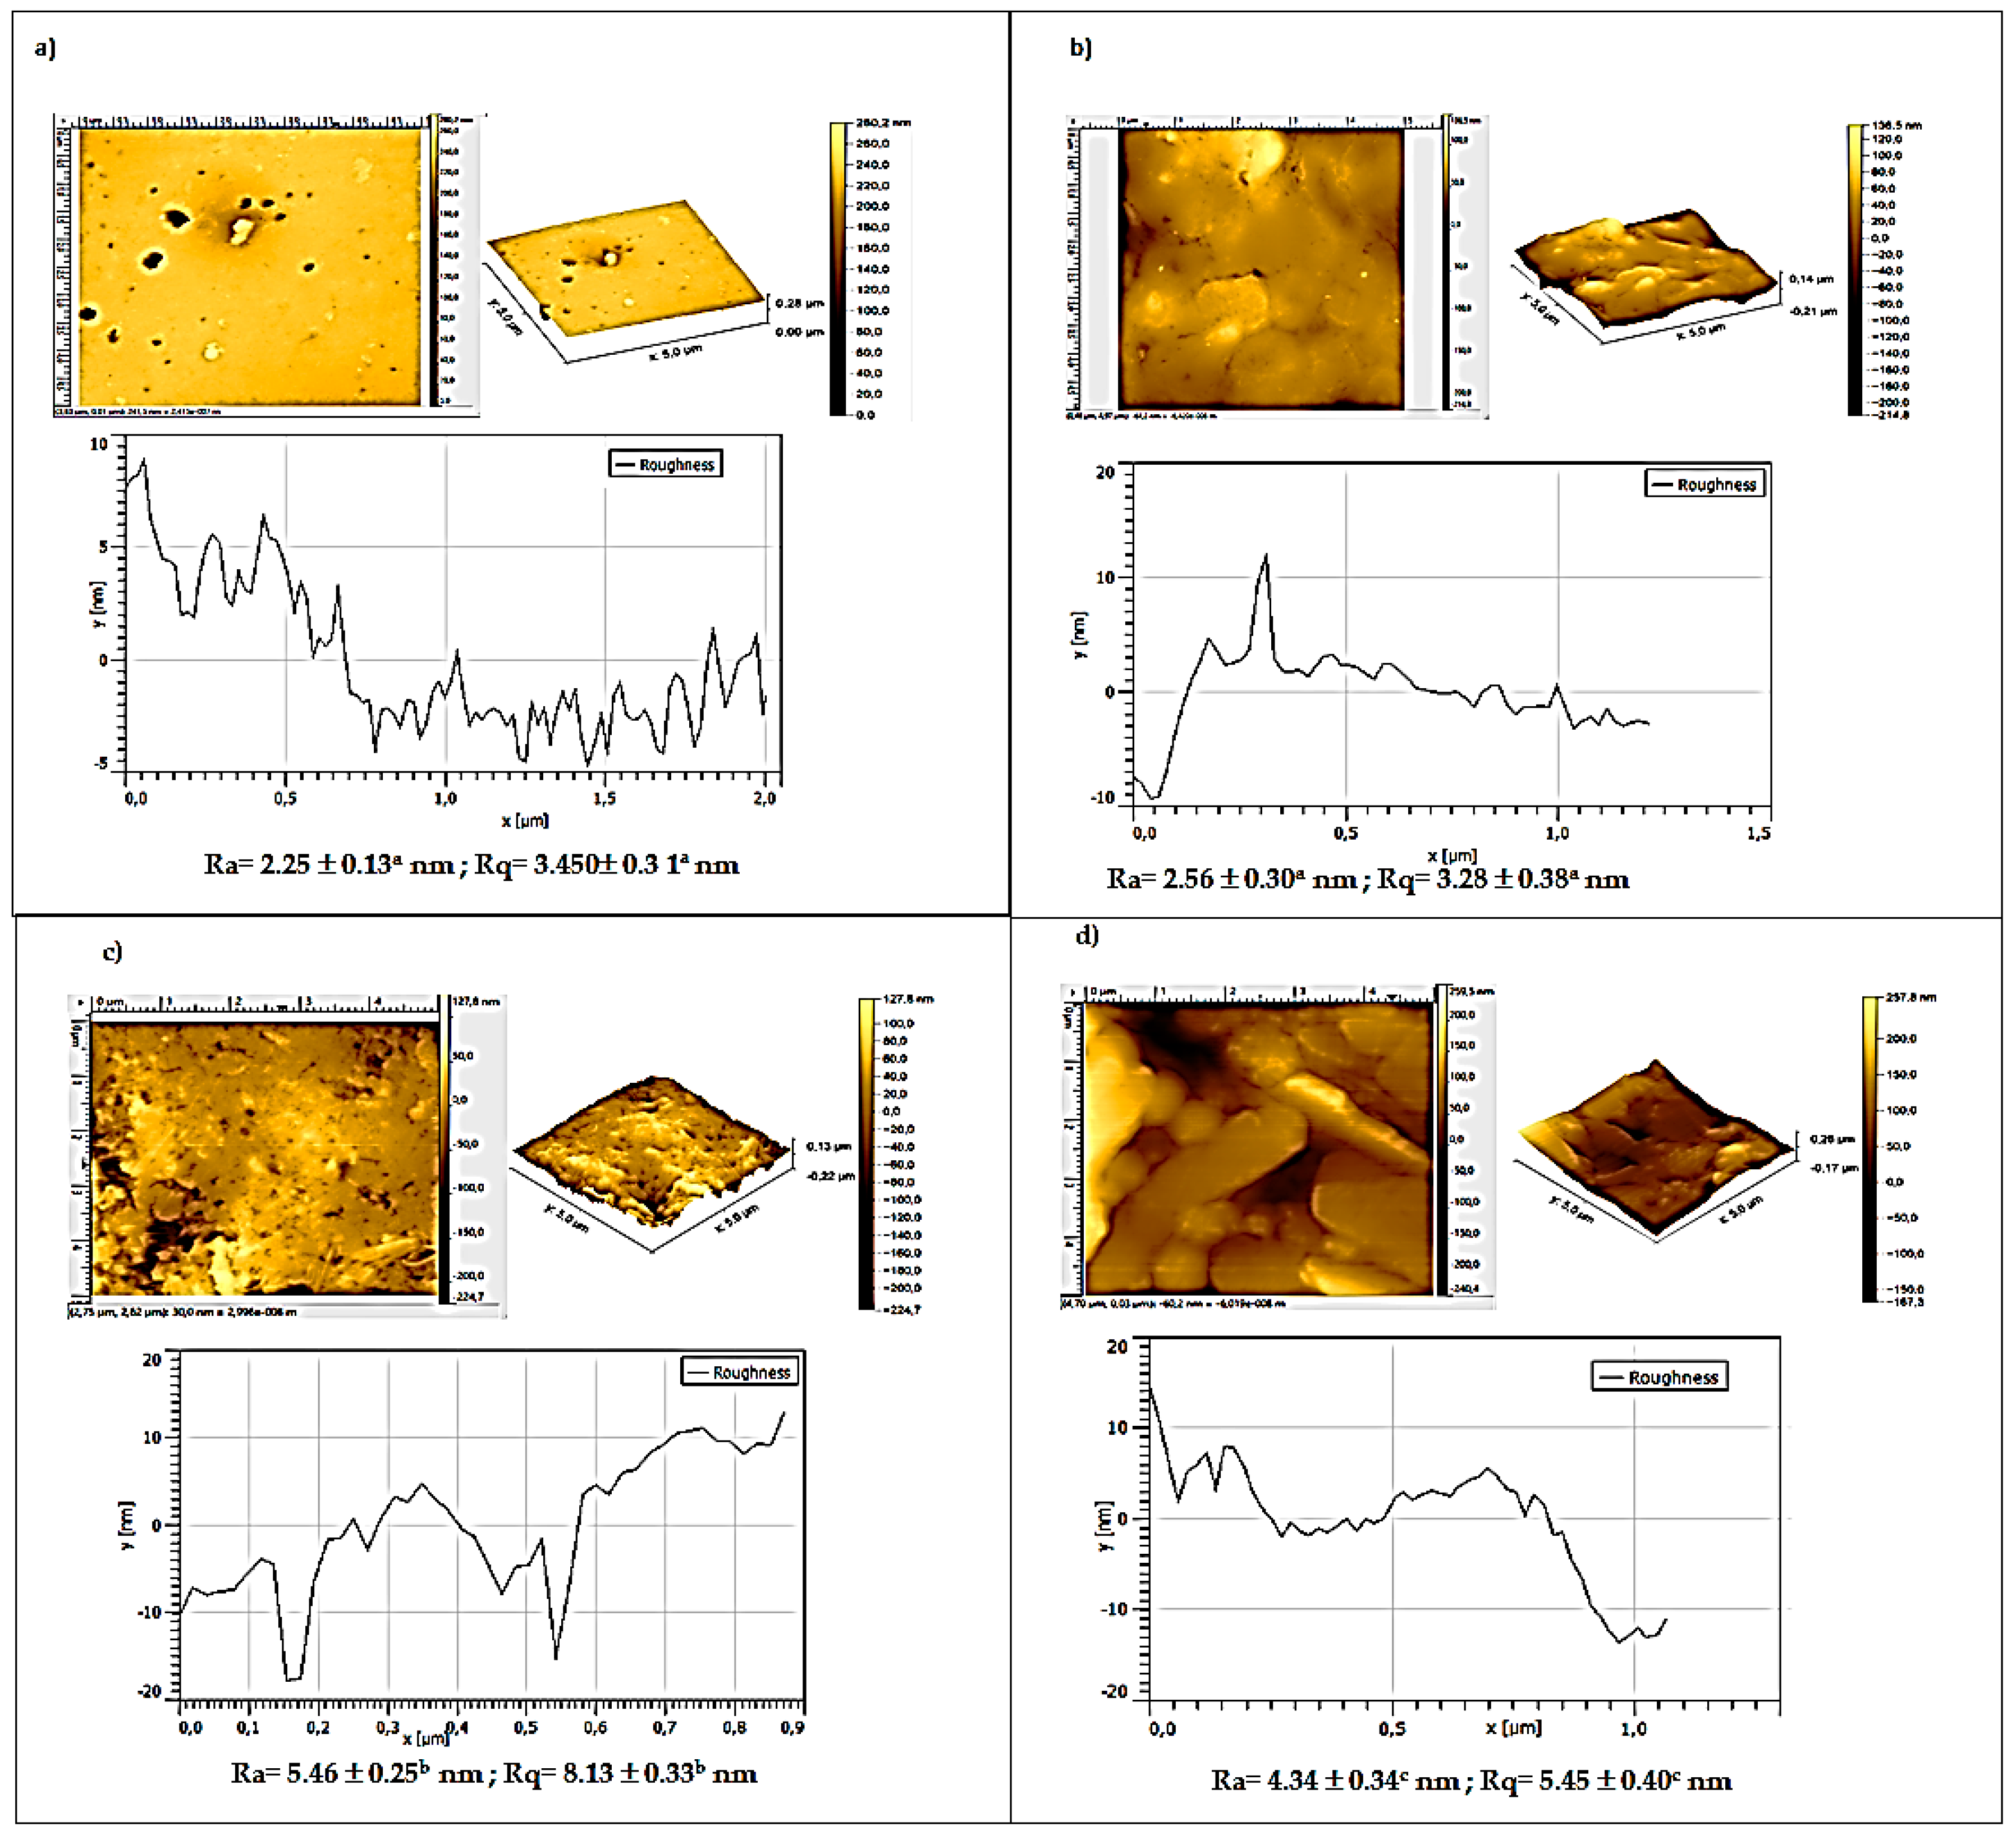
3.5. Atomic Force Microscopy

CT-quinoa protein films showing low solubility and WVP close to the lowest values were chosen for AFM tests, due to their potential applications as edible films for fresh food products.
From the micrographs that are shown in Figure 3 and Figure 4, it can be concluded that QP and QW films exhibit smooth surfaces because the temperature and pH conditions that are used for their assembly do not promote protein aggregation, which results in homogeneous matrices [10,37]. As already mentioned, TG addition to chitosan films produces a smoother surface, which is consistent with a report showing that the roughness of phaseolin films decreased when TG was added, because cross-linking allowed for the reduction of intramolecular spaces [38]. QP and QW films incorporating CT resulted in greater surface roughness due to the alkaline conditions used for their production, where CT tends to form aggregates. Inter- and intramolecular hydrogen bonding can be formed within the CT molecule instead of forming effective interactions with OH groups, which could generate rougher surfaces [31].
Thus, AFM micrographs of films that were made from QW, CT:QW (1:10, w/w) (Figure 3), and QP, CT:QP (1:10, w/w) (Figure 4) were carried out. QW film roughness (Figure 3a) did not exhibit significant differences when TG was added (Figure 3b), but the addition of CT revealed increased roughness (Figure 3c), which slightly decreased after cross-linking (Figure 3d). Films made from QP showed higher roughness than those made from QW; additionally, the cross-linking of QP films did not produce a significant effect on roughness (Figure 4a,b). CT-QP (1:10, w/w) film showed significantly (p < 0.05) higher roughness than QP film alone (Figure 3c), which significantly decreased (p < 0.05) with cross-linking (Figure 4d).

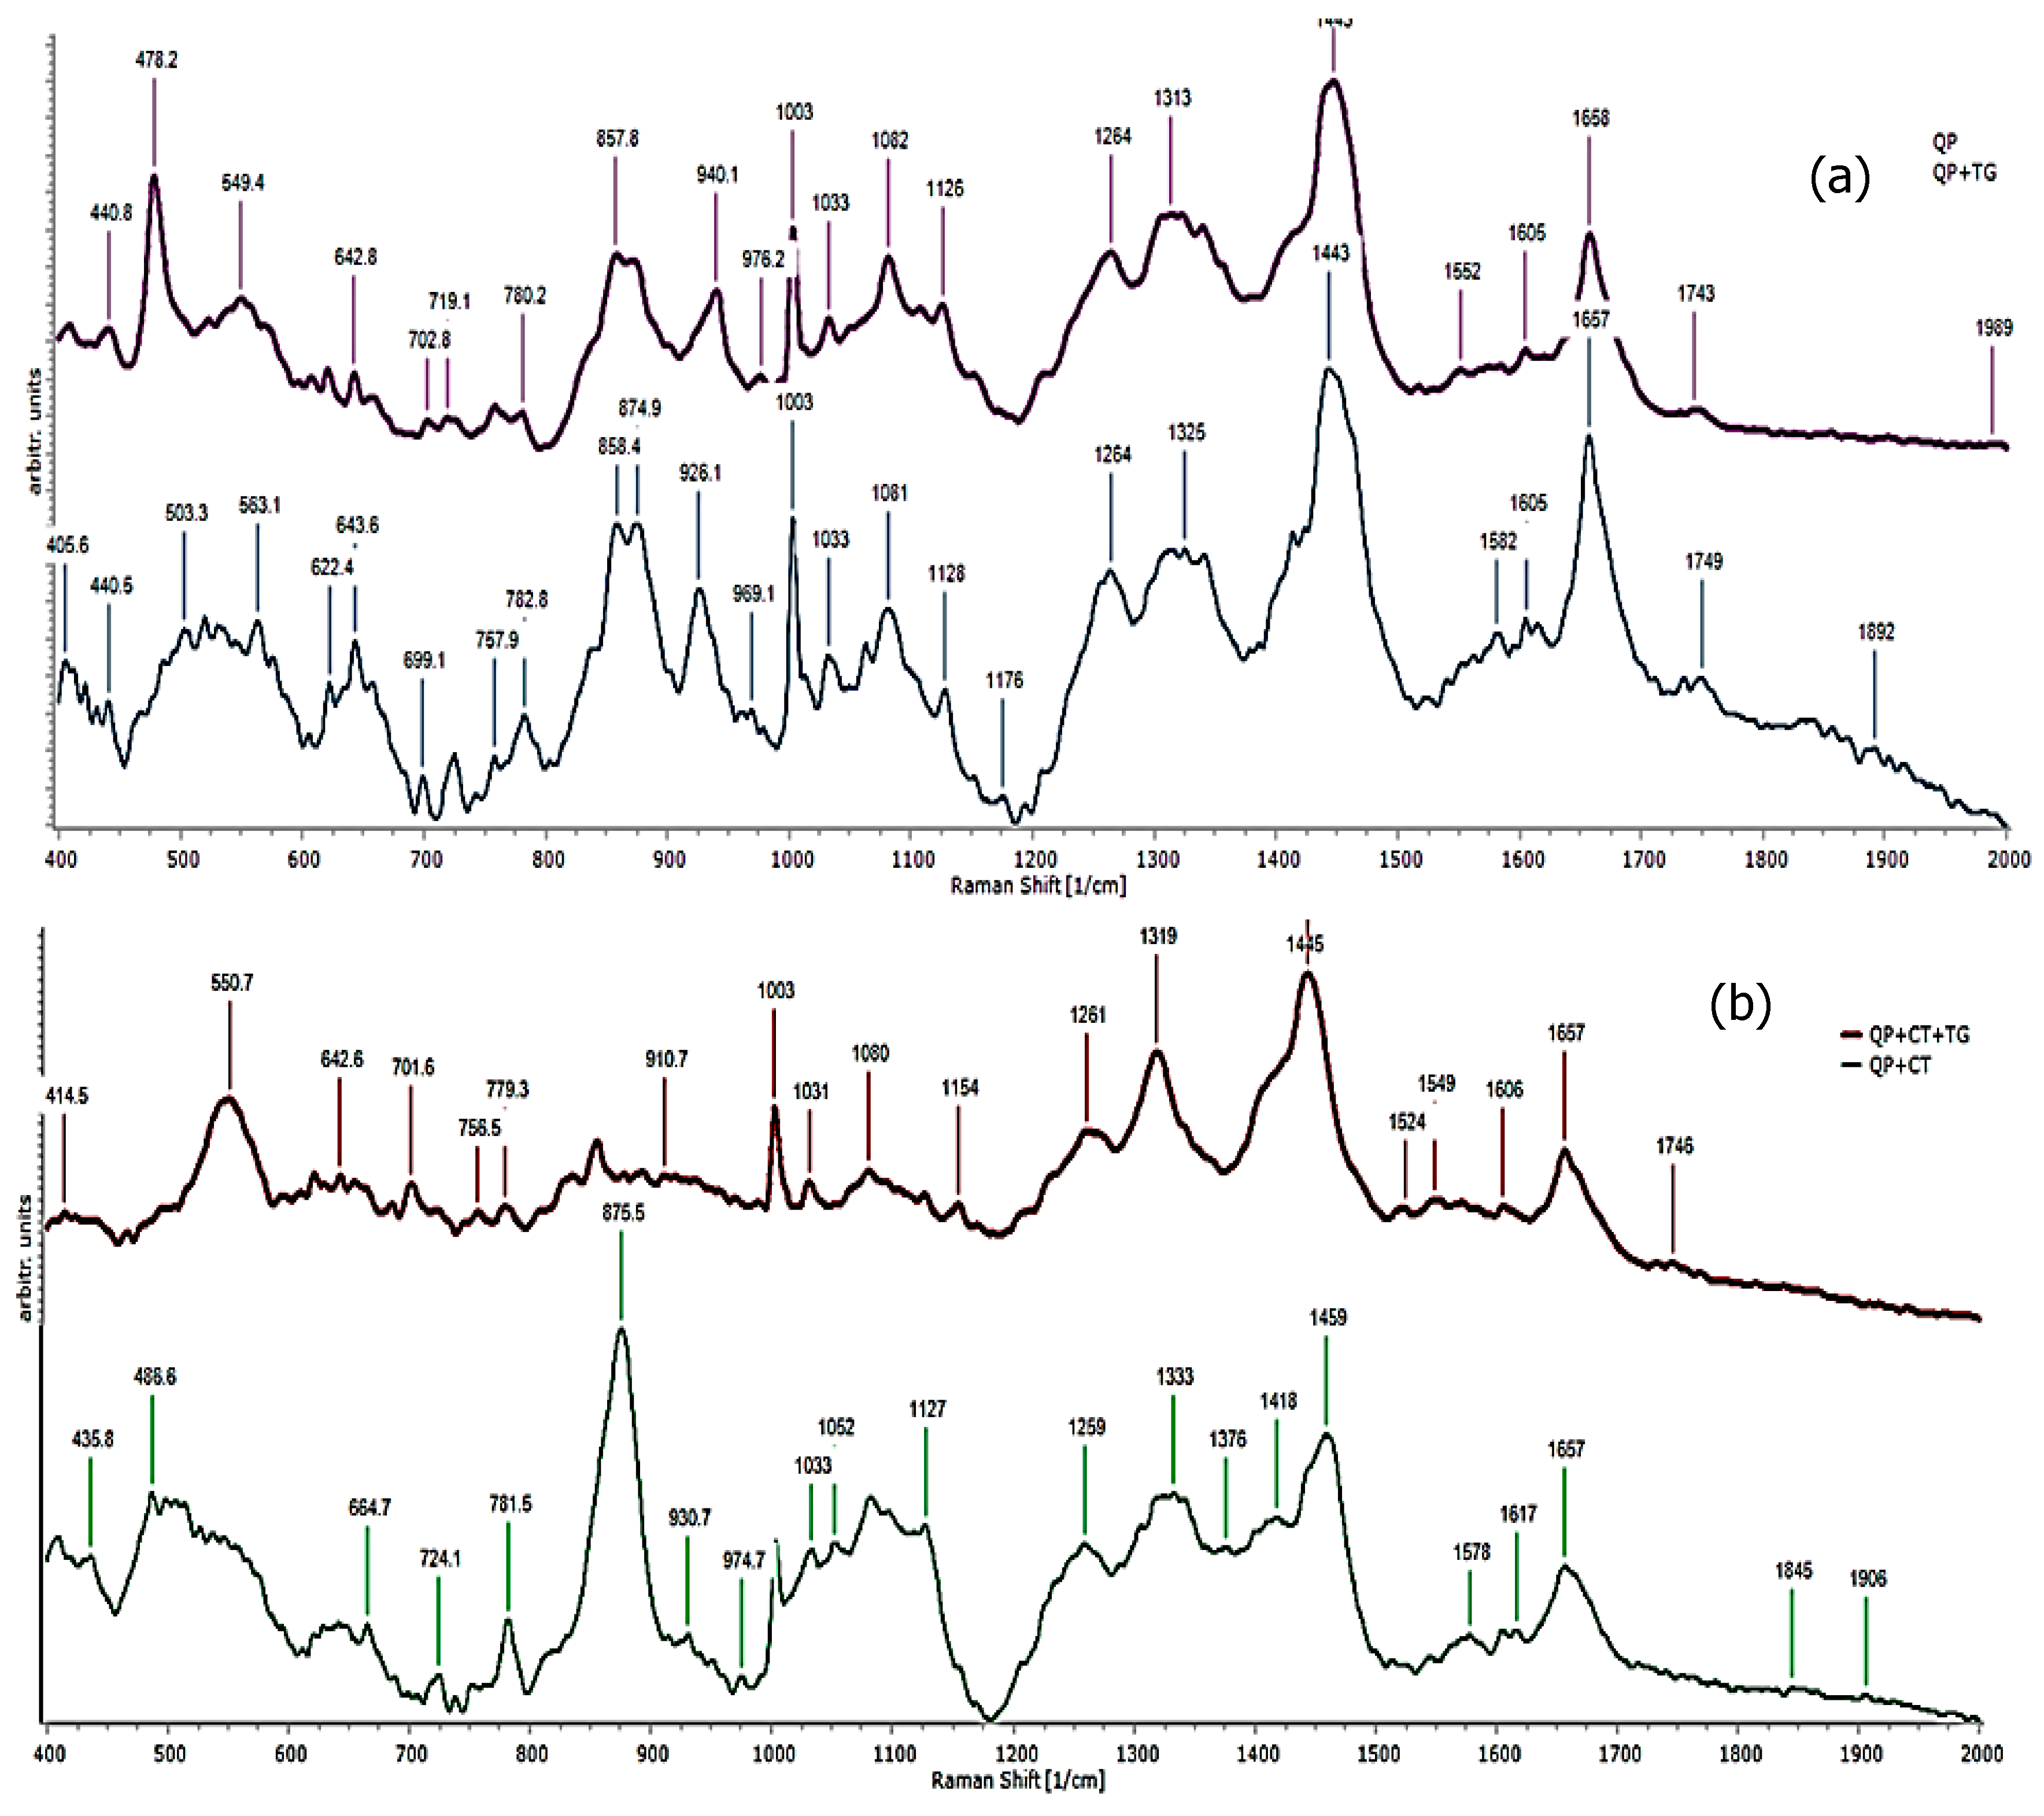
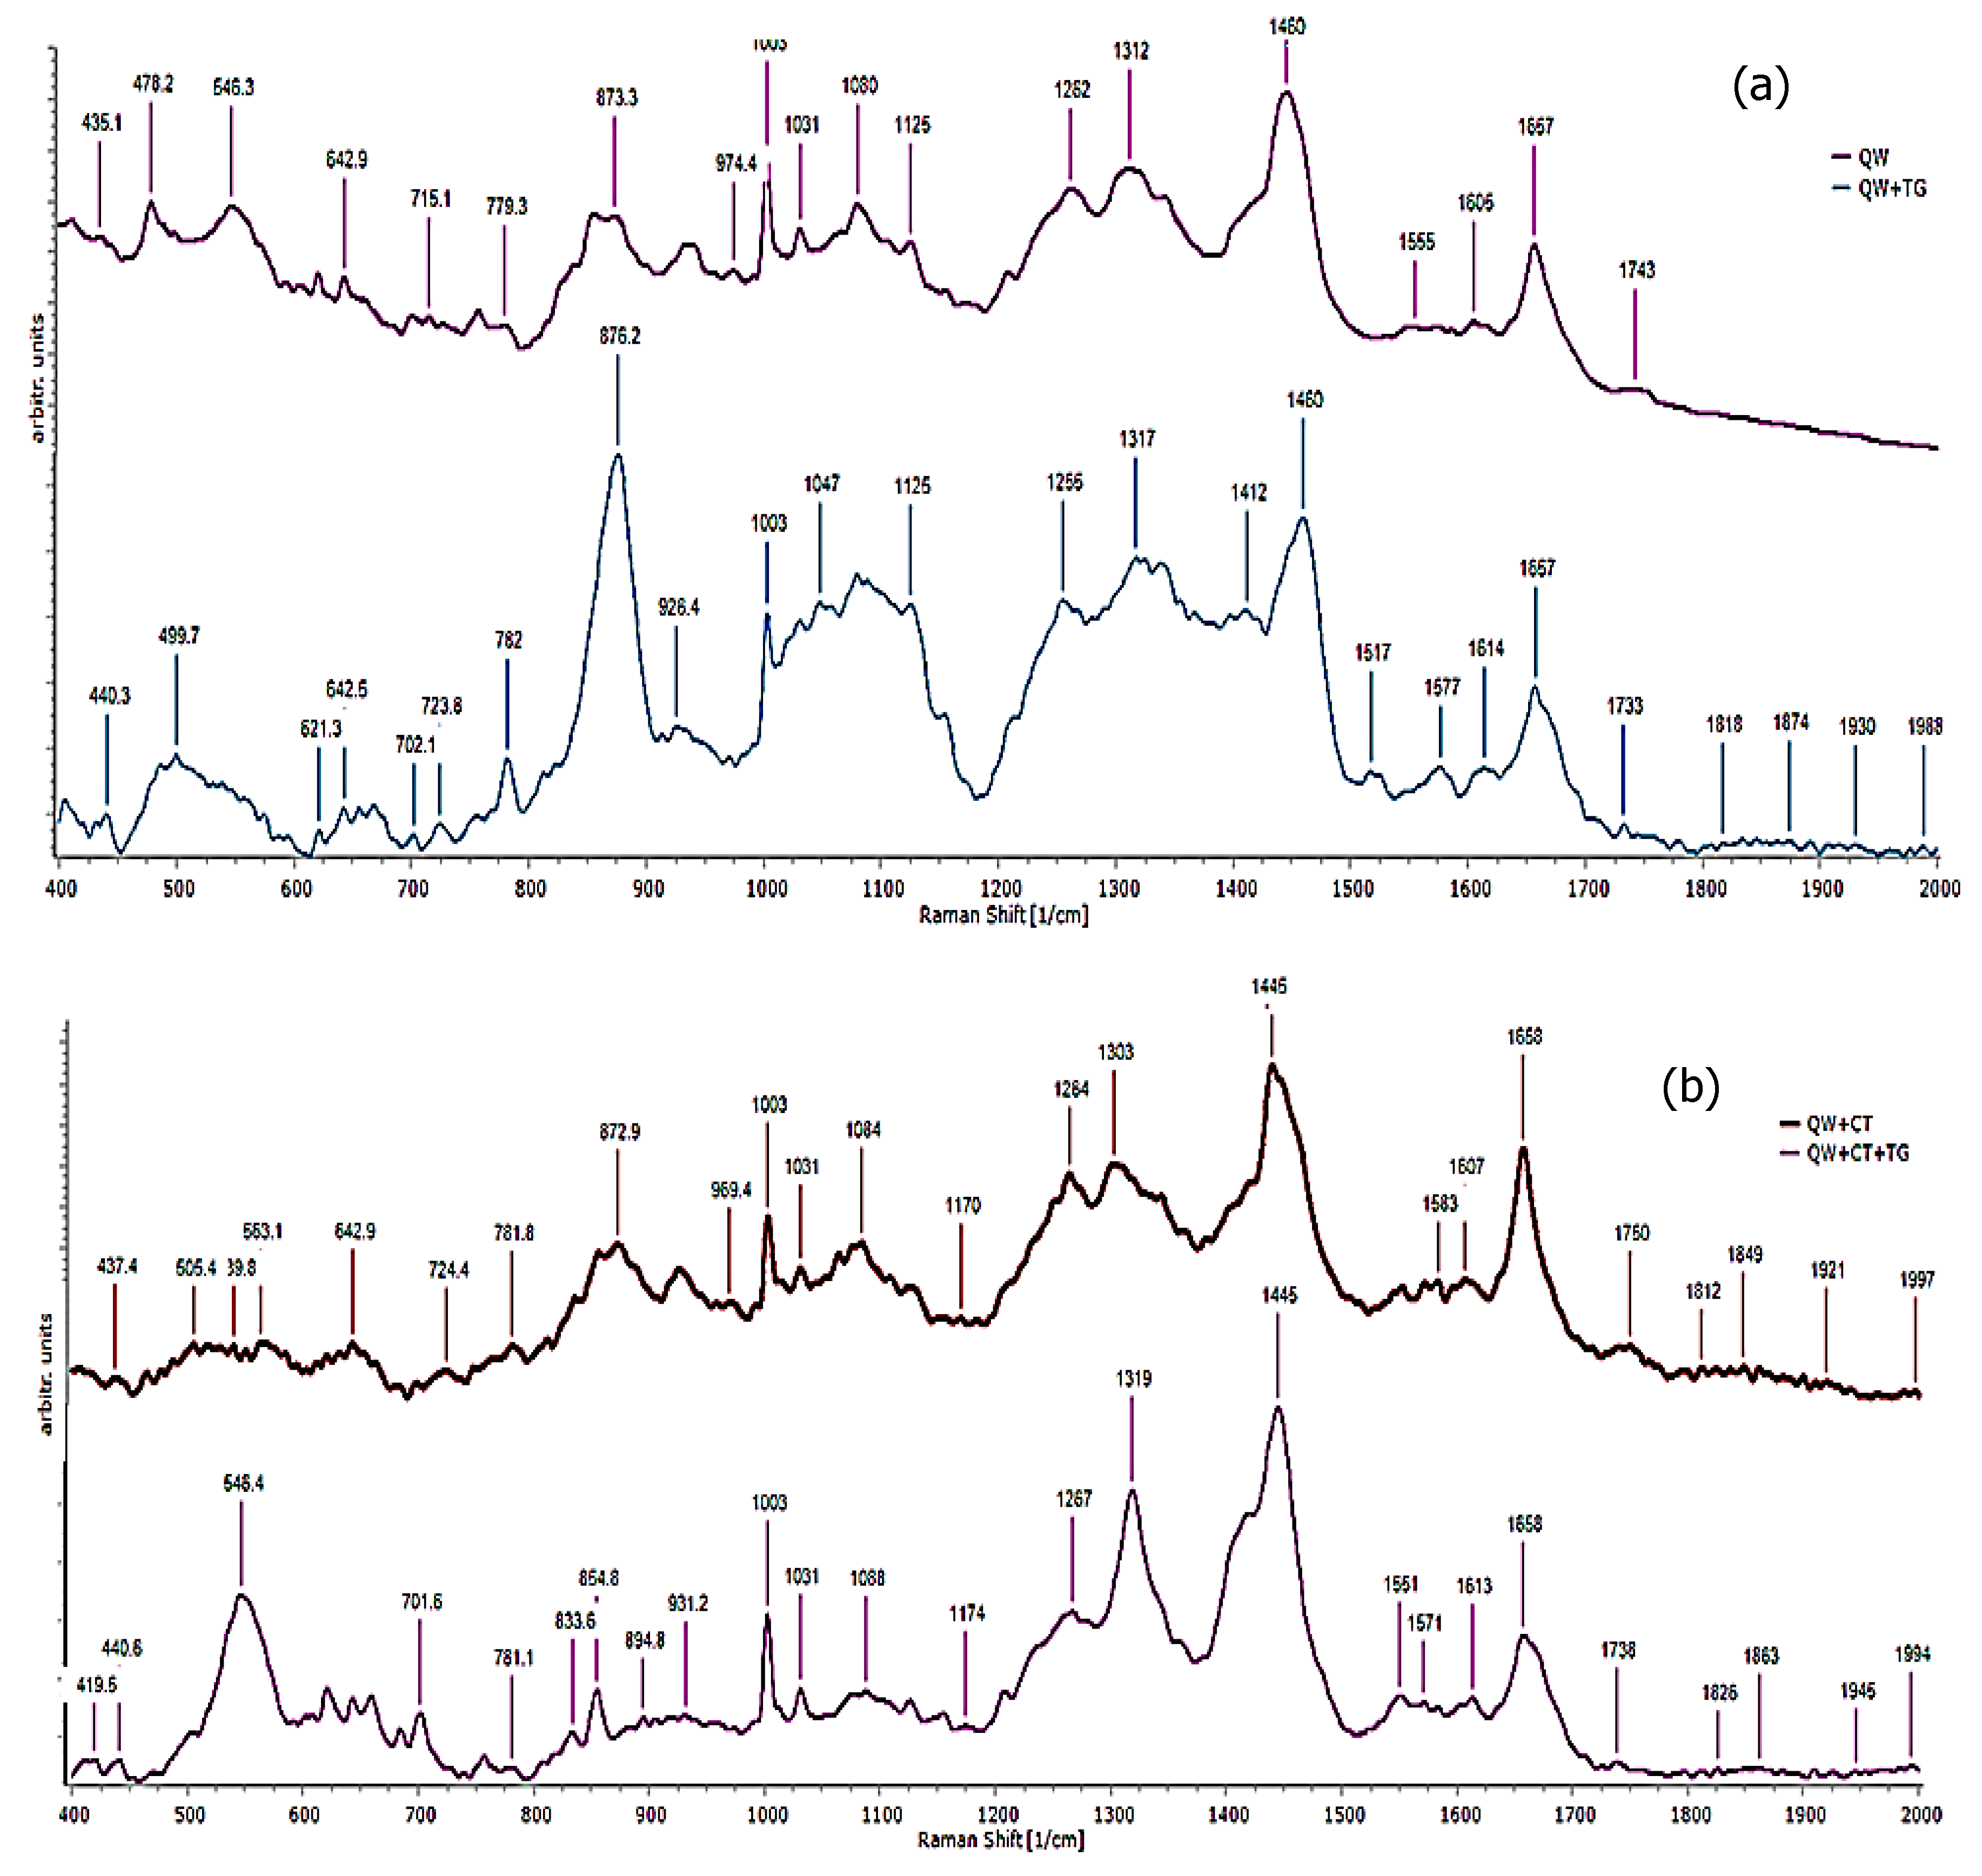
3.6. Raman Spectroscopy

Raman spectroscopy was only applied to the films showing the highest potential for application in food products: QP, QW, CT:QW (1:10, w/w), and CT:QP (1:10, w/w). The spectrogram of Figure 5 shows QP and CT:QP (1:10, w/w) films. When TG was added, some signals were intensified (Figure 5a) at wavenumbers of 503.3 (C–C=O), 699.1 (γOH), and 757.9 cm−1, while another one appeared at 874.9 cm−1 (glutamic acid: C–C), which suggests interactions between the protein and crosslinker. Cross-linking is more evident in the presence of chitosan (Figure 5b), where a new peak is formed at 550.7 (C–C=O) cm−1, but other peaks that are characteristic of glutamic acid disappear, such as those at 875.5 (C–C), 974.7 (C–C–N), and 724.1 (OCO) cm1.
From Figure 5a,b, it is evident that the presence of CT results in the suppression of three peaks at 857.8 (lysine: C, γ twisting), 940.1 (C–C), and 478.2 cm−1 (C–C–C), which suggests interactions between protein and chitosan. Similarly, by comparing the spectra of Figure 5a,b, CT shifts the signal at about 858 cm−1 to 875.5 cm−1 (lysine: C γ twisting), but, in the presence of TG, the peak is inhibited. Figure 6 shows QW and CT:QW (1:10, w/w) with and without TG. Signal strength was increased by adding TG to QW (Figure 6a) at 782 cm−1, while the peak at 1312 was shifted to 1317 cm−1, a weak signal appeared at 1614 cm−1, and peak suppression was observed at 546 cm−1. CT:QW (1:10, w/w) spectra with and without TG are shown in Figure 6b. Cross-linking generated two peaks, one at 646.4 cm−1 and another at 701.6 cm−1, while enhancing the signal at 1319 cm−1.
From the spectra of Figure 5a, the presence of TG caused the suppression of two peaks, at 478.2 cm−1 (C–C–C) and 549.4 cm−1 (C–C=O). However, films containing CT (Figure 6b) TG addition led to two new signals, one at 546.4 cm−1 (C–C=O) that is probably a shift of the previous signal, and another at 854.8 cm−1 (Lysine: Cγ twistting). The suppression of peaks at 974.4, 873.3, and 940 cm−1 in the QW spectra (Figure 6a) indicates possible interactions between TG and protein, and these signals are characteristic of lysine [39], so cross-linking with TG is carried out while using the amino groups of lysine and glutamic acid [40].

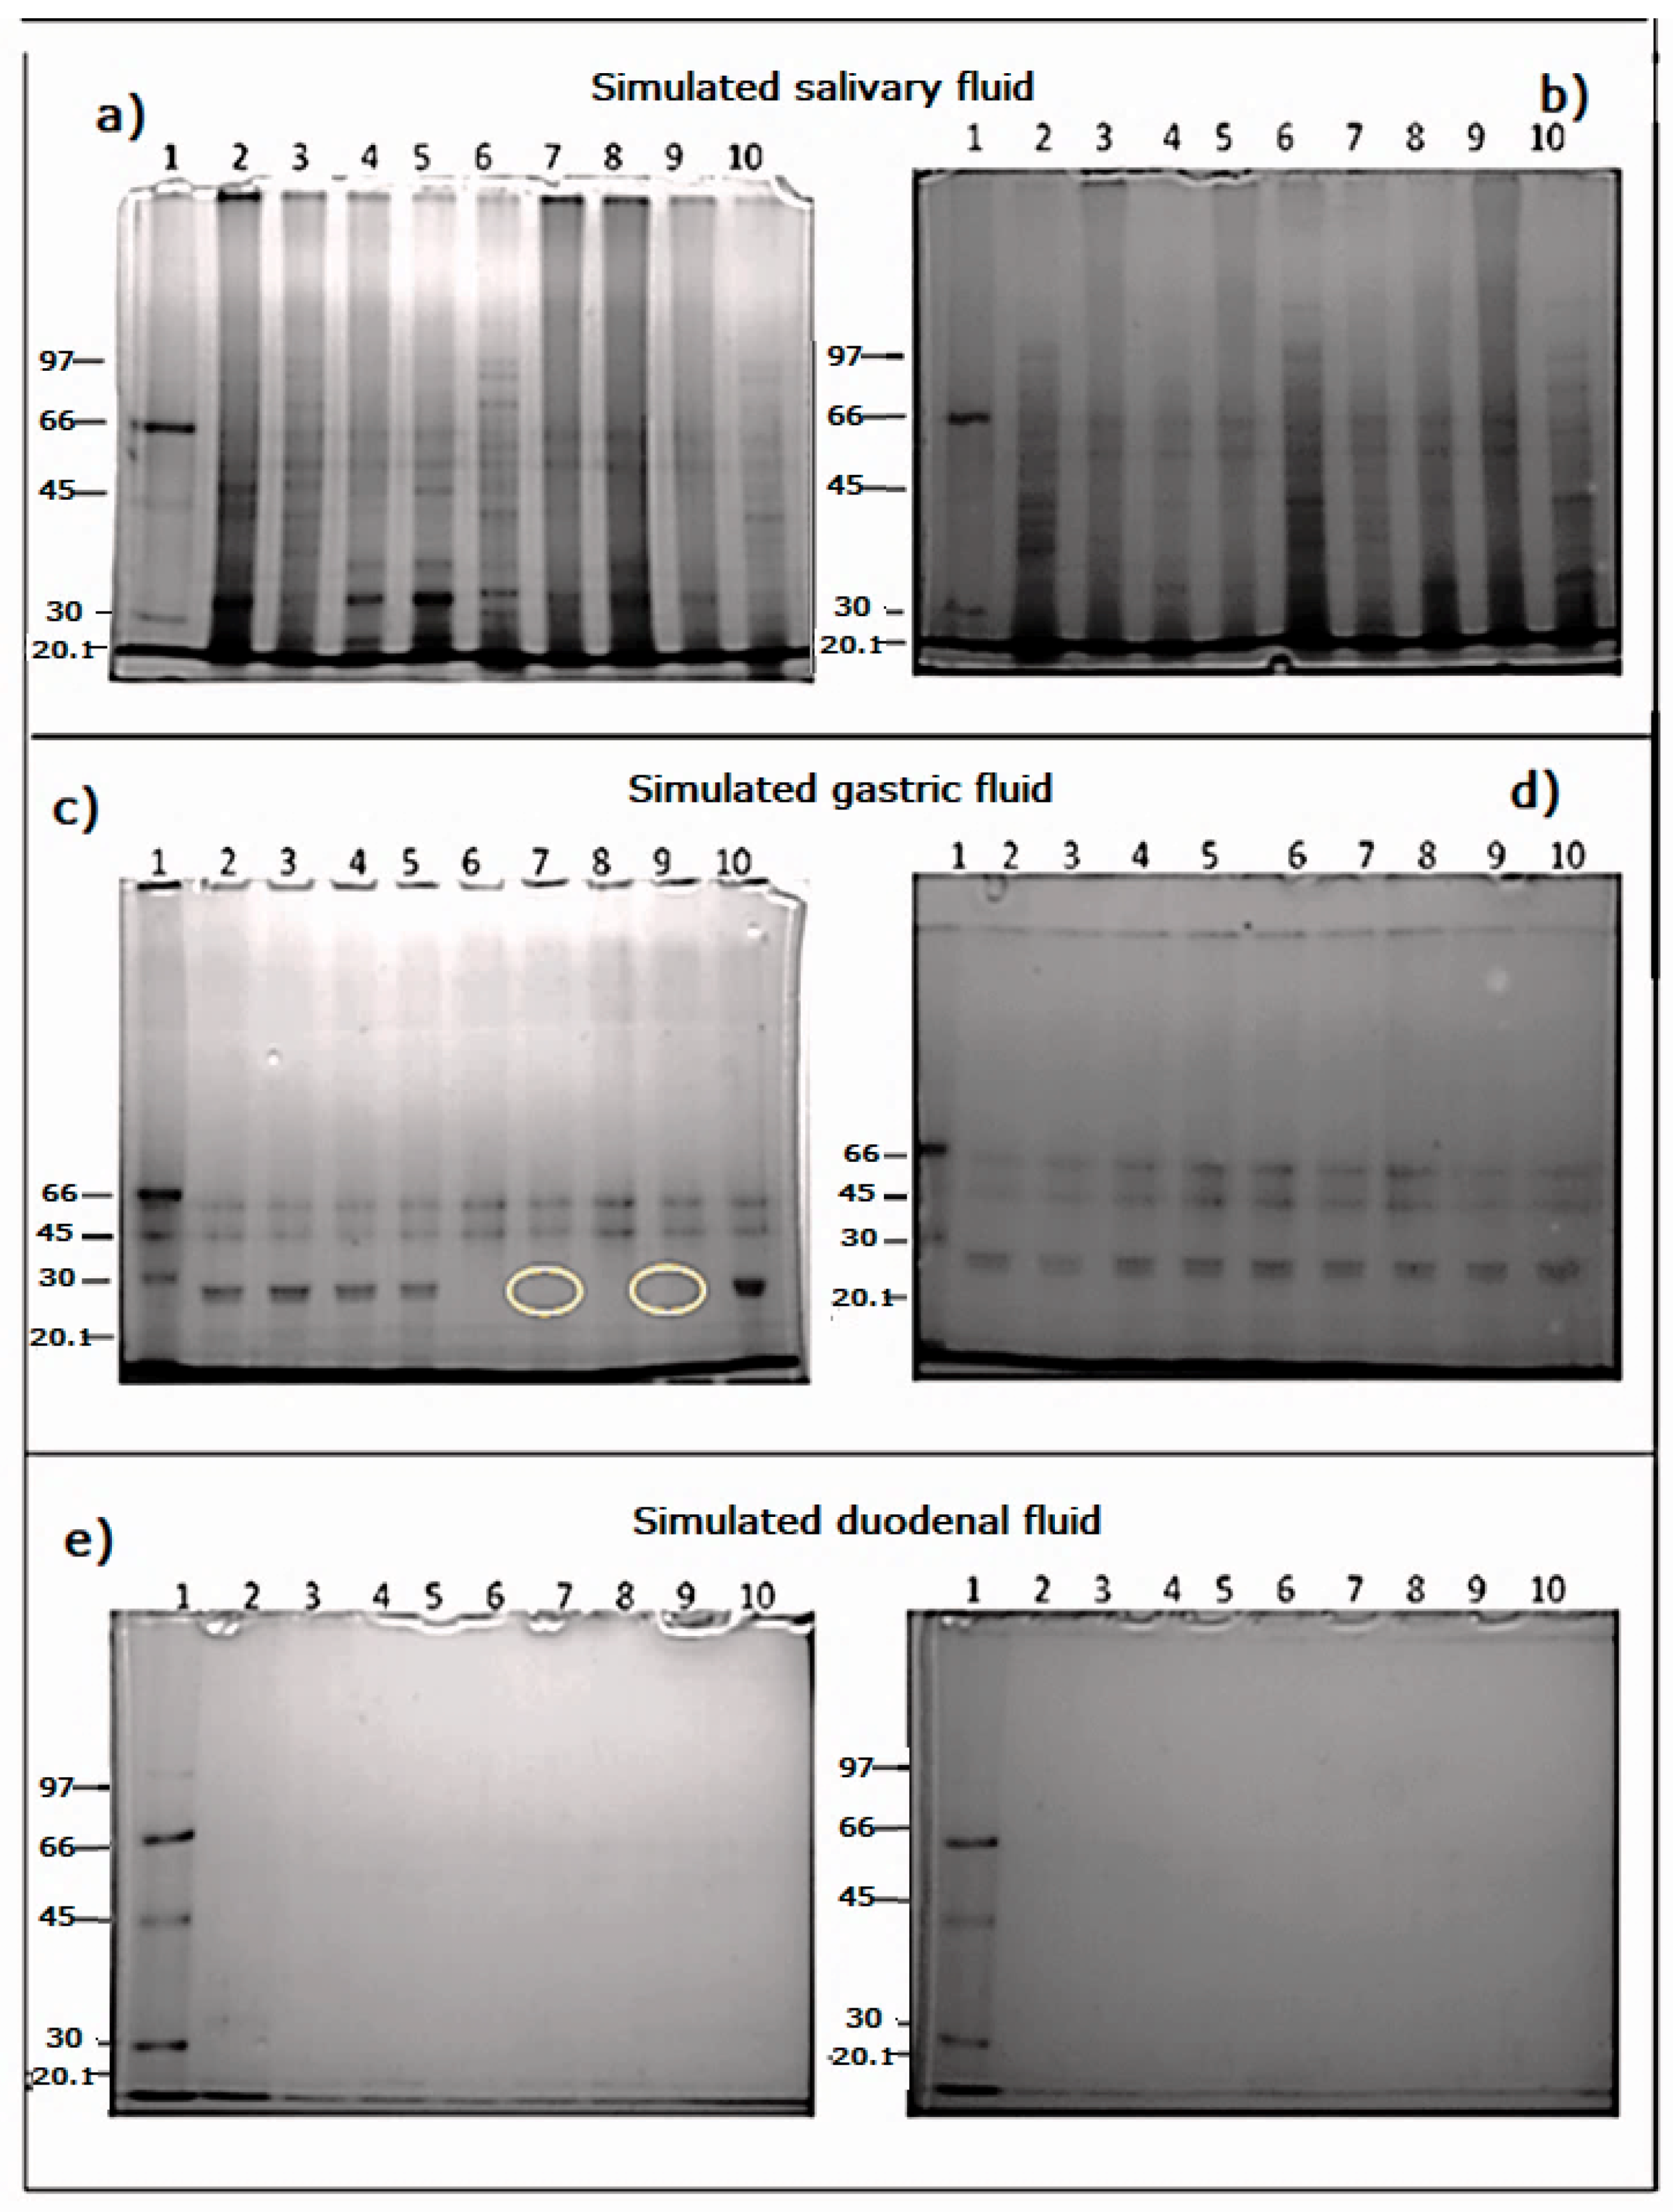
3.7. Simulated Gastric and Duodenal Digestion

The hydrolysis of QP and QW using simulated salivary fluid is shown in Figure 7a,b, respectively. Molecular fractions less than 97 kDa from both quinoa protein varieties can be observed after gastric hydrolysis (Figure 7c,d), where the number of bands decreased. QW could not be hydrolyzed by pepsin, since the same bands appeared at all QW-CT ratios, which indicated that the pepsin-preferred hydrophobic and aromatic amino acid residues were partially or totally hidden from proteolytic cleavage.
After gastric hydrolysis, bands showing molecular weights of >66 kDa essentially disappeared, especially from the QP-CT films and, at the same time, the bands between 20.1 and 30 kDa were intensified, which indicated that pepsin hydrolyzed large protein molecules into smaller peptides [37].
Finally, duodenal simulated digestion with trypsin and chymotrypsin led to full protein hydrolysis (Figure 7e,f). These results indicate that, depending on the quinoa protein variety used to produce the films, partial or insignificant gastric hydrolysis was completed upon duodenal digestion. Some authors reported that, at high pH (>8), protein denaturation is high, which results in disulfide bond breakage, leading to tertiary structure disruption. Additionally, the temperature (90 °C) and pH (11), used for film production probably left exposed amino acids sensitive to duodenal enzymatic hydrolysis [41,42].
There are several studies on edible films that are based on protein cross-linked with TG to improve the mechanical and barrier properties. However, in some cases, crosslinking has promoted higher resistance to protein digestion [38,40]. The film that is produced in this work is intended for direct consumption with the food, and therefore it is important to evaluate film digestibility. Films presenting the best mechanical and barrier were evaluated, and those crosslinked with TG did not affect protein digestibility.

4. Conclusions

The quinoa protein varieties used to produce edible films showed significant effects on physical properties, such as solubility, water vapor permeability, roughness, and water sorption. Cross-linking with TG allowed for the enhancement of edible film properties; nevertheless, interactions among protein and TG depended on the quinoa protein variety in combination with its protein profile. CT added to QW films promoted interactions between protein and chitosan that were enhanced by the presence of TG, leading to improved physical properties. According to the sorption isotherm, CT-QP films combined with TG may be considered highly stable. Films exhibiting higher amount of cross-linking showed the highest improvement in the evaluated physical properties. TG and protein of both quinoa protein varieties primarily interacted through the amino acid lysine.

Author Contributions

Resources and funding acquisition, C.R.-G.; writing—original draft preparation, M.E.-G.; investigation, L.F.D.-S.; visualization, R.A.R.-R. and G.C.-D.; methodology B.E.G.-A. and P.D.P.; writing—review and editing A.A.-R.; validation, J.V.M.-M.

Funding

This research was funded by “UAQ, grant number FOPER-2019-00633” and “MAECI, grant number CUP:E68D18000130001”.

Acknowledgments

The authors thank the “Centro de Nanociencias y Micro y Nanotecnologías” of IPN (CNMN) for providing the facilities for this research work and for technical assistance.

Conflicts of Interest

The authors declare no conflict of interest.

References

  1. Costa, M.J.; Maciel, L.C.; Teixeira, J.A.; Vicente, A.A.; Cerqueira, M.A. Use of edible films and coatings in cheese preservation: Opportunities and challenges. Food Res. Int. 2018, 107, 84–92. [Google Scholar] [CrossRef] [PubMed] [Green Version]
  2. Dehghani, S.; Hosseini, S.V.; Regenstein, J.M. Edible films and coatings in seafood preservation: A review. Food Chem. 2018, 240, 505–513. [Google Scholar] [CrossRef] [PubMed]
  3. Chiralt, A.; González-Martínez, C.; Vargas, M.; Atarés, L. 18-Edible films and coatings from proteins. In Proteins in Food Processing, 2nd ed.; Yada, R.Y., Ed.; Woodhead Publishing Series in Food Science, Technology and Nutrition; Woodhead Publishing: Cambridge, MA, USA, 2018; pp. 477–500. ISBN 978-0-08-100722-8. [Google Scholar]
  4. Elsohaimy, S.A.; Refaay, T.M.; Zaytoun, M.A.M. Physicochemical and functional properties of quinoa protein isolate. Ann. Agric. Sci. 2015, 60, 297–305. [Google Scholar] [CrossRef] [Green Version]
  5. Dakhili, S.; Abdolalizadeh, L.; Hosseini, S.M.; Shojaee-Aliabadi, S.; Mirmoghtadaie, L. Quinoa protein: Composition, structure and functional properties. Food Chem. (In press). [CrossRef]
  6. Caro, N.; Medina, E.; Díaz-Dosque, M.; López, L.; Abugoch, L.; Tapia, C. Novel active packaging based on films of chitosan and chitosan/quinoa protein printed with chitosan-tripolyphosphate-thymol nanoparticles via thermal ink-jet printing. Food Hydrocoll. 2016, 52, 520–532. [Google Scholar] [CrossRef]
  7. Medina, E.; Caro, N.; Abugoch, L.; Gamboa, A.; Díaz-Dosque, M.; Tapia, C. Chitosan thymol nanoparticles improve the antimicrobial effect and the water vapour barrier of chitosan-quinoa protein films. J. Food Eng. 2019, 240, 191–198. [Google Scholar] [CrossRef]
  8. Shariatinia, Z. Pharmaceutical applications of chitosan. Adv. Colloid Interface Sci. 2019, 263, 131–194. [Google Scholar] [CrossRef]
  9. Fernandez-Bats, I.; Di Pierro, P.; Villalonga-Santana, R.; Garcia-Almendarez, B.; Porta, R. Bioactive mesoporous silica nanocomposite films obtained from native and transglutaminase-crosslinked bitter vetch proteins. Food Hydrocoll. 2018, 82, 106–115. [Google Scholar] [CrossRef]
  10. Azeredo, H.M.C.; Waldron, K.W. Crosslinking in polysaccharide and protein films and coatings for food contact—A review. Trends Food Sci. Technol. 2016, 52, 109–122. [Google Scholar] [CrossRef]
  11. Romeih, E.; Walker, G. Recent advances on microbial transglutaminase and dairy application. Trends Food Sci. Technol. 2017, 62, 133–140. [Google Scholar] [CrossRef]
  12. Ruiz, G.A.; Xiao, W.; van Boekel, M.; Minor, M.; Stieger, M. Effect of extraction pH on heat-induced aggregation, gelation and microstructure of protein isolate from quinoa (Chenopodium quinoa Willd). Food Chem. 2016, 209, 203–210. [Google Scholar] [CrossRef] [PubMed]
  13. AACC. International Approved Methods—AACC Method 46-10.01. Crude Protein—Improved Kjeldahl Method. Available online: http://methods.aaccnet.org/summaries/46-10-01.aspx (accessed on 19 April 2018).
  14. Brunelle, J.L.; Green, R. Chapter Twelve—One-dimensional SDS-Polyacrylamide Gel Electrophoresis (1D SDS-PAGE). In Methods in Enzymology; Lorsch, J., Ed.; Academic Press: Cambridge, MA, USA, 2014; Volume 541, pp. 151–159. ISBN 0076-6879. [Google Scholar]
  15. Sharma, L.; Singh, C. Sesame protein based edible films: Development and characterization. Food Hydrocoll. 2016, 61, 139–147. [Google Scholar] [CrossRef]
  16. Escamilla-García, M.; Calderón-Domínguez, G.; Chanona-Pérez, J.J.; Mendoza-Madrigal, A.G.; Di Pierro, P.; García-Almendárez, B.E.; Amaro-Reyes, A.; Regalado-González, C. Physical, structural, barrier, and antifungal characterization of chitosan–zein edible films with added essential oils. Int. J. Mol. Sci. 2017, 18, 2370. [Google Scholar] [CrossRef] [PubMed]
  17. AL-Hassan, A.A.; Norziah, M.H. Effect of transglutaminase induced crosslinking on the properties of starch/gelatin films. Food Packag. Shelf Life 2017, 13, 15–19. [Google Scholar] [CrossRef]
  18. Prasertsung, I.; Mongkolnavin, R.; Kanokpanont, S.; Damrongsakkul, S. The effects of pulsed inductively coupled plasma (PICP) on physical properties and biocompatibility of crosslinked gelatin films. Int. J. Biol. Macromol. 2010, 46, 72–78. [Google Scholar] [CrossRef]
  19. Soo, P.Y.; Sarbon, N.M. Preparation and characterization of edible chicken skin gelatin film incorporated with rice flour. Food Packag. Shelf Life 2018, 15, 1–8. [Google Scholar] [CrossRef]
  20. Giosafatto, C.V.L.; Di Pierro, P.; Gunning, P.; Mackie, A.; Porta, R.; Mariniello, L. Characterization of Citrus pectin edible films containing transglutaminase-modified phaseolin. Carbohydr. Polym. 2014, 106, 200–208. [Google Scholar] [CrossRef]
  21. Abugoch, L.E.; Tapia, C.; Villamán, M.C.; Yazdani-Pedram, M.; Díaz-Dosque, M. Characterization of quinoa protein–chitosan blend edible films. Food Hydrocoll. 2011, 25, 879–886. [Google Scholar] [CrossRef]
  22. Kaspchak, E.; de Oliveira, M.A.S.; Simas, F.F.; Franco, C.R.C.; Silveira, J.L.M.; Mafra, M.R.; Igarashi-Mafra, L. Determination of heat-set gelation capacity of a quinoa protein isolate (Chenopodium quinoa) by dynamic oscillatory rheological analysis. Food Chem. 2017, 232, 263–271. [Google Scholar] [CrossRef]
  23. Castellión, M.; Matiacevich, S.; Buera, P.; Maldonado, S. Protein deterioration and longevity of quinoa seeds during long-term storage. Food Chem. 2010, 121, 952–958. [Google Scholar] [CrossRef]
  24. Steffolani, M.E.; Villacorta, P.; Morales-Soriano, E.R.; Repo-Carrasco, R.; León, A.E.; Pérez, G.T. Physicochemical and functional characterization of protein isolated from different quinoa varieties (Chenopodium quinoa Willd). Cereal Chem. 2016, 93, 275–281. [Google Scholar] [CrossRef]
  25. Alonso-Miravalles, L.; O’Mahony, J.A. Composition, protein profile and rheological properties of pseudocereal-based protein-rich ingredients. Foods 2018, 7, 73. [Google Scholar] [CrossRef] [PubMed]
  26. Burrieza, H.P.; Rizzo, A.J.; Moura Vale, E.; Silveira, V.; Maldonado, S. Shotgun proteomic analysis of quinoa seeds reveals novel lysine-rich seed storage globulins. Food Chem. 2019, 293, 299–306. [Google Scholar] [CrossRef] [PubMed]
  27. Cao, H.; Jiao, X.; Fan, D.; Huang, J.; Zhao, J.; Yan, B.; Zhou, W.; Zhang, W.; Ye, W.; Zhang, H. Catalytic effect of transglutaminase mediated by myofibrillar protein crosslinking under microwave irradiation. Food Chem. 2019, 284, 45–52. [Google Scholar] [CrossRef]
  28. Basman, A.; Köksel, H.; Ng, P.K. Effects of increasing levels of transglutaminase on the rheological properties and bread quality characteristics of two wheat flours. Eur. Food Res. Tech. 2002, 215, 419–424. [Google Scholar] [CrossRef]
  29. Pereira, E.; Encina-Zelada, C.; Barros, L.; Gonzales-Barron, U.; Cadavez, V.; Ferreira, I.C.F.R. Chemical and nutritional characterization of Chenopodium quinoa Willd (quinoa) grains: A good alternative to nutritious food. Food Chem. 2019, 280, 110–114. [Google Scholar] [CrossRef]
  30. Cheng, S.; Wang, W.; Li, Y.; Gao, G.; Zhang, K.; Zhou, J.; Wu, Z. Cross-linking and film-forming properties of transglutaminase-modified collagen fibers tailored by denaturation temperature. Food Chem. 2019, 271, 527–535. [Google Scholar] [CrossRef]
  31. Tan, W.; Dong, F.; Zhang, J.; Zhao, X.; Li, Q.; Guo, Z. Physical and antioxidant properties of edible chitosan ascorbate films. J. Agric. Food Chem. 2019, 67, 2530–2539. [Google Scholar] [CrossRef]
  32. Nie, J.; Wang, Z.; Hu, Q. Difference between chitosan hydrogels via alkaline and acidic solvent systems. Sci. Rep. 2016, 6, 36053. [Google Scholar] [CrossRef]
  33. Sk, B.; Awasthi, S.; Utiye, A.S.; Mishra, B. Investigation of moisture sorption properties of gelatin/poly (aniline)/films. SOJ Mater. Sci. Eng. 2017, 5, 1–6. [Google Scholar]
  34. Aguirre-Loredo, R.Y.; Rodríguez-Hernández, A.I.; Velazquez, G. Modelling the effect of temperature on the water sorption isotherms of chitosan films. Food Sci. Technol. 2017, 37, 112–118. [Google Scholar] [CrossRef]
  35. Phan, T.D.; Debeaufort, F.; Luu, D.; Voilley, A. Functional properties of edible agar-based and starch-based films for food quality preservation. J. Agric. Food Chem. 2005, 53, 973–981. [Google Scholar] [CrossRef] [PubMed]
  36. Saberi, B.; Vuong, Q.V.; Chockchaisawasdee, S.; Golding, J.B.; Scarlett, C.J.; Stathopoulos, C.E. Water sorption isotherm of pea starch edible films and prediction models. Foods 2016, 5, 1. [Google Scholar] [CrossRef] [PubMed]
  37. Shih, F.F.; Daigle, K.W.; Champagne, E.T. Effect of rice wax on water vapour permeability and sorption properties of edible pullulan films. Food Chem. 2011, 127, 118–121. [Google Scholar] [CrossRef]
  38. Opazo-Navarrete, M.; Schutyser, M.A.I.; Boom, R.M.; Janssen, A.E.M. Effect of pre-treatment on in vitro gastric digestion of quinoa protein (Chenopodium quinoa Willd.) obtained by wet and dry fractionation. Int. J. Food Sci. Nutr. 2018, 69, 1–11. [Google Scholar] [CrossRef]
  39. Zhu, G.; Zhu, X.; Fan, Q.; Wan, X. Raman spectra of amino acids and their aqueous solutions. Spectrochim. Mol. Biomol. Spectrosc. 2011, 78, 1187–1195. [Google Scholar] [CrossRef]
  40. Mariniello, L.; Giosafatto, C.V.L.; Di Pierro, P.; Sorrentino, A.; Porta, R. Synthesis and resistance to in vitro proteolysis of transglutaminase cross-linked phaseolin, the major storage protein from Phaseolus vulgaris. J. Agric. Food Chem. 2007, 55, 4717–4721. [Google Scholar] [CrossRef]
  41. Mäkinen, O.E.; Zannini, E.; Arendt, E.K. Modifying the cold gelation properties of quinoa protein isolate: Influence of Heat-Denaturation pH in the alkaline range. Plant Foods Hum. Nutr. 2015, 70, 250–256. [Google Scholar] [CrossRef]
  42. Deleu, L.J.; Lambrecht, M.A.; de Vondel, J.V.; Delcour, J.A. The impact of alkaline conditions on storage proteins of cereals and pseudo-cereals. Curr. Opin. Food Sci. 2019, 25, 98–103. [Google Scholar] [CrossRef]
Figure 1. Sodium dodecyl sulfate polyacrylamide gel electrophoresis (SDS-PAGE) of Pasankalla (QP) and Willd (QW) protein isolates with and without transglutaminase (TG). M: Molecular weight marker; 1: QW protein isolate; 2: QP protein isolate 3: QW protein isolate + TG; 4: QP protein isolate + TG. The arrow in lane 3 shows a protein band appearing after TG addition to WP.
Coatings 09 00736 g001
Figure 2. Edible films. (a) QP edible film and (b) QW edible films.
Coatings 09 00736 g002
Figure 3. Atomic force microscopy (AFM) micrographs of chitosan-quinoa protein edible films. (a) QW; (b) QW + TG; (c) CT:QW (1:10, w/w); (d) CT:QW (1:10, w/w) + TG.
Coatings 09 00736 g003
Figure 4. AFM micrographs of chitosan-quinoa protein edible films. (a) QP; (b) QP + TG; (c) CT:QP (1:10, w/w); and (d) CT:QP (1:10, w/w) + TG.
Coatings 09 00736 g004
Figure 5. RAMAN spectrogram of QP and CT:QP (1:10, w/w) films. (a) QP and QP + TG; (b) CT-QP (1:10, w/w) and CT:QP (1:10, w/w) + TG. QP = Quinoa Pasankalla; QW = Quinoa Willd; CT = chitosan; TG = transglutaminase.
Coatings 09 00736 g005
Figure 6. RAMAN spectrogram of QW and CT:QW (1:10) films. (a) QW and QW + TG; (b) CT-QW (1:10, w/w) and CT:QW (1:10, w/w) + TG. QP = Quinoa Pasankalla; QW = Quinoa Willd; CT = chitosan; TG = transglutaminase.
Coatings 09 00736 g006
Figure 7. Hydrolysis of quinoa protein-chitosan edible films. (a,c,e): QW protein; lanes: 1, QW; 2, QW + TG; 3, QW-CT (1:5, w/w); 4, QW-CT (1:5, w/w) + TG; 5, QW-CT (1:10, w/w); 6, QW-CT (1:10, w/w) + TG; 7, QW-CT (1:15, w/w); 8, QW-CT (1:15, w/w) + TG; 9, QW-CT (1:20, w/w); 10, QW-CT (1: 20, w/w) + TG. (b,d,f): QP protein; lanes: 1, QP; 2, QP + TG; 3, QP-CT (1: 5, w/w); 4, QP-CT (1: 5, w/w) + TG; 5, QP-CT (1:10, w/w); 6, QP-CT (1:10, w/w) + TG; 7, QP-CT (1:15, w/w); 8, QP-CT (1:15, w/w) + TG; 9, QP-CT (1:20, w/w); and, 10, QP-CT (1: 20, w/w) + TG. QP = Quinoa Pasankalla; QW = Quinoa Willd; CT = chitosan; TG = transglutaminase.
Coatings 09 00736 g007
Table 1. Moisture and protein content of protein isolates of two quinoa varieties.
ParameterQWQP
Moisture (%, w/w) 12.42 ± 0.7210.07 ± 0.54
Protein (N × 6.25, %, w/w)71.49 ± 1.9967.93 ± 2.01
QW = C. quinoa Willd; QP = C. quinoa Pasankalla.
Table 2. Degree of cross-linking when TG is added to edible films made with protein isolates of two quinoa varieties.
Edible Film%Cross-LinkingEdible Film%Cross-Linking
QW40.55 ± 3.62 aQP61.45 ± 3.73 a
CT:QW 1:525.79 ± 3.67 bCT:QP 1:511.45 ± 2.70 b
CT:QW 1:1062.02 ± 1.97 cCT:QP 1:1044.28 ± 1.13 c
CT:QW 1:1567.61 ± 3.28 cCT:QP 1:1539.31 ± 2.18 d
CT:QW 1:2044.59 ± 3.21 aCT:QP 1:2032.63 ± 2.69 e
QP = C. quinoa Pasankalla; QW = C. quinoa Willd; CT = Chitosan. Different lowercase letters (a–e) next to reported values within columns indicate a significant difference (p < 0.05).
Table 3. Physical properties of chitosan and quinoa protein (Pasankalla and Willd).
Edible Films without TG
Edible FilmThickness
(mm)
WVP × 10−13
(g cm Pa−1 cm−2 s−1)
%Solubility
QP0.155 ± 0.051 a2.85 ± 0. 78 a71.84 ± 1.58 a
CT:QP 1:50.231 ± 0.025 b4.97± 0.82 b27.98 ± 1.07 b
CT:QP 1:100.258 ± 0.014 b3.64 ± 0.64 be32.28 ± 1.09 c
CT QP 1:150.214 ± 0.057 b3.74 ± 0.37 be47.38 ± 1.07 d
CT:QP 1:200.173 ± 0.011 a3.26 ± 0.96 be56.91 ± 1.50 e
QW0.184 ± 0.016 a3.40 ± 0.68 be67.92 ± 1.58 f
CT:QW 1:50.253 ± 0.050 b9.95 ± 0.29 c17.5 ± 1.87 g
CT:QW 1:100.266 ± 0.003 b6.74 ± 0.83 d26.73 ± 2.54 b
CT:QW 1:150.223 ± 0.004 b5.56 ± 0.50 bd43.52 ± 1.22 h
CT:QW 1:200.181 ± 0.001 a4.77 ± 0.79 b55.24 ± 2.36 e
Edible Films with TG
QP0.179 ± 0.064 a2.87 ± 0.68 a68.82 ± 1.01 f
CT:QP 1:50.266 ± 0.003 b3.23 ± 0.43 e26.14 ± 1.82 b
CT:QP 1:100.205 ± 0.007 b2.83 ± 0.58 a26.83 ± 1.9 b
CT:QP 1:150.205 ± 0.003 b2.99 ± 0.62 ae42.95 ± 1.75 h
CT:QP 1:200.179 ± 0.011 a2.42 ± 0.5 ae55.25 ± 1.33 e
QW0.205 ± 0.003 b3.07 ± 0.29 ae55.24 ± 1.49 e
CT:QW 1:50.276 ± 0.068 b3.88 ± 0.12 ae14.02 ± 2.17 g
CT:QW 1:100.275 ± 0.003 b4.69 ± 0.52 b25.81 ± 2.95 b
CT:QW 1:150.225 ± 0.035 b3.40 ± 0.69 e42.26 ± 2.13 h
CT: QW 1:200.227 ± 0.007 b3.64 ± 0.49 be53.48 ± 1.57 e
QP = C. quinoa Pasankalla; QW = C. quinoa Willd; CT = Chitosan; TG = transglutaminase. Different lowercase letters (a–h) next to reported values within columns indicate a significant difference (p < 0.05).
Table 4. Sorption parameters of chitosan-quinoa protein edible films.
Edible Films without TG
Edible FilmKCXmr2
QP0.95 ± 0.02 a11.73 ± 1.94 a0.03 ± 0.001 a0.95 ± 0.058 a
CT:QP 1:50.98 ± 0.07 a15.45 ± 2.16 a0.03 ± 0.001 a0.99 ± 0.004 a
CT:QP 1:100.74 ± 0.14 bc7.89 ± 0.67 b0.08± 0.003 b0.99 ± 0.004 a
CT:QP 1:150.70 ± 0.08 b7.07 ± 0.08 b0.11 ± 0.05 c0.98 ± 0.02 a
CT:QP 1:200.82 ± 0.03 c1.36 ± 0.23 c0.13 ± 0.02 c0.97 ± 0.01 a
QW0.78 ± 0.06 b7.27 ± 0.35 b0.06 ± 0.001 b0.93 ± 0.08 a
CT:QW 1:50.81 ± 0.06 c3.82 ± 1.14 d0.03 ± 0.001 a0.90 ± 0.07 a
CT:QW 1:100.75 ±0.12 b4.41 ± 0.46 d0.03 ± 0.007 a0.98 ± 0.02 a
CT:QW 1:150.53 ± 0.18 d4.91 ± 1.37 d0.04 ± 0.005 a0.96 ± 0.03 a
CT:QW 1:200.61 ± 0.17 d3.33 ± 0.68 d0.07 ± 0.008 d0.99 ± 0.01 a
Edible Films with TG
QP0.95 ± 0.03 a78.72 ± 4.94 e0.02 ± 0.001 e0.92 ± 0.04 a
CT:QP 1:50.93 ± 0.08 a7.28 ± 1.22 b0.05 ± 0.001 f0.94 ± 0.05 a
CT:QP 1:100.90 ± 0.11 a7.07 ± 0.06 b0.07 ± 0.002 d0.94 ± 0.08 a
CT:QP 1:150.94 ± 0.07 a7.39 ± 0.7 b0.08 ± 0.003 g0.99 ± 0.12 a
CT:QP 1:200.74 ± 0.02 b9.79 ± 0.18 a0.06 ± 0.001 b0.98 ± 0.01 a
QW0.79 ± 0.18 b2.82 ± 0.82 f0.03 ± 0.007 a0.97 ± 0.03 a
CT:QW 1:50.88 ± 0.06 c6.80 ± 2.48 bf0.06 ± 0.008b0.96 ± 0.01 a
CT:QW 1:100.81 ± 0.16 c5.19 ± 0.83 d0.03 ± 0.002 a0.99 ± 0.01 a
CT:QW 1:150.69 ±0.18 b2.95 ± 0.93 f0.13 ± 0.02 c0.98 ± 0.01 a
CT:QW 1:200.62 ± 0.04 b2.31 ± 0.53 f0.18 ± 0.01 h0.99 ± 0.01 a
QP, Quinoa Pasankalla; QW, Quinoa Willd; CT, Chitosan; TG, transglutaminase. Different lowercase letters (a–h) next to reported values within columns indicate a significant difference (p < 0.05).

