Article

Study on the Time-Varying Characteristics of Discharge Plasma in Micro-Electrical Discharge Machining

1
Key Laboratory of Laser Green Intelligent Manufacturing Technology, Shandong Research Center of Laser Green and High Efficiency Intelligent Manufacturing Engineering Technology, Qingdao University of Technology, Qingdao 266520, China
2
Key Laboratory of High Efficiency and Clean Mechanical Manufacture of Ministry of Education, School of Mechanical Engineering, Shandong University, Jinan 250061, China
3
School of Mechanical Engineering, Nanjing Institute of Technology, Nanjing 211100, China
*
Authors to whom correspondence should be addressed.
Coatings 2019, 9(11), 718; https://doi.org/10.3390/coatings9110718
Submission received: 17 October 2019 / Revised: 26 October 2019 / Accepted: 29 October 2019 / Published: 1 November 2019
(This article belongs to the Section Plasma Coatings, Surfaces & Interfaces)

Abstract

:
Micro electrical discharge machining (micro-EDM) has been widely applied in the field of precision machining, but the machining mechanism is still unclear. In this paper, the relationship between the characteristics of discharge plasma and discharge duration is clarified by analyzing the formation and expansion process of the discharge plasma channel under micro-scale discharge conditions. Based on the experimental results, the effects of discharge duration on the discharge current, discharge voltage and discharge crater size are discussed. The results show that the expansion acceleration, internal pressure, temperature, and electron density of the discharge plasma decrease as the discharge duration increase, while the radius and expansion velocity of the discharge plasma increase, and finally the discharge plasma reaches the state of shape–position equilibrium. The resistance of discharge plasma is estimated to fluctuate in the range of 38–45 Ω by the ratio of discharge maintenance voltage to discharge current. The energy utilization rate of micro-EDM is very high when discharge duration is less than 4 μs, and then decreases gradually as the discharge duration increased. There is a positive linear relationship between discharge crater volume and discharge duration. The discharge duration has no significant effect on the discharge crater depth. This study provides a theoretical basis for further study of discharge plasma characteristics in micro-EDM.

1. Introduction

In recent years, more and more attention has been paid to precision machining technology and methods [1,2]. As one of the most popular microfabrication methods, micro-electrical discharge machining (micro-EDM) has been widely applied to fabricate various difficult-to-cut materials [3,4,5].
Although micro-EDM is common in machining the miniaturization of products in various areas, the machining mechanism is still unclear. The discharge of micro-EDM happens in a very short period of time and very small space with very low discharge energy, which leads to the machining mechanism of micro-EDM being different from that of macro-EDM, due to size effects [6,7]. Micro-EDM is usually considered as the miniature version of traditional macro-EDM, but the simulation results are inaccurate when using the macro-EDM model. A comprehensive model was proposed to predict the material removal characteristic of micro-EDM, and the discharge temperature and crater radius can be more accurately predicted using this model [8]. However, precise micro-EDM cannot be established since the micro-EDM process is extremely complex with stochastic characteristics.
The exploration of material removal mechanism of micro-EDM is still one of the research emphases of EDM. It is indicated that the current waveform can be changed by changing the electrical parameters, and, thus, the micro-EDM performance can be optimized by obtaining optimal discharge plasma [9]. Yang et al. [10] indicated that the machining efficiency of micro-EDM can be further improved though increasing the total tool wear ratio, owing to the energy stored in capacitor being consumed by the alternating-current. Zhao et al. [11] indicated that the Joule heating effect has a significant influence on the discharge temperature of SiC during micro-EDM. Wong et al. [12] found that the energy utilization rate of micro-EDM at lower-energy (<50 μJ) is much higher. Wang et al. [13] indicated that the reverse current during micro-EDM has a beneficial effect on machining performance. Because it is difficult to accurately observe the discharge plasma expansion process, the material removal process and instantaneous temperature distribution cannot be directly obtained by existing technical means. Although there are a lot of reports on the machining mechanism of micro-EDM, it is difficult to carry out experimental verification, which leads to different conclusions [14,15,16]. Research on the theory of micro-EDM is relatively underdeveloped, which limits the further promotion of micro-EDM technology. Further clarification of the material removal mechanism of micro-EDM is helpful to improve its machining performance.
In this paper, the relationship between discharge duration and internal pressure, temperature, electron density, expanding speed, and acceleration of discharge plasma was discussed by analyzing the formation and expansion of discharge plasma channel in a micro-scale discharge condition. Then, single pulse discharge experiments in a micro-scale condition were carried out to verify the results of theoretical analysis. Based on the experimental results, the effects of the discharge duration on the discharge current, discharge voltage, and discharge crater size were discussed.

2. Materials and Methods

2.1. Formation and Expansion of Discharge Plasmas of Micro-EDM

During the micro-EDM process, the electric field between tool and workpiece electrode increases with the feed of tool electrode. As the distance between electrodes decreases, the abrupt change of macro curvature of the electrode profile and the micro-unevenness of the electrode surface cause an increase in the non-uniformity of the electric field intensity distribution. The electric field intensity at the micro-peak is expected to be significantly higher than the average value. Based on the field electron emission theory, under the effect of tunneling effect, some free electrons would emit through the barrier on the surface of the electrode, and then the pre-discharge current will appear before breakdown [17]. The pre-discharge current before breakdown heats the liquid medium in the inter-electrode gap (especially at the micro-peak). The current density caused by cathode electron emission can be expressed by Fowler and Nordheim equation [18]:
j = C E p 2 exp ( D E p )
where j is the current density (A/m2), E p is the enhanced electric field (kV/m), and C and D are constant.
From Equation (1), it can be found that the current density depends on electric field intensity, the higher the electric field intensity, the higher the current density. Considering the geometrical shape of the micro-peaks, the enhanced electric field at the micro-peaks on the electrode surface can be expressed as follows [19]:
E p = U r t 0.75 l g 0.25
where r t is the tip radius of micro-peaks (m), U is the voltage between electrodes, l g is the discharge gap (m).
Since l g >> r t , E p is significantly greater than the average electric field strength E a = U l g . Therefore, the breakdown of inter-electrode dielectric is expected to first occur at micro-peaks.
During spark discharge, the presence of pre-discharge current before breakdown causes the formation of low-density regions and bubbles in liquid dielectric. The nucleation rate of bubbles per unit volume is generally expressed by the following expression [17]:
J = N e λ 0 / k T 2 σ s π m m exp [ 16 π σ s 3 / 3 k T ( P v P ext ) 2 ]
where J is the nucleation frequency per unit volume of bubbles, N is the molecular number, λ 0 is the vaporization latent heat of single molecule (J/kg), k is the Boltzmann constant, k = 1.3806488 × 10⁻²³ J/K, T is temperature (K), σ s is the surface tension of liquid dielectric (N/m), m m is the molecular mass (kg), P v is the bubble internal pressure (Pa), and P ext is the external pressure (Pa).
In order to form a nucleating bubble, it is necessary to produce a nucleating point in at least a period of time τ nuc , which usually occurs on the micro-peak of cathode surface. The expression is as follows:
J r t 3 τ nuc = 1
where τ nuc is the nucleation time (s).
Through Clausius–Clapeyron equation, the bubble pressure of nucleation can be obtained as follows [20]:
P nuc = P atm e [ - λ v R 0 ( 1 T 1 T sat ) ]
where P atm is the atmospheric pressure (Pa), T sat is the saturation temperature (K), R 0 is the gas constant (J/(mol·K)), λ v is the vaporization latent heat of liquid dielectric (J/kg).
The power density at the micro-peak is j E p , the relationship between nucleation time τ nuc and nucleation temperature T nuc can be expressed by the thermal equation of the nucleation point caused by the power density at the micro-peak:
j E p τ nuc = c p ( l ) ( T 0 T sat ρ l + T sat T nuc ρ m ) d T
where T 0 is the initial temperature (K), c p ( l ) is the liquid heat capacity (J/K), ρ l is the density of liquid state (kg/m3), and ρ m is the mixed state density (kg/m3).
An equation with only one variable can be formed by combining Equation (3) to Equation (6), which can be expressed as follows:
N e λ 0 / k T 2 σ s π m m exp ( 16 π σ s 3 T sat 2 3 k T ( T T sat ) 2 ( ρ λ v ) 2 ) r t 3 c p ( l ) ( T 0 T sat ρ l + T sat T nuc ρ m ) d T j E p = 1
where ρ is the density of liquid dielectric (kg/m3) and ρ v is the density of steam state (kg/m3).
Equation (7) shows the relationship between enhanced electric field E p and nucleation temperature T nuc . Then, the initial radius of nucleating bubbles can be expressed as [18]:
r 0 = 2 σ s T sat ( T nuc - T sat ) ρ v λ v
When the bubble reaches the nucleation temperature T nuc and the corresponding nucleation pressure P nuc , assuming that the bubble is spherical, then the radius r c of the bubble in the state of electron activation can be obtained by mass balance equation:
r c = r 0 ρ v ρ t 3
where ρ t is the steam threshold density (kg/m3).
In the low-density region where the molecular density is below the threshold, the bubble meets the standard of electron collision. Electrons are activated and begin to move at high speed to bombard the molecule and ionize it. The ionization front ionizes the surrounding medium and moves towards the anode. Assuming that the electron migration velocity v d is known, the time from the initial ionization to breakdown can be expressed as follows [18]:
τ g = 3 × l g v d
Thus, the energy balance equation of bubble expansion is written as follows:
ρ av T nuc T p C p ( T ) d T = E j τ g
where T p is the initial temperature (K), ρ av is the average density from initial ionization to breakdown (kg/m3), and τ g is the time from initial ionization to breakdown(s).
The initial pressure of plasma P nuc can be obtained from Equation (5). Because the plasma expansion can be neglected in the breakdown process, r c can be considered as the initial radius of the plasma, and its value can be obtained by Equation (9). The initial temperature of plasma T p can be obtained from Equation (11). It has been found that the initial pressure of discharge plasma is as high as 1010 Pa, the initial radius is about 0.18 μm, and the initial temperature is as high as 17,304 K [20]. These are expected to be adopted as initial conditions in the iterative calculation of plasma expansion and heating stages.
After dielectric breakdown and discharge plasma formation, charged particles in discharge plasma move and collide at high speed, resulting in extremely high current density, electron temperature and pressure, which makes the discharge plasma expand rapidly. In previous studies, the Navier–Stokes flow field was used to model the expansion process of discharge plasma. However, the radius of discharge plasma produced by micro-EDM is very small, it is necessary to consider the influence of viscous force, surface tension, and magnetic pinch force, which are not taken into account in most of the existing models.
During the discharge process, the pressure inside the discharge plasma varies greatly and has transient characteristics. Assuming that the discharge plasma channel is an incompressible fluid, the fluid motion at its boundary can be represented by Navier–Stokes equation (N–S equation) [18]:
ρ u t = F grad ( P ) + η 2 u
where F is the resultant force per unit volume, P is the fluid pressure (N/m2), η is the dynamic viscosity of fluids (Pa·s), 2 is the Laplace operator ( 2 = 2 x 2 + 2 y 2 + 2 z 2 ), and u is the velocity tensor of fluid (m/s).
The magnetic pinch force is a kind of volume force, which occurs when current passing through discharge plasma. The magnetic pinch force during micro-EDM would be very large as the discharge plasma radius is very small and the current density is very large. The magnetic induction intensity of discharge plasma can be obtained by the Maxwell equation.
B ( r ) = μ 0 r 0 r r j ( r ) d r
where r is the radial distance between arbitrary point and the axis of discharge plasma (m), B is the magnetic induction intensity (T), and μ 0 is the vacuum permeability ( μ 0 = 1.26 × 10 6 H/m).
The magnetic pinch force is an electromagnetic force perpendicular to the magnetic field that restricts the expansion of the discharge plasma in the radial direction. The magnetic pinch force per unit area can also be referred to as magnetic pressure P m , which can be expressed by the following equation:
P m = B 2 2 μ 0
When the current is regarded as being uniformly distributed, the average magnetic pressure P m ¯ can be obtained from Equations (13) and (14):
P m ¯ = I 2 μ 0 8 π 2 r i 2
where r i is the radius of discharge plasma (m) and I is the electric current (A).
From Equation (15), it can be seen that the magnetic pinch force on the discharge plasma is related to the radius and current of the discharge plasma. The larger the current and the smaller the radius of the discharge plasma, the greater the magnetic pinch force on the discharge plasma.
Based on the above analysis, considering the magnetic pinch force and liquid surface tension σ s , the volume force F r can be expressed as follows:
F r = σ s r i + ε 0 I 2 ( t ) 8 π r i 2
For macro plasma discharges it has recently been found that the plasma column moves with a different velocity than the fluid velocity, i.e., there is a slip velocity between the plasma discharge and the flow [21]. However, such a slip may be insignificant for the micro discharge, because the discharge duration is not long enough for the slip velocity to increase. Therefore, slip velocity is neglected in this study. It can be considered that the discharge plasma expands only in the radial direction and its axial length remains unchanged. Therefore, the N–S equation can be simplified in the form of cylindrical coordinates when only the radial component is considered.
ρ 0 ( v ( r ) t + v ( r ) v ( r ) r ) = σ s r i + ε 0 I 2 ( t ) 8 π r i 2 p ( r ) r + η 1 r r ( r v ( r ) r ) , v ( r ) r + v ( r ) r = 0
where v ( r ) is the radial velocity (m/s), v ( r ) = v i r i r , ρ 0 is the density of liquid dielectric (kg/m3), p ( r ) is the pressure (Pa), v i is the radial velocity (m/s) at any point at the discharge plasma boundary, and v i is a function of time t.
By integral transformation, Equation (17) can be transformed into the following:
ρ 0 ( v ( r ) t v i 2 r i 2 r 3 ) = σ s r i + ε 0 I 2 ( t ) 8 π r i 2 p ( r ) r + η v i r i r 3
Because the acceleration at any point in the discharge plasma can be expressed as follows:
a ( r ) = v ( r ) t = v i t r i r + v i r r i t
Since v i t = a i , r i t = v i , thus, Equation (18) can be rewritten as follows:
ρ 0 ( a i r i r + v i 2 r v i 2 r i 2 r 3 ) = σ s r i + ε 0 I 2 ( t ) 8 π r i 2 p ( r ) r + η v i r i r 3
Assuming that there is a reference point f outside the discharge plasma, the integral of Equation (20) from r = r i to r = r f can be obtained:
P i P f ρ 0 = a i r i ln ( r f r i ) + v i 2 ln ( r f r i ) + v i 2 r i 2 2 ( r i 2 r f 2 1 ) ( r f r i ) ρ 0 [ σ s r i + ε 0 I 2 ( t ) 8 π r i 2 ] 2 η v i r i ( 1 r i 2 1 r f 2 )
where P f is the pressure of reference point f, P f = 1.01 × 10⁵ Pa, P i is the pressure at the boundary of discharge plasma (Pa).
Therefore, the acceleration at the discharge plasma boundary can be solved as follows:
a i = P i P f ρ 0 + ( r f r i ) ρ 0 [ σ s r i + ε 0 I 2 ( t ) 8 π r i 2 ] 2 η v i r i ( 1 r i 2 1 r f 2 ) v i 2 ln ( r f r i ) v i 2 r i 2 2 ( r i 2 r f 2 1 ) r i ln ( r f r i )
Equation (22) involves surface tension, viscous force, and magnetic pinch force, which fully expresses the hydrodynamics of discharge plasma expansion. In Equation (22), r f , ρ 0 , and P f are known constants, and the acceleration of discharge plasma expansion a i increases with the increase of internal pressure P i , while the radius r i and radial velocity v i of discharge plasma are determined by the acceleration a i of discharge plasma expansion.
From the above analysis, it can be found that the initial pressure of discharge plasma channel is very high, and, therefore, the initial expansion acceleration of discharge plasma is also very high, which causes the rapid increase in the expansion speed of discharge plasma, resulting in the rapid expansion of discharge plasma. The expansion acceleration of the discharge plasma decreases as the internal pressure decreases. When the internal pressure of the discharge plasma is equal to the external pressure, the acceleration decreases to zero. At this time, the expansion speed of the discharge plasma is the largest, and the discharge plasma will continue to expand for a period of time under the action of inertia force. When the expansion speed drops to zero, the radius of the discharge plasma reaches the maximum, and the internal pressure is less than the external pressure, which will lead to a short contraction. If the discharge is not finished, the discharge plasma will reach a state of shape–position balance. In micro-EDM, the discharge plasma channel is usually not fully expanded, which results in its different material removal mechanism from macro-EDM.

2.2. Equipment and Materials

Selection of power supply type is the key to single pulse discharge experiment under micro-scale conditions. An RC power supply is the most commonly used power supply in micro-EDM. However, our pre-experiment results show that in the case of RC power supply, when the distance between tool and workpiece is small to a certain extent, there will be discharge between the electrodes and a short-circuit state will quickly be reached. Moreover, when the tool electrode returns, there will be arc pulling, making it difficult to effectively produce single-pulse discharge. Therefore, it is not suitable to use an RC power supply to provide discharge energy for single pulse experiment under micro-scale conditions. In this study, single pulse discharge experiments were conducted using a transistor type micro-energy high-frequency power supply system. The current limiting resistance adopted for short-circuit protection is 50 Ω. Tungsten rod and T2 copper sheet is adopted as tool and workpiece, respectively. The thickness of the workpiece is 300 μm. The workpiece electrode was connected to positive polarity. The main discharge parameters are shown in Table 1.

2.3. Experimental Procedure

Firstly, the workpiece was polished to facilitate the observation of experimental results. Before each experiment, the tool and the workpiece electrode were connected with a lower open circuit voltage, and the tool was slowly close to the workpiece electrode. When the oscilloscope display voltage is 0, the tool is considered to be in contact with the workpiece electrode. Thus, the tool electrode was returned to 10 μm and the electrode was connected to the single pulse power supply and adjusted to the required discharge parameters. The tool electrode was fed at a speed of 0.3 μm/step and the power supply emits a pulse after each step until discharge occurs. The electrode was returned and a single pulse discharge experiment was completed. The discharge waveform of each pulse discharge was captured by oscilloscope to record the voltage of the gap between electrodes and the voltage of the current limiting resistance. Thus, the discharge current could be obtained by the ratio of the voltage to the current limiting resistance.
The discharge energy of a single spark discharge can be expressed by the following formula:
W = 0 t on / Δ t U ( t ) I ( t ) Δ t
where U ( t ) is the discharge voltage (V), I ( t ) is the discharge current (A), t on is the discharge duration (μs), Δt is the time unit.
After the experiment, the surface topography of each discharge crater was observed using optical microscope (MX-6R, EAST IMAGE, Shanghai, China) and scanning probe microscopy (SPM) (Flex-Axiom, Nanosurf, Liestal, Switzerland). The figure of discharge crater is as shown in Figure 1.

3. Results and Discussion

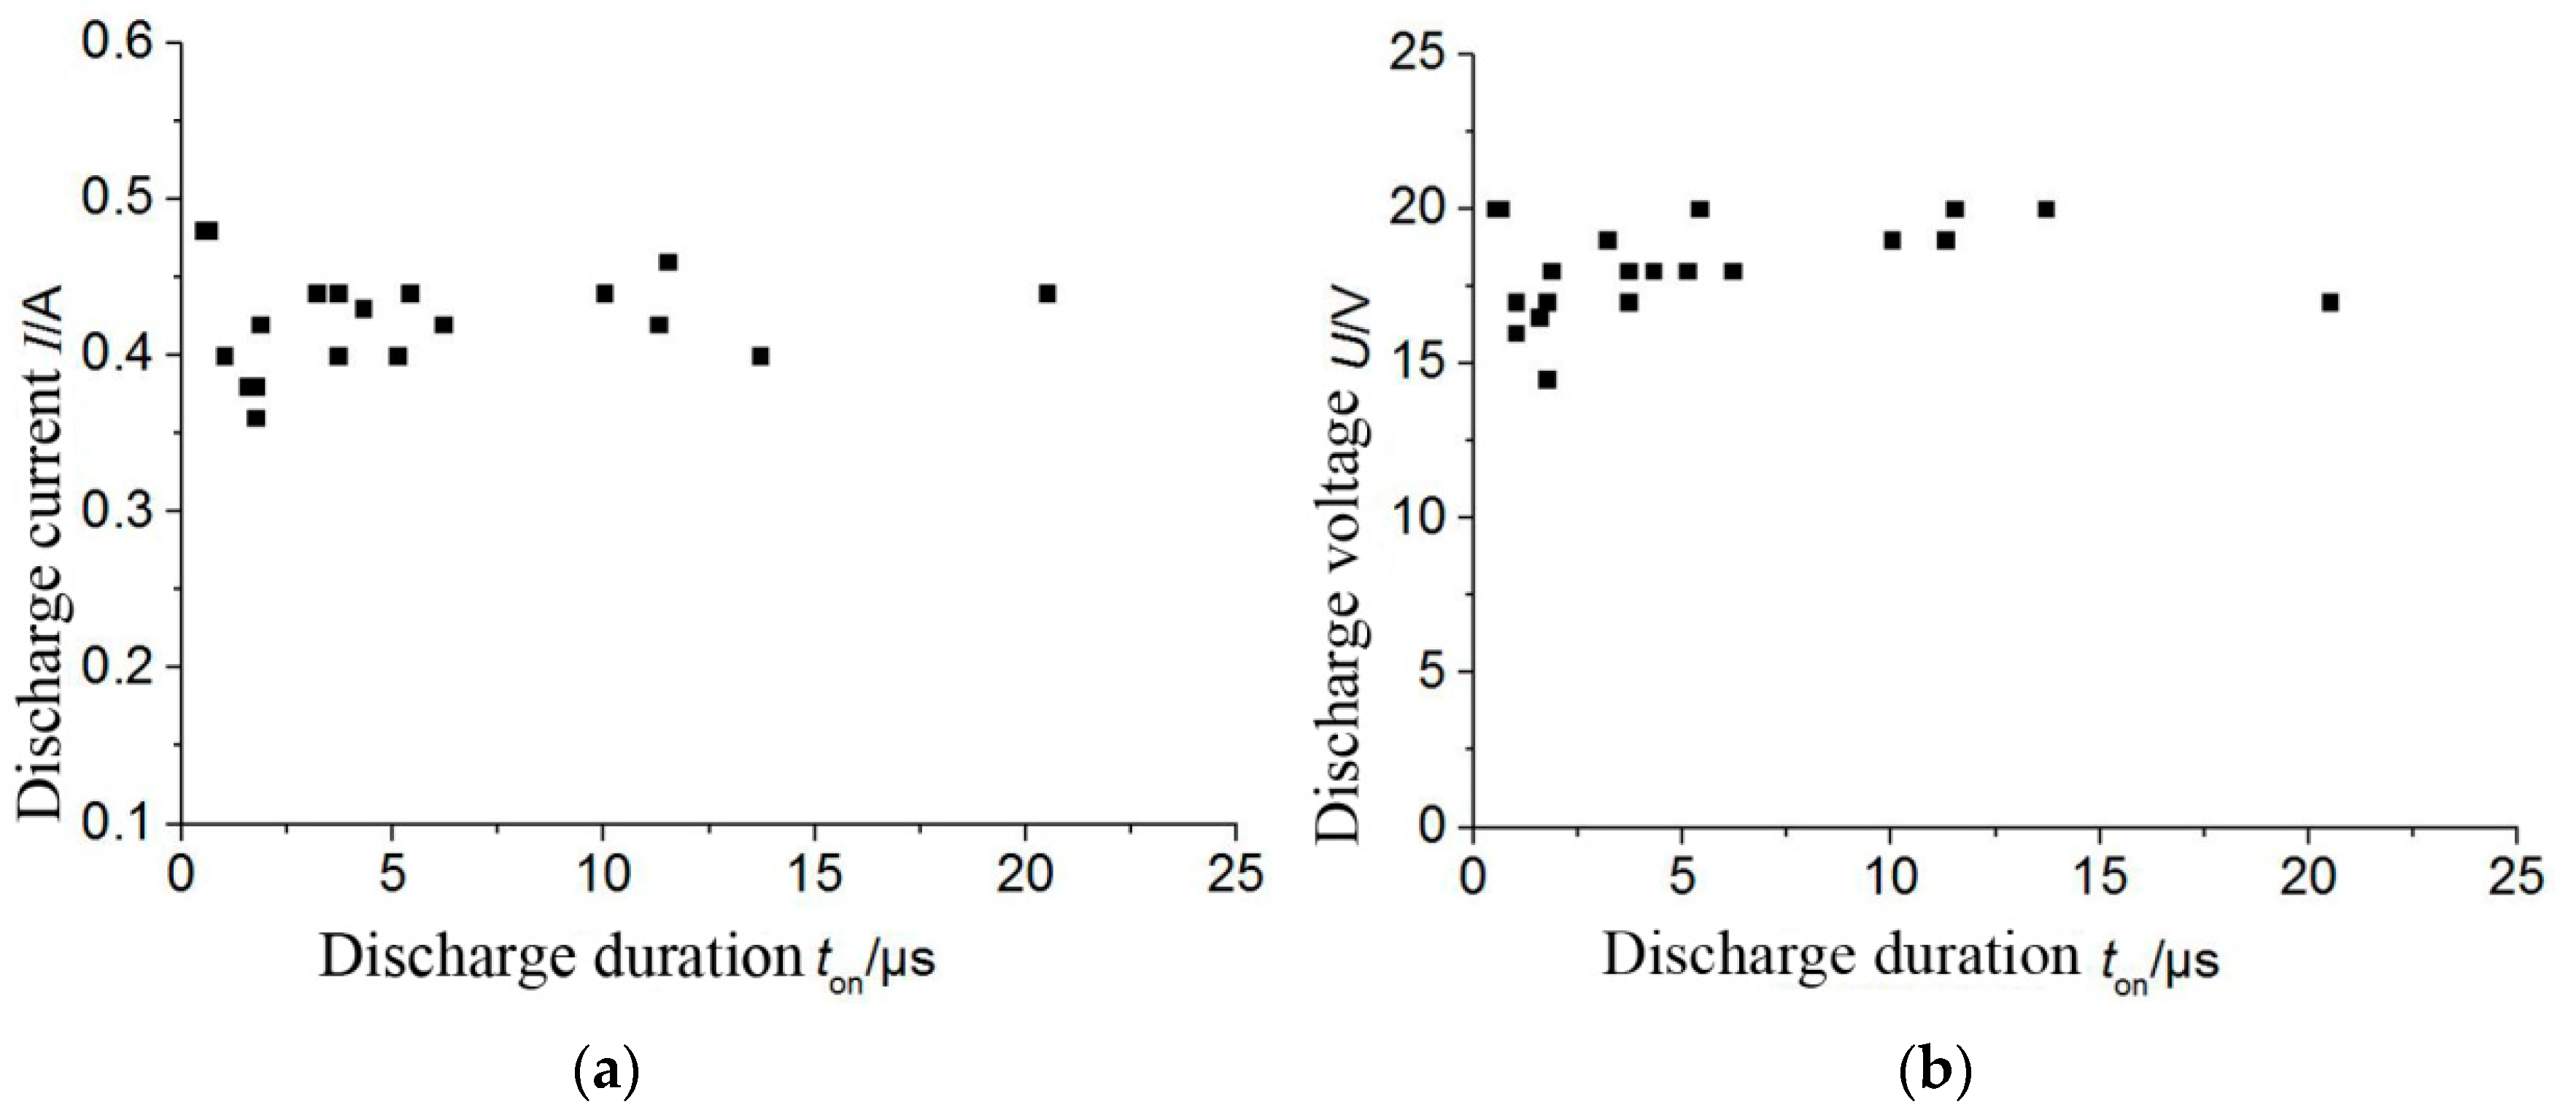
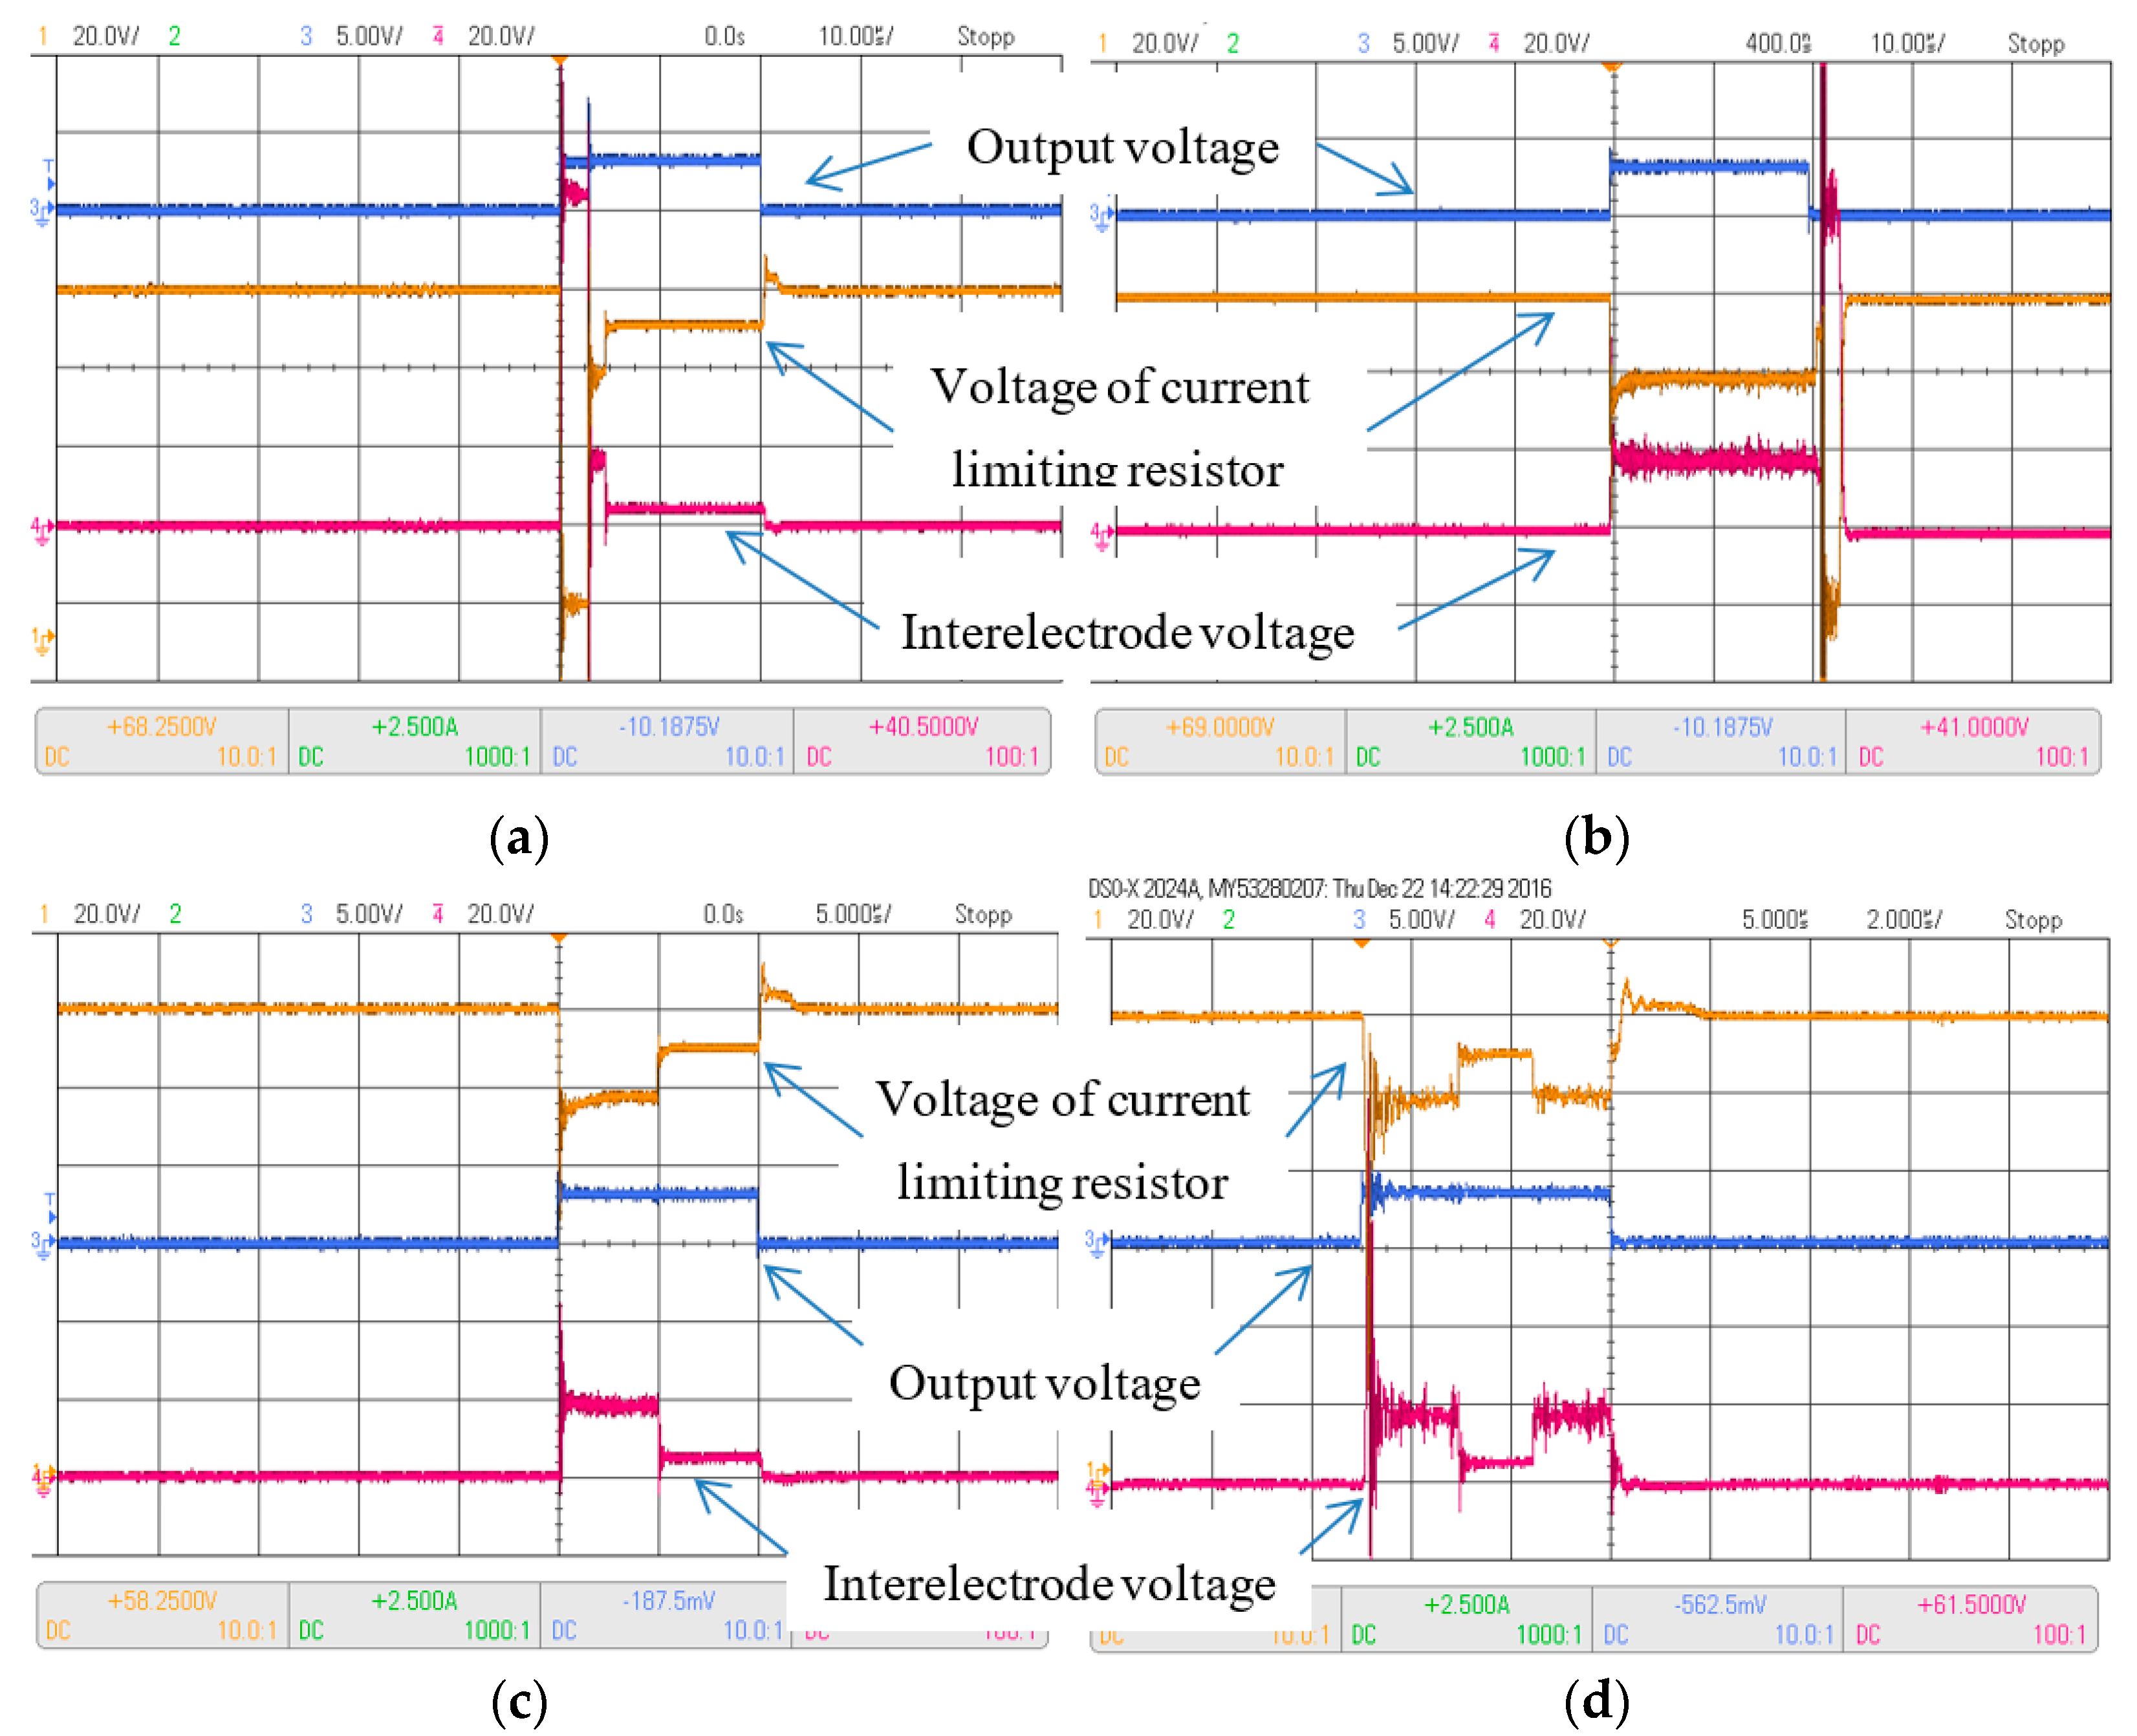
3.1. Effect of Discharge Duration on Current and Voltage

The evolution of average discharge voltage and average discharge current with discharge duration are shown in Figure 2. It can be found that discharge duration and open circuit voltage have no significant effect on either discharge voltage or discharge current, both of which fluctuate in a certain range.
The resistance value of discharge plasma can be estimated by the ratio of discharge voltage to discharge current, which fluctuates in a certain range (38–45 Ω). The resistance of the discharge plasma fluctuates continuously because the irregular movement of charged particles in plasma channel. As a result, the constant current limiting resistance and the fluctuating discharge plasma resistance lead to the weak fluctuation of discharge voltage and discharge current, independent of the open-circuit voltage and discharge duration.
Since discharge voltage and discharge current are immune to discharge duration, it can be deduced from Equation (23) that the discharge energy is positively correlated with discharge duration. Therefore, the longer the discharge duration, the higher the discharge energy, the more electrode materials would be eroded. It is found that a single pulse discharge is easily generated when pulse width is less than 10 μs. However, when the pulse width exceeds 10 μs, multiple discharges or single discharges that directly turn into short circuits often occur. The steam torch and debris particles emitted from the discharge crater are expected to cause short circuits, resulting in the deterioration of discharge state, as the discharge gap is very small (about 3–5 μm). Therefore, as the actual discharge duration is unstable, discharge energy cannot continue to increase as pulse width increased. As a result, it is very difficult to accurately control the micro-EDM process. This is also the reason why micro-EDM usually accompanies tool rotation or aided vibration.
The discharge waveforms of different discharge states captured during single pulse discharge experiment are as shown in Figure 3. When the interelectrode voltage was loaded, the interelectrode state could not only change from open-circuit to spark discharge or short-circuit, but also from short-circuit to spark discharge or from spark discharge to open-circuit. It is indicated that the discharge state is quite unstable due to the influence of the dielectric state in discharge gap. Studying the discharge waveforms under different discharge conditions and their relationship with the morphology and size of discharge craters is beneficial to further clarify the material removal mechanism of micro-EDM.

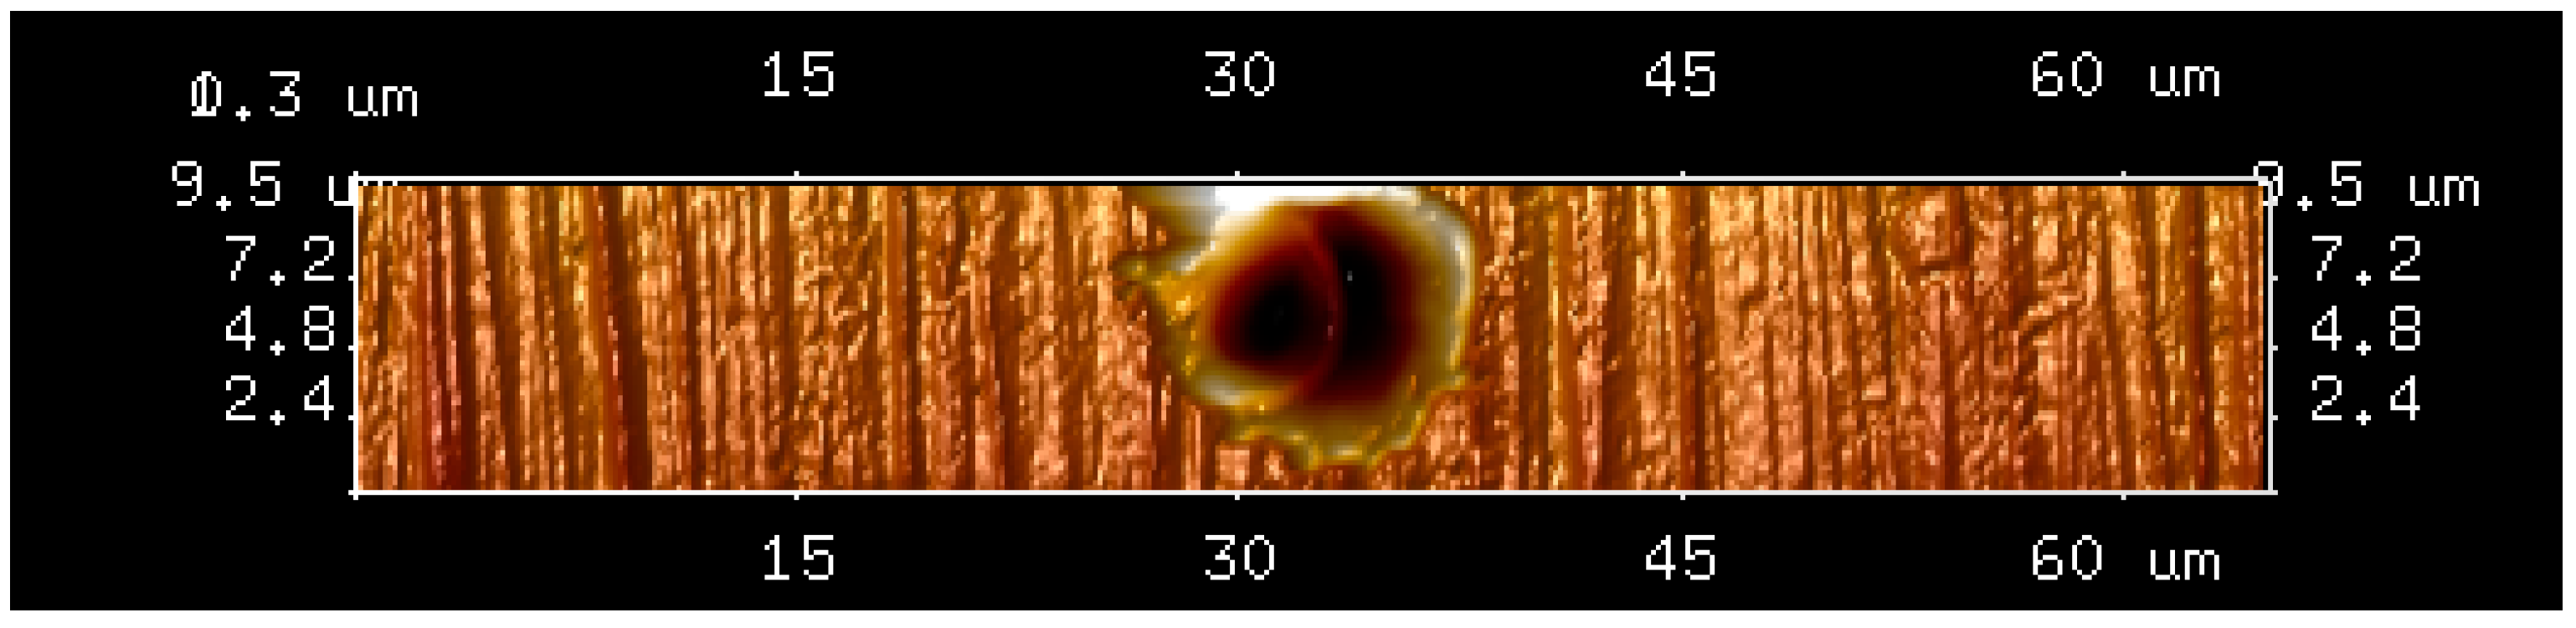
3.2. Effect of Discharge Duration on Discharge Crater Radius

The evolutions of discharge crater radius and heat-affected zone radius with discharge duration are illustrated in Figure 4. It can be seen from Figure 4 that the heat-affected zone radius coincides with the crater radius, both of which increase rapidly, when discharge duration is less than 4 μs. The discharge plasma temperature is quite high in the initial stage of discharge, and the discharge time is not enough for heat to diffuse to the electrode surface. Therefore, the discharge energy transferred to the workpiece (positive polarity) is mainly consumed by the melting and vaporization of the material, while the proportion of energy consumed through heat conduction is very small. As a result, the energy utilization rate of micro-EDM with a short pulse (<4 μs) is quite high. However, when the discharge duration is more than 15 μs, the radius of discharge crater tends to be flat while the radius of the heat-affected zone still increases slowly. The discharge plasma expands rapidly as the discharge duration increases, accompanied by the rapidly decreasing energy density and temperature, resulting in more materials being melted. At the same time, the radius of the heat-affected zone continues to increase as more discharge energy is transferred to electrode surface through heat conduction. As a result, the energy efficiency of micro-EDM increases as the discharge duration increases. With the increase of discharge duration, the variation trend of the discharge crater radius is consistent with that of the analyzed discharge plasma channel.

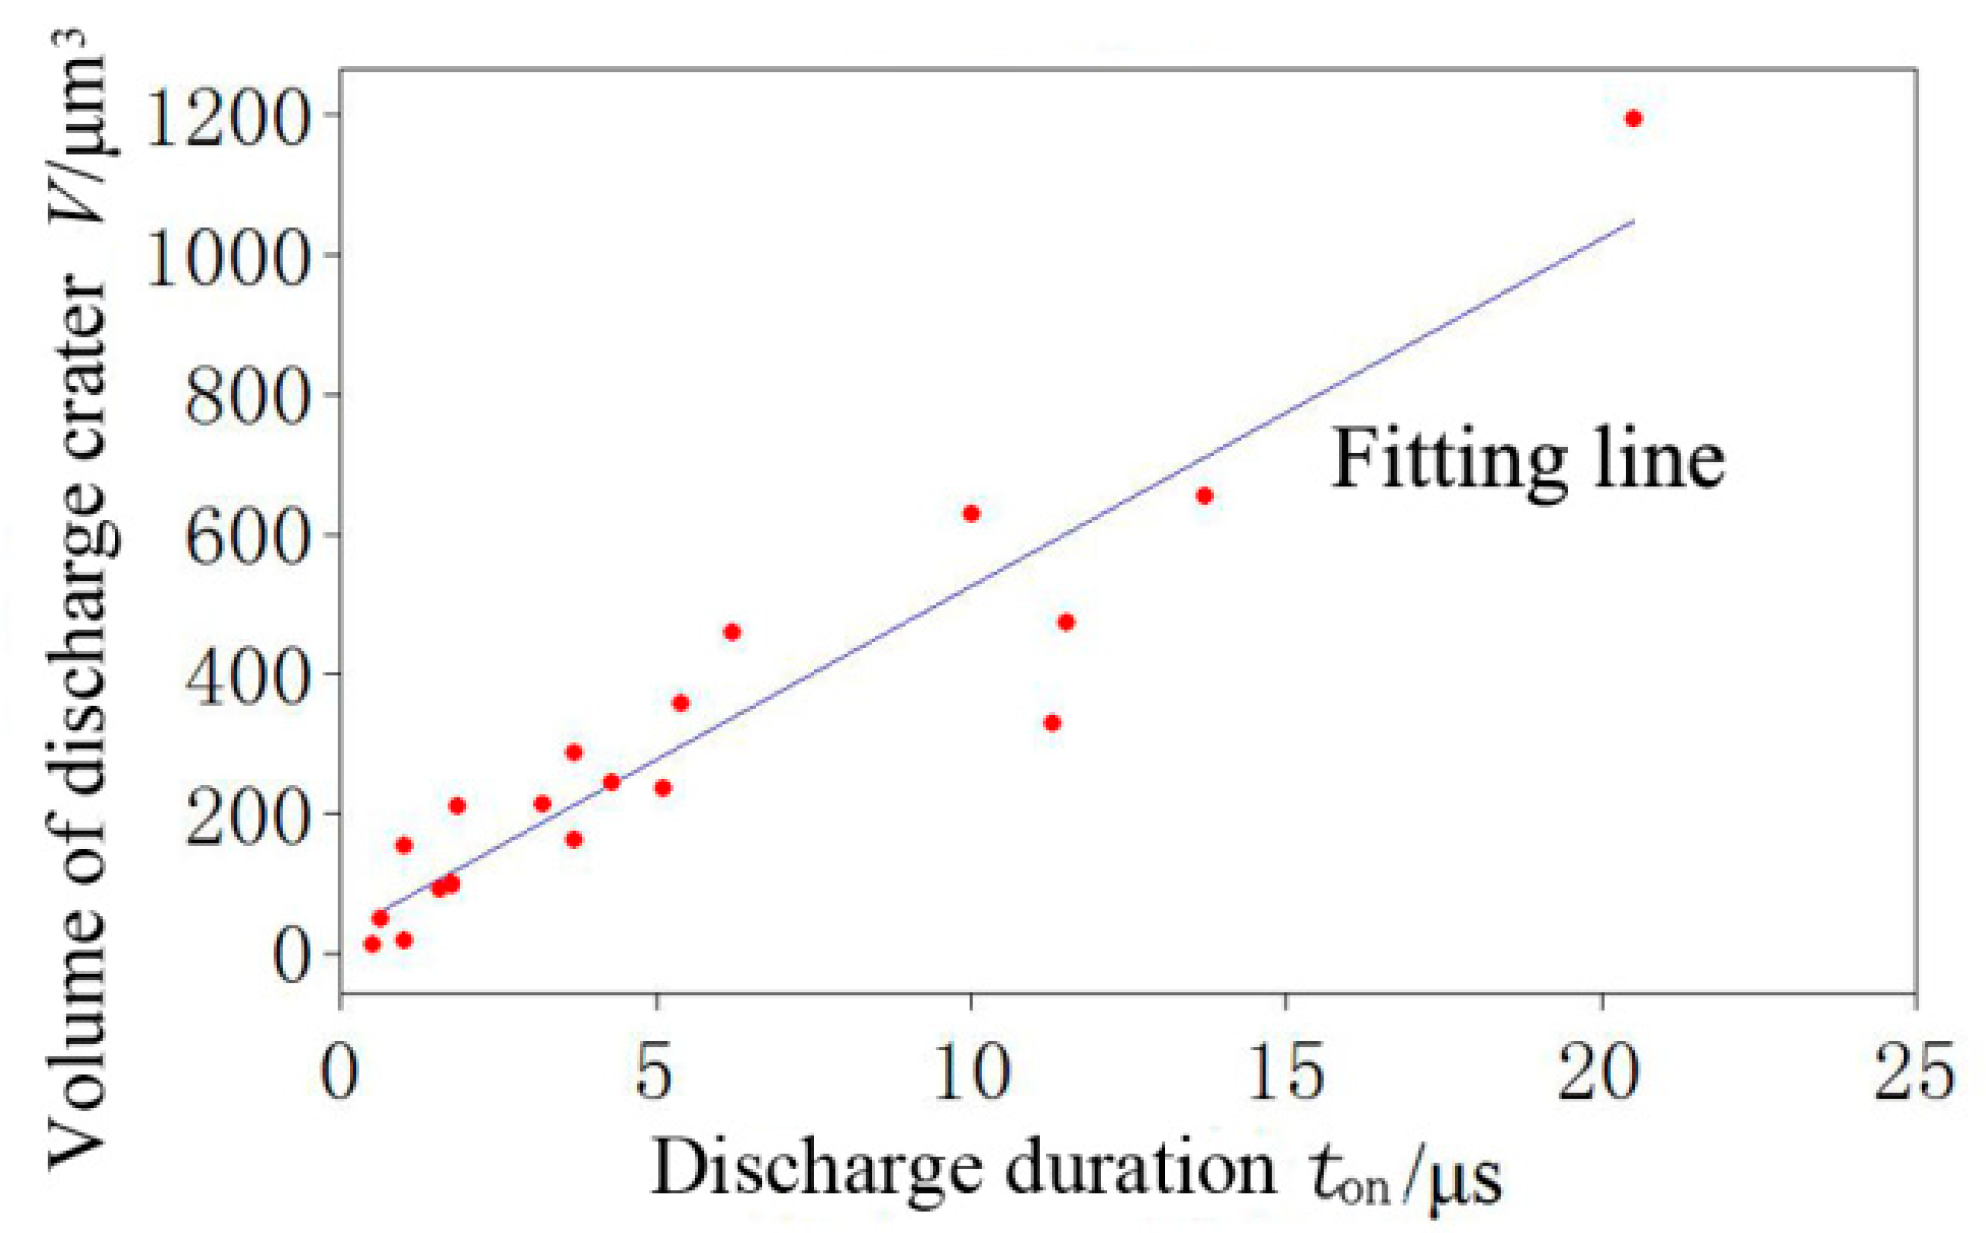
3.3. Effect of Discharge Duration on the Volume of Discharge Crater

Assuming that the discharge crater is spherical coronal, its volume can be expressed by the following formula:
V = 1 6 π h ( 3 R 2 + h 2 )
where h is the discharge depth (μm).
Furthermore, the variation trend of the discharge crater volume with the discharge duration can be obtained, as shown in Figure 5. The volume of discharge crater is positively correlated with discharge duration. Through regression analysis, the equation expressing the relationship between discharge crater volume V and discharge time t can be fitted. The empirical expressions are as follows:
V = 29.74 + 49.67 t   ( μ m 3 )
The R-square value of the regression model is 88.8%, which indicates that the fitting degree is high. The model can effectively reflect the relationship between the discharge crater volume and the discharge duration when copper is used as the workpiece. It has a certain guiding significance for future theoretical analysis and processing experiments. The above analysis shows that with the increase of discharge duration, the discharge energy increases, and more materials are melted and ejected, which leads to the increase of crater volume.

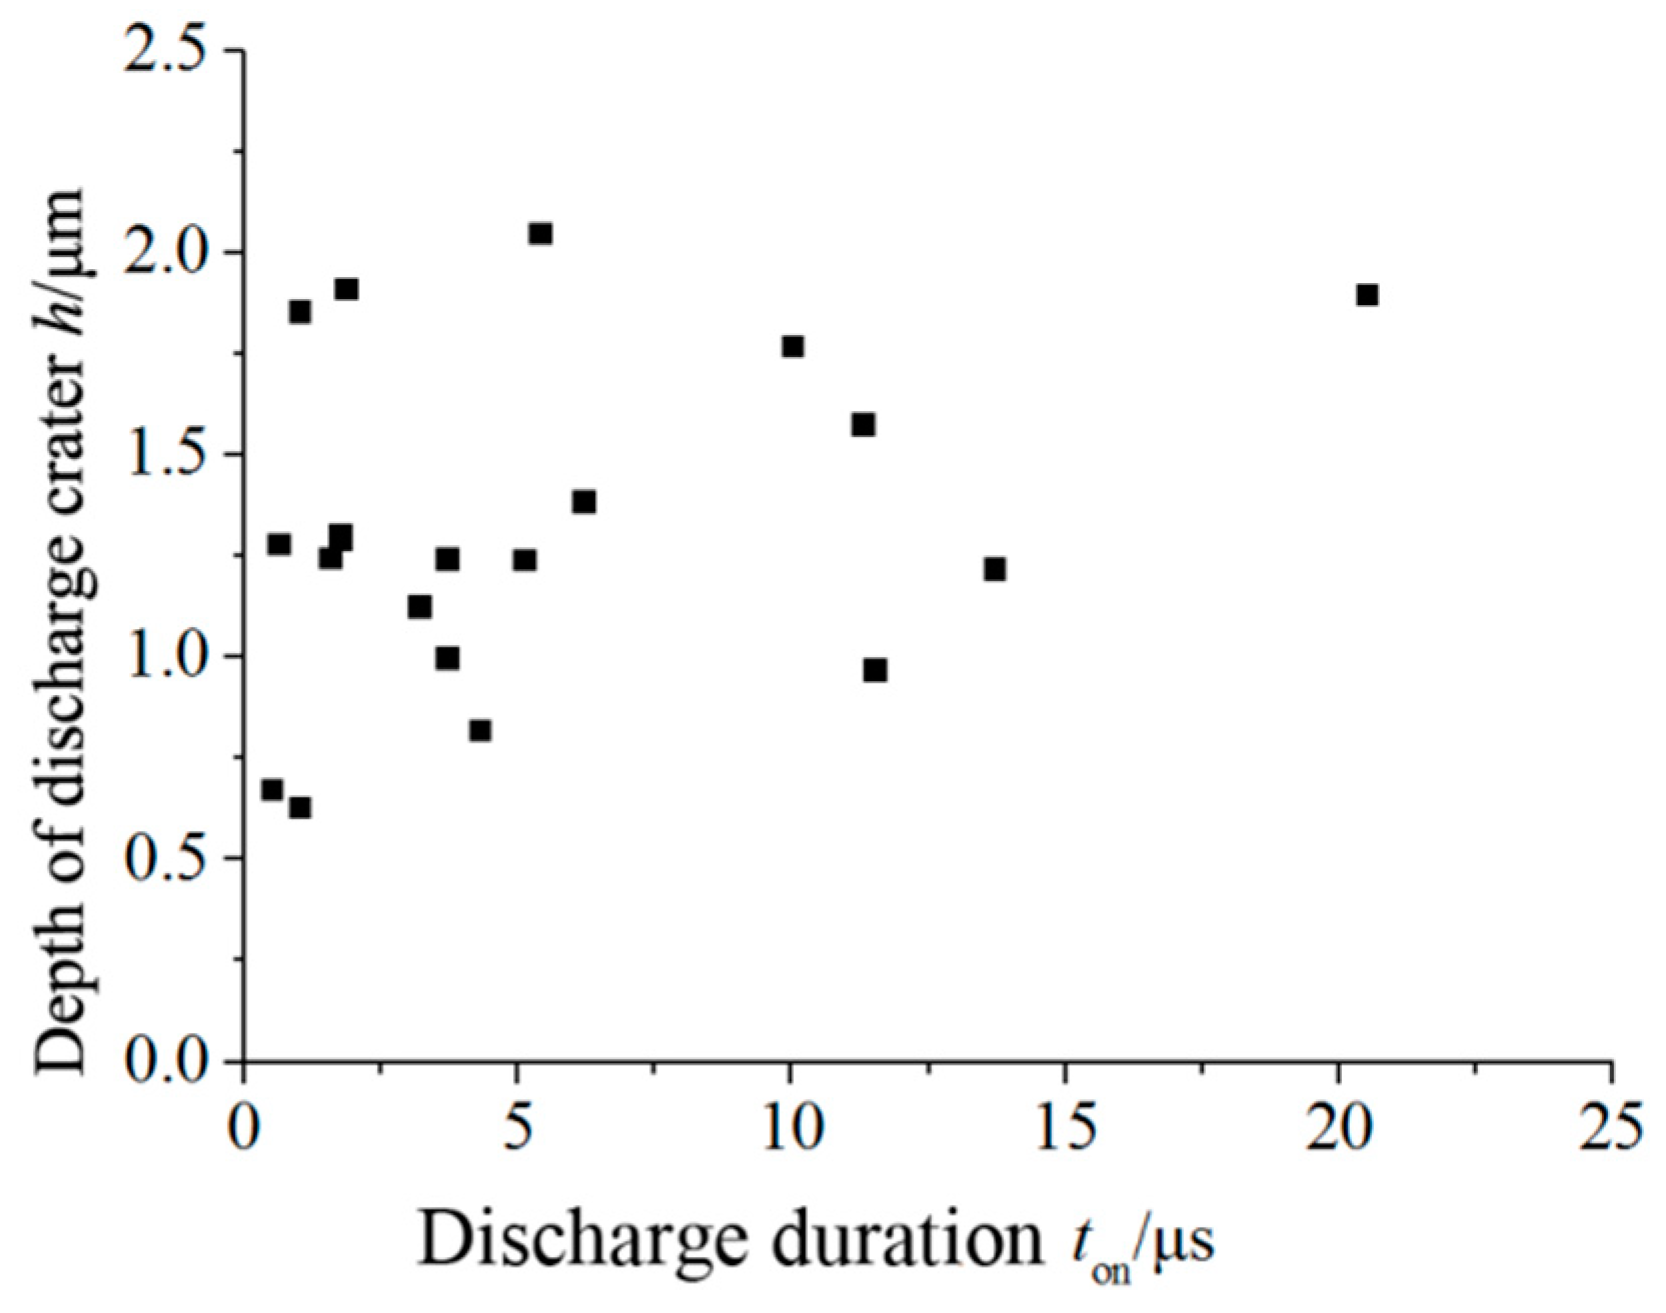
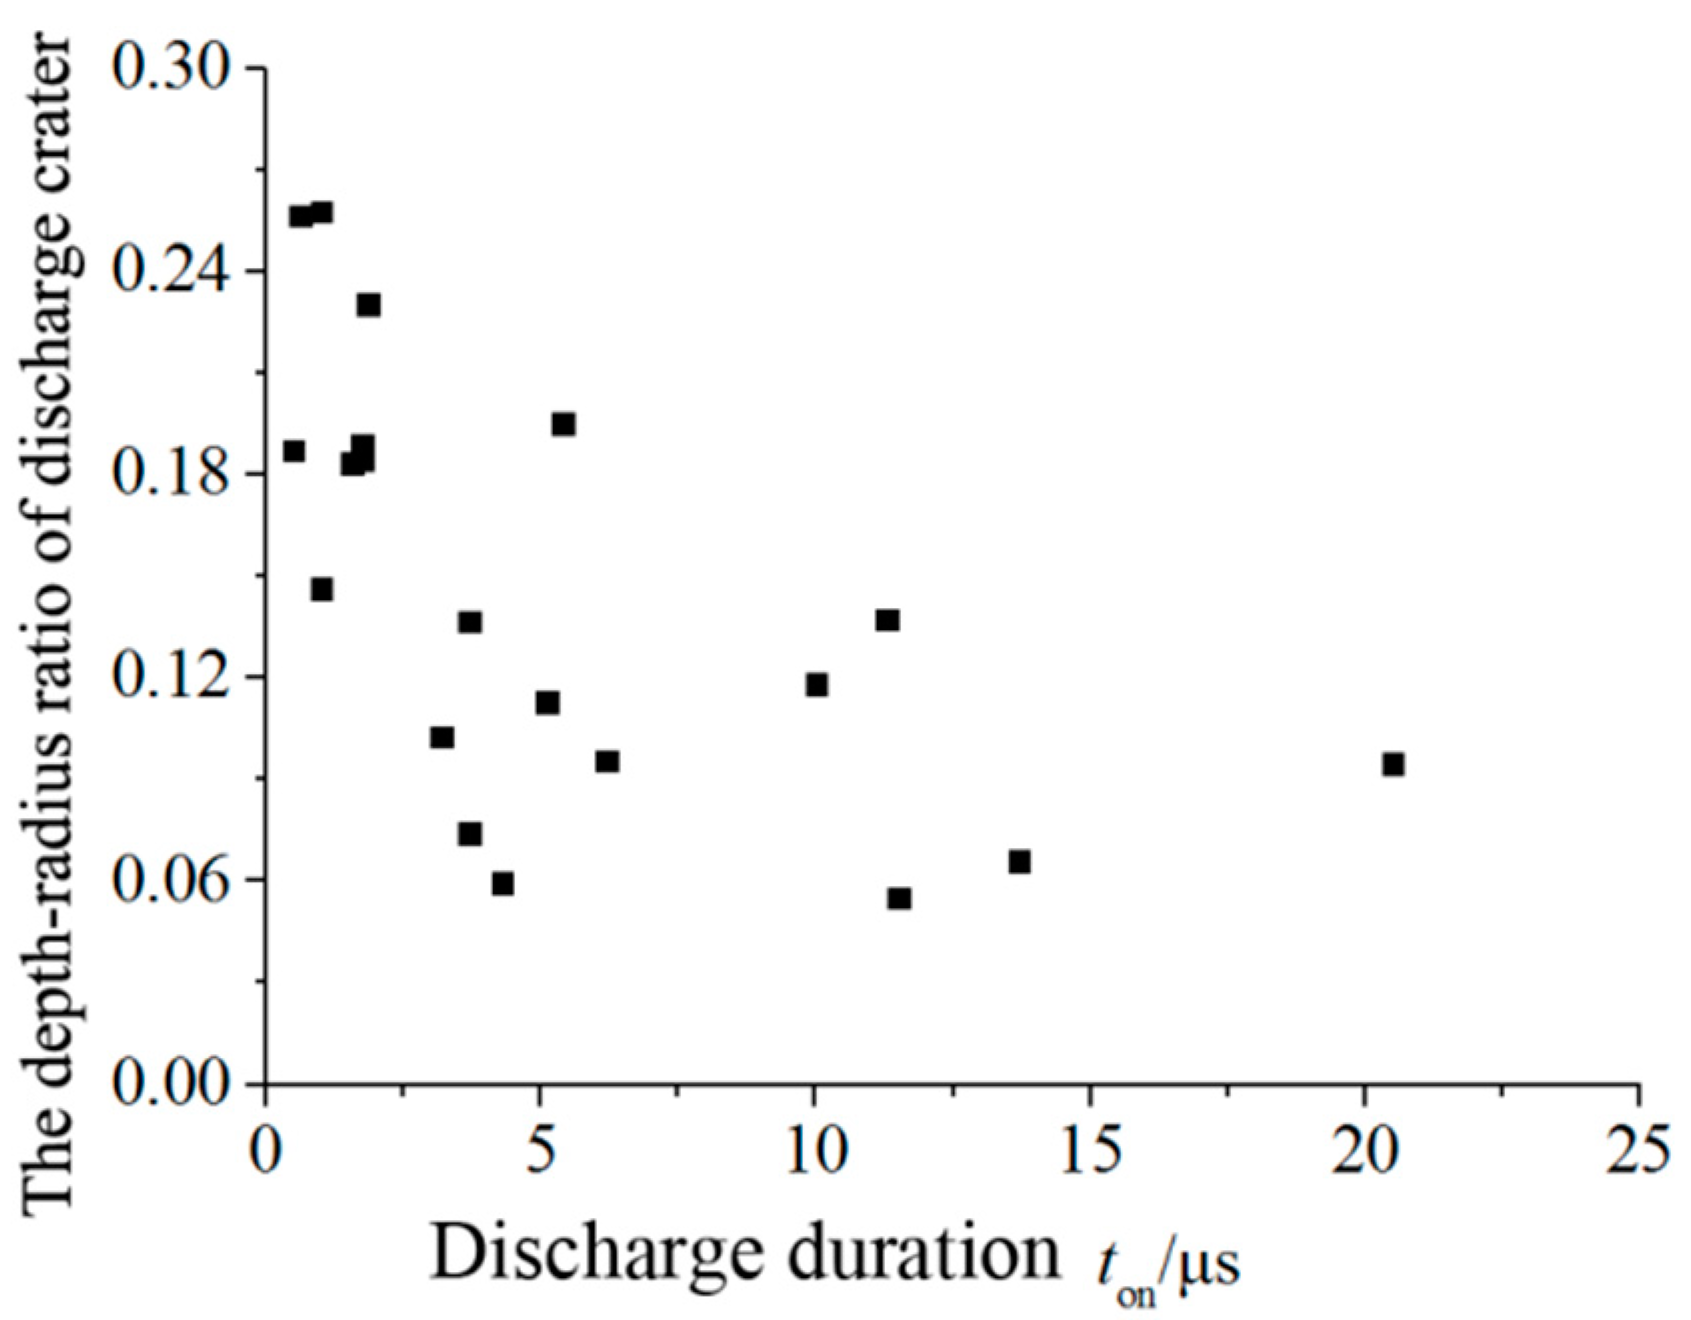
3.4. Effect of Discharge Duration on the Depth of Discharge Crater

The variation trend of the discharge crater depth and depth-radius ratio with the discharge duration is shown in Figure 6 and Figure 7. As can be seen from Figure 6, the depth of the discharge crater fluctuates in the range of 0.5–2 μm, which is immune to discharge duration. In the initial stage of discharge, the energy density, temperature, and pressure of discharge plasma channel are very high, causing the electrode material melt and vaporize instantaneously, and is ejected in the form of liquid or vapor torch under the action of high pressure. With the increase of discharge duration, the plasma expands rapidly, and the temperature and pressure in discharge plasma decreases continuously. Although more materials are melted, a considerable portion of the melted materials are not thrown off the electrode surface, but flow slowly around and solidify again on the electrode surface after discharge. In addition, because of the oscillation characteristics of discharge plasma, the ejection of molten materials is stochastic, causing the discharge crater depth fluctuates in a larger range without being affected by discharge duration.
From Figure 7, it can be seen that the ratio of discharge crater depth to radius varies in the range of 0.05–0.25, and decreases with the increase of discharge duration. After discharge, with the increase of discharge duration, the discharge crater radius increases rapidly, then increases slowly until it tends to be flat, while the discharge crater depth fluctuates in a larger range. Therefore, the discharge crater depth-radius ratio fluctuates in a larger range with the increase of the discharge duration, and then decreases gradually.

4. Conclusions

The main conclusions are as follows:
  • The expansion acceleration, internal pressure, temperature, and electron density of the discharge plasma decrease with the increase of discharge duration, while the radius and expansion velocity of the discharge plasma increase with the increase of discharge duration, and finally the discharge plasma reach the state of shape-position equilibrium.
  • Discharge maintenance voltage and discharge current are not affected by discharge duration and open circuit voltage. The resistance of discharge plasma is estimated to fluctuate in the range of 38–45 Ω.
  • The energy efficiency of micro-EDM is very high when discharge duration is less than 4 μs, and decreases gradually as the discharge duration increases.
  • By regression analysis, the regression model of discharge crater volume variation with discharge duration is obtained. The model can be used to effectively predict the discharge crater volume when copper is used as workpiece, and can provide theoretical guidance for micro-EDM.
  • The discharge duration has no significant effect on the discharge crater depth. As the radius of discharge crater increases, the ratio of depth to radius of discharge crater fluctuates in a larger range, and decreases gradually with the increase of discharge duration.

Author Contributions

Conceptualization, Q.L. and Q.Z.; methodology, Q.L.; software, M.Z.; validation, Q.L. and Q.Z.; formal analysis, F.Y.; investigation, M.Z.; resources, Q.Z.; data curation, F.Y.; writing—original draft preparation, Q.L.; writing—review and editing, Q.L. and Q.Z.; supervision, Q.L. and Q.Z.; project administration, Q.L.; funding acquisition, Q.L. and Q.Z.

Funding

This research was funded by the Natural Science Foundation of China (NSFC) (Grant Nos. 51775316, 51375274, 51705236), Natural Science Foundation of Shandong Province (Grant No. ZR2019BEE037), Interdisciplinary Training Project of Shandong University (Grant No. 2016 JC008), and Applied Basic Research Program of Qingdao (Grant No. 18-2-2-6-jch).

Conflicts of Interest

The authors declare no conflict of interest.

References

  1. Zhu, X.; Xu, Q.; Li, H.; Liu, M.; Li, Z.; Yang, K.; Zhao, J.; Qian, L.; Peng, Z.; Zhang, G.; et al. Fabrication of high-performance silver mesh for transparent glass heaters via electric-field-driven microscale 3D Printing and UV-assisted microtransfer. Adv. Mater. 2019, 31, 1902479. [Google Scholar] [CrossRef] [PubMed]
  2. Peng, Z.; Feng, T.; Wei, Z.; Zhang, Y.; Li, Y. Directly writing patterning of conductive material by high voltage induced weak electric arc machining (HV-μEAM). Coatings 2019, 9, 538. [Google Scholar] [CrossRef]
  3. Rouniyar, A.K.; Shandilya, P. Fabrication and experimental investigation of magnetic field assisted powder mixed electrical discharge machining on machining of aluminum 6061 alloy. Proc. Inst. Mech. Eng. Part B J. Eng. Manuf. 2019, 233, 2283–2291. [Google Scholar] [CrossRef]
  4. Prakash, V.; Kumar, P.; Singh, P.; Hussain, M.; Das, A.; Chattopadhyaya, S. Micro-Electrical discharge machining of difficult-to-machine materials: A review. Proc. Inst. Mech. Eng. Part B J. Eng. Manuf. 2019, 233, 339–370. [Google Scholar] [CrossRef]
  5. Gill, A.S.; Kumar, S. Micro-Hardness evaluation for surface alloying of H11 die steel with Cu–Cr–Ni powder metallurgy tool in electrical discharge machining. Proc. Inst. Mech. Eng. Part B J. Eng. Manuf. 2018, 232, 438–450. [Google Scholar] [CrossRef]
  6. Liu, Q.; Zhang, Q.; Zhang, M.; Zhang, J. Review of size effects in micro electrical discharge machining. Precis. Eng. 2016, 44, 29–40. [Google Scholar] [CrossRef]
  7. Liu, Q.; Zhang, Q.; Zhang, M.; Yang, F.; Rajurkar, K.P. Effects of surface layer of AISI 304 on micro EDM performance. Precis. Eng. 2019, 57, 195–202. [Google Scholar] [CrossRef]
  8. Dhanik, S.; Joshi, S.S. Modeling of a single resistance capacitance pulse discharge in micro-electro discharge machining. J. Manuf. Sci. Eng. 2005, 127, 759–767. [Google Scholar] [CrossRef]
  9. Asad, A.B.M.A.; Islam, M.T.; Masaki, T.; Rahman, M.; Wong, Y.S. Analysis of micro-EDM electric characteristics employing plasma property. CIRP J. Manuf. Sci. Technol. 2018, 20, 36–50. [Google Scholar] [CrossRef]
  10. Yang, F.; Qian, J.; Wang, J.; Reynaerts, D. Simulation and experimental analysis of alternating-current phenomenon in micro-EDM with a RC-type generator. J. Mater. Process. Technol. 2018, 255, 865–875. [Google Scholar] [CrossRef]
  11. Zhao, Y.; Kunieda, M.; Abe, K. EDM mechanism of single crystal SiC with respect to thermal, mechanical and chemical aspects. J. Mater. Process. Technol. 2016, 236, 138–147. [Google Scholar] [CrossRef]
  12. Wong, Y.S.; Rahman, M.; Lim, H.S.; Han, H.; Ravi, N. Investigation of micro-EDM material removal characteristics using single RC-pulse discharges. J. Mater. Process. Technol. 2003, 140, 303–307. [Google Scholar] [CrossRef]
  13. Wang, J.; Yang, F.; Qian, J.; Reynaerts, D. Study of alternating current flow in micro-EDM through real-time pulse counting. J. Mater. Process. Technol. 2016, 231, 179–188. [Google Scholar] [CrossRef]
  14. Ndaliman, M.B.; Khan, A.A.; Ali, M.Y. Influence of electrical discharge machining process parameters on surface micro-hardness of titanium alloy. Proc. Inst. Mech. Eng. Part B J. Eng. Manuf. 2013, 227, 460–464. [Google Scholar] [CrossRef]
  15. Assarzadeh, S.; Ghoreishi, M. Prediction of root mean square surface roughness in low discharge energy die-sinking EDM process considering the effects of successive discharges and plasma flushing efficiency. J. Manuf. Process. 2017, 30, 502–515. [Google Scholar] [CrossRef]
  16. Roy, T.; Datta, D.; Balasubramaniam, R. Numerical modelling, simulation and fabrication of 3-D hemi-spherical convex micro features using Reverse Micro EDM. J. Manuf. Process. 2018, 32, 344–356. [Google Scholar] [CrossRef]
  17. Halpern, B.; Gomer, R. Field emission in liquids. J. Chem. Phys. 1969, 51, 1031–1047. [Google Scholar] [CrossRef]
  18. Jahan, M.P.; Rahman, M.; Wong, Y.S. Modelling and experimental investigation on the effect of nanopowder-mixed dielectric in micro-electrodischarge machining of tungsten carbide. Proc. Inst. Mech. Eng. Part B J. Eng. Manuf. 2010, 224, 1725–1739. [Google Scholar] [CrossRef]
  19. Watson, P.K. Electrostatic and hydrodynamic effects in the electrical breakdown of liquid dielectrics. IEEE Trans. Electr. Insul. 1985, EI-20, 395–399. [Google Scholar] [CrossRef]
  20. Chu, X.; Zhu, K.; Wang, C.; Hu, Z.; Zhang, Y. A study on plasma channel expansion in micro-EDM. Mater. Manuf. Process. 2016, 31, 381–390. [Google Scholar] [CrossRef]
  21. Zhu, J.; Gao, J.; Ehn, A.; Aldén, M.; Li, Z.; Moseev, D.; Kusano, Y.; Salewski, M.; Alpers, A.; Gritzmann, P.; et al. Measurements of 3d slip velocities and plasma column lengths of a gliding arc discharge. Appl. Phys. Lett. 2015, 106, 044101. [Google Scholar] [CrossRef]
Figure 1. Figure of discharge crater captured by scanning probe microscope (discharge duration is 1.6 μs).
Coatings 09 00718 g001
Figure 2. The effect of discharge duration on discharge current (a) and voltage (b).
Coatings 09 00718 g002
Figure 3. Waveform of different discharge states. (a) from open-circuit to spark discharge and then to short-circuit; (b) from spark discharge to open-circuit; (c) from spark discharge state to short-circuit; (d) from spark discharge state to short-circuit and then to spark discharge.
Coatings 09 00718 g003
Figure 4. Effect of discharge duration on discharge crater and the heat-affected zone radius.
Coatings 09 00718 g004
Figure 5. Effect of the discharge duration on discharge crater volume.
Coatings 09 00718 g005
Figure 6. Effect of discharge duration on discharge crater depth.
Coatings 09 00718 g006
Figure 7. Effect of discharge duration on the depth–radius ratio of discharge crater.
Coatings 09 00718 g007
Table 1. Main machining parameters.
Machining ParametersValue
Open circuit voltage (U/V)90, 120
Capacitance (C/pF)1000
Electrode diameter (D/μm)200
Pulse width (ton/μs)1, 5, 10, 20

