Article

Effect of TiO2 Sol and PTFE Emulsion on Properties of Cu–Sn Antiwear and Friction Reduction Coatings

1
College of Mechanical and Electrical Engineering, Harbin Engineering University, Harbin 150001, China
2
College of Materials Science and Chemical Engineering, Harbin Engineering University, Harbin 150001, China
*
Author to whom correspondence should be addressed.
Coatings 2019, 9(1), 59; https://doi.org/10.3390/coatings9010059
Submission received: 22 November 2018 / Revised: 13 January 2019 / Accepted: 16 January 2019 / Published: 19 January 2019
(This article belongs to the Special Issue Tribology and Surface Engineering)

Abstract

:
The aim of this paper is to obtain Cu–Sn composite coatings incorporated with PTFE and TiO2 particles, which have superior antiwear and friction reduction properties. Electrodeposition was carried out in a pyrophosphate electrolyte, and the electrochemical behavior of the plating solutions was estimated. PTFE emulsion and TiO2 sol were prepared and used, of which the average particle sizes were less than 283 and 158 nm, respectively. Then, four different types of coatings, Cu–Sn, Cu–Sn–TiO2, Cu–Sn–PTFE and Cu–Sn–PTFE–TiO2, were electroplated with a pulsed power supply. Their microstructure, composition, microhardness, corrosion resistance and tribological properties were then analyzed and compared in detail. The results show that both PTFE and TiO2 are able to improve coating structure and corrosion resistance, while they have different effects on hardness and tribological properties. However, the presence of both PTFE and TiO2 in the deposited coating leads to a lower friction coefficient of 0.1 and higher wear and corrosion resistance.

1. Introduction

Copper–Tin (Cu–Sn) alloys are widely applied to various kinds of friction parts for their excellent self-lubricating properties, which can effectively reduce friction and wear under oil-free lubrication conditions [1,2]. In recent decades, electroplating Cu–Sn base coatings has attracted extensive interest. Initially, researchers focused on experimental parameters and electrolyte composition regarding enhanced properties. Various baths appeared and were used for electrodeposition of Cu–Sn alloy, such as phosphate fluoborate, boron–fluoride, pyrophosphate and cyanide based [3,4]. In addition, some new process methods were explored to enhance the self-lubricating properties of Cu–Sn composite coatings [5].
In recent years, adding self-lubricating particles to plating solutions seems to have become an effective method to further reduce the friction coefficient of coatings. It is reported that the applying of multi-walled carbon nanotubes reduces the friction coefficient and wear loss of Copper-Tin alloy to 28% and 32%, respectively [6]. That aside, as a potential lubricating material, polytetrafluoroethylene (PTFE) is usually adapted to modify compositing coatings. With the addition of PTFE to plating solutions, Balaji et al. [7] and Du et al. [8] obtained Cu–Sn–PTFE and Cu–Sn–Zn–PTFE composite coatings, respectively. Both of the coatings possessed superior self-lubricating properties. In the course of friction, the composite particles precipitated from the coating and formed a lubricating film to reduce friction and wear [9].
Evidently, the presence of PTFE soft particles lowers the friction coefficient of the Cu–Sn alloy but the shortcomings of a Cu–Sn alloy are also obvious, including softness and weak carrying capacity. More importantly, the coatings are seriously damaged under a heavy load. Therefore, it becomes more and more important to improve the hardness and wear resistance of the composite coatings and meet the requirements of a heavier load and harsh working conditions.
There are some studies with the aim of improving the composite coatings’ hardness and wear resistance by co-depositing hard particles or through various electrodeposition methods [10,11,12,13]. With the addition of nano-Al2O3 to the electroless Ni–P–PTFE alloy plating solution, Xu et al. [14] developed a Ni–P–PTFE–Al2O3 composite coating with increased hardness and wear resistance. Chen et al. [15] obtained a Ni–P matrix composite coating containing nano-Al2O3 particles and PTFE particles by utilizing nano-Al2O3 and PTFE in the plating solution. The evidence shows that the incorporation of two different kinds of particles enhances the wear resistance along with reducing the friction coefficient. In fact, nano-sized particles are more prone to agglomerating in an electroplating bath. Although various surfactants were adapted in an attempt to disperse nano-particles, it was still difficult to obtain a uniformly dispersed solution, which is one of the main problems associated with fabrication of nano-composite coatings.
To overcome the non-uniformity of the dispersion particles, coating preparation was also conducted through combining a sol method with a traditional electrodeposition method by some researchers. Chen et al. added TiO2 Sol into the conventional acid Ni electroplating solution to strengthen the coatings [16,17]. The research showed that the nano TiO2 particles embedded in the deposited metal matrix restrain the growth of the deposited metal, leading to the formation of a more uniform and fine microstructure. Wang et al. [18,19] obtained sol-reinforced Ni–B–TiO2 and Au–Ni–TiO2 nano-composite coatings. Compared with Ni–B and Au–Ni coatings, respectively, their mechanical properties and wear resistance improved greatly along with the increasing nano-hardness. Based on those analyses, it can be concluded that sol is a highly dispersed system which can replace traditional powder in the plating solution to promote uniform dispersion of hard particles in the coating. Once nano-TiO2 is embedded in the deposited metal layer, and restrain the growth of the deposited metal, a more uniform and fine microstructure could be achieved.
Thus, the objective of the present study is to obtain a Cu–Sn base composite coating with superior comprehensive properties. Based on this, TiO2 sol and PTFE emulsion were prepared and added into the solution to codeposite with the Cu–Sn alloy. Simultaneously, the electrodepositional behavior of the bath, the particle size and dispersion state of the nanoparticles were studied. Four different kinds of Cu–Sn base coatings, Cu–Sn, Cu–Sn–PTFE, Cu–Sn–TiO2 and Cu–Sn–PTFE–TiO2, were obtained and their properties were evaluated and compared, especially in terms of tribological and anti-corrosion properties.

2. Experimental Section

2.1. Electroplating Processes and Methods

Stainless steel 9Cr18 (Huatai, Yangzhou, China) was chosen as a cathode substrate with dimensions of 28 mm × 25 mm × 1 mm. Prior to electroplating, the substrate was ground by using CW (CW, type of abrasive paper made in Yuli, Xianning, China) series sand paper of 1500 grade, then degreased ultrasonically in alkaline and acid solution alternately.
During electroplating, a unidirectional pulse current from Shenzhen Shicheng Electronic Technology Co., Ltd. (Shenzhen, China) was used. The main parameters involve average current (Ia = 25 mA/cm2), pulse frequency (f = 2000 Hz) and duty cycle (θ = 60%). The corresponding current-on times (ton), current-off times (toff) and peak current density (Ip) are respectively 3 ms, 2 ms and 41.7 mA/cm2. Many experiments were carried out to obtain appropriate particle concentration of PTFE emulsion and TiO2 sol [20]. On the basis of previous experiments, the concentration of PTFE and TiO2 were determined at 15 and 1 g/L, respectively. The plating solution compositions and technological parameters are shown in Table 1.
In the plating solution, the main salt ions are Cu2+ and SnO32−. Potassium pyrophosphate (K4P2O7·3H2O) is the main complexing agent, which provides P2O74+ to cause a complexation reaction with Cu2+ and Sn2+. This transforms the discharge ion of tin from SnO32− to [SnP2O74+]4− and promotes the co-deposition of copper and tin. Potassium sodium tartrate (KNaC4H4O6·4H2O) is an auxiliary coordination agent, which can prevent the precipitation of copper hydroxide and the hydrolysis of stannate. Simultaneously, with relatively positive discharge potential, potassium nitrate (KNO3) as a depolarizing agent can effectively reduce the polarization of the cathode and significantly promote tin deposition. Similarly, sodium citrate (Na3C6H5O7·2H2O) is an additive, which can also reduce the cathode polarization and indent the deposition potential of Cu2+ and Sn4+.
The concentrations of PTFE and TiO2 during deposition in each plating solution are shown in Table 2. In the bath solution, the Cu2+, Sn4+, PTFE and TiO2 particles all have a positive charge. Under the influence of an electric field force, the particles move towards the cathode phase and are adsorbed on the cathode material before, finally, the Cu–Sn–PTFE–TiO2 coating forms. The formation process is shown in Figure 1.

2.2. Characterization of Plating Solution and Cu–Sn–PTFE–TiO2 Composite Coatings

A 380ZLS model laser particle size/potential meter (Particle Sizing Systems, Port Richey, FL, USA) was used to measure the size of the TiO2 sol and PTFE particles. In addition, the plating solutions of Cu–Sn–PTFE, Cu–Sn–TiO2 and Cu–Sn–PTFE–TiO2 were observed by transmission electron microscopy (TEM, FEI, Hillsboro, OR, USA). The samples for the TEM observation were made in the following way: take a drop of the solution using a plastic dropper and spread it on a micro-grid of carbon film on a copper mesh, then heat it to bake off the alcohol and water using an electric baking lamp. The surface morphologies and compositions of coatings were investigated with scanning electron microscopy (SEM, FEI) and X-ray Fluorescence (XRF, PANalytical, Almelo, the Netherlands). Hardness of the coatings, an average of five indentations, was measured by Vickers Hardness Tester HVS-1000 (Jujing, Shanghai, China) with a load of 2 N for 15 s on the surface.
Tribological properties of coatings were characterized by a friction–abrasion testing machine in room temperature. The friction counterpart was a GCr15 steel ball of 5 mm in diameter. A load of 100 g and a stage rotated speed of 200 r/min were used with a wear time of 10 min for each sample. Finally, the corrosion resistance of coatings was analyzed by Tafel polarization tests, which were conducted in a three-electrode system. The counter electrode was a platinum slice, and the reference electrode was a standard calomel electrode (SCE). The tests were performed in 3.5% NaCl electrolyte with an electrochemical workstation (model CHI660B, Chenhua, Shanghai, China) at a scan rate of 2 mV/s. The electrochemical behavior of the plating solution was also tested with this workstation. The volt–ampere characteristic curves were obtained by linear sweep voltammetry (LVS).

3. Results and Discussion

3.1. Analysis of Plating Solution

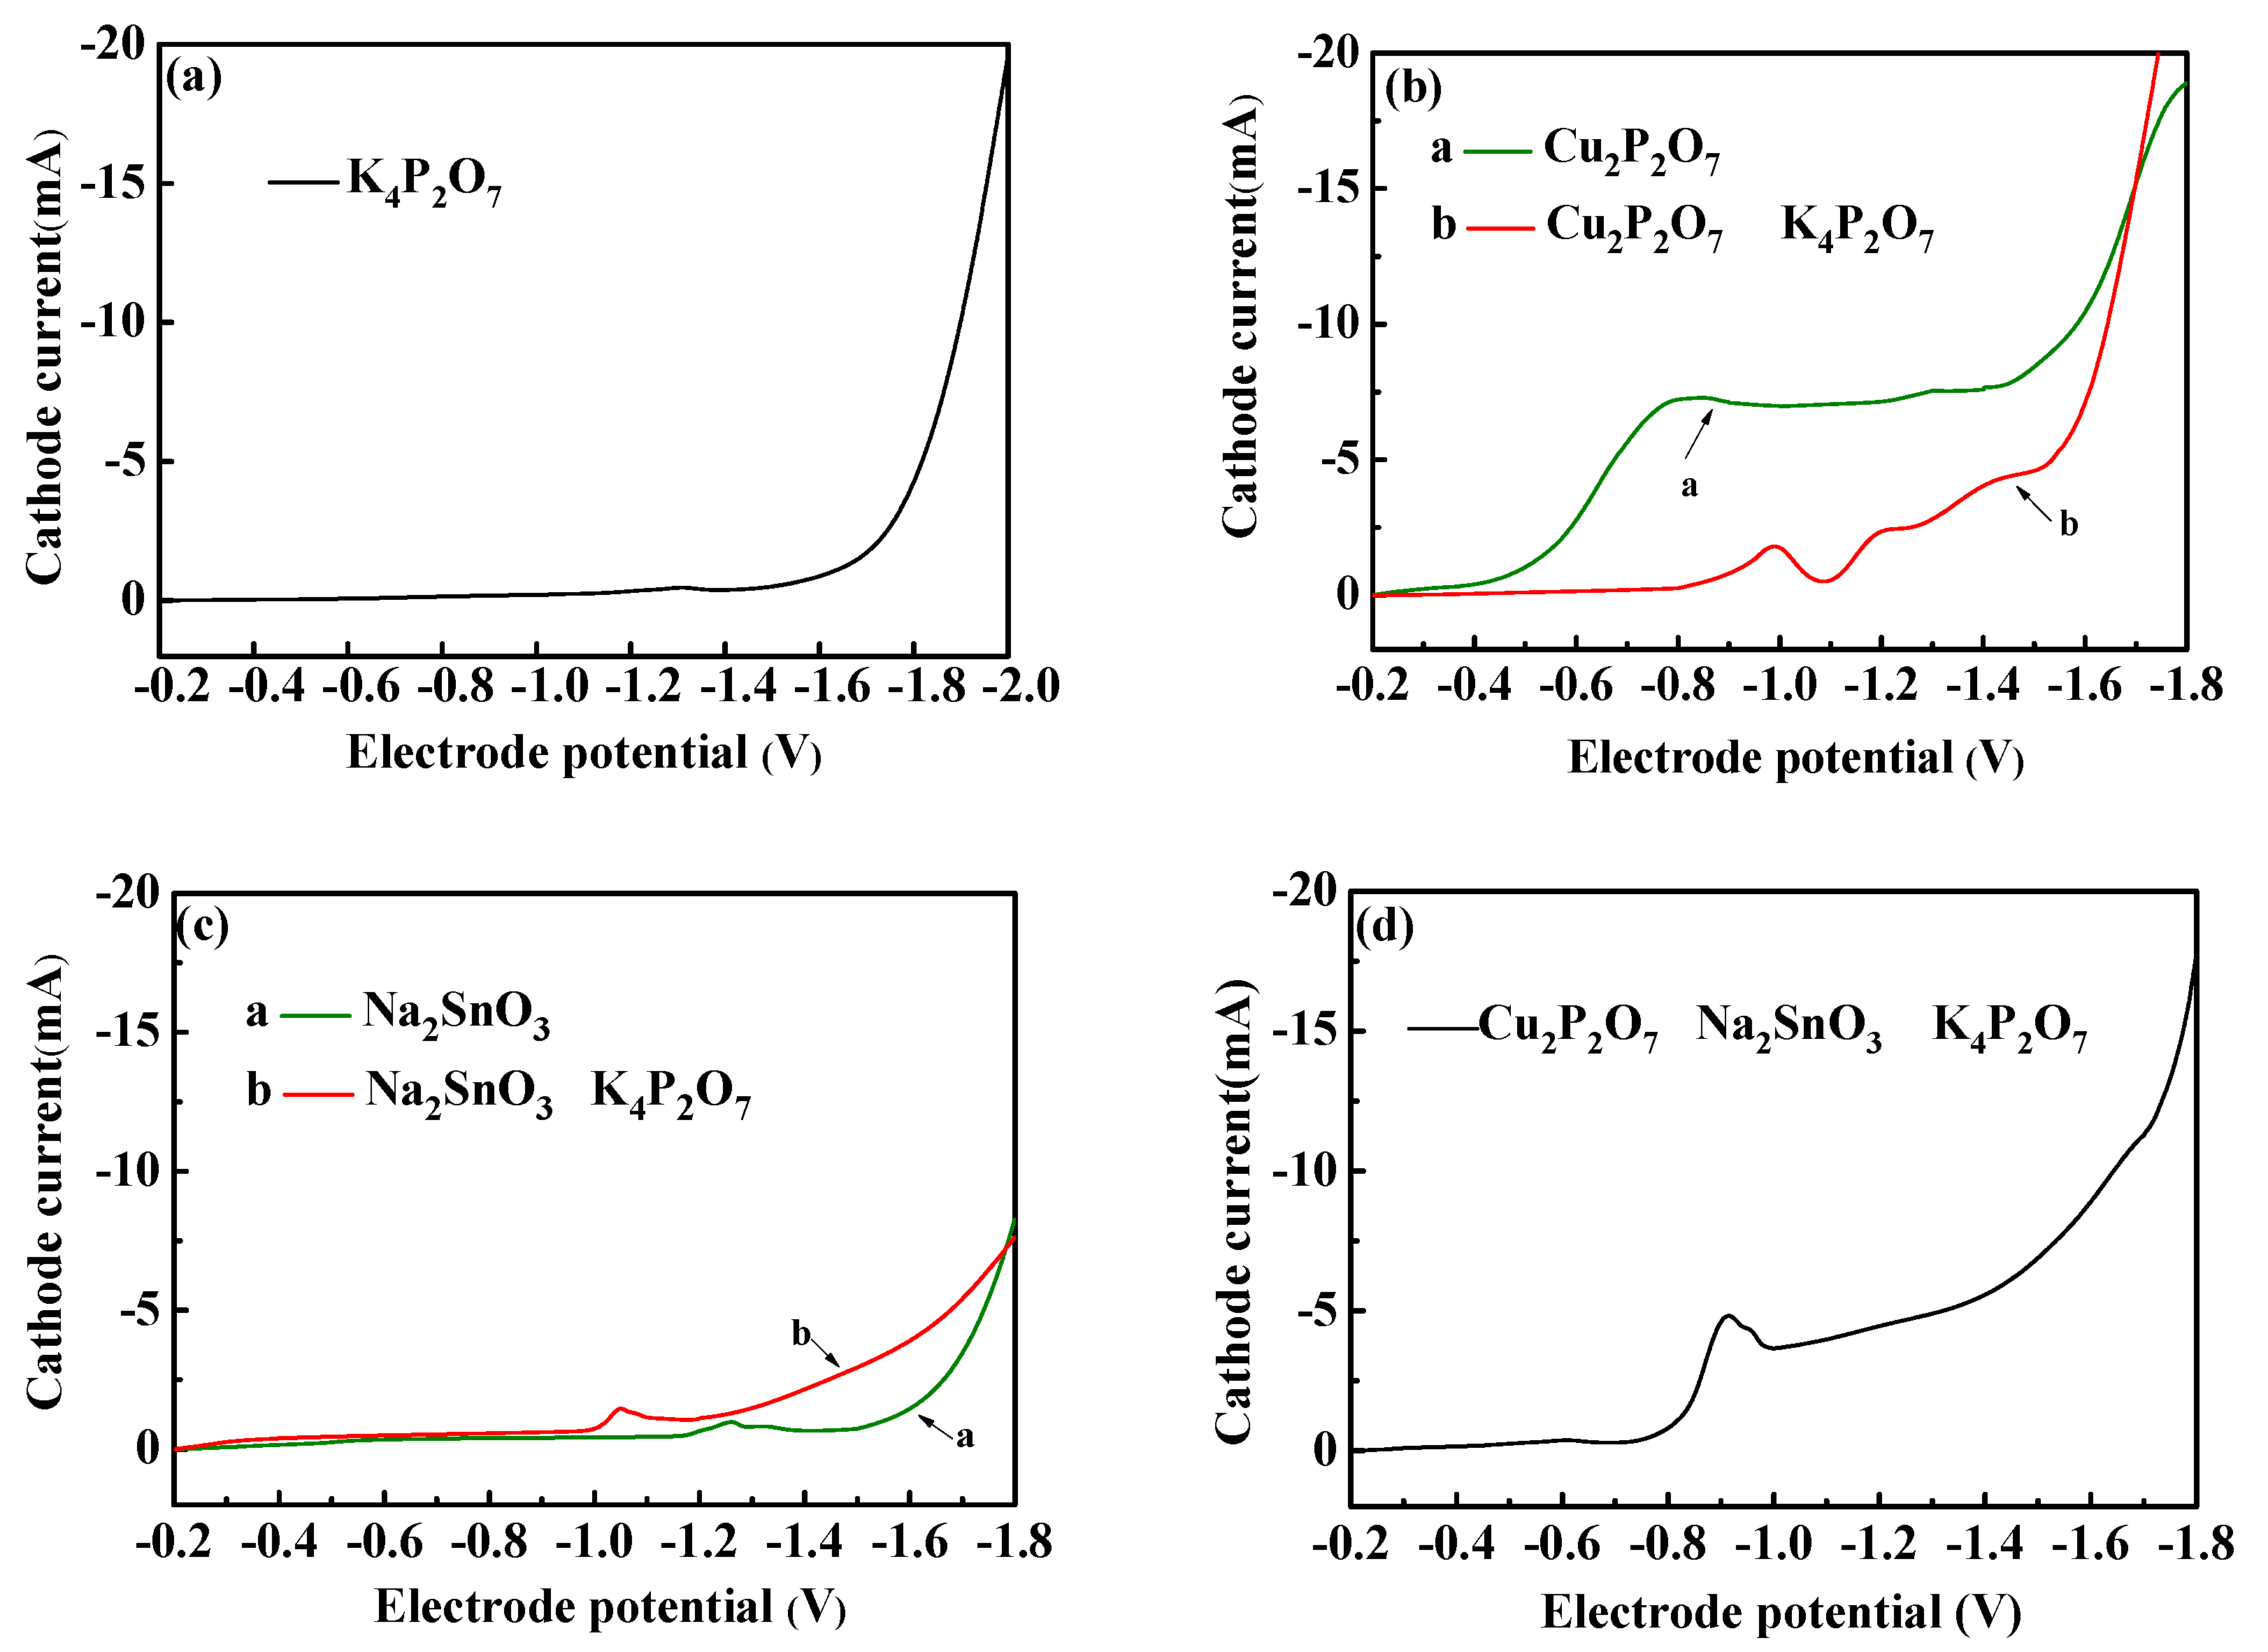
3.1.1. Electrodepositional Behavior of Basic Solution

Figure 2 shows the volt–ampere characteristic curves (LSV) of the solutions, including K4P2O7. The LSV of the solution with just K4P2O7·3H2O (260 g/L) is shown in Figure 2a, which shows the current rising gradually with the potential negative shift. Although hydrogen evolution starts to occur when the potential goes negative to −1.6 V, there is no other reduction peak during the scanning range (−0.2~−1.6 V) and the solution exhibits good stability. The LSV of the solutions with Cu2P2O7·4H2O (20 g/L) are shown in Figure 2b. It can be seen that the cathode current starts to rise at −0.4 V due to the reduction of Cu2+ ions to Cu metal (curve a in Figure 2b). With the addition of K4P2O7·3H2O (260 g/L), cathode potential of Cu shifts to approximately −1.0 (curve b in Figure 2b).
The LSV of Sn deposition is shown in Figure 2c. With Na2SnO3·3H2O (40 g/L) and K4P2O7·3H2O (260 g/L) in the solution, the deposition of Sn2+ ions to Sn metal starts to occur at −1.25 V. With the addition of K4P2O7·3H2O (260 g/L), two changes occur: a more positive potential −1.0 V and an increased peak. So, with K4P2O7·3H2O in the solution, the deposition of Sn seems to become easy. Reduction peak is observed at ℡0.9 V from the LSV of the solution containing K4P2O7·3H2O (260 g/L), Cu2P2O7·4H2O (20 g/L) and Na2SnO3·3H2O (40 g/L), shown in Figure 2d. In contrast with Figure 2b,c, the gap between the reduction potentials of Cu and Sn is found to be diminished with the presence of K4P2O7·3H2O. Therefore, the inclusion of K4P2O7·3H2O facilitates the co-deposition by lowering the difference in reduction potentials of the two individual metals (see Figure 2d).

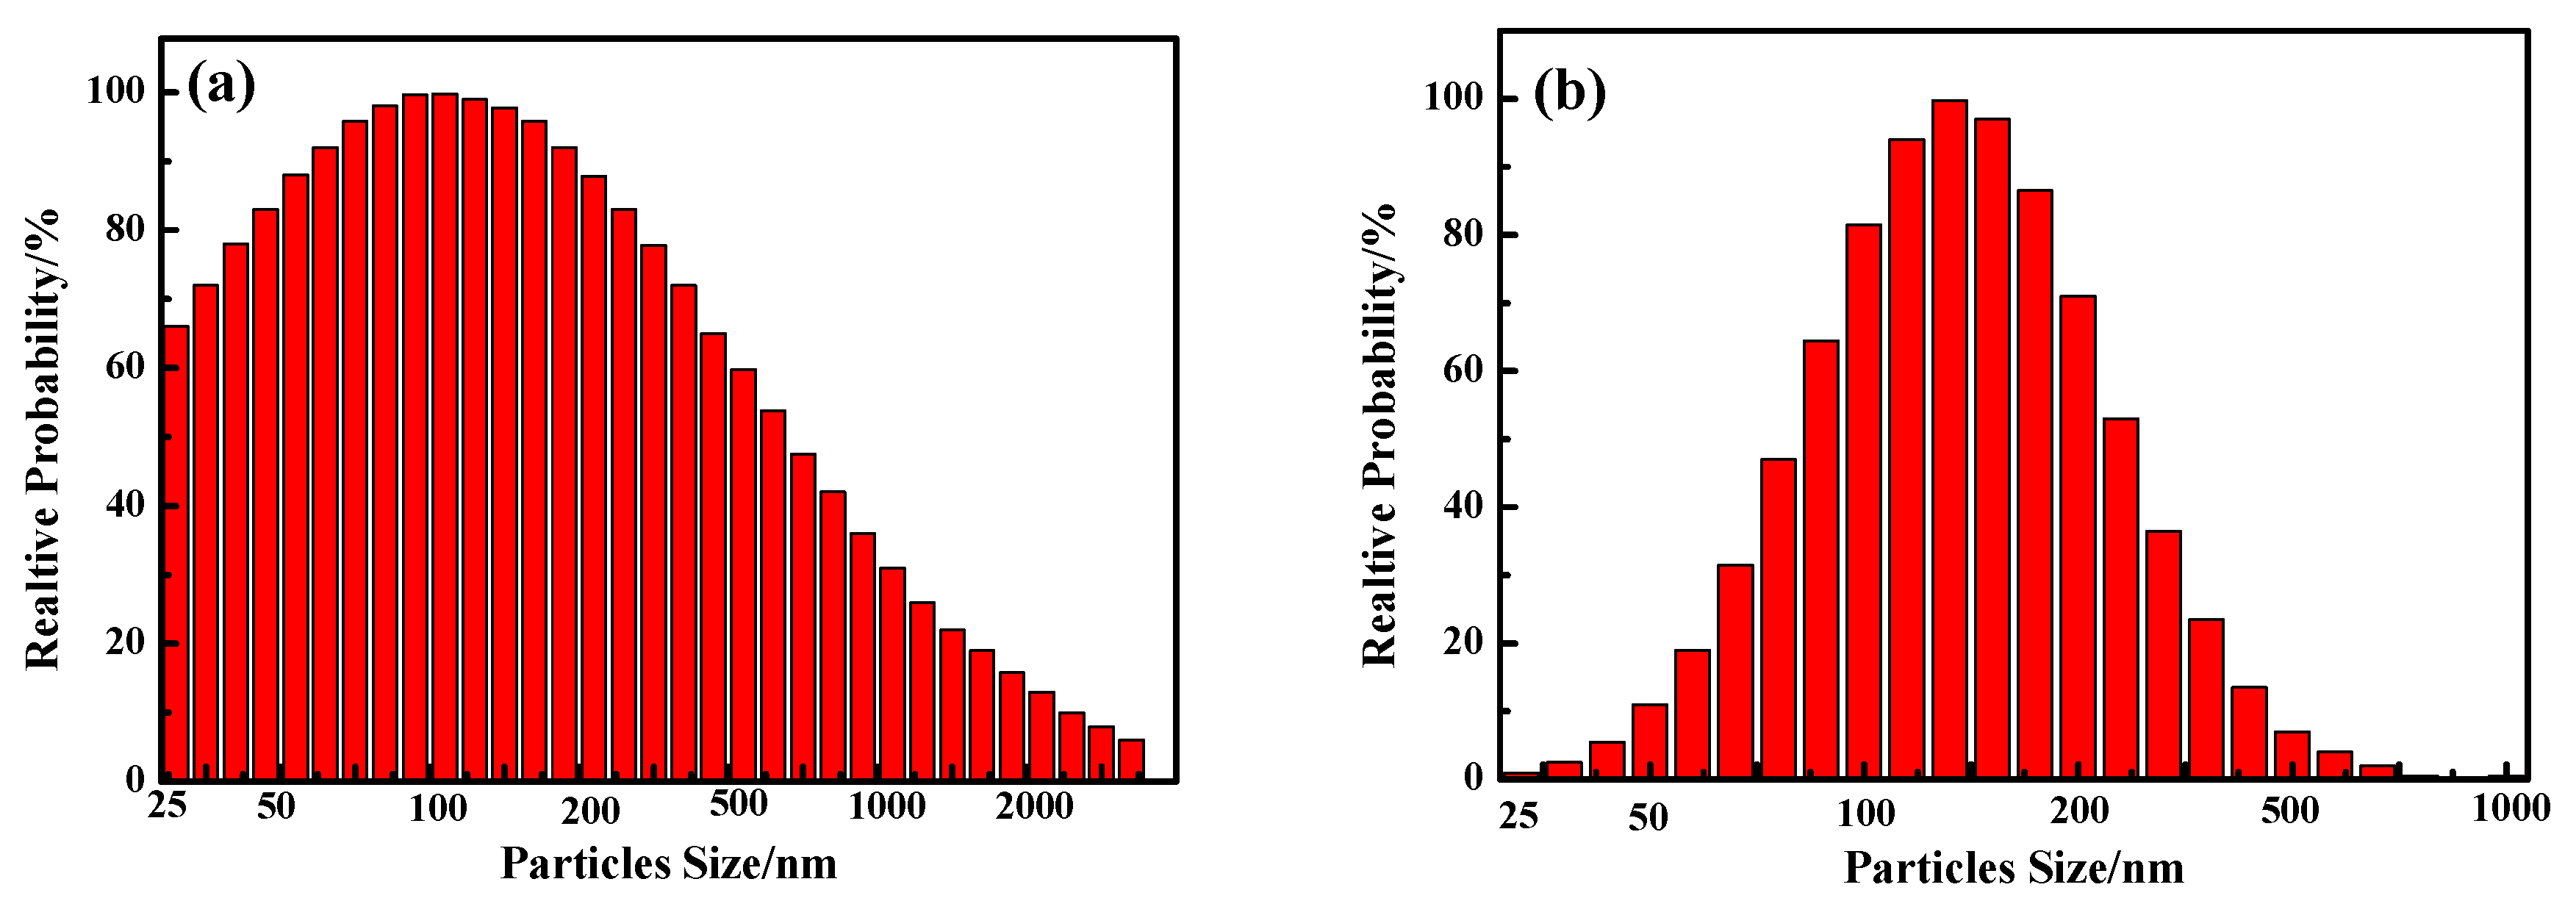
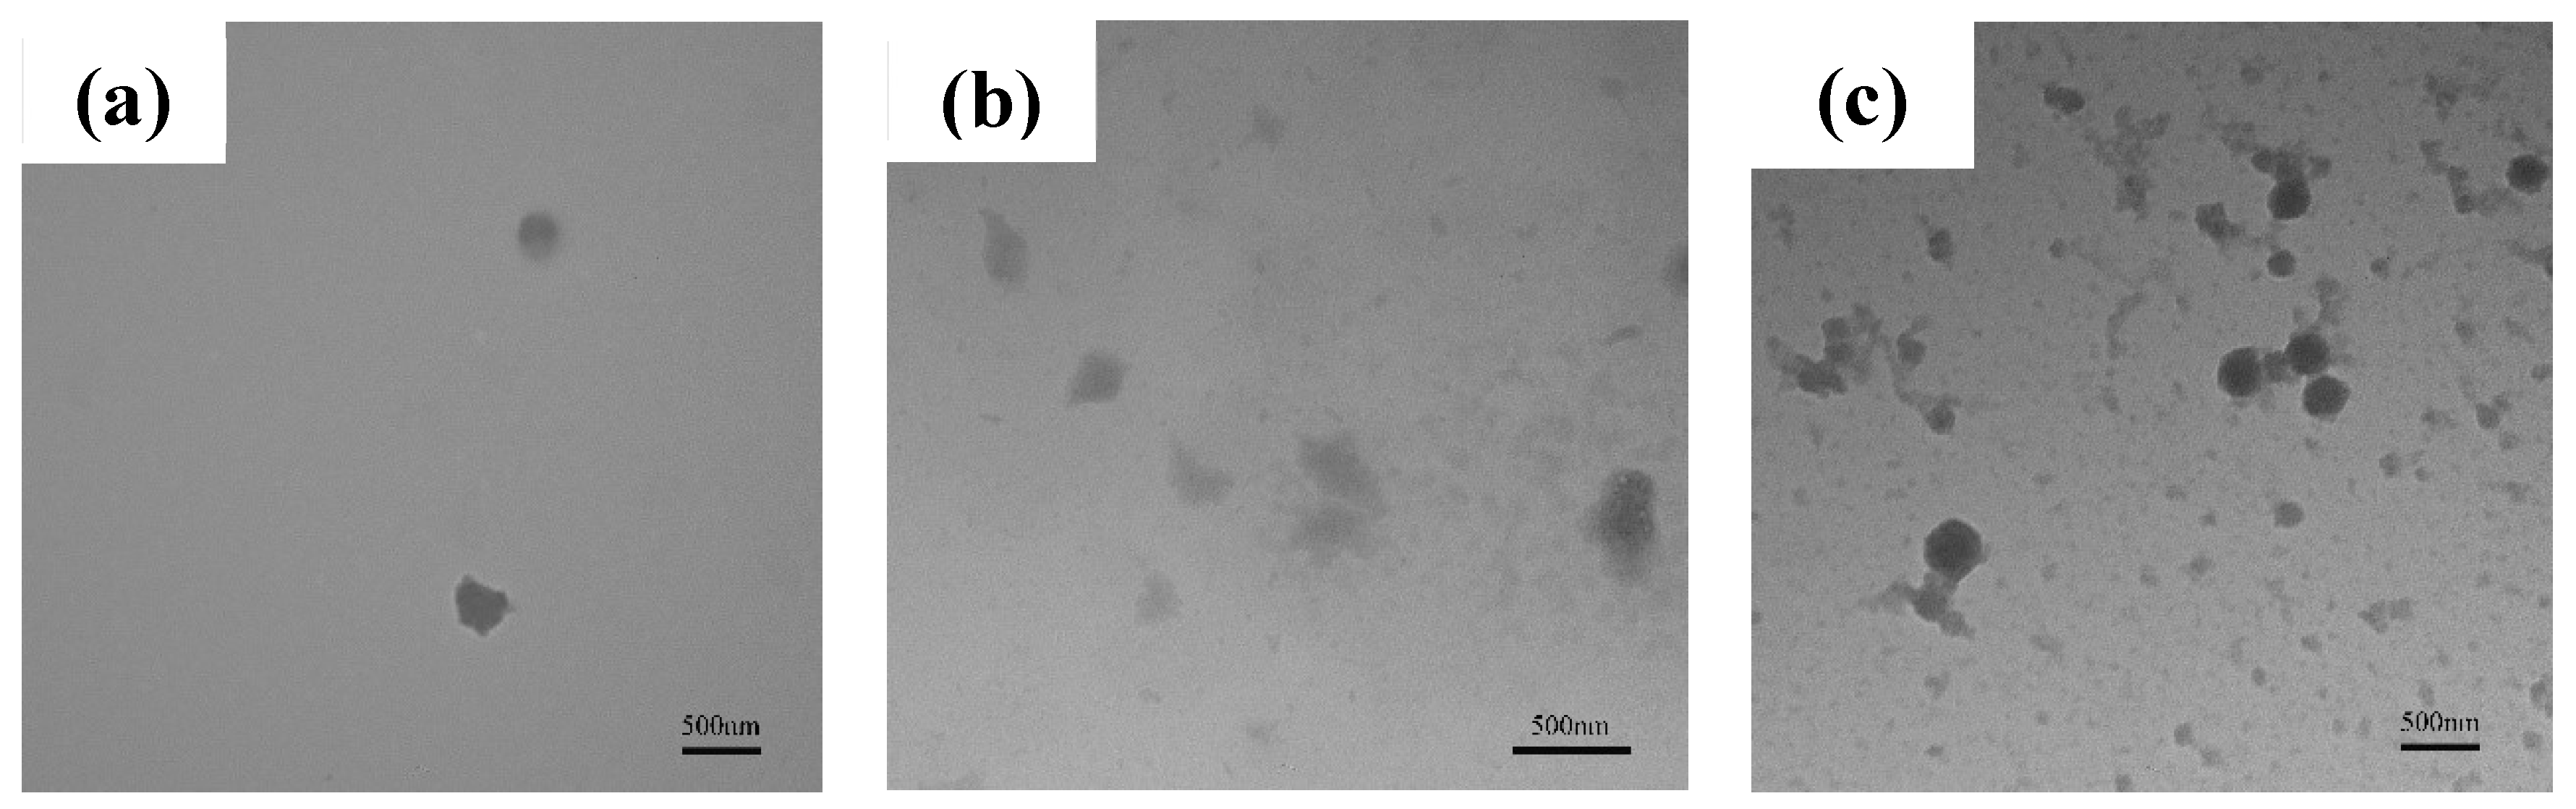
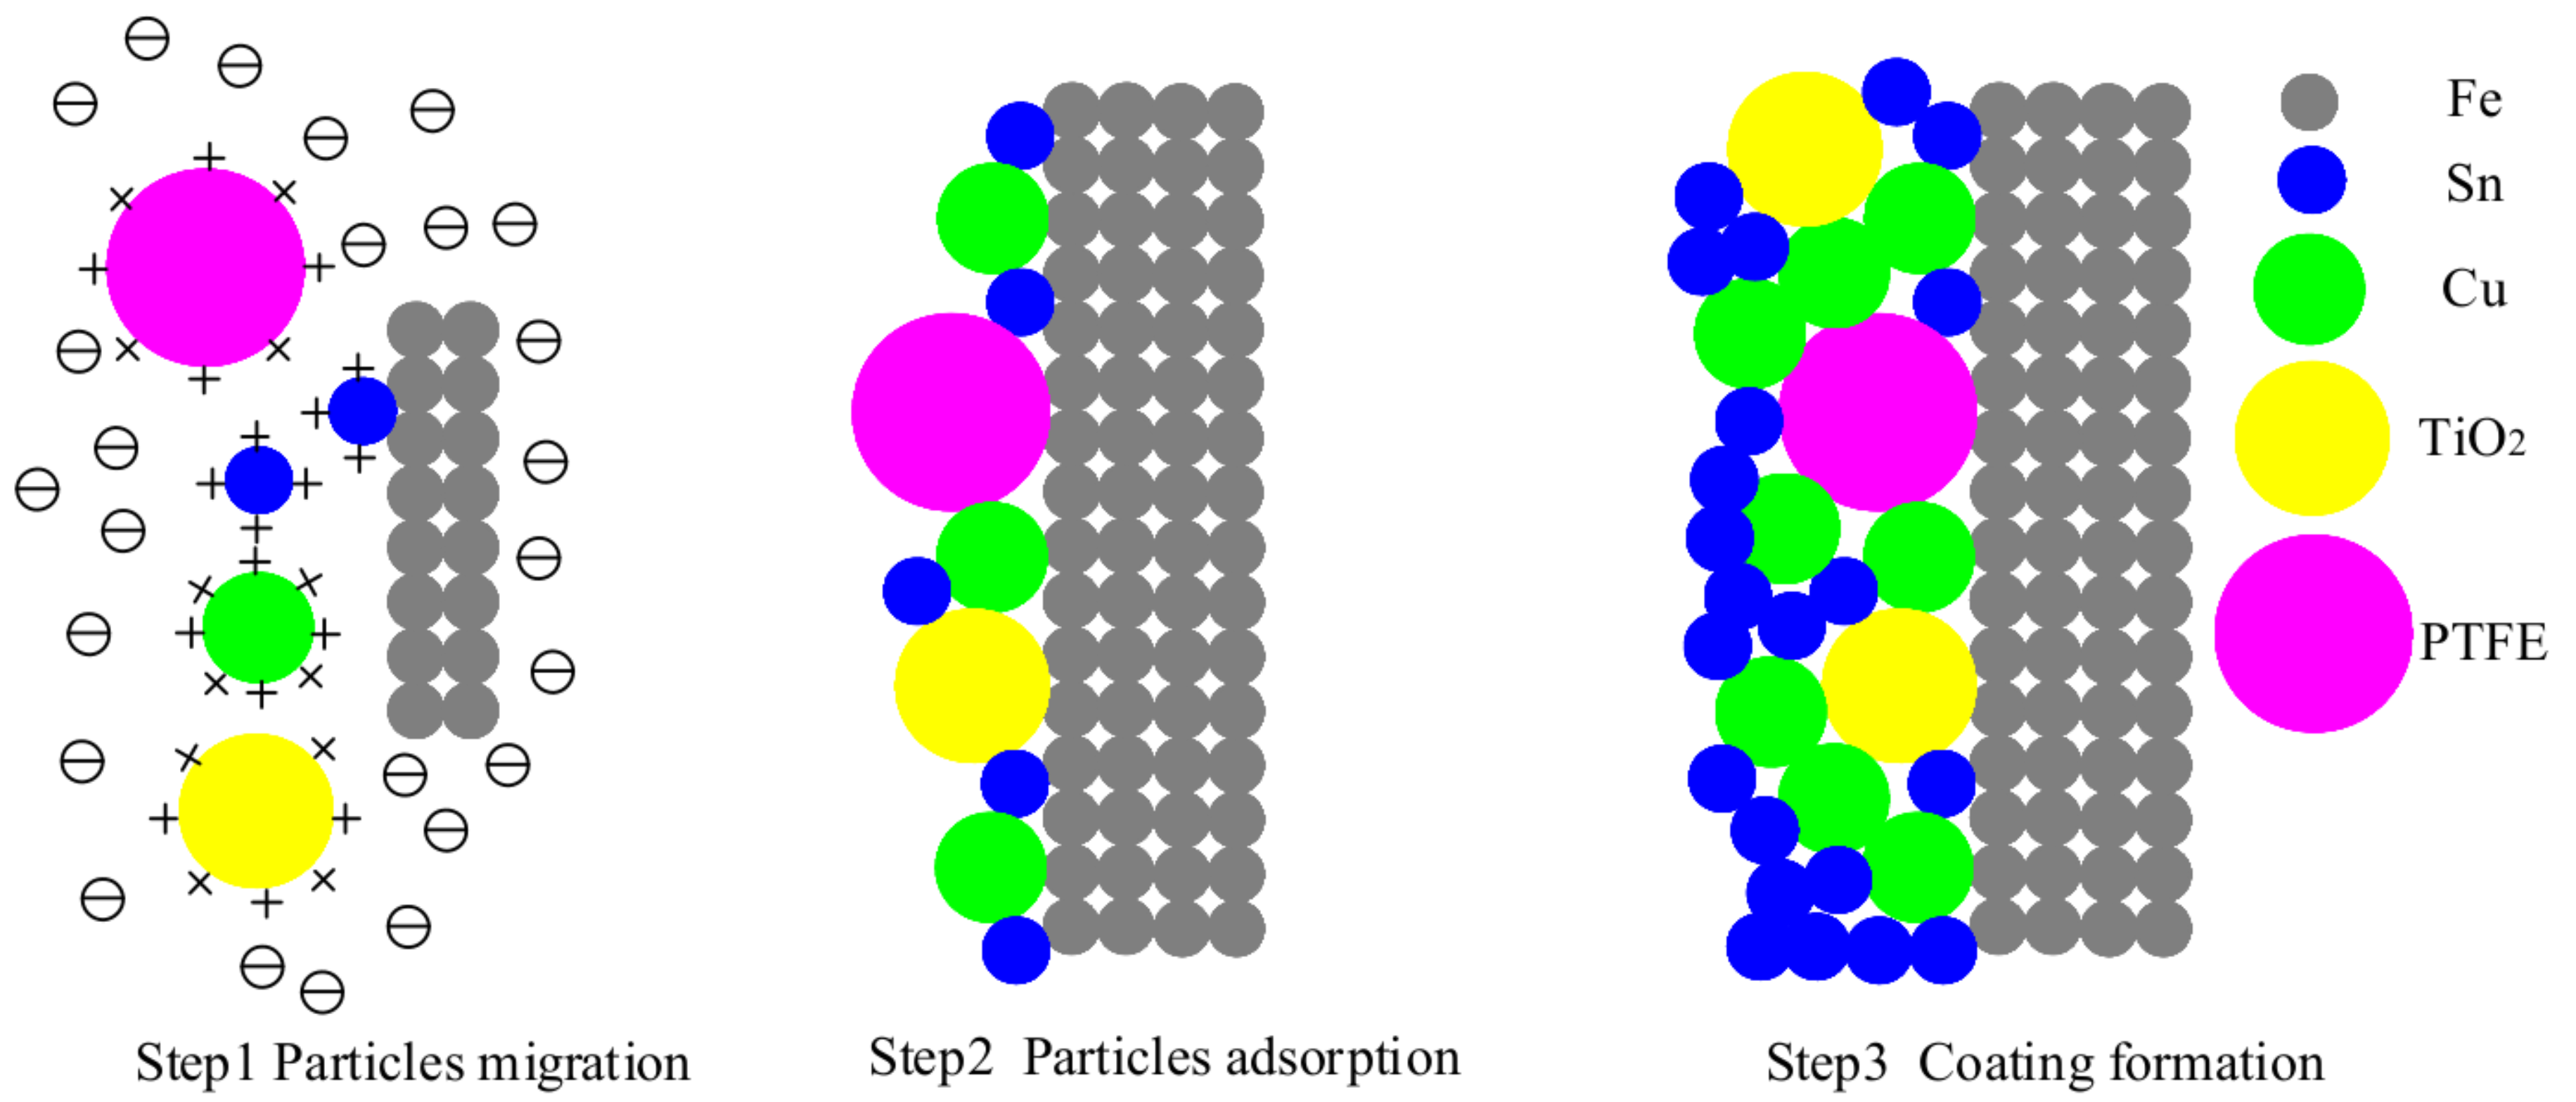
3.1.2. Analysis of TiO2 and PTFE particles

Figure 3 shows the distribution ranges of particle sizes and average diameters of the PTFE and TiO2. While both particle size distributions show log-normal distributions (as expected), the left cut-off in Figure 3a (PTFE particles) is caused by the detection limit of the particle analyzer. In other words, particles < 25 mm could not be detected. Thus, it can be concluded that the average particle diameters of PTFE are less than 283 nm. Figure 3b shows that the average particle diameters of TiO2 is 158 nm.
The obtained PTFE emulsion and TiO2 sol particles were added into the base plating solution for further testing. With the addition of 15 g/L PTFE and 1 g/L TiO2, respectively, the particles were uniformly dispersed in the plating solution and no agglomeration occurred, as observed in Figure 4a,b. Additionally, the particle size was not significantly changed (compared with Figure 3). When PTFE and TiO2 were added to the solution together, the solution remained steady and the dispersity of the nanoparticles was still well (Figure 4c).

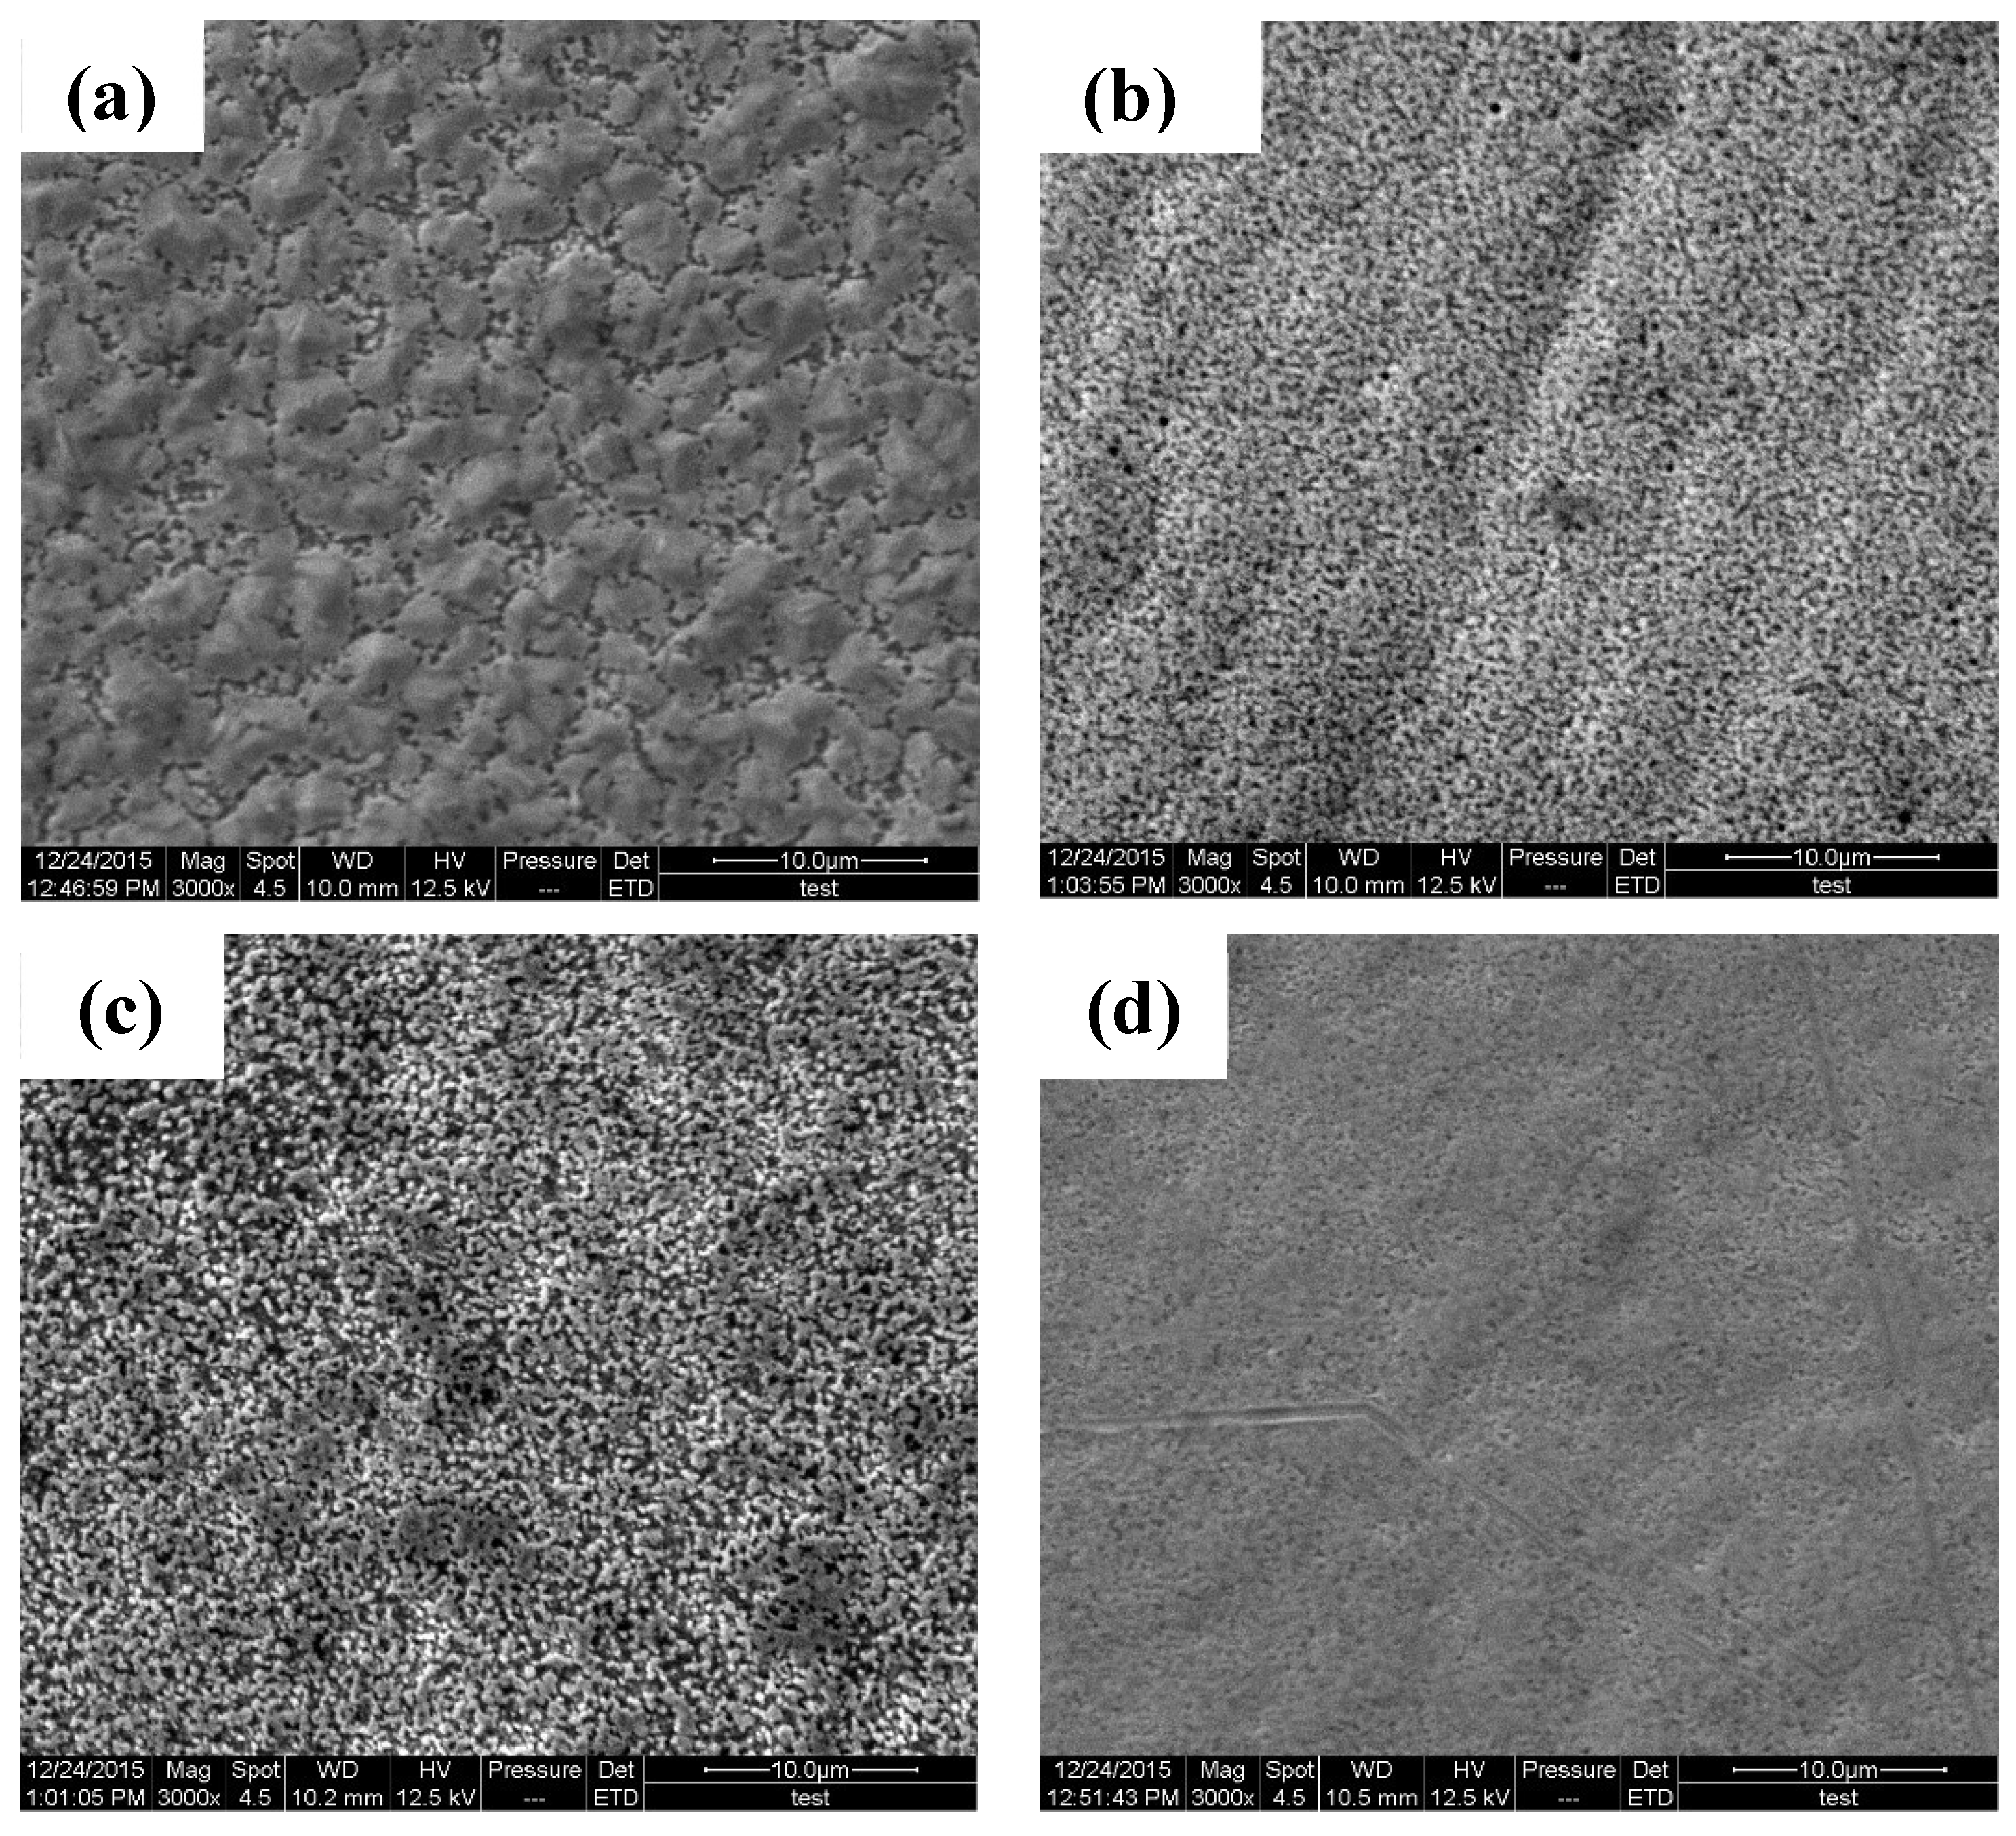
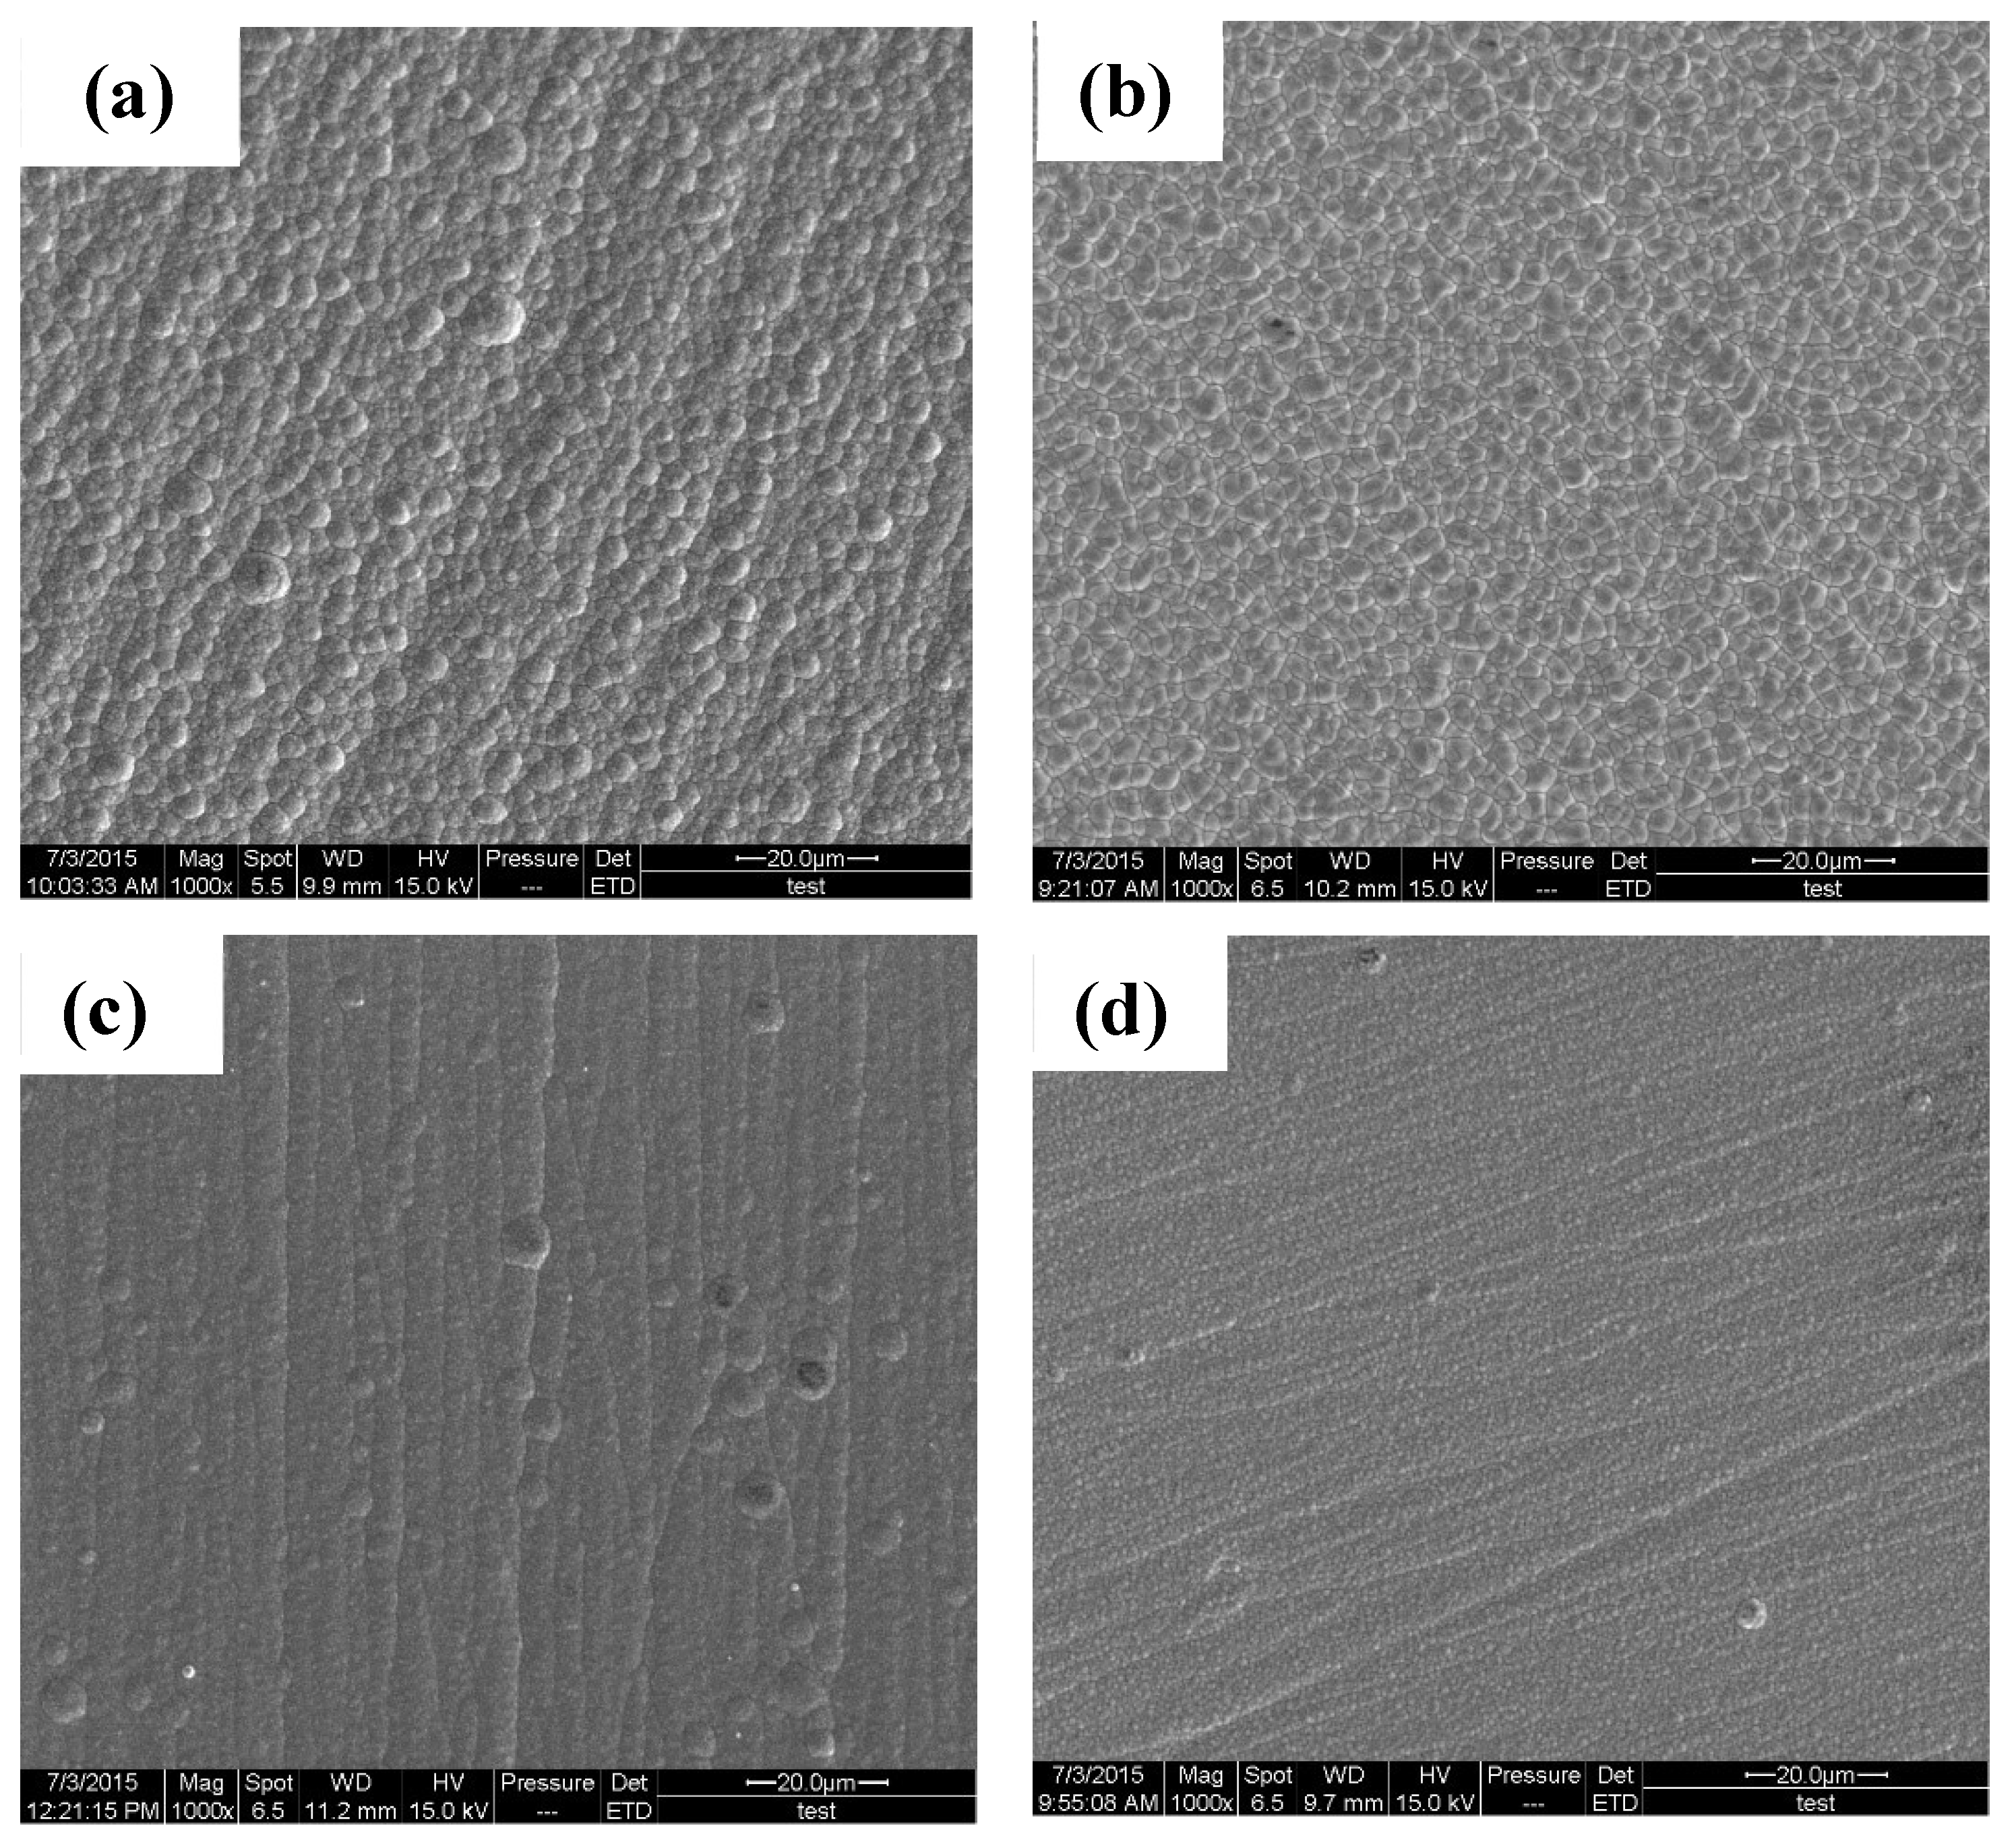
3.2. Microstructure and Composition of the Coatings

The SEM micrographs of coatings, including Cu–Sn, Cu–Sn–PTFE, Cu–Sn–TiO2 and Cu–Sn–PTFE-TiO2 composite coatings are shown in Figure 5. According to SEM results, the surface of each coating is uniform and there are no such defects as pinhole, cracks, drain plating, etc. With the addition of TiO2, the coatings of Cu–Sn–TiO2 and Cu–Sn–PTFE–TiO2 are smoother than Cu–Sn and Cu–Sn–PTFE. Indeed, the results also show TiO2 sol has dramatically effect on improving the coating structure than that of PTFE emulsion. However, with PTFE and TiO2 coexisting in the coating, Cu–Sn–PTFE–TiO2 composite coating possess the smoothest surface and finest structure.
Table 3 shows the composition of the deposits produced with different particles in the bath. According to the XRF analysis, the alloy composition is dependent on the composition of the bath. Although both of the contents of Cu and Sn decrease with the addition of PTFE and TiO2, the proportions of Cu/Sn in the coatings stay basically unchanged. Composition analysis also confirms that PTFE and TiO2 coexist in the coating of Cu–Sn–PTFE–TiO2.

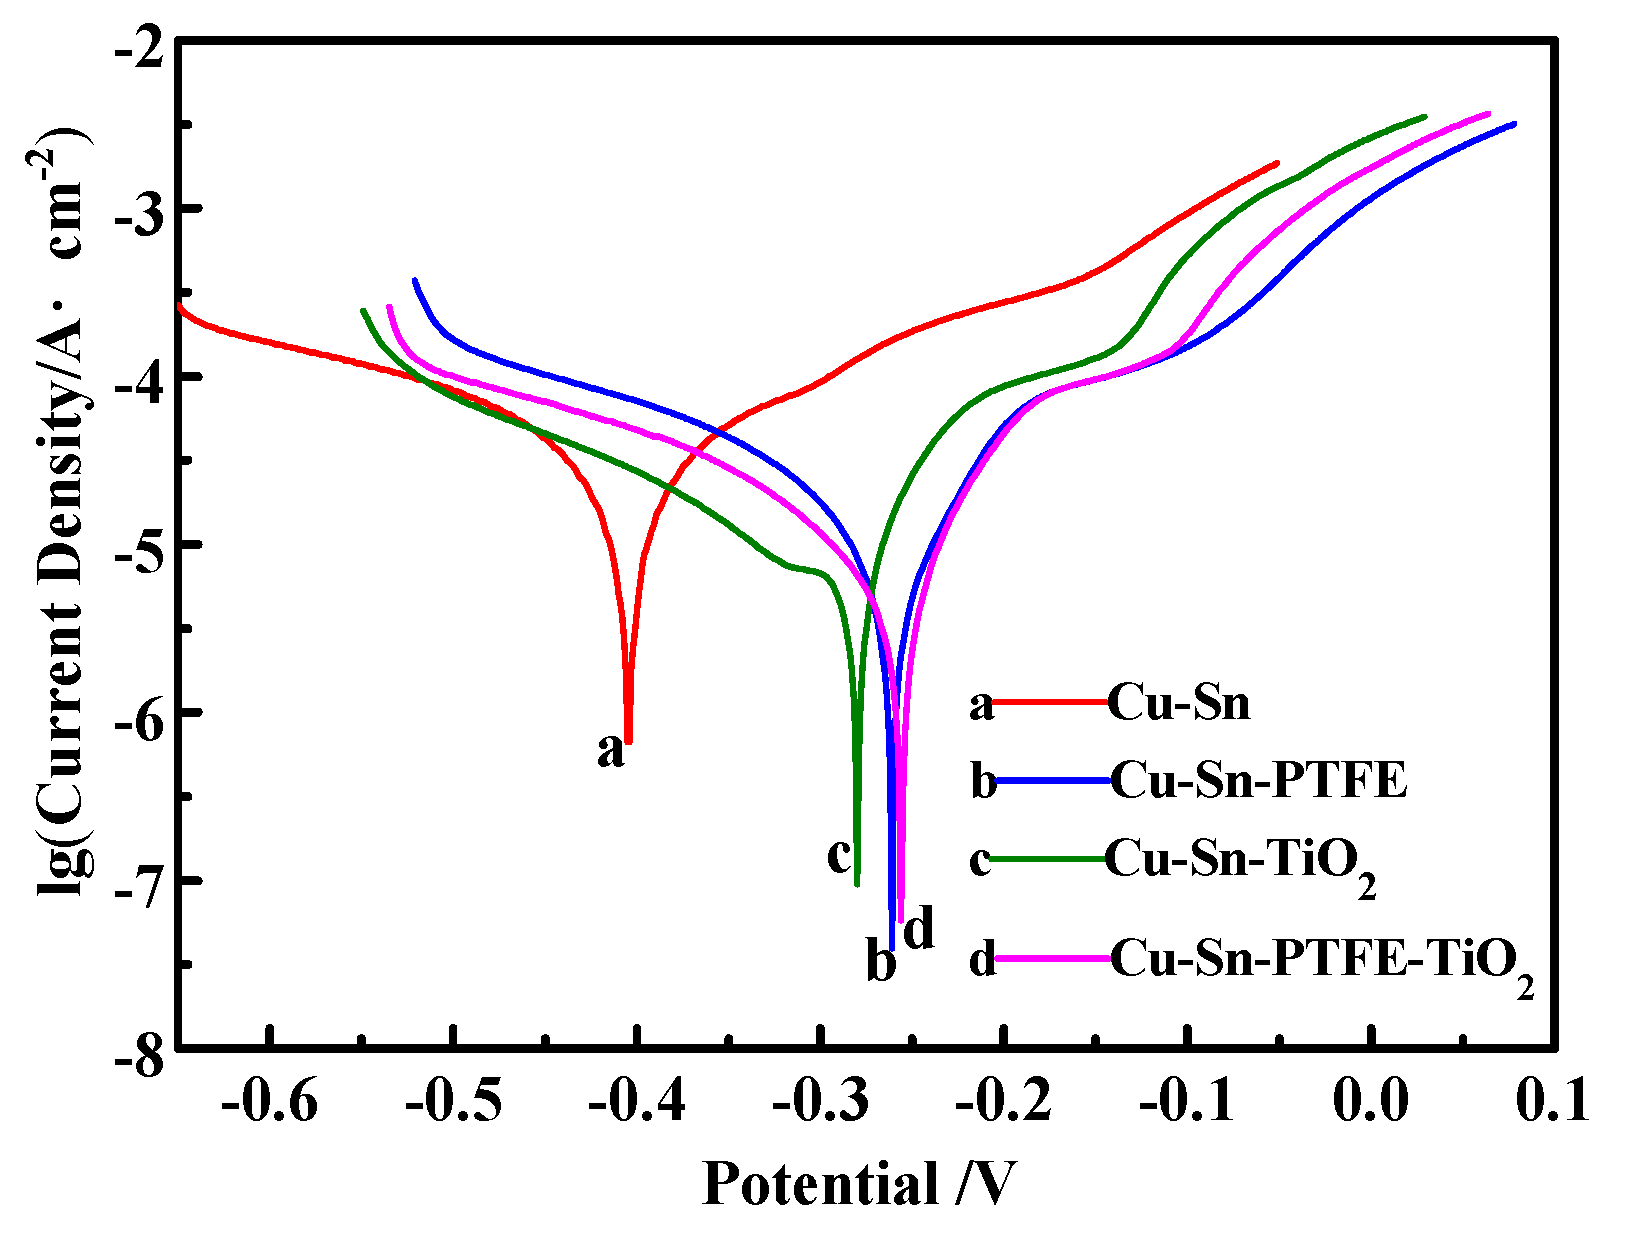
3.3. Corrosion Properties

The potentiodynamic polarization curves of different kinds of Cu–Sn base composite coatings are shown in Figure 6. Table 4 presents the corresponding corrosion current density and corrosion potential. The corrosion resistances of Cu–Sn–PTFE, Cu–Sn–TiO2 and Cu–Sn–PTFE–TiO2 coatings are much better than that of the Cu–Sn alloy coating in 3.5% NaCl solution. Cu–Sn–PTFE–TiO2 composite coating also has the highest corrosion potential and minimum corrosion current density, which are −0.256 V and 1.443 A/cm2, respectively.
Figure 7 presents the corroded surface topographies of four kinds of coatings. The main corrosion form of all of them was point corrosion in 3.5% NaCl electrolyte. However, the depth of the corrosion pits was significantly different in those coatings. It is obvious that Cu–Sn–PTFE–TiO2 has the shallowest corrosion pits and the smoothest surface.
In any case, with the same corrosion medium and corrosion time, the anti-corrosion performances of Cu–Sn–PTFE, Cu–Sn–TiO2, Cu–Sn–PTFE–TiO2 coatings were distinctly better than that of Cu–Sn alloy coatings. Presumably the main reason is that the pulses co-deposited of PTFE and TiO2 nanoparticles produce fine grains, which strengthen matrix structure, compact the microstructure and improve the corrosion resistance. In addition, PTFE and TiO2 nanoparticles can fill in the intergranular pores of matrix grain, and the reduction of the pore size on the material surface can prevent the corrosion ions getting through micropores of the composite material, so the anti-corrosion performance is effectively improved (Table 4).

3.4. Mechanical Properties

3.4.1. Hardness of Coatings

The hardness values of different kinds of Cu–Sn base composite coatings are listed in Table 5. The results suggest that the hardness of Cu–Sn–TiO2, Cu–Sn–PTFE–TiO2, Cu–Sn and Cu–Sn–PTFE coatings rank from high to low, indicating that TiO2 nanoparticles are able to increase the hardness of the coating, while PTFE particles decrease. In the electrodeposition process, the hard TiO2 nanoparticles were embedded in the Cu–Sn alloy matrix, which lead to higher hardness than Cu–Sn coating. That could presumably be interpreted as fine-grain strengthening and dispersion strengthening effect. However, due to the softness of PTFE particles, hardness of the Cu–Sn–PTFE coating is lower than that of Cu–Sn coating. With the synergistic effect of TiO2 and PTFE, the Cu–Sn–PTFE–TiO2 composite coating can achieve higher hardness than Cu–Sn coating.

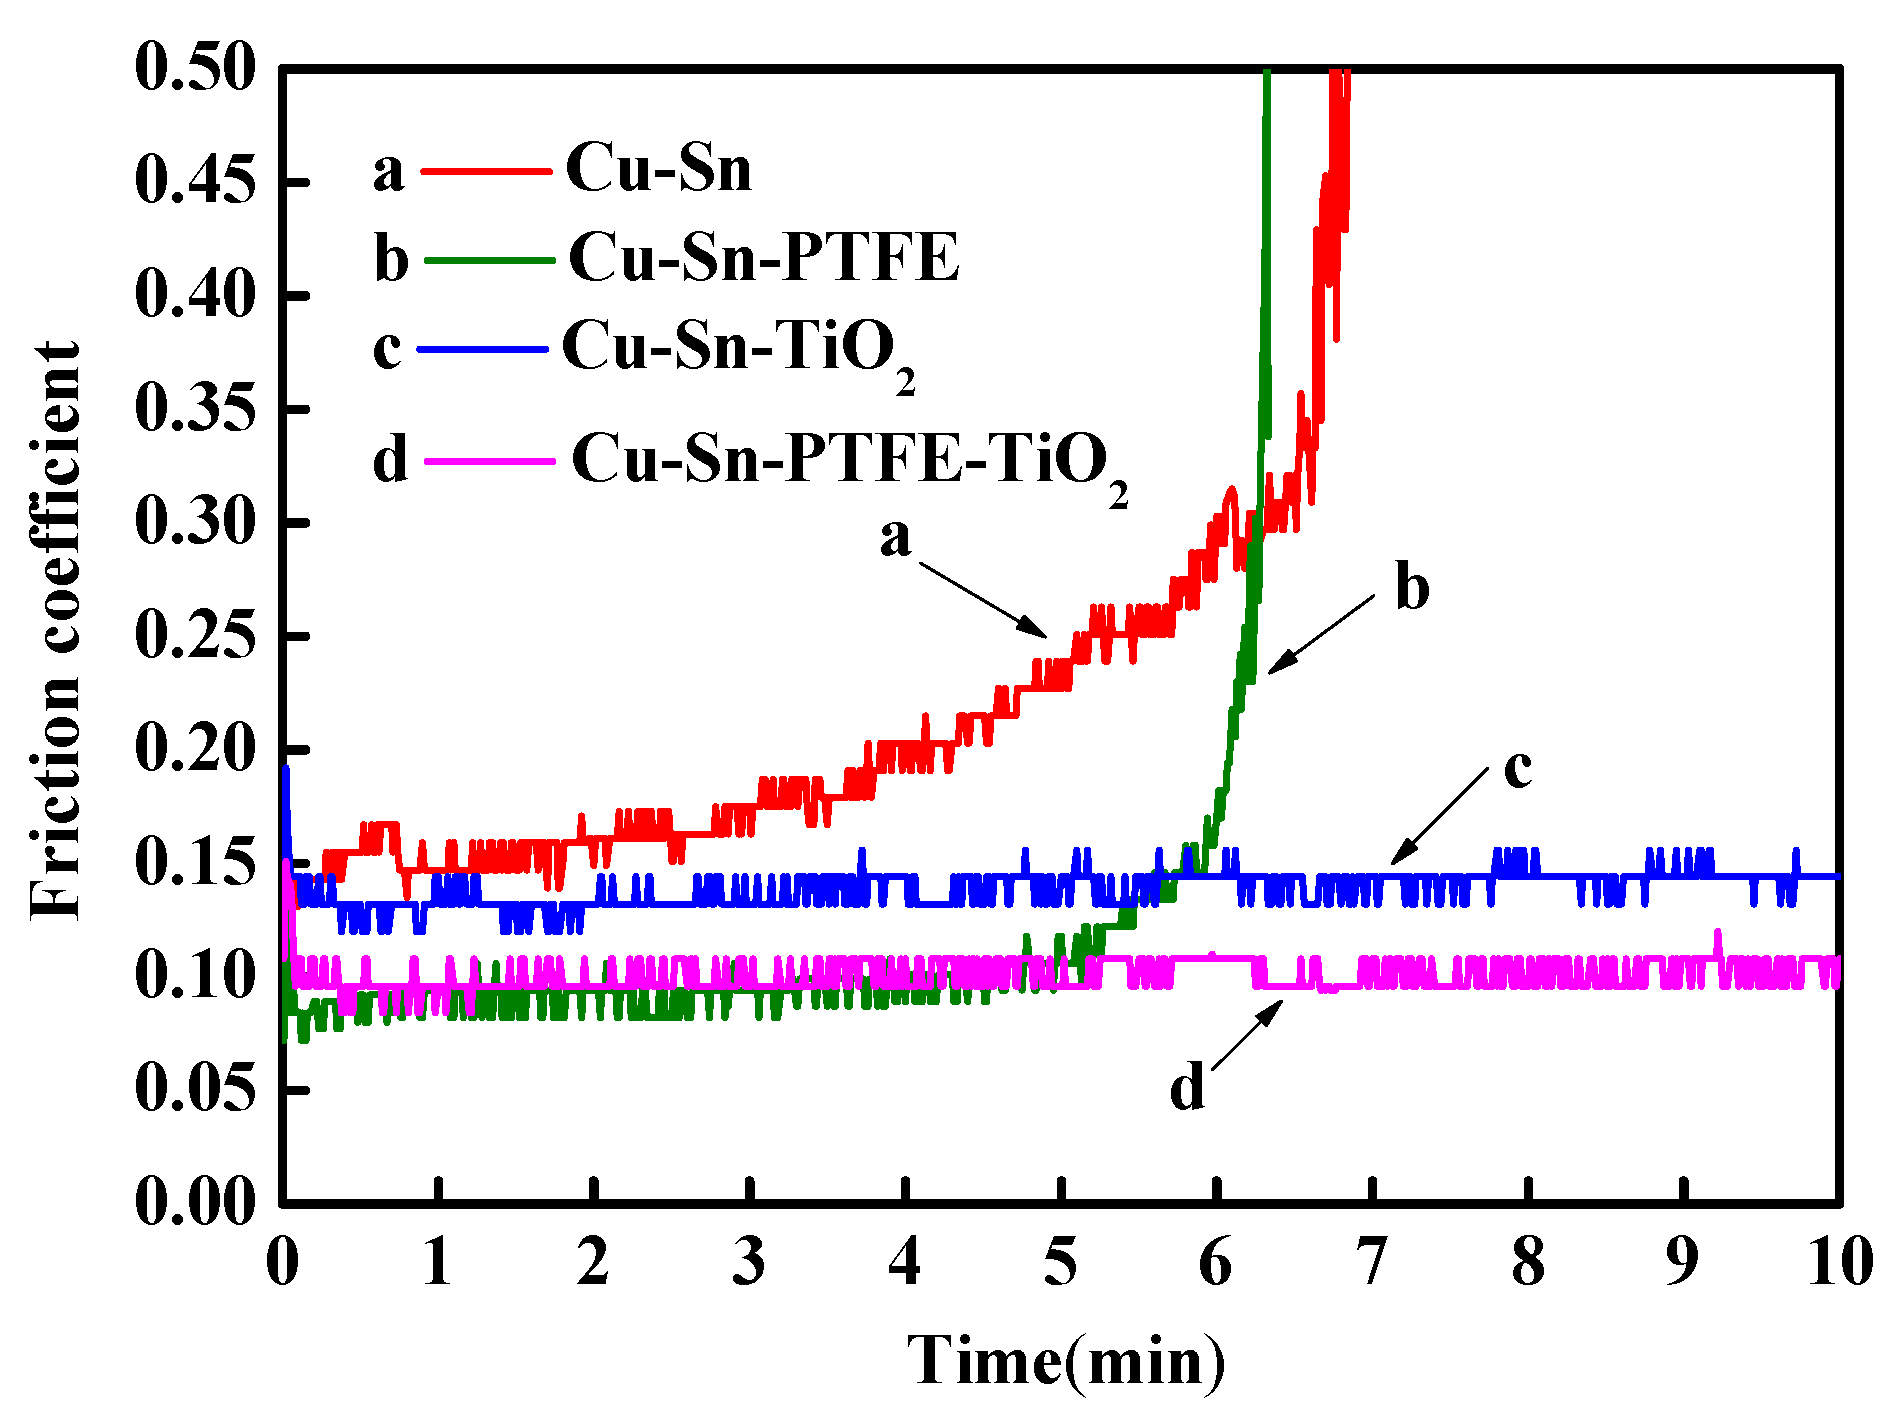
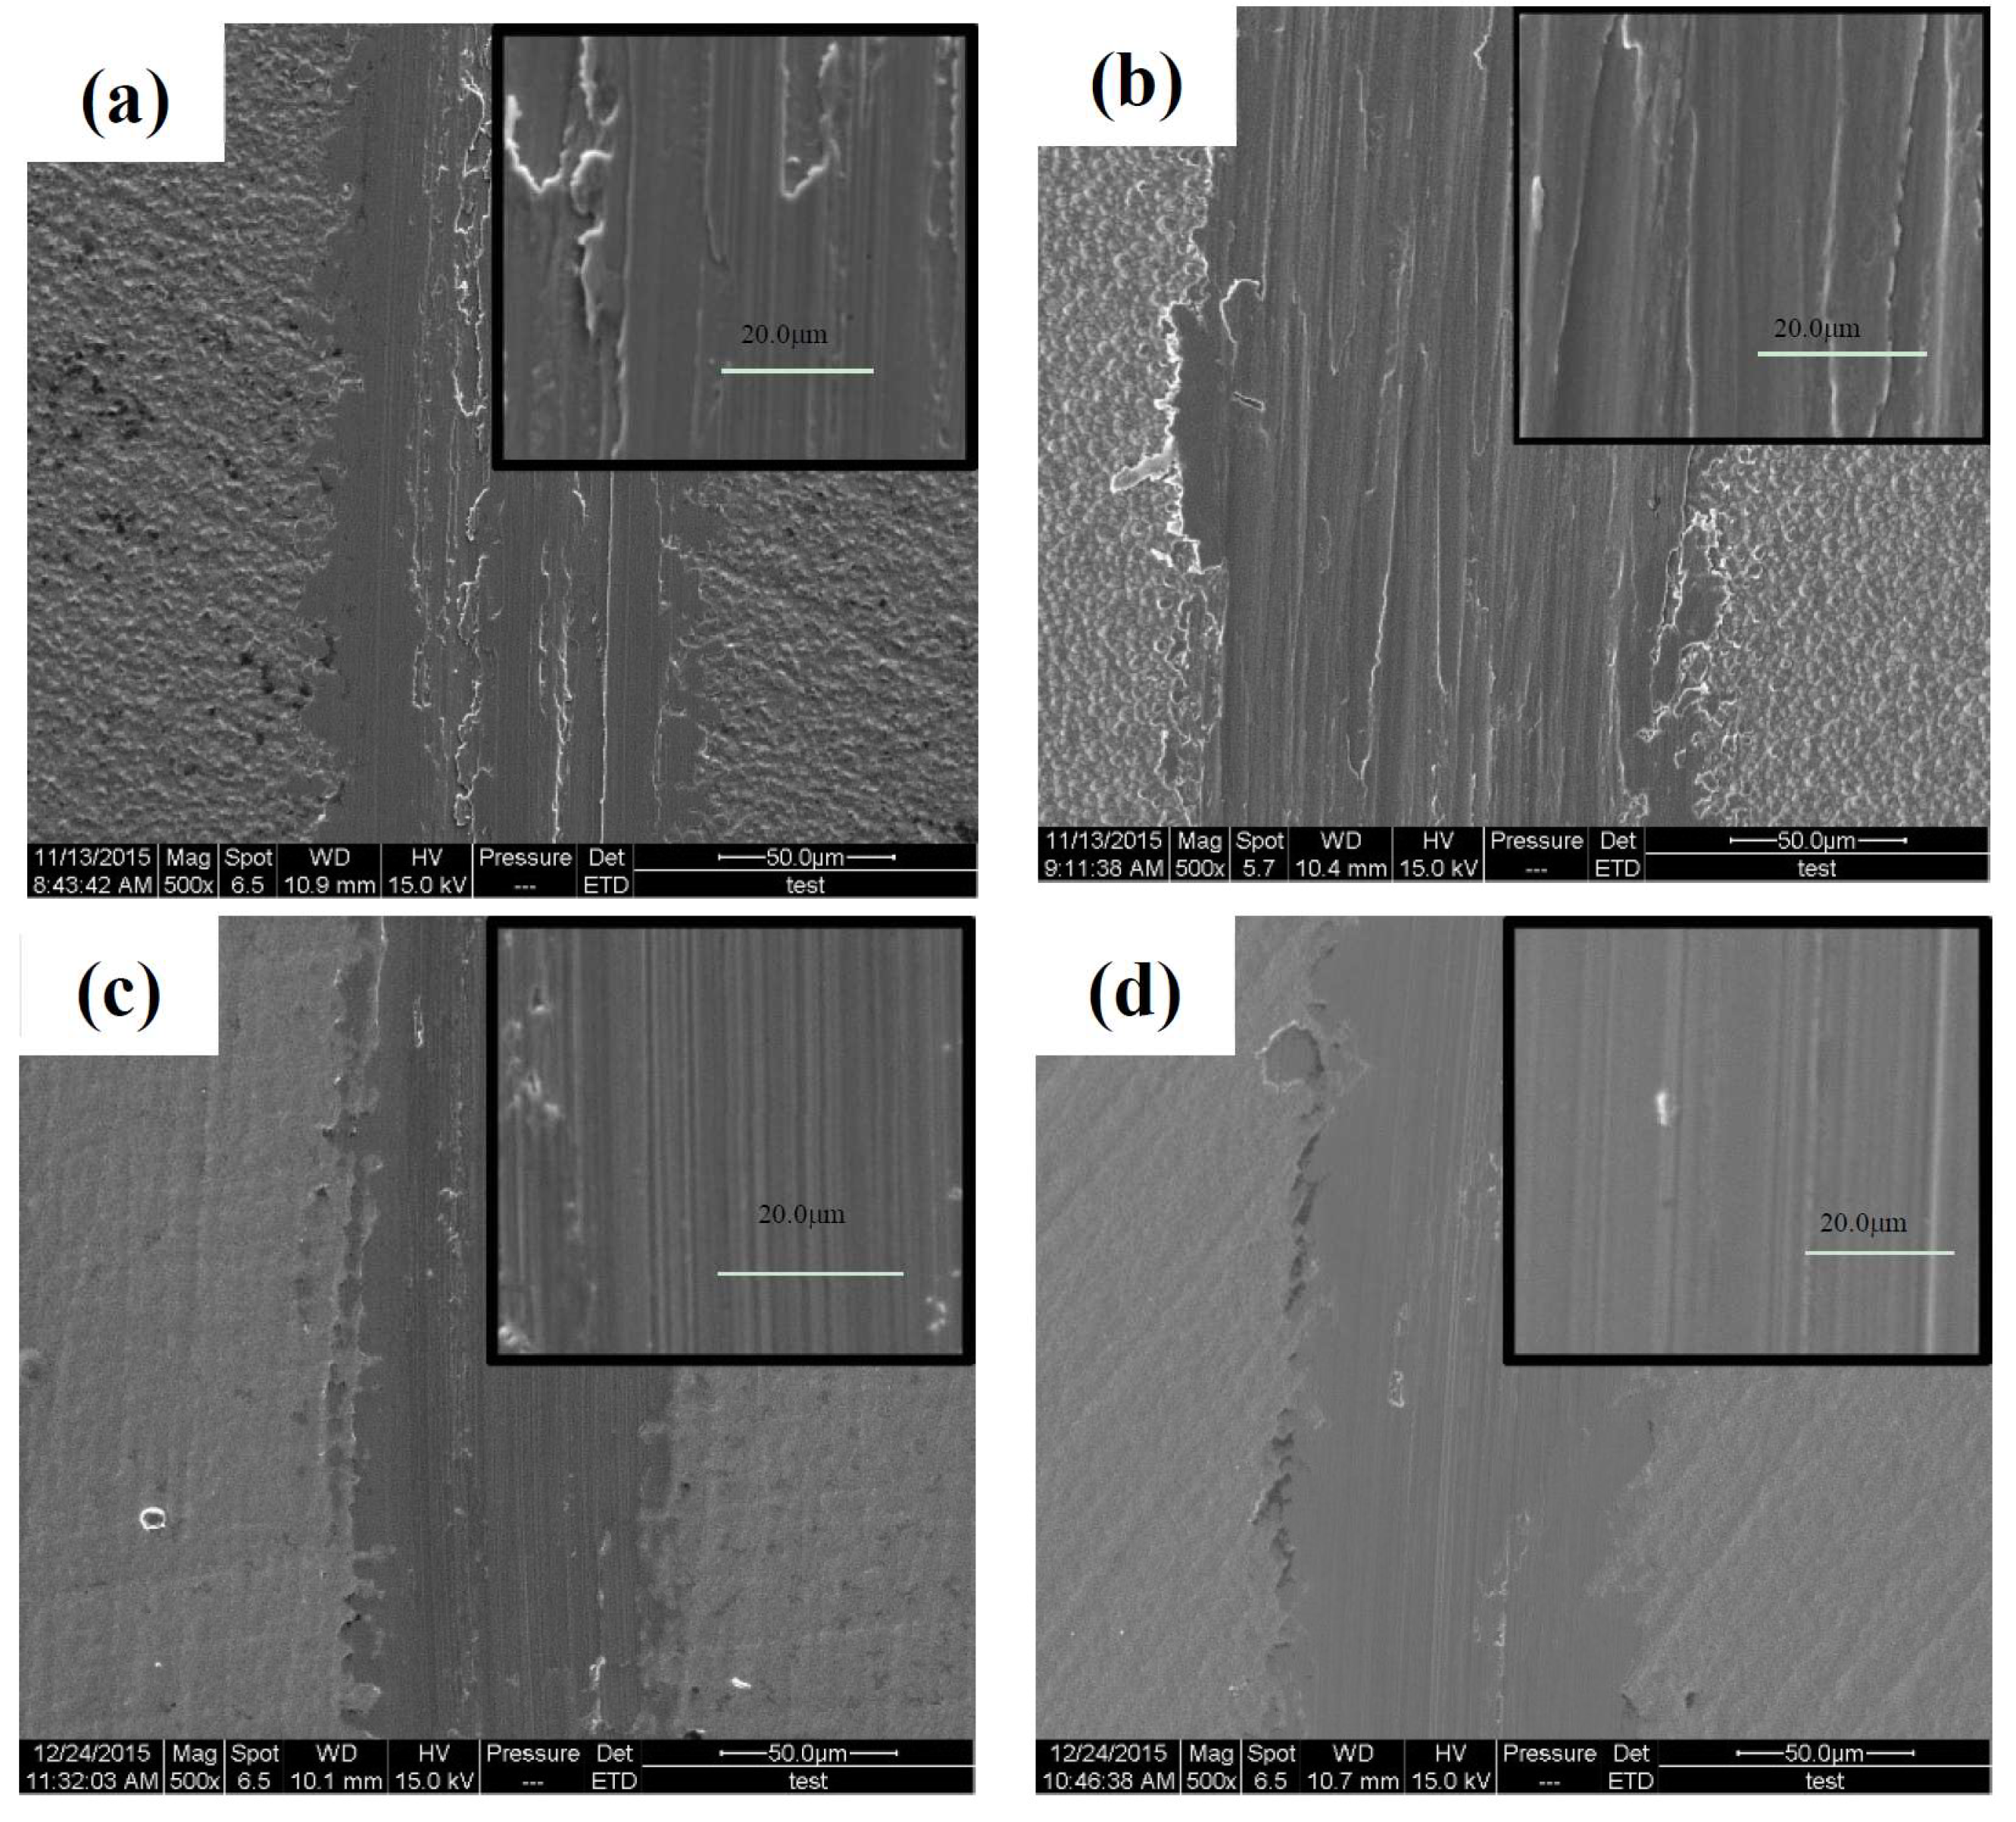
3.4.2. Tribological Properties

The friction coefficient curves of different kinds of those coatings are presented in Figure 8. It indicates that under dry friction conditions, the Cu–Sn alloy coating exhibits the maximum friction coefficient along with poor wear resistance. According to Figure 8, PTFE decreases the friction coefficient to 0.08, but cannot improve the wear life. On the other hand, with the addition of nano-TiO2, wear-resisting time of the Cu–Sn–TiO2 composite coating increases, while the friction coefficient is about 0.14 between those of Cu–Sn and Cu–Sn–PTFE. However, the Cu–Sn–PTFE–TiO2 composite coating has much longer wear-resisting time, as same as Cu–Sn–TiO2. In addition, its friction coefficient of 0.1 is the lowest among the four kinds of coatings. Therefore, the Cu–Sn–PTFE–TiO2 coating achieves the best wear-resisting and anti-friction performance with PTFE and TiO2 coexisting.
The SEM images of the worn surfaces of those composite coatings are shown in Figure 9. Severe plastic deformation happens on the worn surface of the Cu–Sn alloy and Cu–Sn–PTFE coating (Figure 9a,b), which is usually related to adhesive wear mechanism, while narrow scratches implying abrasive wear mechanism are observed in the worn surface of the Cu–Sn–TiO2 and Cu–Sn–PTFE–TiO2 coatings (Figure 9c,d). Simultaneously, with the addition of TiO2 (Figure 9c,d), wear tracks become smoother and their widths also become narrower than those of coatings without TiO2 (Figure 9a,b). However, just some slight furrowing or scratches appear on the surface of the Cu–Sn–PTFE–TiO2 composite coating, which indicate the best wear resistance (Figure 9d).
The wear mechanisms of electroplated coatings against steel can be explained in Figure 10. Steel balls with a higher hardness of HV800 were used as counterparts. When a Cu–Sn deposit with lower hardness was chosen as the tested sample, shown in Figure 10a, the small steel ball would be easily embedded in the coating matrix in the process of relative sliding, which made the contact area and friction force increase and result in serious wear damage. Once the tested sample was changed to a Cu–Sn–PTFE composite coating, as shown in Figure 10b, the friction shear force was significantly reduced with the formation of PTFE self-lubricating film, however, wear resistance of the coating was not improved due to the low hardness of the coating.
In contrast, a relatively high hardness brought by the reinforcement of TiO2 nanoparticles increases the resistance of plastic distortion in the process of relative motion, plus no self-lubricating film on the surface, which leads to a higher friction coefficient (Figure 10c). However, with PTFE and TiO2 coexisting in the Cu–Sn–PTFE–TiO2 composite coating, as illustrated in Figure 10d, lower shear force and harder matrix correspondingly lead to a lower coefficient and higher wear resistance. That is to say, the synergistic effect of PTFE and TiO2 makes the Cu–Sn–PTF–TiO2 composite coating present a good wear-resisting and anti-friction performance.

4. Conclusions

In the paper, PTFE emulsion and TiO2 sol with average particle diameters <283 nm and ~158 nm, respectively, were successfully prepared and dispersed. TEM analysis indicates that no agglomeration occurs in the plating solution with appropriate particle concentrations. The analysis of the electrochemical behavior suggests that Cu and Sn can be co-deposited relatively easily with the addition of K4P2O7. Hence, Cu–Sn composite coatings containing PTFE and TiO2 are obtained from a pyrophosphate plating solution, which has superior antiwear and friction reduction properties.
The investigations also indicate that PTFE and TiO2 nanoparticles are able to promote the coating structure and smoothness. Simultaneously, with the addition of nanoparticles, the corrosion resistance of Cu–Sn–PTFE, Cu–Sn–TiO2 and Cu–Sn–PTFE–TiO2 composite coatings is better than that of Cu–Sn alloy coating. Cu–Sn–PTFE–TiO2 composite coating also has the highest corrosion potential and minimum corrosion current density, which are −0.256 V and 1.443 A/cm2, respectively.
In addition, the hardness of the Cu–Sn–TiO2 coating is 485 HV, while that of the Cu–Sn–PTFE–TiO2 coating is 465 HV due to the softness of PTFE. However, with the synergistic effect of PTFE and TiO2, a Cu–Sn–PTFE–TiO2 composite coating exhibits superior wear-resisting and anti-friction performance with the friction coefficient of 0.10.

Author Contributions

Conceptualization, L.Y.; Methodology, L.Y. and K.W.; Validation, K.W., Z.F. and C.W.; Formal Analysis, Z.F., K.W.; Investigation, Z.F., K.W.; Data Curation, L.Y., Z.F. and K.W.; Writing–Original Draft Preparation, Z.F. and K.W.; Writing–Review & Editing, L.Y., C.W., T.Z., Y.X. and G.W.

Funding

This research was funded by the National Nature Science Foundation of China (No.51305090) and the Fundamental Research Funds for the Central Universities (HEUCFP201814).

Conflicts of Interest

The authors declare no conflict of interest. The funders had no role in the design of the study; in the collection, analyses, or interpretation of data; in the writing of the manuscript, and in the decision to publish the results.

References

  1. Pewnim, N.; Roy, S. Electrodeposition of tin-rich Cu–Sn alloys from a methanesulfonic acid electrolyte. Electrochim. Acta 2013, 90, 498–506. [Google Scholar] [CrossRef]
  2. Zanella, C.; Xing, S.; Deflorian, F. Effect of electrodeposition parameters on chemical and morphological characteristics of Cu–Sn coatings from a methanesulfonic acid electrolyte. Surf. Coat. Technol. 2013, 236, 394–399. [Google Scholar] [CrossRef]
  3. Subramanian, B.; Mohan, S.; Jayakrishnan, S. Structural, microstural and corrosion properties of brush plated Copper–Tin alloy coatings. Surf. Coat. Technol. 2006, 201, 1145–1151. [Google Scholar] [CrossRef]
  4. Bengoa, L.N.; Pary, P.; Conconi, M.S.; Egli, W.A. Electrodeposition of Cu–Sn alloys from a methanesulfonic acid electrolyte containing benzyl alcohol. Electrochim. Acta 2017, 256, 211–219. [Google Scholar] [CrossRef]
  5. Cui, G.; Bi, Q.; Zhu, S.; Yang, J.; Liu, W. Tribological properties of bronze–graphite composites under sea water condition. Tribol. Int. 2012, 53, 76–86. [Google Scholar] [CrossRef]
  6. Mallikarjuna, H.M.; Kashyap, K.T.; Koppad, P.G.; Ramesh, C.S.; Keshavamurthy, R. Microstructure and dry sliding wear behavior of Cu–Sn alloy reinforced with multiwalled carbon nanotubes. Trans. Nonferr. Met. Soc. China 2016, 26, 1755–1764. [Google Scholar] [CrossRef]
  7. Balaji, R.; Pushpavanam, M.; Kumar, K.Y.; Subramanian, K. Electrodeposition of bronze–PTFE composite coatings and study on their tribological characteristics. Surf. Coat. Technol. 2006, 201, 3205–3211. [Google Scholar] [CrossRef]
  8. Du, C.J.; Li, W.W.; Guo, D.P.; Liu, X.G.; Wang, Y.L.; Zhang, L.; Nan, Y. Electrodeposition of Cu–Sn-Zn–PTFE composite coating and its self-lubricating property. Electroplat. Pollut. Control. 2017, 5, 12–14. (In Chinese) [Google Scholar]
  9. Banerjee, A.; Kumar, R.; Dutta, M.; Bysakh, S.; Bhowmick, A.K.; Laha, T. Microstructural evolution in Cu–Sn coatings deposited on steel substrate and its effect on interfacial adhesion. Surf. Coat. Technol. 2015, 262, 200–209. [Google Scholar] [CrossRef]
  10. Low, C.T.J.; Wills, R.G.A.; Walsh, F.C. Electrodeposition of composite coatings containing nanoparticles in a metal deposit. Surf. Coat. Technol. 2006, 201, 371–383. [Google Scholar] [CrossRef]
  11. Wu, Y.; Liu, L.; Shen, B.; Hu, W. Investigation in electroless Ni–P–C (graphite)–SiC composite coating. Surf. Coat. Technol. 2006, 201, 441–445. [Google Scholar] [CrossRef]
  12. Su, F.; Zhang, S. Tribological properties of polyimide coatings filled with PTFE and surface-modified nano-Si3N4. J. Appl. Polym. Sci. 2014, 131, 383–390. [Google Scholar] [CrossRef]
  13. Sieh, R.; Le, H. Non-cyanide electrodeposited Ag–PTFE composite coating using direct or pulsed current deposition. Coatings 2016, 6, 31–44. [Google Scholar] [CrossRef]
  14. Xu, X.; Yao, W.; Xu, J.; Zhang, W.; Yang, L.; Deng, S. The influences of the plating’s hardness, abrasion and antifriction property caused by the adding of nano-Al2O3 and PTFE. Adv. Mater. Res. 2012, 517, 1683–1686. [Google Scholar] [CrossRef]
  15. Suiyuan, C.; Ying, S.; Hong, F.; Jing, L.; Liu, C.S.; Sun, K. Synthesis of Ni–P–PTFE-nano-Al2O3 composite plating coating on 45 steel by electroless plating. J. Compos. Mater. 2012, 46, 1405–1416. [Google Scholar] [CrossRef]
  16. Chen, W.; He, Y.; Gao, W. Synthesis of nanostructured Ni–TiO2 composite coatings by sol-enhanced electroplating. Electrochem. Soc. 2010, 157, E122–E128. [Google Scholar] [CrossRef]
  17. Chen, W.; Gao, W. Thermal stability and tensile properties of sol-enhanced nanostructured Ni–TiO2 composites. Compos. Part A Appl. Sci. Manuf. 2011, 42, 1627–1634. [Google Scholar] [CrossRef]
  18. Wang, Y.; Wang, S.; Shu, X.; Gao, W.; Lu, W.; Yan, B. Preparation and property of sol-enhanced Ni–B–TiO2 nano-composite coatings. J. Alloy. Compd. 2014, 617, 472–478. [Google Scholar] [CrossRef]
  19. Wang, Y.; Ju, Y.; Wei, S.; Gao, W.; Lu, W.; Yan, B. Au–Ni–TiO2 nano-composite coatings prepared by sol-enhanced method. J. Electrochem. Soc. 2014, 161, 775–781. [Google Scholar] [CrossRef]
  20. Ying, L.; Li, Z.; Wu, K.; Lv, X.; Wang, G. Effect of TiO2 sol on the microstructure and tribological properties of Cu–Sn coating. Rare Met. Mater. Eng. 2017, 46, 2801–2806. [Google Scholar] [CrossRef]
Figure 1. The schematic diagram of the Cu–Sn–PTFE–TiO2 coating formation process (note that the relative sizes of ions/atoms/particles are not to scale).
Coatings 09 00059 g001
Figure 2. The volt–ampere characteristic curves of solutions: (a) K4P2O7 solution; (b) electrolytic deposition of Cu2+; (c) electrolytic deposition of Sn4+; (d) electrolytic deposition of Cu2+ and Sn4+.
Coatings 09 00059 g002
Figure 3. The size distribution of PTFE emulsion and TiO2 sol: (a) PTFE emulsiom; (b) TiO2 sol (note that the detection limit of the particle analyzer is 25 mm).
Coatings 09 00059 g003
Figure 4. The dispersion state morphologies of PTFE emulsion and TiO2 sol in electroplating solution: (a) PTFE emulsion; (b) TiO2 sol; (c) PTFE–TiO2.
Coatings 09 00059 g004
Figure 5. The SEM morphologies of Cu–Sn base coatings: (a) Cu–Sn; (b) Cu–Sn–PTFE; (c) Cu–Sn–TiO2; (d) Cu–Sn–PTFE–TiO2.
Coatings 09 00059 g005
Figure 6. Potentiodynamic polarization curves of different coatings.
Coatings 09 00059 g006
Figure 7. The SEM morphologies of corroded coatings: (a) Cu–Sn; (b) Cu–Sn–PTFE; (c) Cu–Sn–TiO2; (d) Cu–Sn–PTFE–TiO2.
Coatings 09 00059 g007
Figure 8. The friction coefficient curve of each Cu–Sn base plating coating.
Coatings 09 00059 g008
Figure 9. The SEM morphologies of wear traces on the surface of coatings: (a) Cu–Sn; (b) Cu–Sn–PTFE; (c) Cu–Sn–TiO2; (d) Cu–Sn–PTFE–TiO2.
Coatings 09 00059 g009
Figure 10. The schematic diagram of the friction mechanism of each Cu–Sn base coatings: (a) Cu–Sn; (b) Cu–Sn–PTFE; (c) Cu–Sn–TiO2; (d) Cu–Sn–PTFE–TiO2.
Coatings 09 00059 g010
Table 1. Plating solution compositions and technological parameters.
Compositions/ParametersQuantity
K4P2O7·3H2O260–270 g/L
Cu2P2O7·4H2O20 g/L
KNaC4H4O6·4H2O30–35 g/L
Na2SnO3·3H2O40 g/L
KNO340 g/L
Na3C6H5O7·2H2O20 g/L
PTFE15 g/L
TiO2 sol1 g/L
time1 h
pH9–10
speed100 r/min
temperature35–40 °C
Table 2. The type and quantity of composite particles in each plating solution.
ContentCu–SnCu–Sn–PTFECu–Sn–TiO2Cu–Sn–PTFE–TiO2
PTFE (g/L)015015
TiO2 (g/L)0011
Table 3. The compositions of the coatings.
Conversion CoatingsCu (wt %)Sn (wt %)PTFF (wt %)TiO2 (wt %)
Cu–Sn92.427.58
Cu–Sn–PTFE87.216.686.11
Cu–Sn–TiO290.716.761.54
Cu–Sn–PTFE–TiO286.846.465.501.20
Table 4. Potentiodynamic polarization parameters of coatings.
CoatingsCorrosion Potential/VCorrosion Current Density/A·cm−2
Cu–Sn−0.4054.067
Cu–Sn–PTFE−0.2611.856
Cu–Sn–TiO2−0.2802.434
Cu–Sn–PTFE–TiO2−0.2561.443
Table 5. Hardness of the coatings.
CoatingHardness/HV
Cu–Sn413 ± 4
Cu–Sn–PTFE375 ± 6
Cu–Sn–TiO2485 ± 6
Cu–Sn–PTFE–TiO2465 ± 5

