Article

Experimental Analysis of the Influence of Factors Acting on the Layer Thickness Formed by Anodic Oxidation of Aluminium

1
Faculty of Management, University of Prešov, Ul. 17. novembra 15, 080 01 Prešov, Slovakia
2
Department of Natural Sciences and Humanities, Faculty of Manufacturing Technologies with a seat in Prešov, Technical University of Kosice, Štúrova 31, 080 01 Prešov, Slovakia
3
Faculty of Engineering, Slovak University of Agriculture in Nitra, Tr. A. Hlinku 2, 949 76 Nitra, Slovakia
4
Department of Mechanical Engineering, Faculty of Technology, Institute of Technology and Business in České Budějovice, Okružní 10, 370 01 České Budějovice, Czech Republic
5
Department of Machining and Manufacturing Technology, Faculty of Mechanical Engineering, University of Zilina, Univerzitna 1, 010 26 Zilina, Slovakia
*
Author to whom correspondence should be addressed.
Coatings 2019, 9(1), 57; https://doi.org/10.3390/coatings9010057
Submission received: 7 November 2018 / Revised: 14 January 2019 / Accepted: 16 January 2019 / Published: 18 January 2019

Abstract

:
The current practice in the field of anodic oxidation of aluminium and its alloys is based mainly on a set of partial empirical experiences of technologists obtained during surface treatment. The aim of the presented paper is deeper and more complex identification of the influence of chemical and technological factors acting during the anodic oxidation process especially on the thickness of the formed surface layer by the electrolysis method in a sulfuric acid solution. The current density was selected as the basic criterion for verification evaluation and analysis of experimentally obtained data, in accordance with Faraday’s laws. For current densities of 1 to 5 A·dm−2, the synergy of significant influence factors was identified, and mathematical and statistical models were then developed to predict the thickness of the surface layer with a relative accuracy of up to 10%. The presented paper does not only focus on the observation of the thickness of the surface layer desired by the customer, but also on the monitoring of this thickness in relation to the overall layer thickness of the coating.

1. Introduction

Under the current technological conditions, the primary objective in the field of surface treatment is to achieve a “functional surface”. Because of its considerable weight and cost, the construction parts of machinery or building components are designed with relatively fewer reserves, so materials are burdened up to the limits of their possible properties [1]. Conversion coatings are therefore used to produce components of aluminium and its alloys, which have a dual function: They improve the corrosion resistance of the metal material and at the same time increase the adhesion of the coatings by creating a smoother, chemically inert surface [2,3,4,5,6]. The layer thickness of surface layers formed by anodic oxidation of aluminium (corrosion resistance, hardness, abrasion resistance, decorative effects, etc.) has been optimized over the decades mainly due to the publication of new findings [6,7,8,9,10,11,12,13,14,15,16,17,18,19,20,21,22]. Thanks to the national organizations (e.g., QUALANOD), which laid the basis for the standardization of production conditions, it is reliably guaranteed for industrially produced oxide layers that their layer thickness corresponds to the stated requirements and application possibilities [1].
In addition to industrial applications, DOE (Design of experiments) as a methodology for planning and evaluating experiments has been finding even wider application in other scientific disciplines such as research in renewable energy sources [23,24,25,26] and the nuclear research area [27]; cancer research [28]; and in the field of manufacturing and sensor optimization [29], chemometry [30], composite materials [31], and corrosion [32].
The thickness of the porous layer formed depends on the chemical composition of the electrolyte and the operating conditions for anodic oxidation. Toshiyuki [33] monitored the effect of sulfuric acid concentration (30, 50 and 100 g∙L−1) on the thickness of alumina formed at 3 to 20 °C during an oxidation time of 1 to 20 h and a constant connected voltage of 20 V. In these conditions of anodic oxidation of aluminium, the Toshiyuki shows in its work a recorded increase in the thickness of the layer formed in relation to the increasing concentration of sulfuric acid in the electrolyte. According to Toshiyuki [33], an optimal concentration of sulfuric acid is 50 g∙L−1, where the thickness of the aluminium oxide layer formed is 40–270 μm depending on the time of the sample oxidation. Toshiyuki [33] indicates the direct proportion between the thickness of the oxide layer formed and the electrolyte temperature and the oxidation time. Toshiyuki [33] reports an optimal electrolyte temperature of 10 °C and an optimal oxidation time of 8 h; under these conditions, a 270 μm oxide layer thickness can be achieved. Bensach et al. [17] monitored the effect of the oxalic acid concentration added to the sulfuric acid solution at the oxidation of the EN AW 1050A alloy. Hsing-Hsiang et al. in their work [34] monitored the effect of sulfuric acid in combination with a different concentration of boric acid in the electrolyte (0–20 g∙L−1) and a different concentration of nitric acid in the electrolyte (0–20 g∙L−1) to the resulting thickness of the formed aluminium oxide layer. Their work shows that the increasing concentration of boric acid and nitric acid in the electrolyte also increases the thickness of the oxide layer formed. The effect of the temperature of the electrolyte used as well as the time of oxidation of the sample on the thickness of the aluminium oxide layer formed was also discussed by Hsing-Hsiang [34]. For the used electrolyte formed with sulfuric acid, boric acid and oxalic acid, the optimal oxidation time is 50 min. At this oxidation time, the thickness of the formed alumina layer is 25–50 μm, depending on the concentration of the individual components of the electrolyte. Hsing-Hsiang et al. consider 30 °C the optimum electrolyte temperature, at which a layer thickness of 25 to 50 μm is achieved depending on the concentration of the individual electrolyte components. However, the concentration of boric acid and nitric acid according to Theohari et al. should not exceed 15 g∙L−1, as the oxide layer formed is fired or pulverized [35]. Chung et al. [36] stated that 6.8 nm·min−1 is the growth rate of the thickness of the oxide layer formed in the oxalic acid electrolyte (45 g·L−1) at 5 °C for 1 h and at the applied voltage of 40 V, similar to Yakovleva et al. [37].
At present, there are a number of works that deal with the influence of individual input factors on the thickness of the layer formed, its structure and porosity. The impact of the electrolyte temperature on the morphology of the layer is attributed mainly to the increasing aggressiveness of the electrolyte at higher values of its temperature [38,39]. Therefore, due to the improved chemical solubility of the oxide formed, the structure of the formed layer is strongly influenced by the temperature. With the increasing electrolyte temperature, the oxide layers formed are more porous, the pores having a larger diameter and thinner walls towards the surface of the layer. In addition, at a constant current density with an increasing electrolyte temperature, the thickness of the formed layer decreases [40].
The concentration of the added components in the electrolyte affects the electrical conductivity of the electrolyte. The molecules of the added components are dissociated in the aqueous solution to the ions. By electrochemical oxidation-reduction reactions, oxygen is released from them on the surface of the anode, which directly contributes to the formation of an aluminium oxide layer. On the other hand, sulphates, chromates, chlorides, borides, and other acid anions increase the aggressiveness of the environment in which the layer is formed during its formation and are thus directly responsible for the reverse dissolution of the aluminium oxide layer into the electrolyte [2,41].
The presented paper deals with the experimental analysis of the influence of chemical and physical factors, especially on the thickness of the anode layer formed in the H2SO4 electrolyte. In most of the papers published, the impact of each chemical or physical factor on the properties of the anode layer formed is studies separately. Due to the fact that the process of anodic oxidation of aluminium is a nonlinear multipath system with input factor interactions, the DoE methodology with a central composite orthogonal plan has been applied. This allows us to obtain statistically and numerically correct results due to the complexity of the whole process of anodic oxidation and to draw conclusions respecting also the influence of interactions of interacting factors.

2. Materials and Methods

2.1. Experimental Part

The method of anodic oxidation, termed as GS (dc sulfuric acid anodizing), was used in the research work. The factors acting during the process of anodic oxidation of the surface layer of aluminium and its alloys can be divided into chemical (especially electrolyte composition), physical (especially electrolyte temperature, electrolysis time, and current density), material (especially surface material and the type of the cathode used), and technological (especially the electrolyte cooling method and electrolytic tank dimensions), or into controlled variable factors, uncontrolled factors maintained at a constant value, and random negligible factors. The levels of factors used were defined in two respects. In the first, they were defined based on the recommendations mentioned in the literature [1] and, on the other hand, they were selected on the basis of 20 years of practical experience of one of the authors of the article in a company that performs anodic oxidation of aluminium. The individual defined levels of the factors had to meet the conditions for the feasibility of the individual experiments in all their possible combinations. The research was carried out by the DoE methodology under the experimental conditions listed in Table 1.
A matrix of the plan was created, according to which the individual experiments were performed. The individual experiments were performed in random order to minimize the systematic error to prevent the subjective preference of one of the input factor levels. Technological verification of the electrolyte functionality was performed using a Hull’s tank (Figure 1). The experimental apparatus contained a controllable DC power source (with continuous voltage regulation ranging from 0 to 20 V and current ranging from 0 to 5 A), ammeter and voltmeter. As a result of the continuously changing distance between the cathode and the anode, a continuous change of the anode current density JA (Equation (1)) occurred for a total current value ranging from 0.25 to 6 A (Equation (1)):
J A = I [ 5.102 5.240 log ( x ) ]
where I is the total current in the Hull’s tank, x is the distance of the considered site from the edge with the maximum current density. The validity (Equation (1)) is limited due to the requirement for the accuracy of the results, i.e., the first and last 10 mm of the sample are not considered for practical use.

2.2. Material

The experimental material is detailed in Table 2 and Table 3, i.e., aluminium EN AW-1050A H24 (Alumeco Service GmbH., Coswig, Germany), sulphuric acid solution and distilled water. The chemical composition of sulfuric acid used to prepare the electrolyte from the point of view of the admixtures is shown in Table 2. For the preparation of electrolytes, sulfuric acid of p.a. purity was used.
Aluminium was added to the electrolyte as Al2O3. Although, in general, aluminium dissolved in the electrolyte does not have a significant effect on the anodization process, this claim applies to the recommended values of anodic oxidation by the GS method. We, therefore, wanted to verify this claim beyond the recommended anodic oxidation parameters. The effect of aluminium in the electrolyte, according to the practical experience of the authors with the commercialization of the anodic oxidation of aluminium, starts to manifest itself unfavourably from the value of 12 g·L−1. However, this effect was analysed in another experiment and has not been published yet.
The justification for using Hull’s tank to perform the experiment is consistent with the results published in the work by Akolkar et al. [42]. Akolkar showed that whenever there is significant influence of the geometry (which is indeed the case of the Hull cell), the current density distribution is “under a mixed control of ohmic transport within the electrolyte and the surface film resistance”. This is an important result: Even though the presence of the barrier layer contributes a uniform resistance over all the surface of the anode, important geometry non uniformities may result in a close to primary current distribution in anodizing. This is the reason why the empirical relationship (Equation (1)) works also for anodizing. These results and conclusions are also supported by simulation of the process of anodic oxidation by the finite-element method in the COMSOL Multiphysics program system (as an anodic process) shown in Figure 2.
When calculating the local anode current density according to Figure 2c in the range of 0–100 mm, the calculation model of the COMSOL Multiphysics system gives values with a negligible statistical deviation with the (Equation (1)). Consequently, Hull’s tank was used for experimental verification.
The basis for the experimental analysis is the diagram of the current density distribution (Figure 3). The individual courses were selected only for a clear illustration of the course of the dependence of the cathode distance and anodized local anode current density and the distance from the edge of the sample.

2.3. Thickness Measurement of the Layer

To measure the thickness of the layer, the MINITEST 4000 digital thickness meter by the German manufacturer ElektroPhysik (Köln, Germany) was used together with the N400 measuring probe, which is designed to measure non-magnetic layers such as aluminium, copper, chromium, rubber, and others by the eddy current method in the range of 0–400 μm. Extended uncertainty U expressed as the standard uncertainty uc, multiplied by the coverage factor k = 2, represents the value μc = 1.5 μm for a nominal thickness of a layer defined by a standard of 50 ± 1 μm. This value was determined by calibrating the probe used by an independent certification authority.

2.4. Screening Analysis

The screening analysis was used for current densities (Figure 4). Due to the nature of the experiments performed using the DoE methodology and the way they are evalauted by mathematical statistical methods, the screening analysis was performed by a statistically correct approach, i.e., using the analysis of basic assumptions and subsequent analysis of the traditional regression triplet: data, model and residues. This analysis clearly showed that the amount of aluminium in the electrolyte does not affect the thickness of the layer formed in any way, and depending on the current density, the effect of the individual factors and their interactions on the parameter to be monitored in the interval 1–3 A·dm−2 is different. At higher current densities (4–5 A·dm−2), however, there is no difference in the effect of the factors, only the influence on the effect size.
The scatter of the predicted value depending on the effect of the factors is the result of a scatter error and the number of factors depending on the type of experimental design used and the factor setting. Before the experimental data are acquired, the scatter error is an unknown quantity. However, the scatter prediction/error scatter ratio is not a function of error scatter. This ratio, the so-called relative prediction variance depends only on the type of experimental design used and the characteristics of the factors used and can be calculated before the data are obtained. The chart of prediction scatter profiles shows the relative deviation of predictions of individual factors at the fixed value of other factors. Generally, the scatter error decreases with the sample size. A diagram of a fraction of the design space was used as a tool to record the variance share for the prediction of the values ranging from 0 to 100% on the x-axis and the variance range of the prediction of the values on the y-axis. Figure 5 shows that all the values are below 0.47 and above 0.31.
Given that experimental data are typically characterized by unconventional scatter, asymmetric distribution and violation of the basic requirements for a data set; therefore, the survey was carried out in three follow-up steps, which were also applied to the results of the experimental verification of the thickness of the layer formed [43]:
  • Exploratory Data Analysis (EDA)—serves to investigate the statistical specificity of data such as local data concentration, shape specificity of data distribution and the presence of outliers. The techniques of exploratory analysis can also detect anomalies and deviations from the distribution of a set of experimentally obtained data from the typical distribution, which is most frequently the usual Gaussian distribution. If the analysis demonstrates an inappropriate distribution type for standard statistical analysis (usually asymmetric), appropriate data processing is performed by transformation (power or Box-Cox transformation).
  • Verification of data requirements—serves to verify essential requirements such as element independence, selection homogeneity, a sufficient range of selection, and distribution of selection.
  • Confirmatory Analysis (CDA)—represents tools for estimation of position, dispersion and shape parameters, which can be divided into two groups: traditional estimates and robust estimates (insensitive to outliers and other requirements for input data).
The sampling analysis procedure itself to obtain an objective mean value representing the result of measuring the thickness of the formed layer for individual local current densities on individual samples and, of course, for the measurement of a standard, was carried out in two steps. In the first step, individual measurements for the same local current density were evaluated using standard statistical methods, in particular for determining the normality of a set (Shapiro–Wilks test) and identifying outliers and extreme values (Grubs test, Dixon test). The example of analysis results for the local current density JA = 5A·dm−2 for sample No. 1 is shown in Figure 5.
This analysis was applied to the thickness measurements for all local anode current densities for all samples of both experiments and for the corresponding measurements on the standard. For cases where normal distribution was not possible after identification and exclusion of outliers and extreme values and for cases where the normality of data distribution (even without the presence of outliers) were not demonstrated, exponential and Box-Cox transformation was performed.
Based on the above, the mean value was used for layer thickness analysis for individual local anode current densities, depending on the results of the survey analysis. For the data set of experimental data that was used: the arithmetic mean for the sets with normal distribution, the average adjusted by power or Box-Cox transformation and winsorized mean (robust characteristic) for sets where data transformation was not appropriate and did not show Gaussian distribution.

2.5. Statistical Analysis and Creation of a Mathematical Model

Table 4 shows a summary of the analysis of the suitability of two of the selected models (R-square, R-square adj, root mean square error, mean of response, AICc, and BIC) describing the effect of the factors on the thickness of the layer formed by anodic oxidation of aluminium using the GS method. This table shows the suitability of the selected model: The share of the variability of the measured thicknesses (R-square) represents the values ranging from 91% to 95%, and the adjusted determination index (R-square adj) ranges from 88% to almost 93%.
Subsequently, variance analysis (ANOVA) was applied where it can be assumed that the variability caused by random errors is significantly less than the variability of the measured values explained by the model; the value of the reached level of significance (Prob > F) indicates the adequacy of the model used, based on the Fisher–Snedecor test criteria. The Fisher–Snedecor test tests a zero (H0) statistical hypothesis according to which none of the effects used in the model affect the significant change of the variable under consideration. If the level of significance reached (Prob > F) is less than the selected significance level α = 0.05, it can be concluded that there is not enough evidence to accept H0 and we can say that the model is significant. This conclusion could be accepted for all local anode current densities.
Further testing is through the so-called test of the lack of adaptation of the model, where we compare the dispersion of residues and the dispersion of the measured data within the groups, and thus we test whether the regression model adequately reflects the observed dependence. For the local anode current densities used, we can accept a zero statistical hypothesis resulting from the nature of the inadequate adaptation error test, and we can conclude that the models sufficiently reflect the variability of the experimentally obtained data.
Based on the above assumptions and their fulfilment, Table 5 shows the model parameter estimation for the current density of JA = 5 A·dm−2, testing the significance of the individual effects and their combinations at the significance level α = 0.05.
Table 6 shows that the effects that significantly affect the conditioned mean value of the observed response are the amount of sulphuric acid, the electrolyte temperature and the anodic oxidation time. At the same time, it is obvious that in addition to the independent effects of the factors, their interactions are also important; they are significant on the basis of the individual t-test at the chosen significance level. Similarly, the variance inflation factor (VIF) points to the fact that the multicollinearity (VIF < 10), which significantly contributes to the statistical and numerical correctness of the model used, is not present in the model. Similarly, testing the effects using the F-test points to the statistical significance of the individual model members, and it should be considered an absolute model member. The intercept can be tested only by an individual t-test.
From the effect estimates (Table 6) as well as verification of their statistical significance by the individual t-test and the F-test, a statistical model for the coded conditions of the individual factors can be created (Equation (2)):
y ^ J A = 5 A dm 2 = 12.86 + 5.23 x 1 + 1.61 x 4 + 2.07 x 3 1.31 x 1 x 3 2.24 x 3 2 + + 0.71 x 4 3 3.52 x 4 2 x 1 1.32 x 1 x 3 x 4
Taking into consideration the DoE normalization of the individual factors according to (Equation (2)), the statistical model can be converted into a natural scale, and thus, a technological model of the dependence of chemical and physical factors on the thickness of the surface layer can be created (Equation (3)):
t h J A = 5 A dm 2 = 5.25 + 0.31 T 0.196 t 2.73 × 10 3 m ( H 2 SO 4 ) + 2.19 × 10 3 T t + + 1.3610 4 T m ( H 2 SO 4 ) + 1.91 × 10 3 t m ( H 2 SO 4 ) 5.34 × 10 3 T 2 1.9210 5 t 2 m ( H 2 SO 4 ) + 1.23 × 10 3 t 2 + 1.67 × 10 5 t 3 1.27 × 10 5 T t m ( H 2 SO 4 )
The impact of the single significant factors listed in Table 5 and Table 6 as the major, self-acting effects on the thickness and the properties of the anodic layers formed on the aluminium surface is the subject of many studies. Input factor influence monitoring is of great importance in terms of better understanding the behaviour of the technological process of aluminium anodic oxidation. It is possible to detect changes of outputs based on input parameter changes. The most frequent factors influencing the surface of the aluminium oxide layer regarding its quality and thickness include mainly:
  • The concentration of the added components in the electrolyte affects the electrical conductivity of the electrolyte. The molecules of the added components are dissociated in the aqueous solution to the ions. Oxygen is released from electrochemical oxidation-reduction reactions on the surface of the anode, which directly contributes to the formation of an aluminium oxide layer. On the other hand, sulphates, chromates, chlorides, borides, and other acid anions increase the aggressiveness of the environment in which the layer is formed and are thus directly responsible for the reverse dissolution of the aluminium oxide layer into the electrolyte [40,41].
  • The amount of connected voltage affects the magnitude of the electrical potential from which the electrodynamic forces acting on the dissociated ions in the electrolyte are directly proportional. This means how much oxygen and oxygen ions are attracted to the surface of the aluminium substrate and how deep the barrier layer moves under the former substrate surface. The size of the connected voltage also affects the formed aluminium oxide layer structure orderliness [44,45].
  • The oxidation time of the sample determines the instantaneous rate of the aluminium oxide layer formation on the surface of the aluminium substrate. At the beginning of the oxidation, the rate of formation of the layer is highest, and with the increasing thickness of the oxide layer, it decreases to the point where the growth of the oxide layer completely stops. If the anodic oxidation process continues, the aluminium oxide layer can be dissolved to the electrolyte within a reverse process. In this case, the layer starts to grow again, but its internal structure is compacted, so the initial thickness of the formed aluminium oxide layer cannot be achieved. The oxidation time of the surface is thus partly related to the resulting thickness of the oxide layer formed [46,47].
  • The electrolyte temperature increases the conductivity of the electrolyte and the rate of electrochemical reactions between the substrate and the electrolyte on the surface of the anode, which prevents the aluminium oxide layer from forming more quickly. When exceeding the optimal temperature range and achieving rapid formation of the oxide layer, there is a risk of lowering its quality. The resulting oxide layers have reduced strength because the rapid formation of the oxide layer leads to so-called powdering, thereby causing the oxide layer to deteriorate due to any mechanical stress, and thus, the formed layer does not provide sufficient substrate protection against corrosion [48,49].
At this point, it is important to say that analysing the influence of only one input factor (electrolyte temperature, electrolyte composition, deposition time, size of the applied voltage) at constant values of other input factors, i.e., using a conventional single-phase experiment, does not allow satisfactory and, above all, correct conclusions due to the nature of the anodic oxidation process. It has a multifactor nature with interdependent influences of factors in the form of interactions of even higher orders. Therefore, the application of DoE methodology, as the only scientifically justifiable experimental methodology, enables to achieve numerical and statistically correct results throughout the experimental process and the evaluation of the experimentally obtained data [43].
Based on meeting the requirements for the suitability of the model used (Table 7), a residue autocorrelation test is defined; based on the value of the significance level achieved, a zero statistical hypothesis can be accepted for the absence of autocorrelation of residues at the chosen significance level α = 0.05.
Further testing of the regression model aims to verify the normal Gaussian residual distribution (Figure 6). Figure 6 shows that the level of significance of the Shapiro–Wilk test meets the residue normality condition, confirming the suitability of the selected and used model with respect to statistical and numerical correctness.
The individual models for local anode current densities used met all the requirements and conditions. Therefore, the models used can be evaluated statistically and are numerically correct.

3. Results and Discussion

In general, theoretically, the current density (anode, cathode) significantly affects the way the deposited coatings are formed and their properties. Based on Faraday’s laws applicable to electrochemical processes, the thickness of the deposited coating is directly proportional to the current density and the deposition time. Surface treatment plants use DC power sources with automatic control so that the current density (Equation (4)) remains constant at different surface sizes of the treated products, over a wide range of selection options for surface area size (Equation (4)):
J C ( A / K ) = I P A / K
where JC(A/K) is anode/cathode current density in the measurement unit A·dm−2, I is the total current in A, and PA/K is the effective anode/cathode area in dm2.
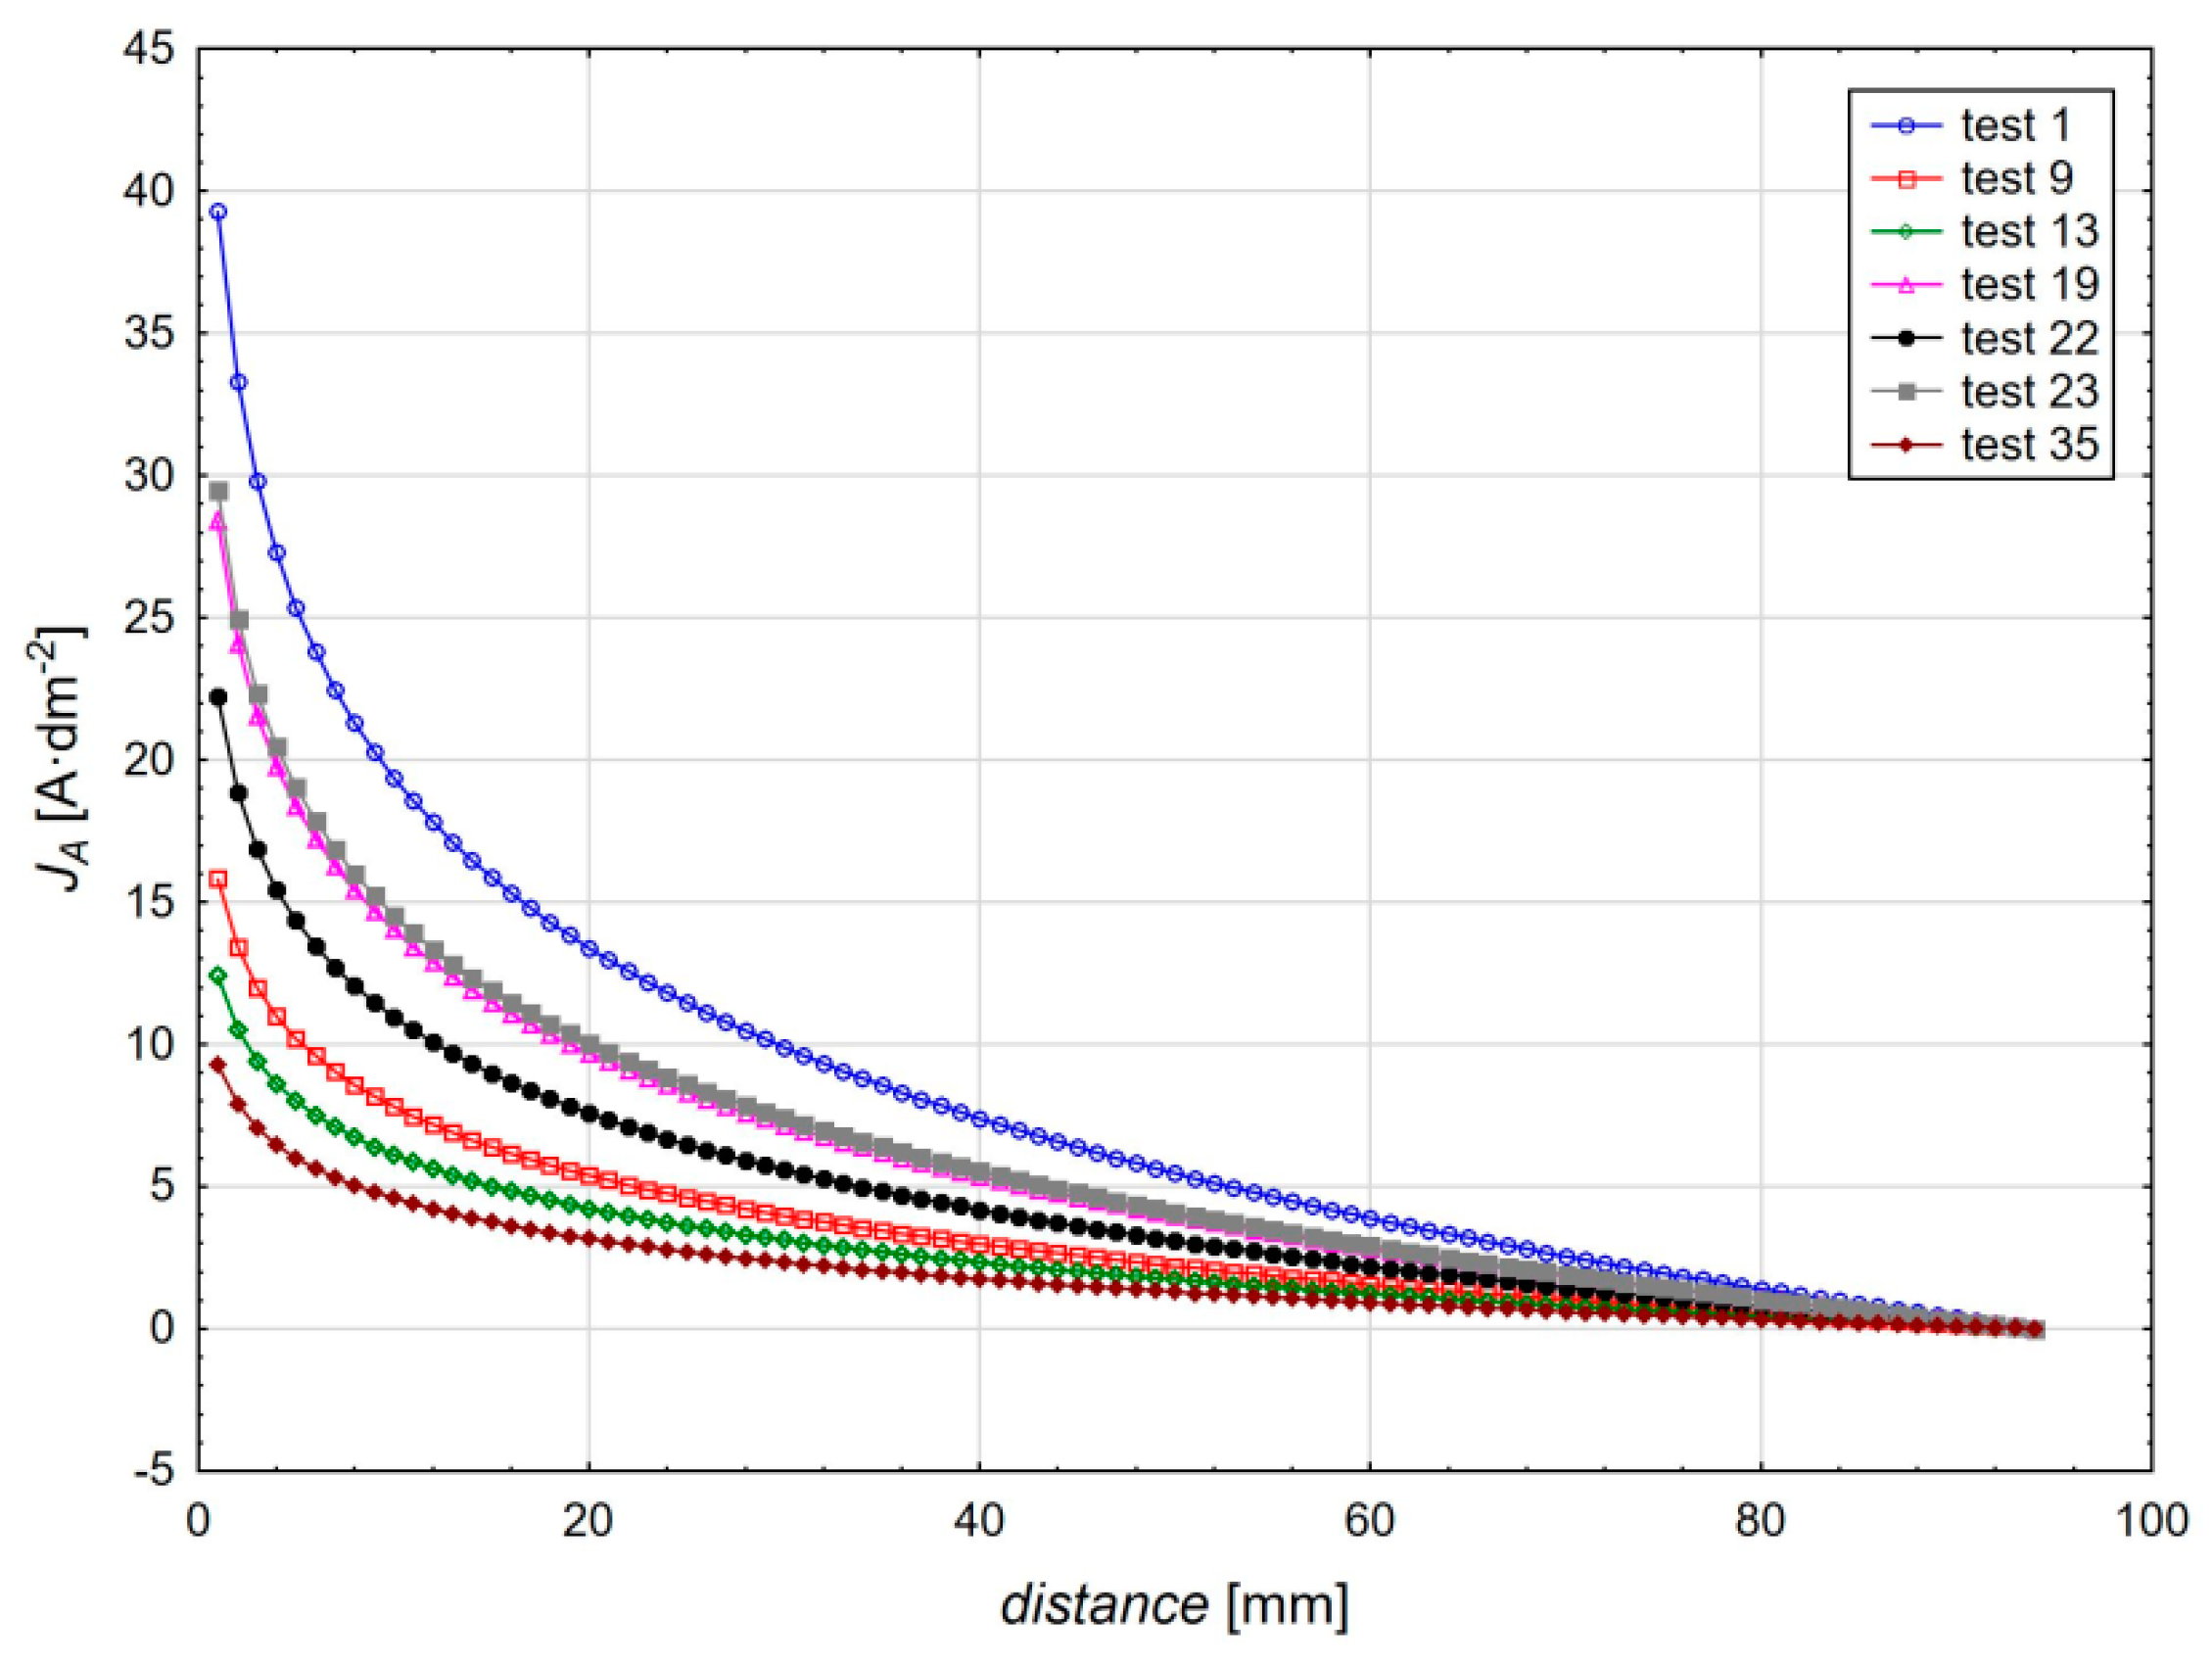
Practically, the actual, instantaneous, local anode current density (in the text briefly referred to as the current density) as determined in the individual anode locations may differ significantly from the general overall value and is influenced by the shape of the anode, its placement in the tank and also the distribution of the DC electric field in the tank. Also, the value of the total current changes during the anodic oxidation process, so the average value was used to calculate the current density.

3.1. Results of Statistical Analysis

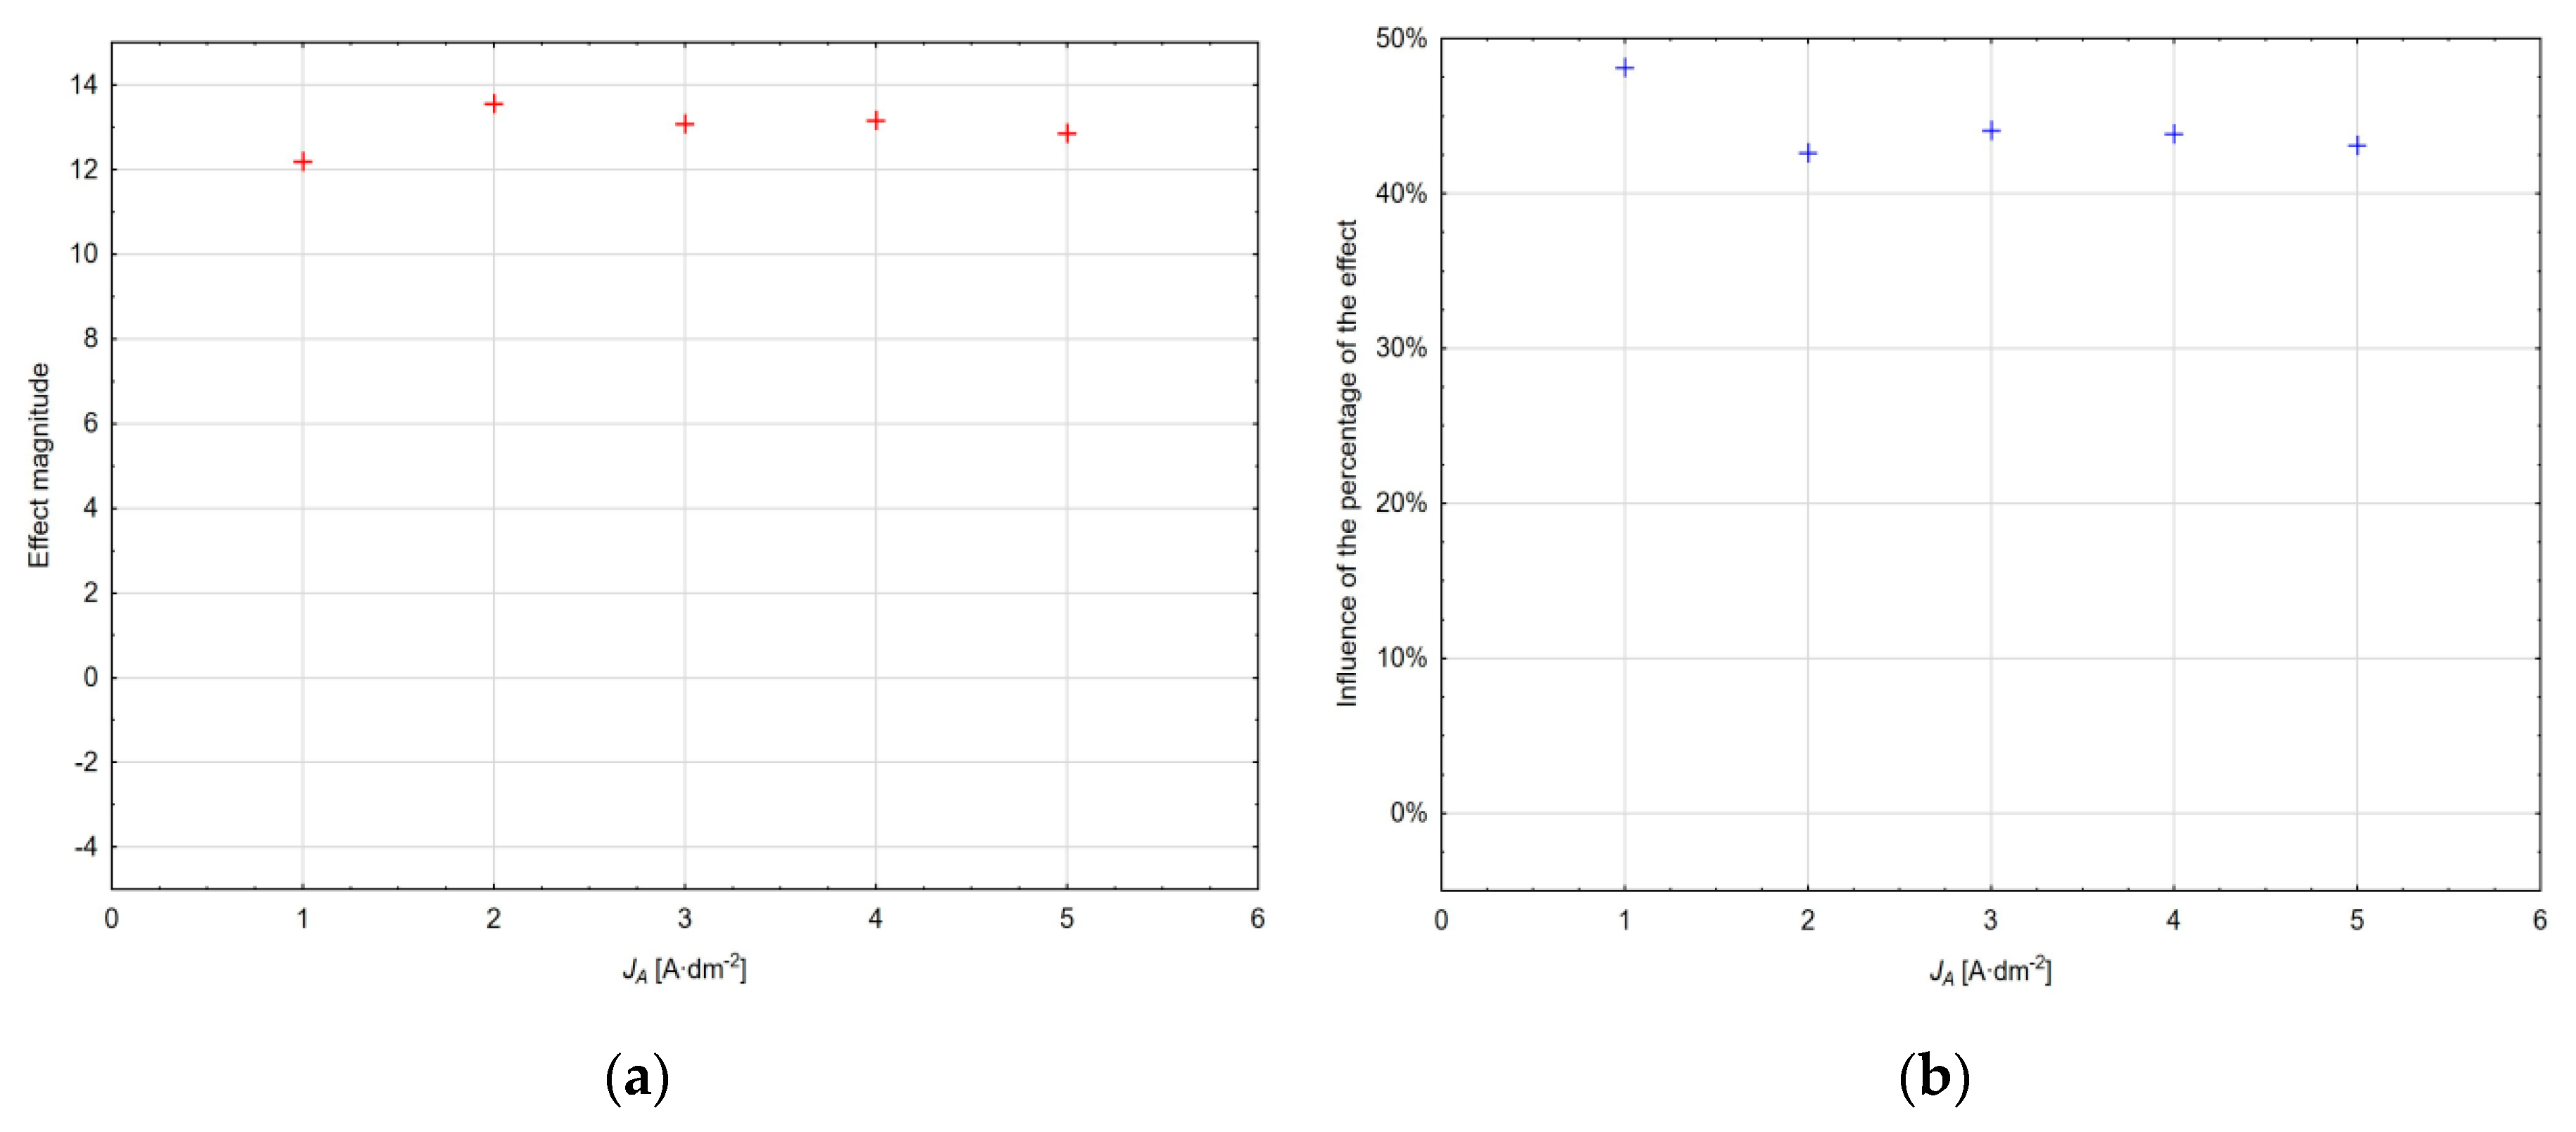
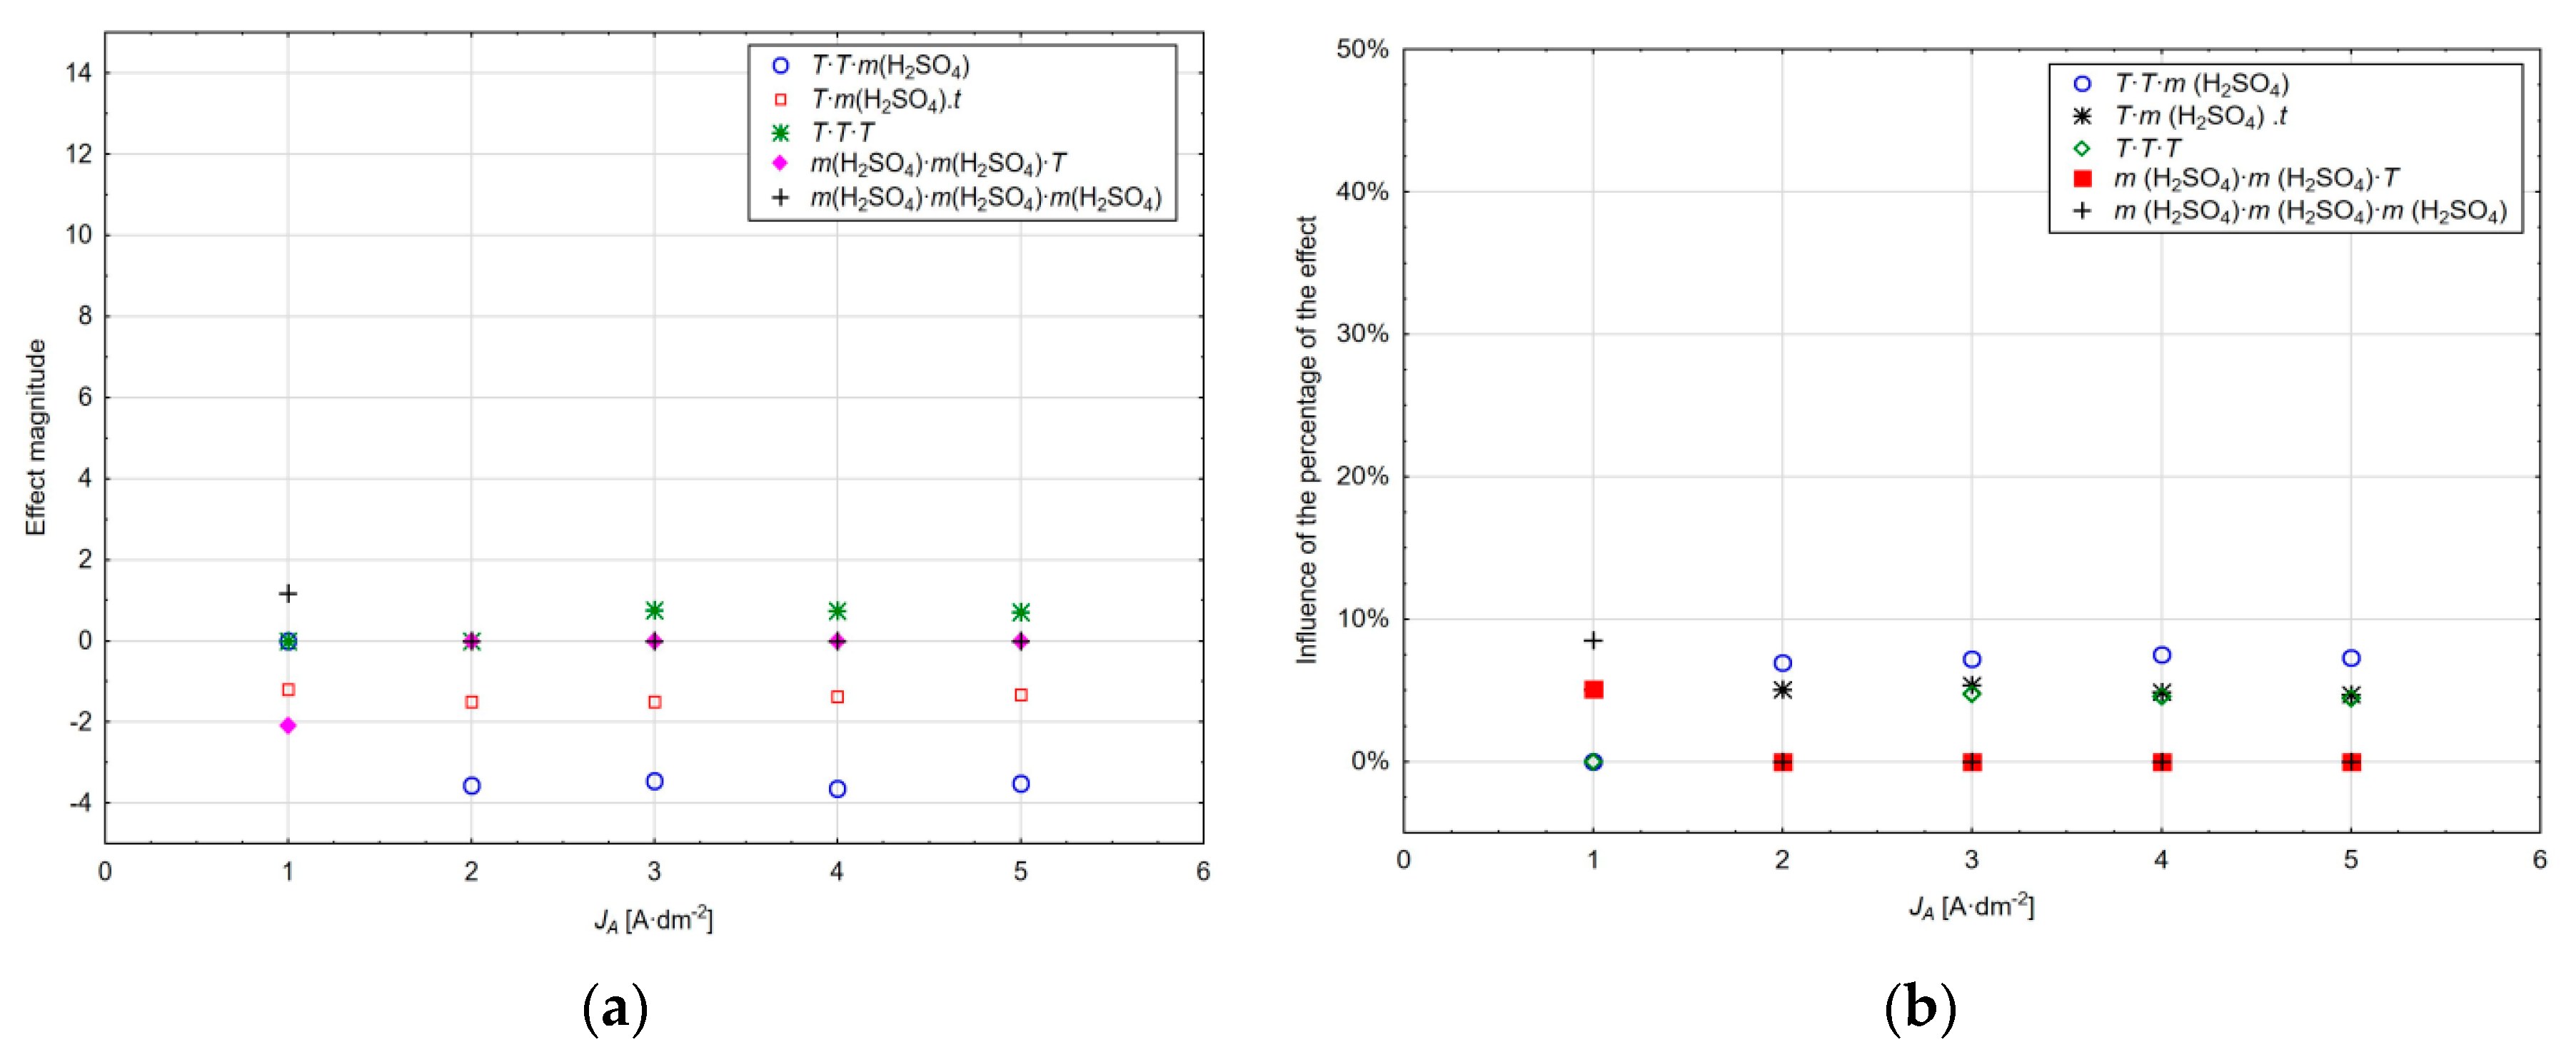
Based on the analysis performed at different current density values, it can be stated that with the change in the current density in the interval from 1 to 5 A·dm−2, the magnitude of the individual effects of the technological models changes; this change for the absolute member values is shown in Figure 7a, and its percentage within the total variability value can be seen in Figure 7b. The above diagrams show that the magnitude of the effect is the lowest in the area of the current density of 1 A·dm−2, it reaches the maximum at the current density of 2 A·dm−2 and gradually decreases at higher current densities. The percentage (the absolute member represents all neglected factors) is influenced by the choice of the type of the experiment plan, the choice of the prediction model, the range of the factors considered, and the number of their levels; the highest share being at the current density of 1 A·dm−2 and the lowest share at the current density of 2 A·dm−2. The model created for this current density describes the experimental data best.
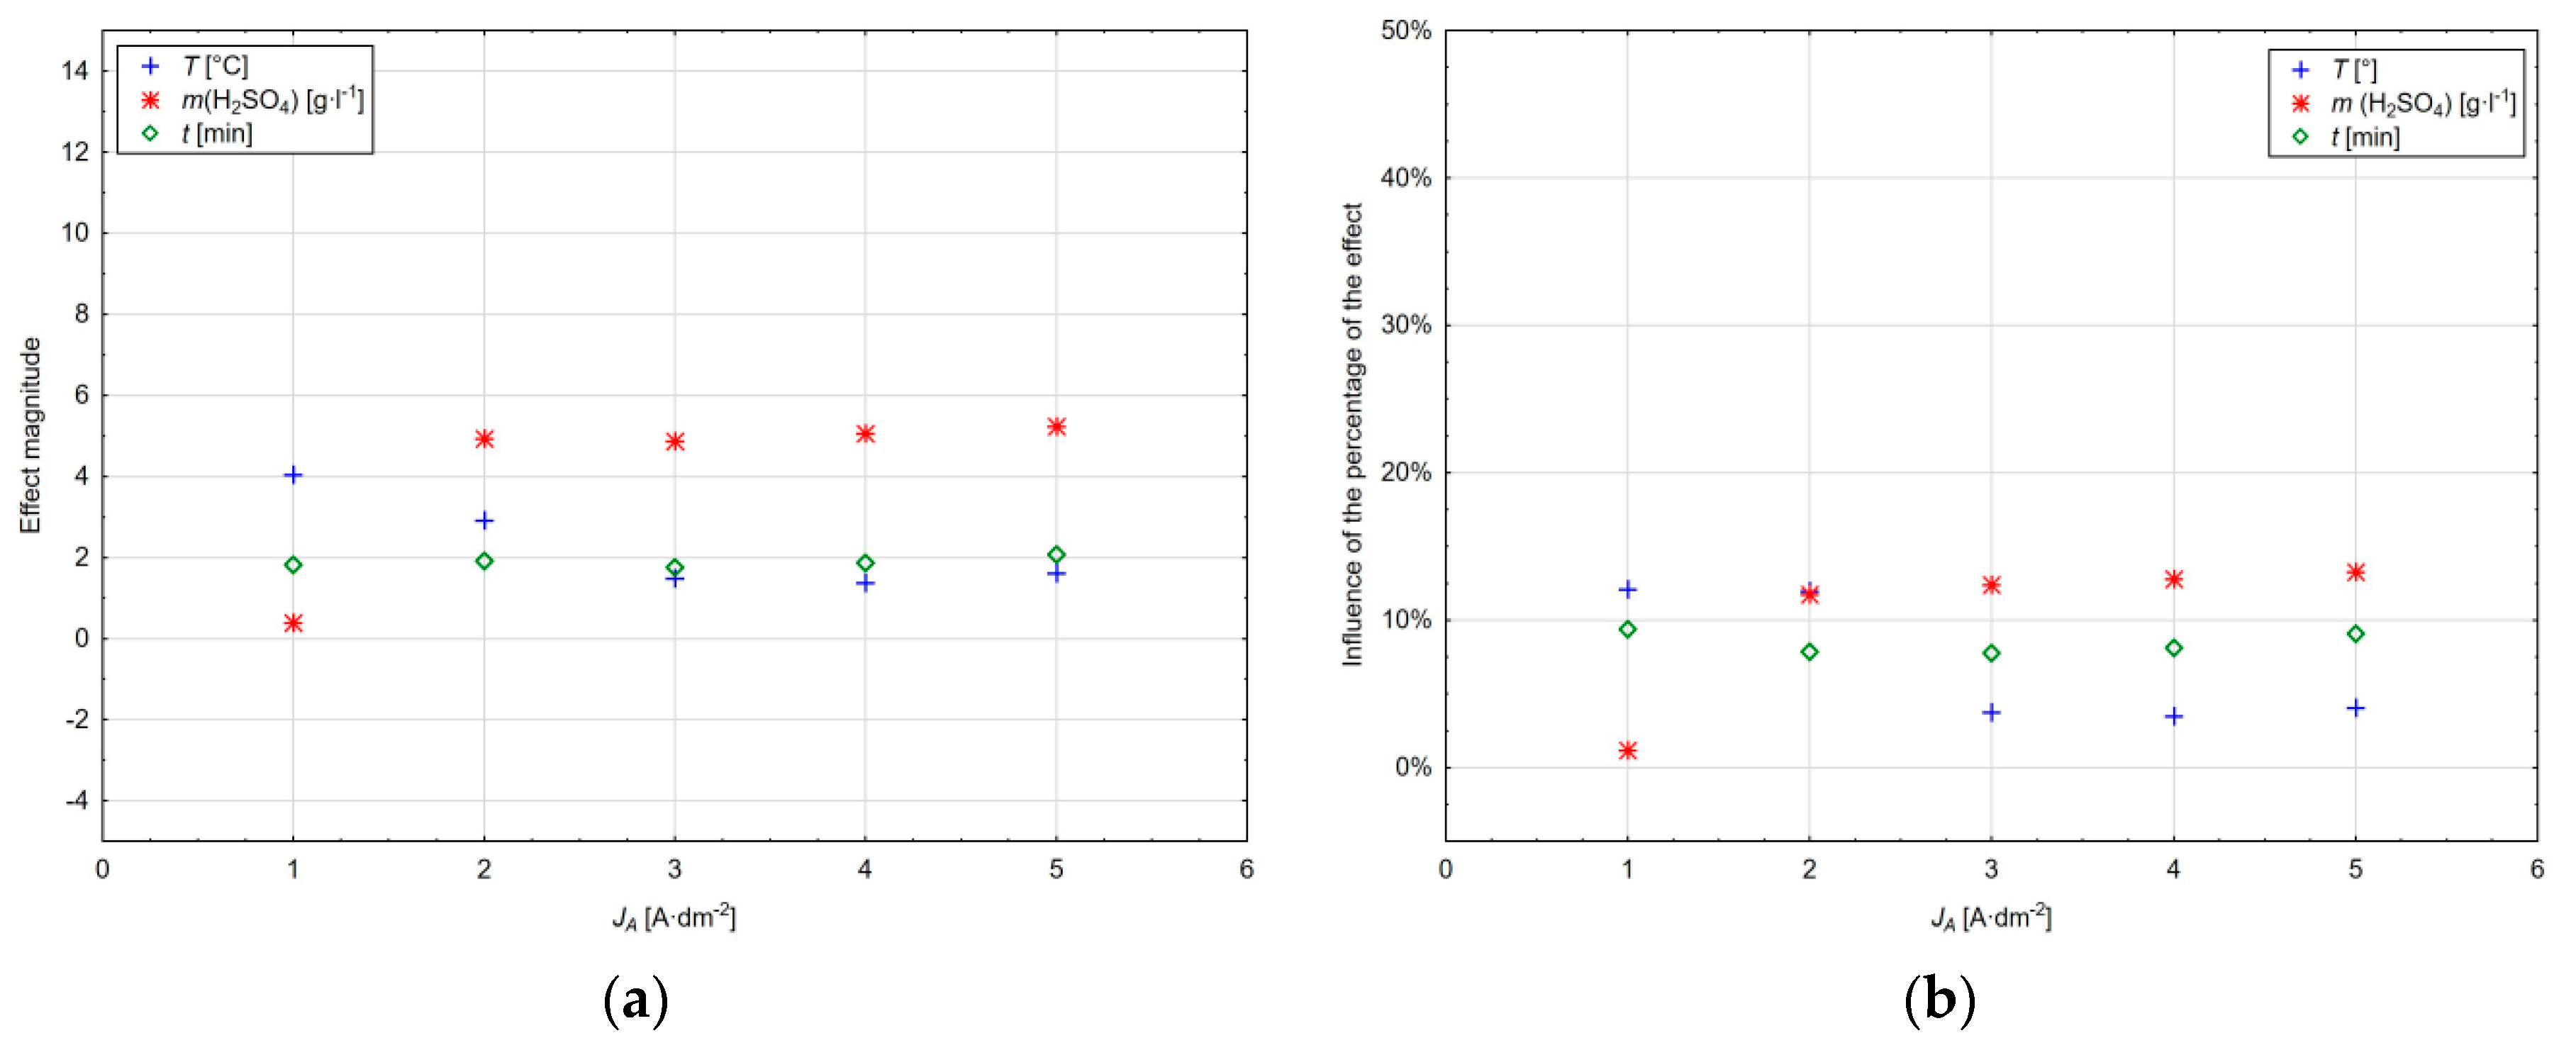
The value of the main effect magnitude within the range of current densities used as well as their percentage is shown in Figure 8a,b. It can be seen that the magnitude of the effect of factor x1 and the amount of sulphuric acid increases with the current density, whereas at 1 A·dm−2 this factor is not significant at the significance level α = 0.05. The opposite trend can be observed for the x4 factor and the anodic oxidation time, where the magnitude of this effect decreases with the increasing current density of up to 4 A·dm−2 and its influence increases by 1% at the current density of 5 A·dm−2. The electrolyte temperature represented by factor x3 has an approximately constant effect with increasing the current density with a slight decrease at the current density of 3 A·dm−2.
It is clear from the diagram in Figure 8b that the amount of sulphuric acid at the current density of 1 A·dm2 represents a negligible value of 1%. At this current density, the influence of the anodic oxidation time and subsequently the temperature of the electrolyte is dominant. However, with the increasing current density, the effect of sulphuric acid also increases to the detriment of the anodic oxidation time of aluminium, with the influence of the electrolyte temperature being maintained within the range of the current densities in a relatively narrow range from 7.77% to 9.39%.
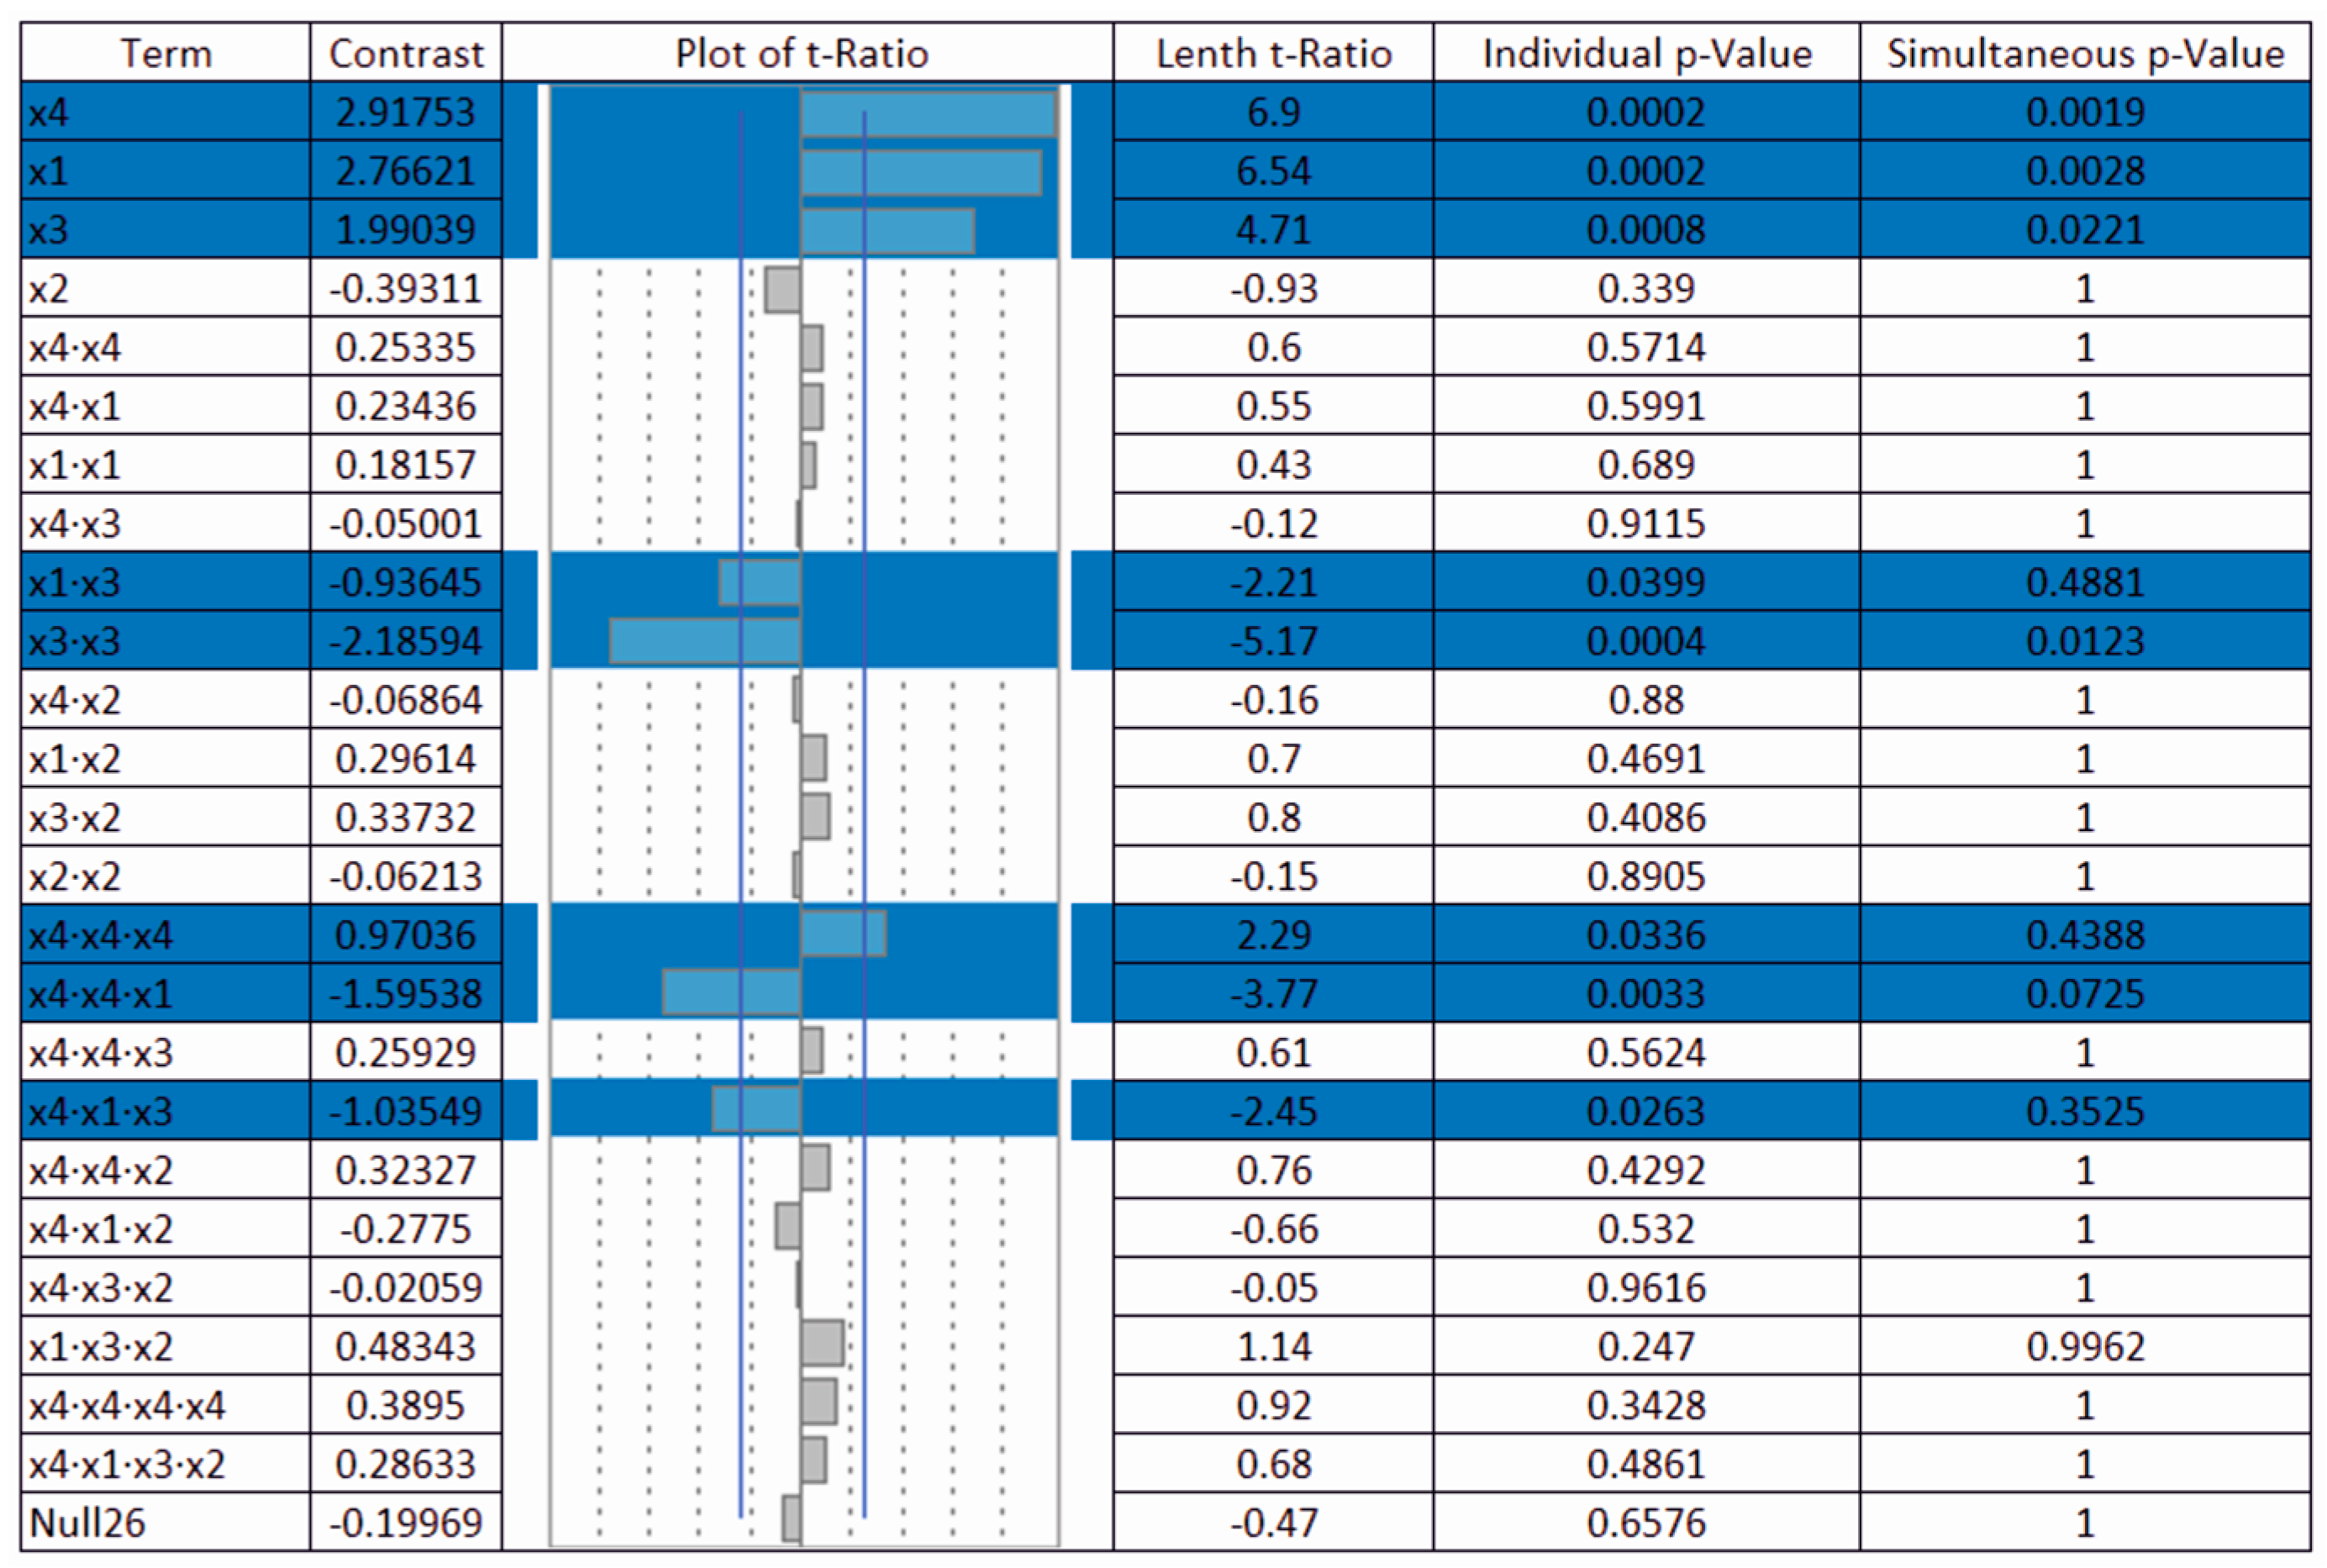
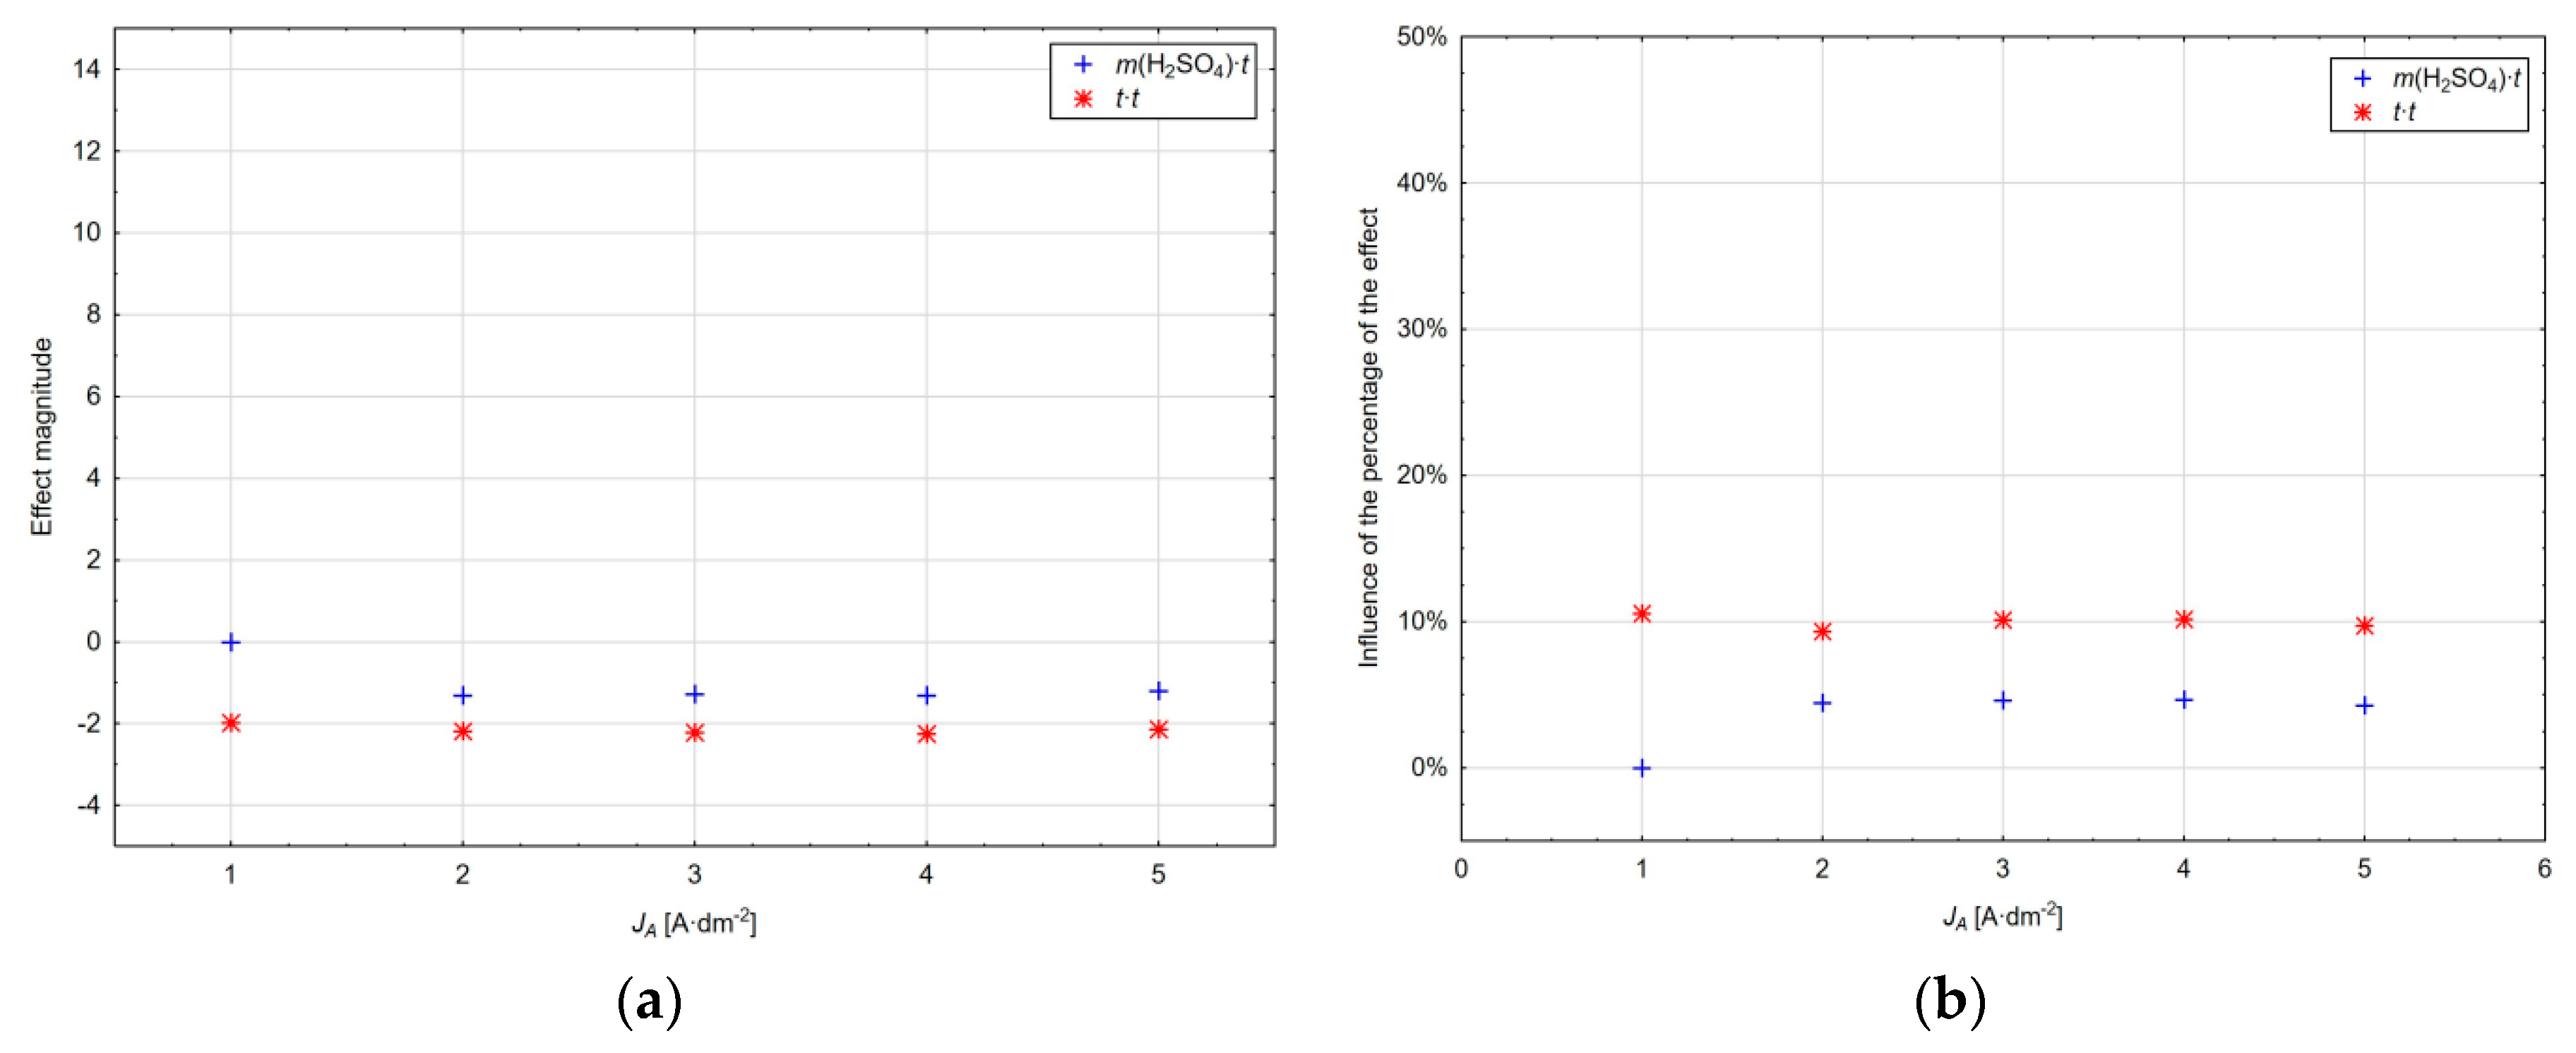
The influence of the interactions of the main effects is often more important than their isolated effect. For the two-level interactions of the created technological models, the magnitudes of the effects in dependence on the current densities are shown in Figure 9a,b.
At the current density of 1 A·dm2, the thickness of the layer formed is not affected by the combined effect of the sulphuric acid amount and the anodic oxidation time; with its increasing value, the magnitude of this interaction is almost constant. At the same time, a negative influence on the thickness of the layer can be observed from its sign, which can be attributed above all to an increase in the electrolyte temperature as well as to the effect of the dissolution of the layer during the process of its formation. The second power of the electrolyte temperature over the entire range of current densities has a more pronounced effect on decreasing the thickness of the layer formed than in the previous interaction. This effect is also significant at the lowest value of the current density, where its value is maintained at a narrow interval over the entire range of current densities used. Therefore, it is necessary to consider this influence irrespective of the current density value used. Increasing the electrolyte temperature as the main effect causes the thickness of the layer to increase. However, since the quadratic effect of the electrolyte temperature on the thickness of the layer formed has the opposite trend, the thickness of the layer decreases. In accordance with the theoretical considerations, this effect is due to an increased level of chemical dissolution of the layer formed as the accompanying phenomenon of the electrochemical formation of the anode layer. This trend also follows the percentage effect of individual effects for the quadratic effect of the electrolyte temperature across the range of current densities ranging from 9.35% to 10.58% and the effect of the interaction of sulphuric acid and electrolyte temperature from 4.28% to 4.67%. The interaction of the amount of sulphuric acid and the electrolyte temperature is reflected in the reduction of the thickness of the layer formed, as demonstrated in the experimental section. Especially with an amount of sulphuric acid greater than 175 g·L−1, a marked reduction in the thickness of the layer formed above the critical electrolyte temperature can be observed. The magnitude of the three-level effects for current densities of 1 to 5 A·dm−2 and their influence on the percentage is shown in Figure 10a,b. What is especially significant is the cubic action of sulphuric acid at the current density of only 1 A·dm2, with 8.49% impact, while at the other applied current densities, this effect does not act any more. Similarly, the interaction of the square amount of sulphuric acid and the time of anodic oxidation acts only at the current density of 1 A·dm2 with the influence of the percentage of 5.9%; the effect is reflected in the reduction of the thickness of the layer formed. The effect of the interaction of the square of the anodic oxidation time and the amount of sulphuric acid starts acting at the current density of 2 A·dm2, and the cubic effect of the time of anodic oxidation starts exerting its effect at the current density of 3 A·dm2. For a complete interpretation of the results, it should be added that the influence of the percentage of individual factors is also considered with the influence of the absolute model member.
Increasing the current density and increasing the amount of sulphuric acid in the solution and the anodic oxidation time causes a reduction in the thickness of the layer formed if the cubic value of the anodic oxidation time increases the conditional value of the layer thickness with the influence of the percentage on the change in the response variability from 4.44% to 4.74%. Interaction of all critical factors significantly influences the entire range of current density values, with the effect of reducing the thickness of the layer formed and the influence of the percentage from 4.72% to 5.38%.
Figure 11 shows a complex insight into the effect of various chemical and physical factors affecting the thickness of the layer formed; it shows the effect at values of the individual factors for current densities from 1 to 5 A·dm−2 used in practice.
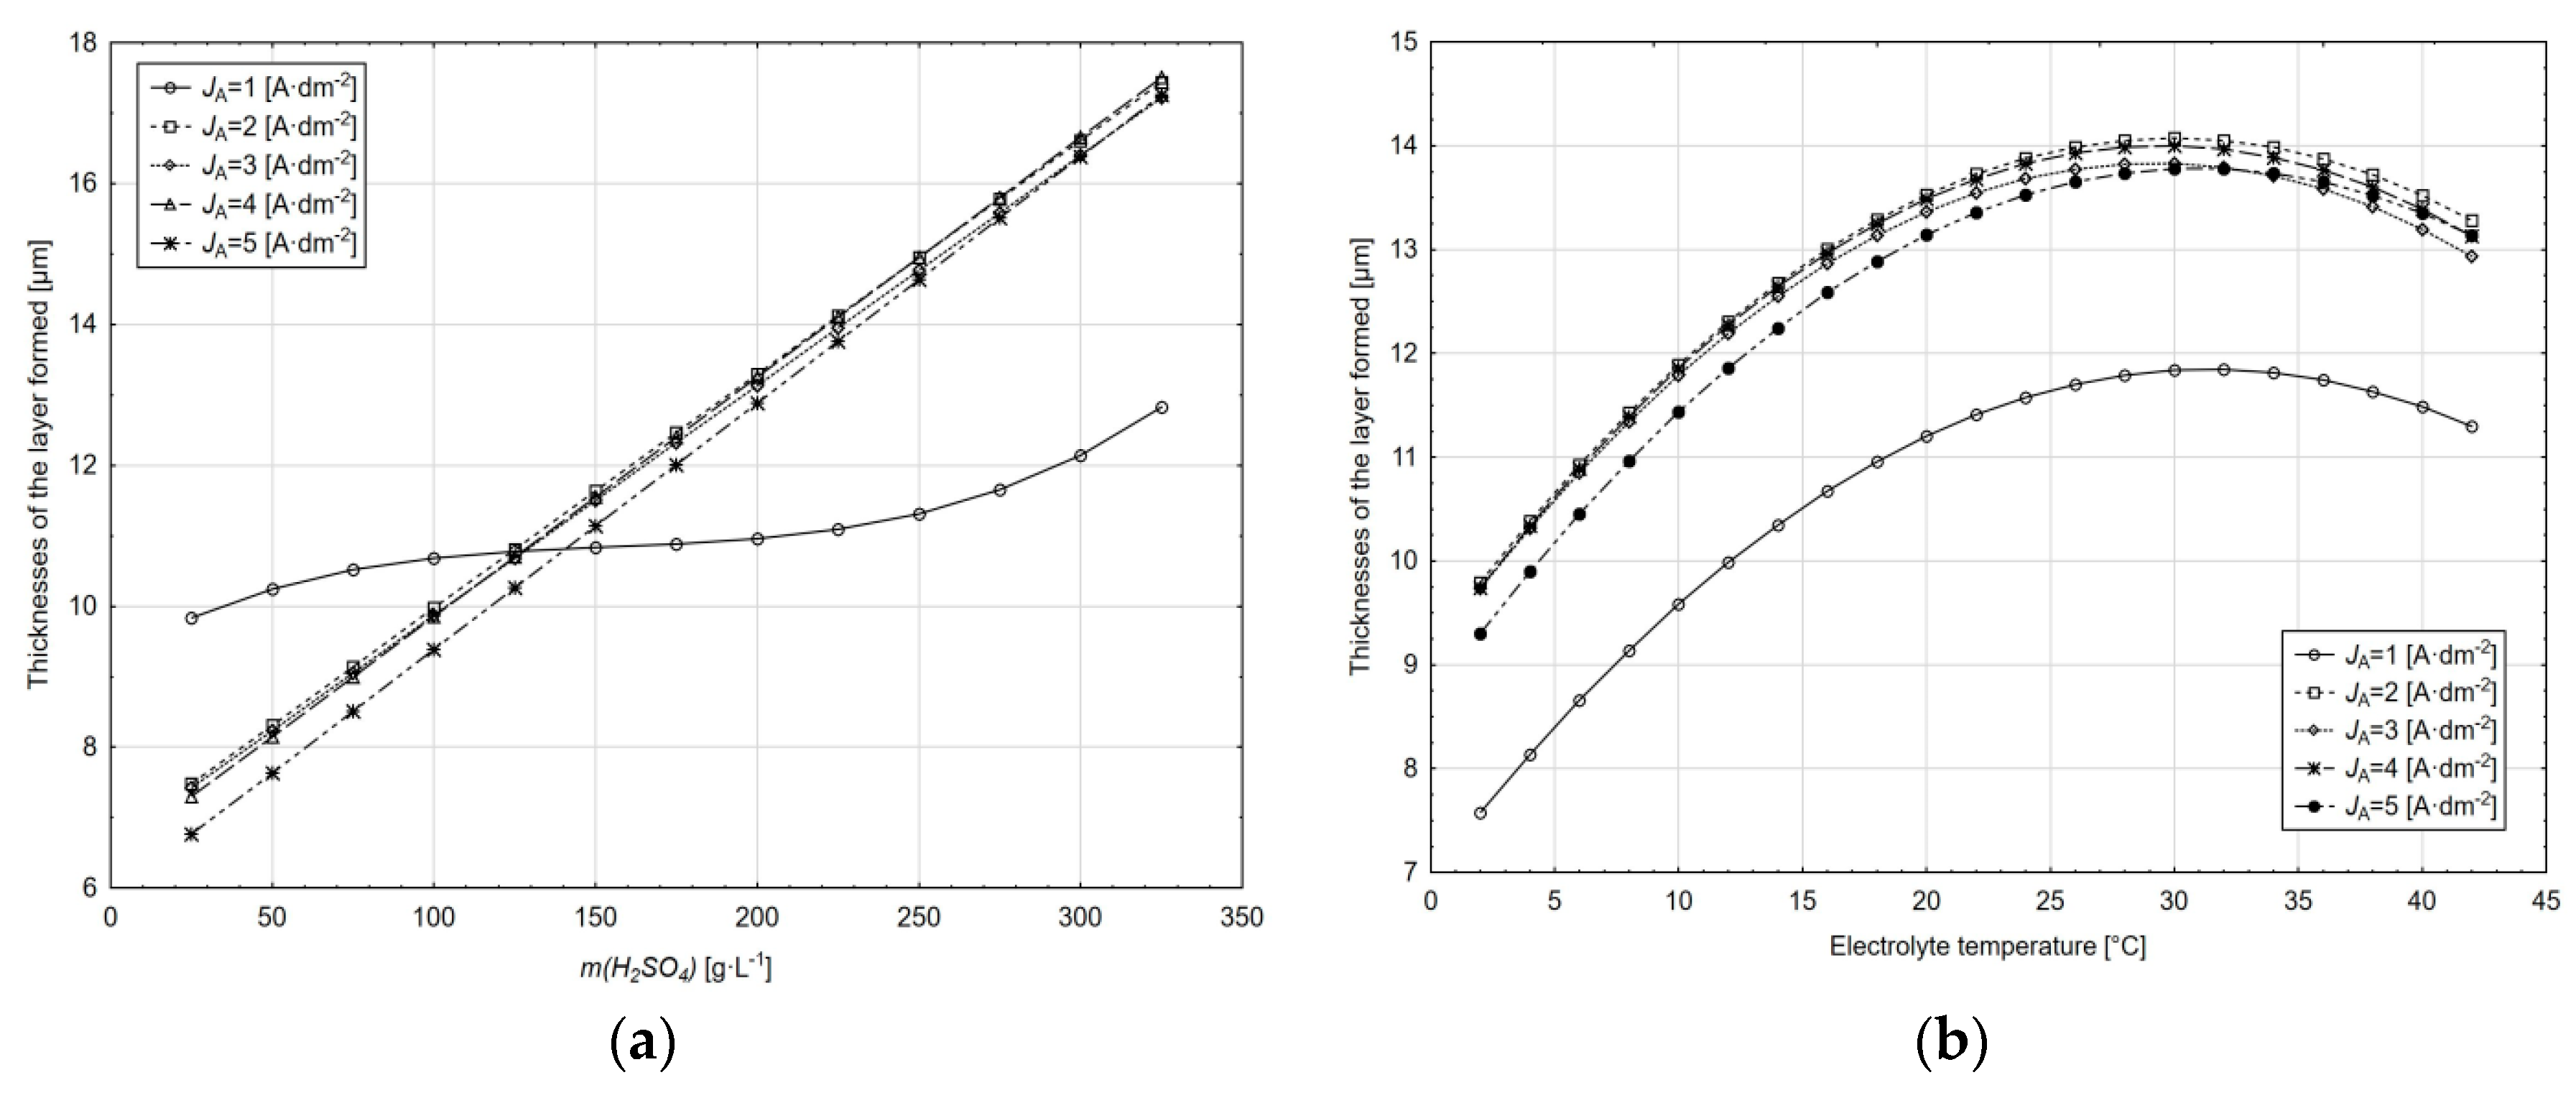
With the effect of the sulphuric acid amount in the electrolyte at the current density of 1 A·dm−2, only a slight change in the thickness of the layer formed can be observed with an increase in the sulphuric acid concentration; an increase in the layer thickness occurs in the area above 220 g·L−1.
At current densities of 2–5 A·dm−2, due to an increase in the sulphuric acid concentration, the thickness of the layer formed is increased over the entire interval; increasing the current density does not have a significant effect on the absolute thickness of the layer.
The same course can be observed for the dependence on the thickness of the layer formed on the electrolyte temperature irrespective of the current density value. The significant difference in the thickness of the layer formed is at the current density of 1 A·dm−2 relative to the other current densities. Two different areas of the electrolyte temperature influence the thickness of the layer formed, namely the area of growth of this thickness and the area of its decrease, with the areas separated by the critical temperature value. The critical temperature for anodic oxidation conditions ranges from 24 to 32 °C.
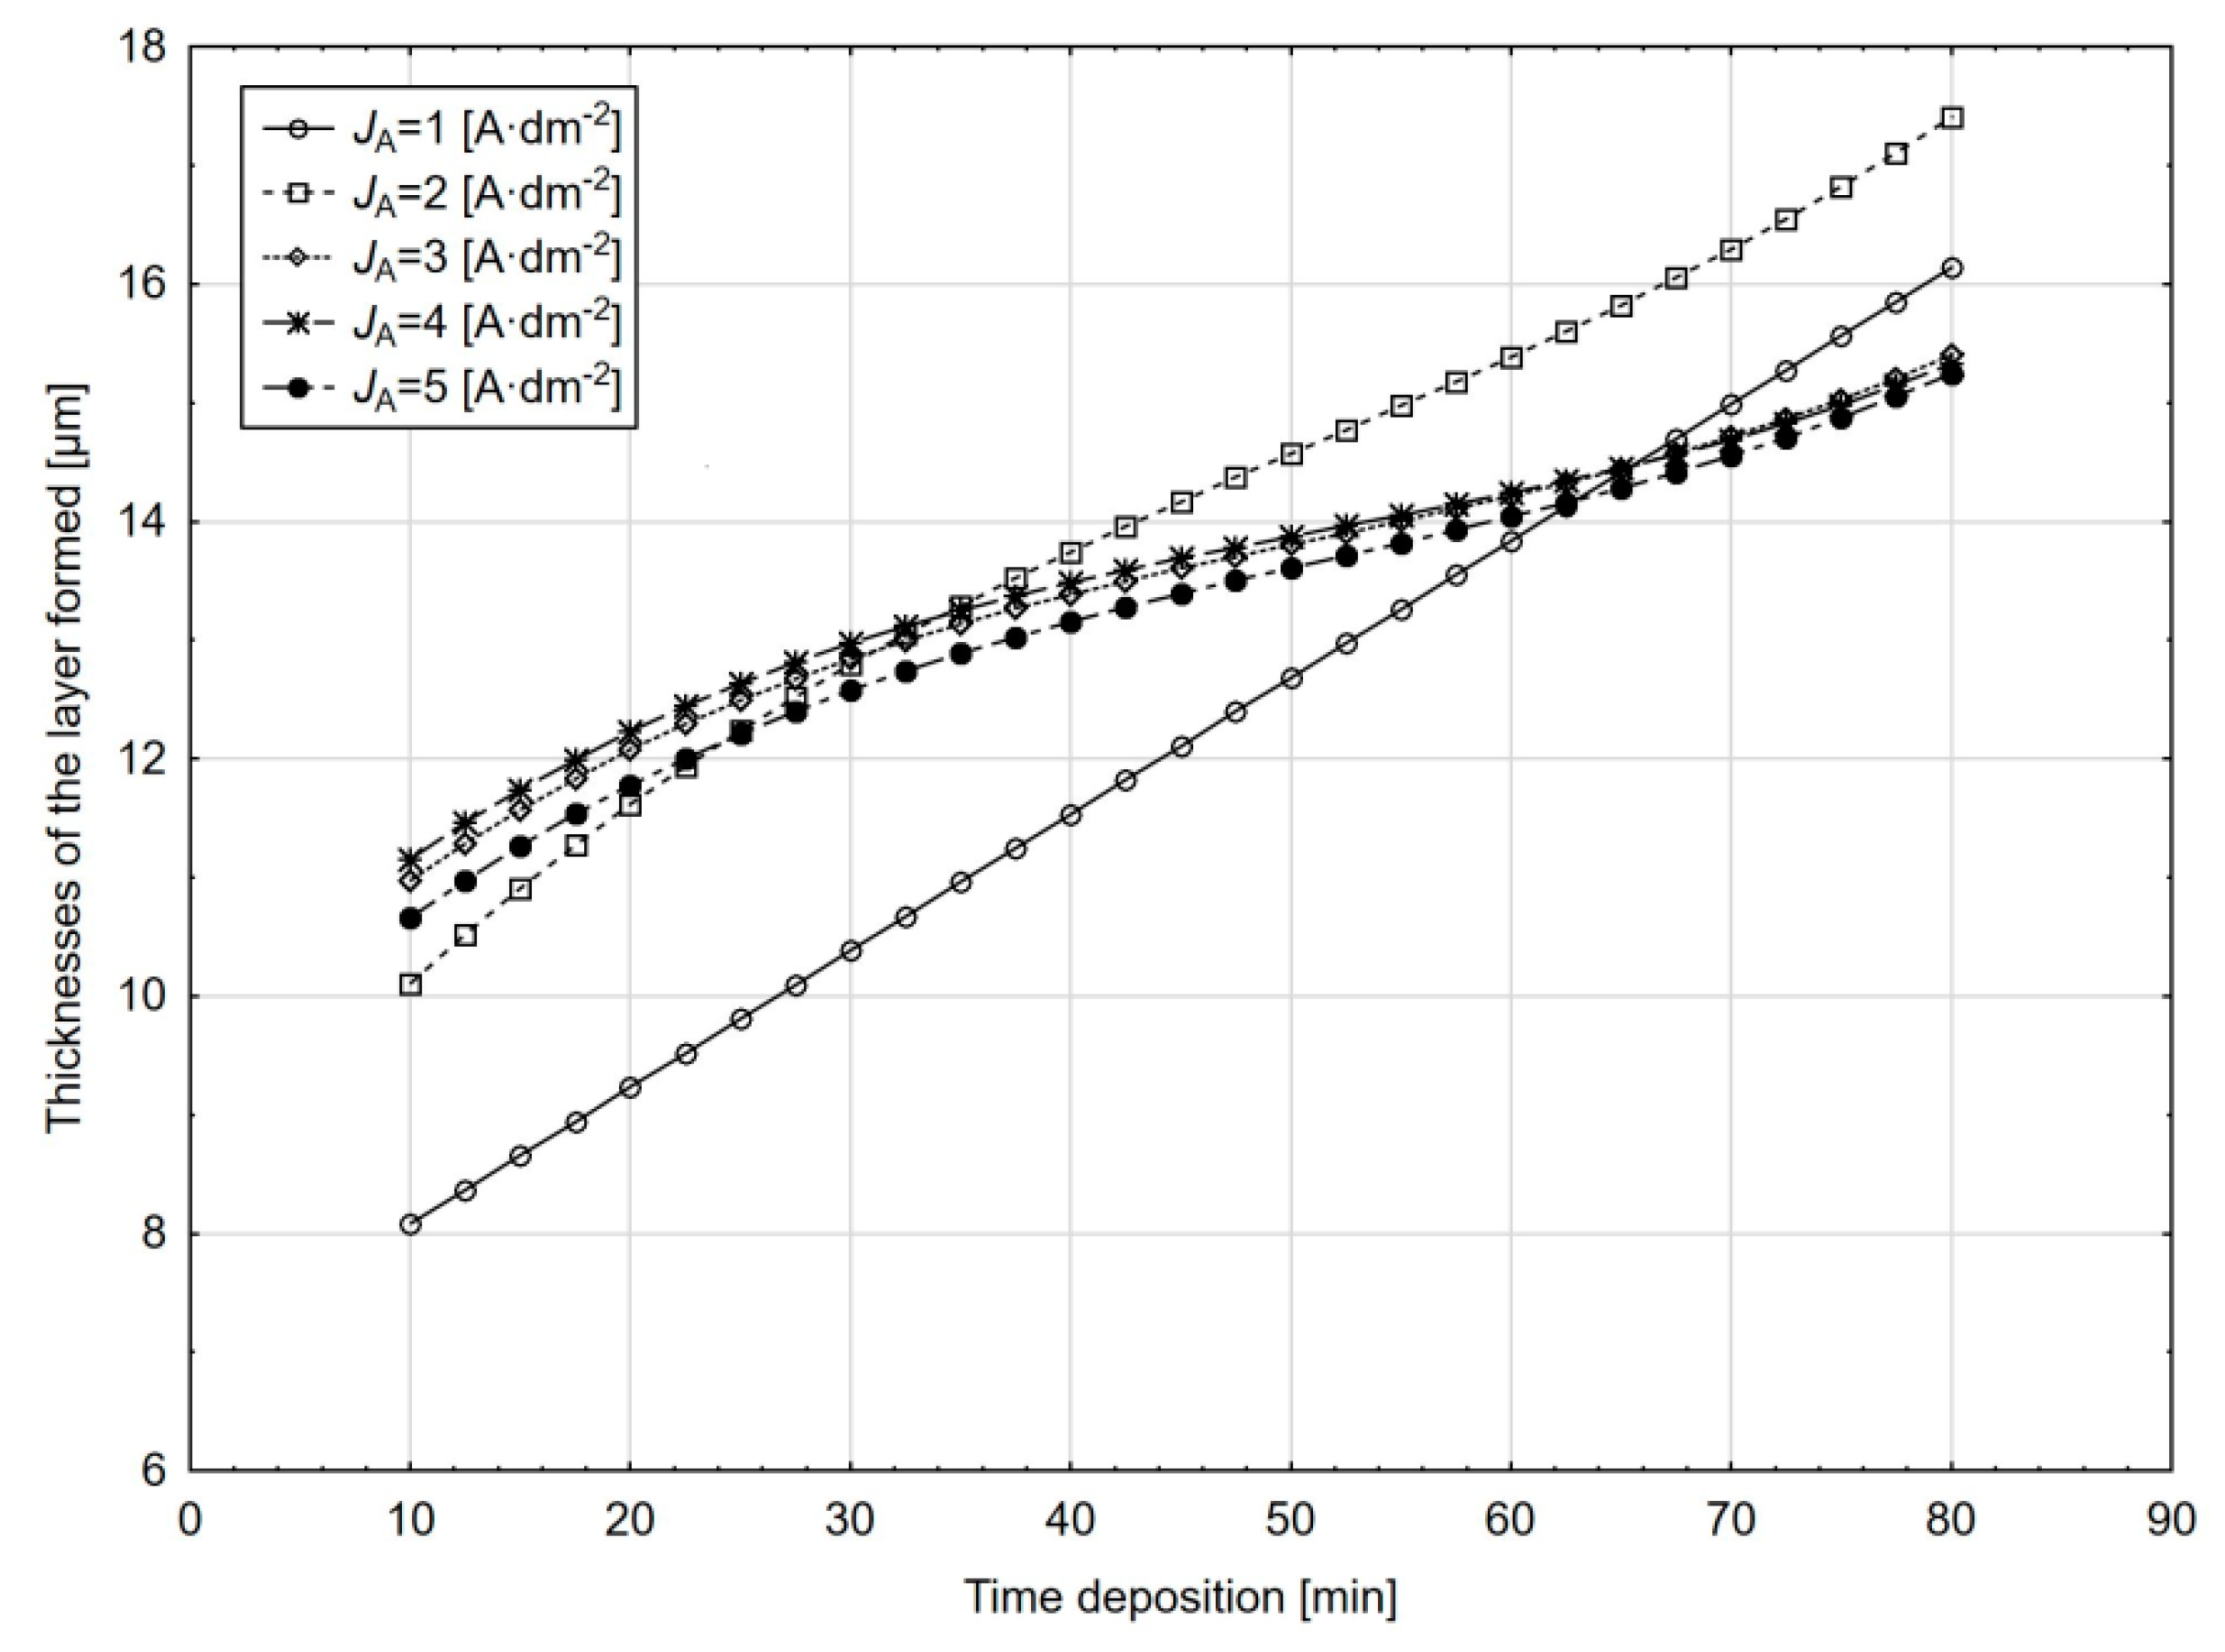
In the case of the dependence on the thickness of the layer formed on the anodic oxidation time with the amount of sulphuric acid of 200 g⋅L−1 in the electrolyte and at the electrolyte temperature 18 °C (Figure 12), the difference in the course of dependence at the current density of 1 A·dm−2 is clearly visible compared to the others current densities. At the same time, we can observe that the highest thicknesses of the layers formed are achieved at the current density of 2 A·dm−2 and the anodic oxidation time of more than 35 min. An increase in the current density over 2 A·dm−2 does not have a significant effect on the thickness of the layer formed.
Current density mainly affects the way the inner structure of the aluminium oxide layer is formed and partly affects the thickness of the oxide layer formed. At low current densities (up to 0.5 A·dm−2), an unarranged structure of the oxide layer is formed (pores pass through the wall of the cell and bind to the pores of neighbouring cells; the pores do not have a constant diameter; the cells do not have a hexagonal shape; the distances between the cells are not constant; the walls of the cells do not have constant thickness, etc.). At low current densities, oxide layers with a thickness of less than 1–3 μm are also formed. At high current densities (above 10 A·dm−2), the formed aluminium oxide layer is burnt out to disturb the surface of the oxidized substrate [9].

3.2. Verification of the Proposed Prediction Model in Industrial Practice

For predicting the thickness of the layer formed, an empirical relationship (Equation (5)) derived from the essential working factors and the area of the treated components is commonly used in practice:
t h = 0.4 η I t S
where η is the degree of electrolyte efficiency (0.6–0.7), I is the DC current in A, t is the anodic oxidation time in min, and S is the area of anodically oxidized components in dm2.
For the practical verification of the technological models (Figure 13) created in the framework of the experimental analysis in the real production conditions, anodically modified components were used in the order of the companies: Locker, s.r.o.; Sensor, s.r.o.; Proving, s.r.o. and Kovdan, s.r.o., wherein the known chemical composition of the electrolyte, voltage, average current density and the electrolyte temperature, the influence of the time of anodic oxidation on the thickness of the layer formed. The thickness of the layer formed was then compared with the technological model for the respective current density according to the empirical relationship (Equation (5)).
The results of the practical verification (
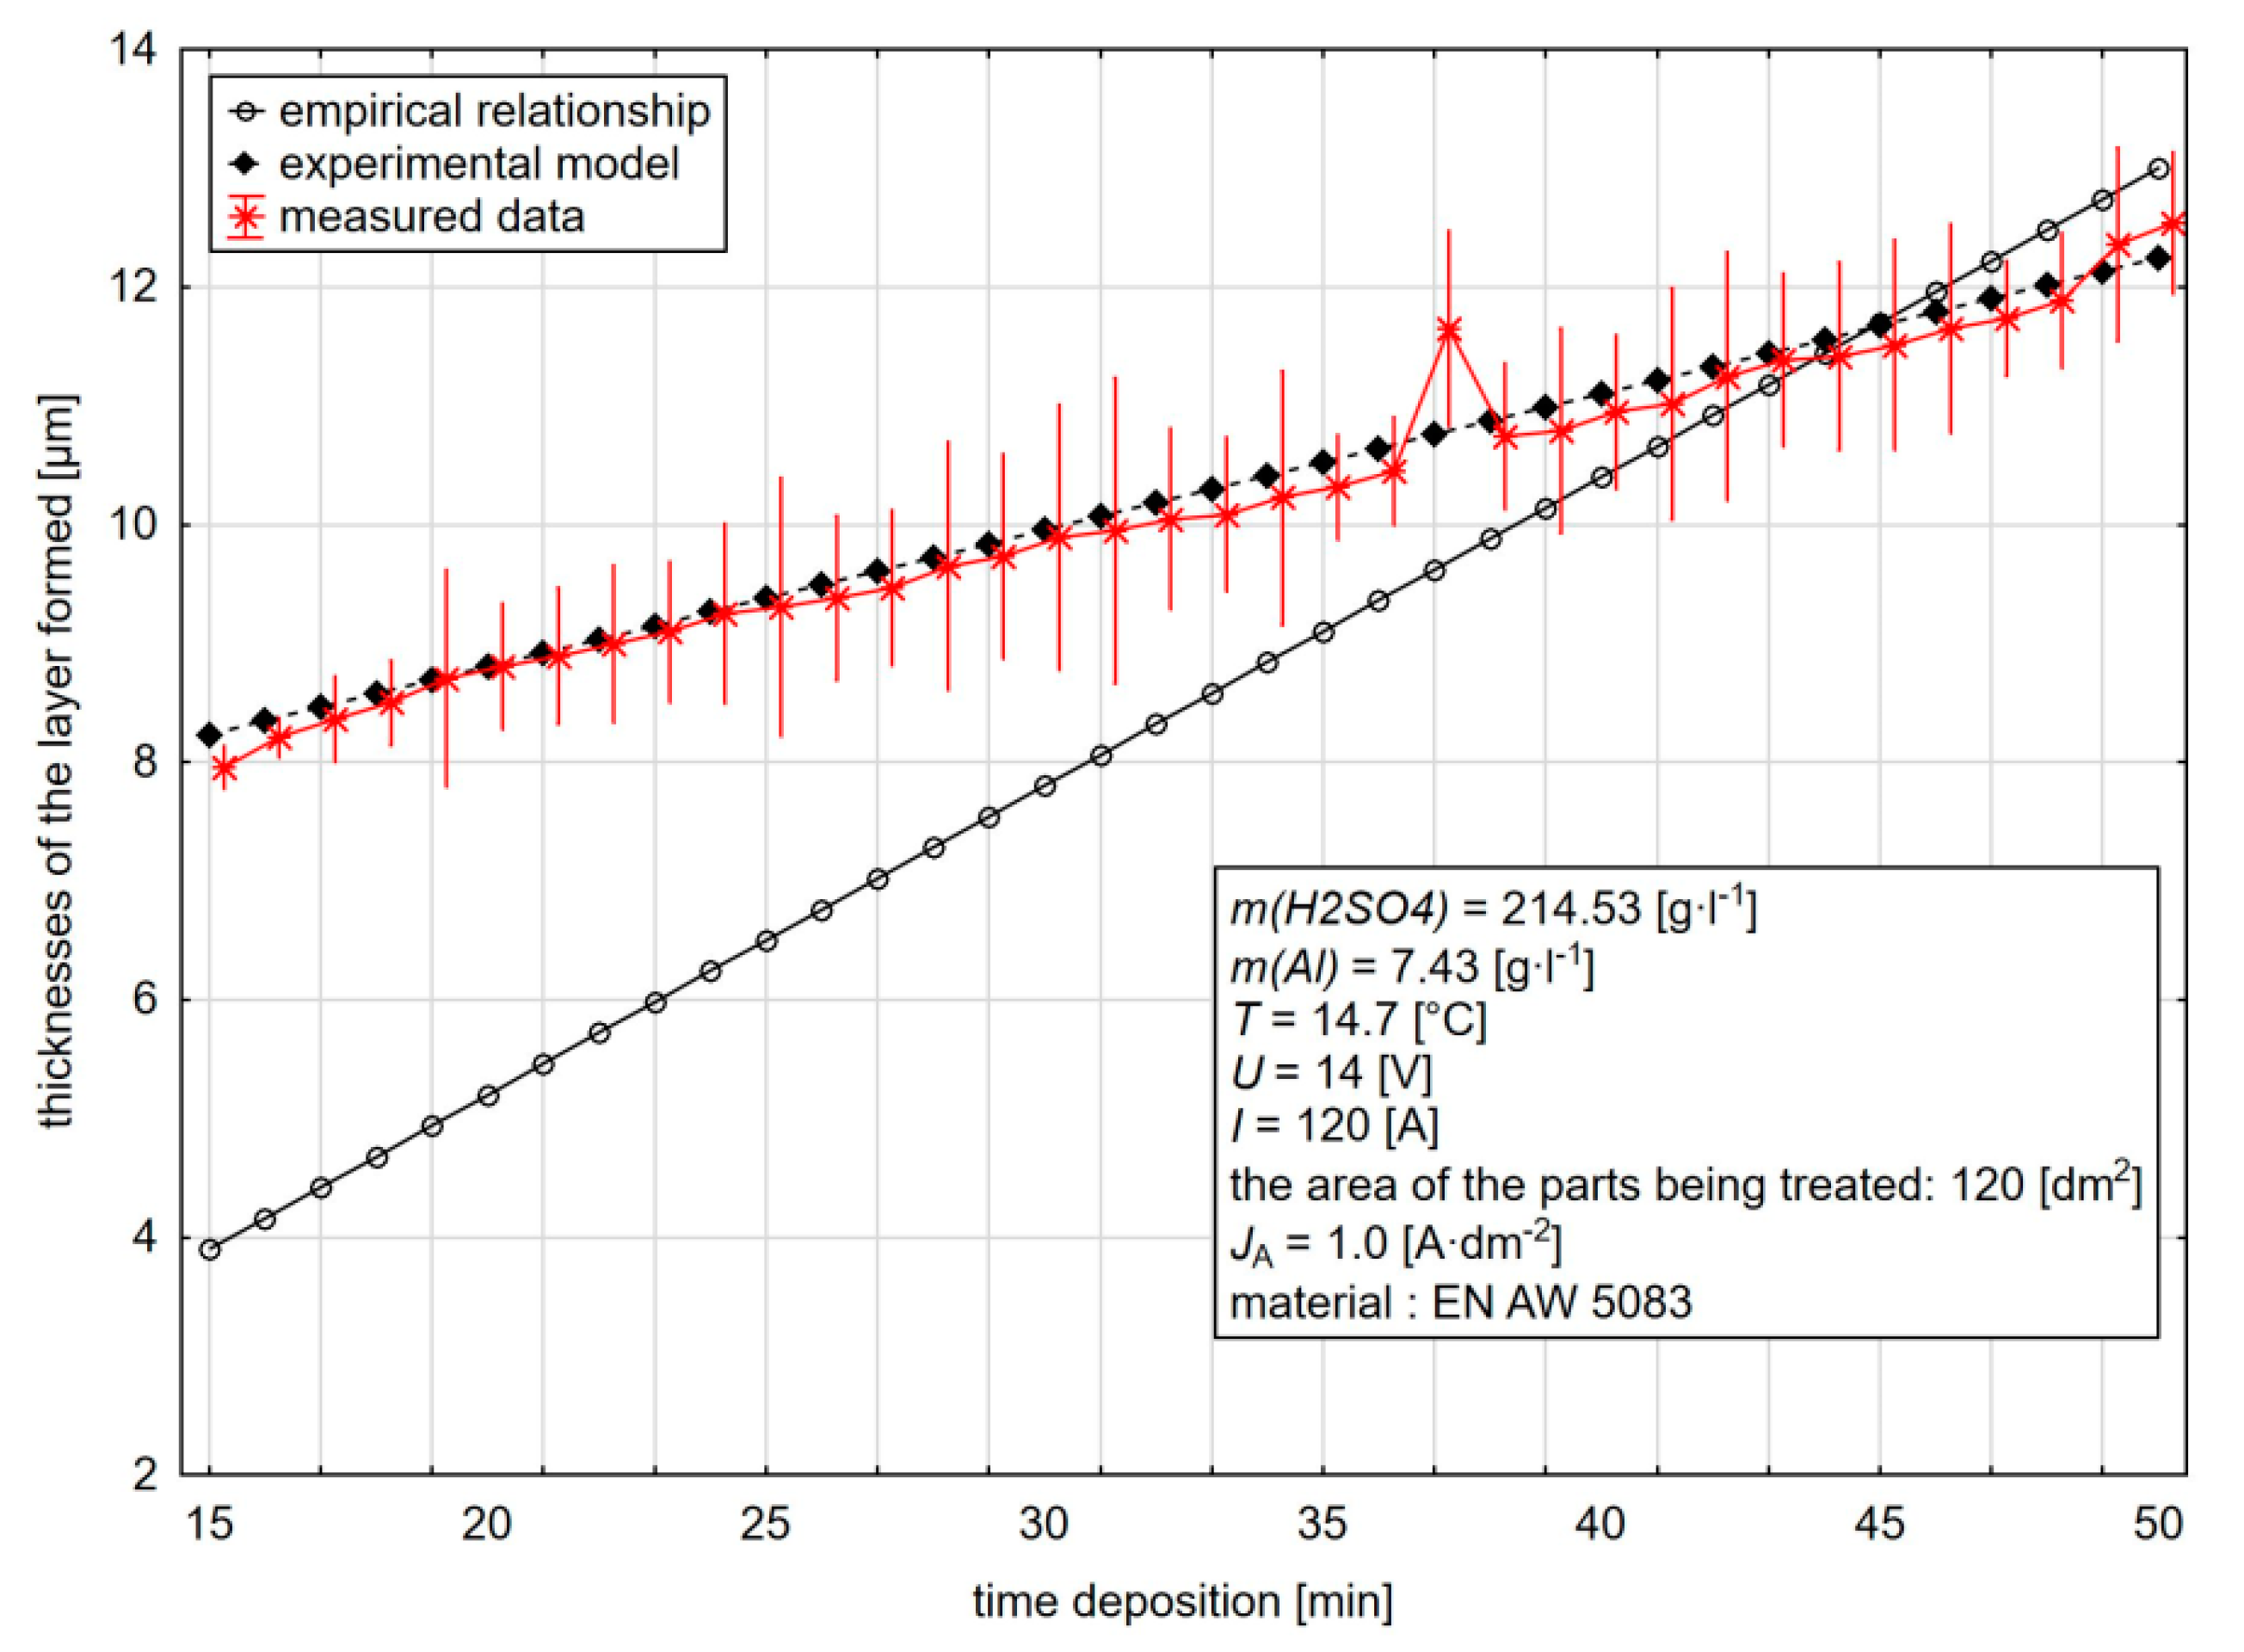
Figure 14) show that the model created on the basis of the experimental analysis for the current density of 1 A·dm−2 represents the real measured thicknesses of the layer formed in the whole range, with an average relative uncertainty of 1.21% compared to the empirical relationship, which shows a difference at low values of the anodic oxidation time (15–35 min) compared to the measured values of 49.26%. If the 35 min duration of anodic oxidation is exceeded at the end of the observed interval, this mean deviation is reduced to 4.70%. For the whole time of anodic oxidation, the mean deviation between the actual thicknesses and the thicknesses predicted by the empirical relationship is 30.69%.
The mean deviation between the measured thicknesses of the layers formed and the experimental model for the current density of 2 A·dm−2 is 4.89% for the difference between the real thicknesses and the empirical relationship of 20.29%. In the case of an increase in the current density above A·dm
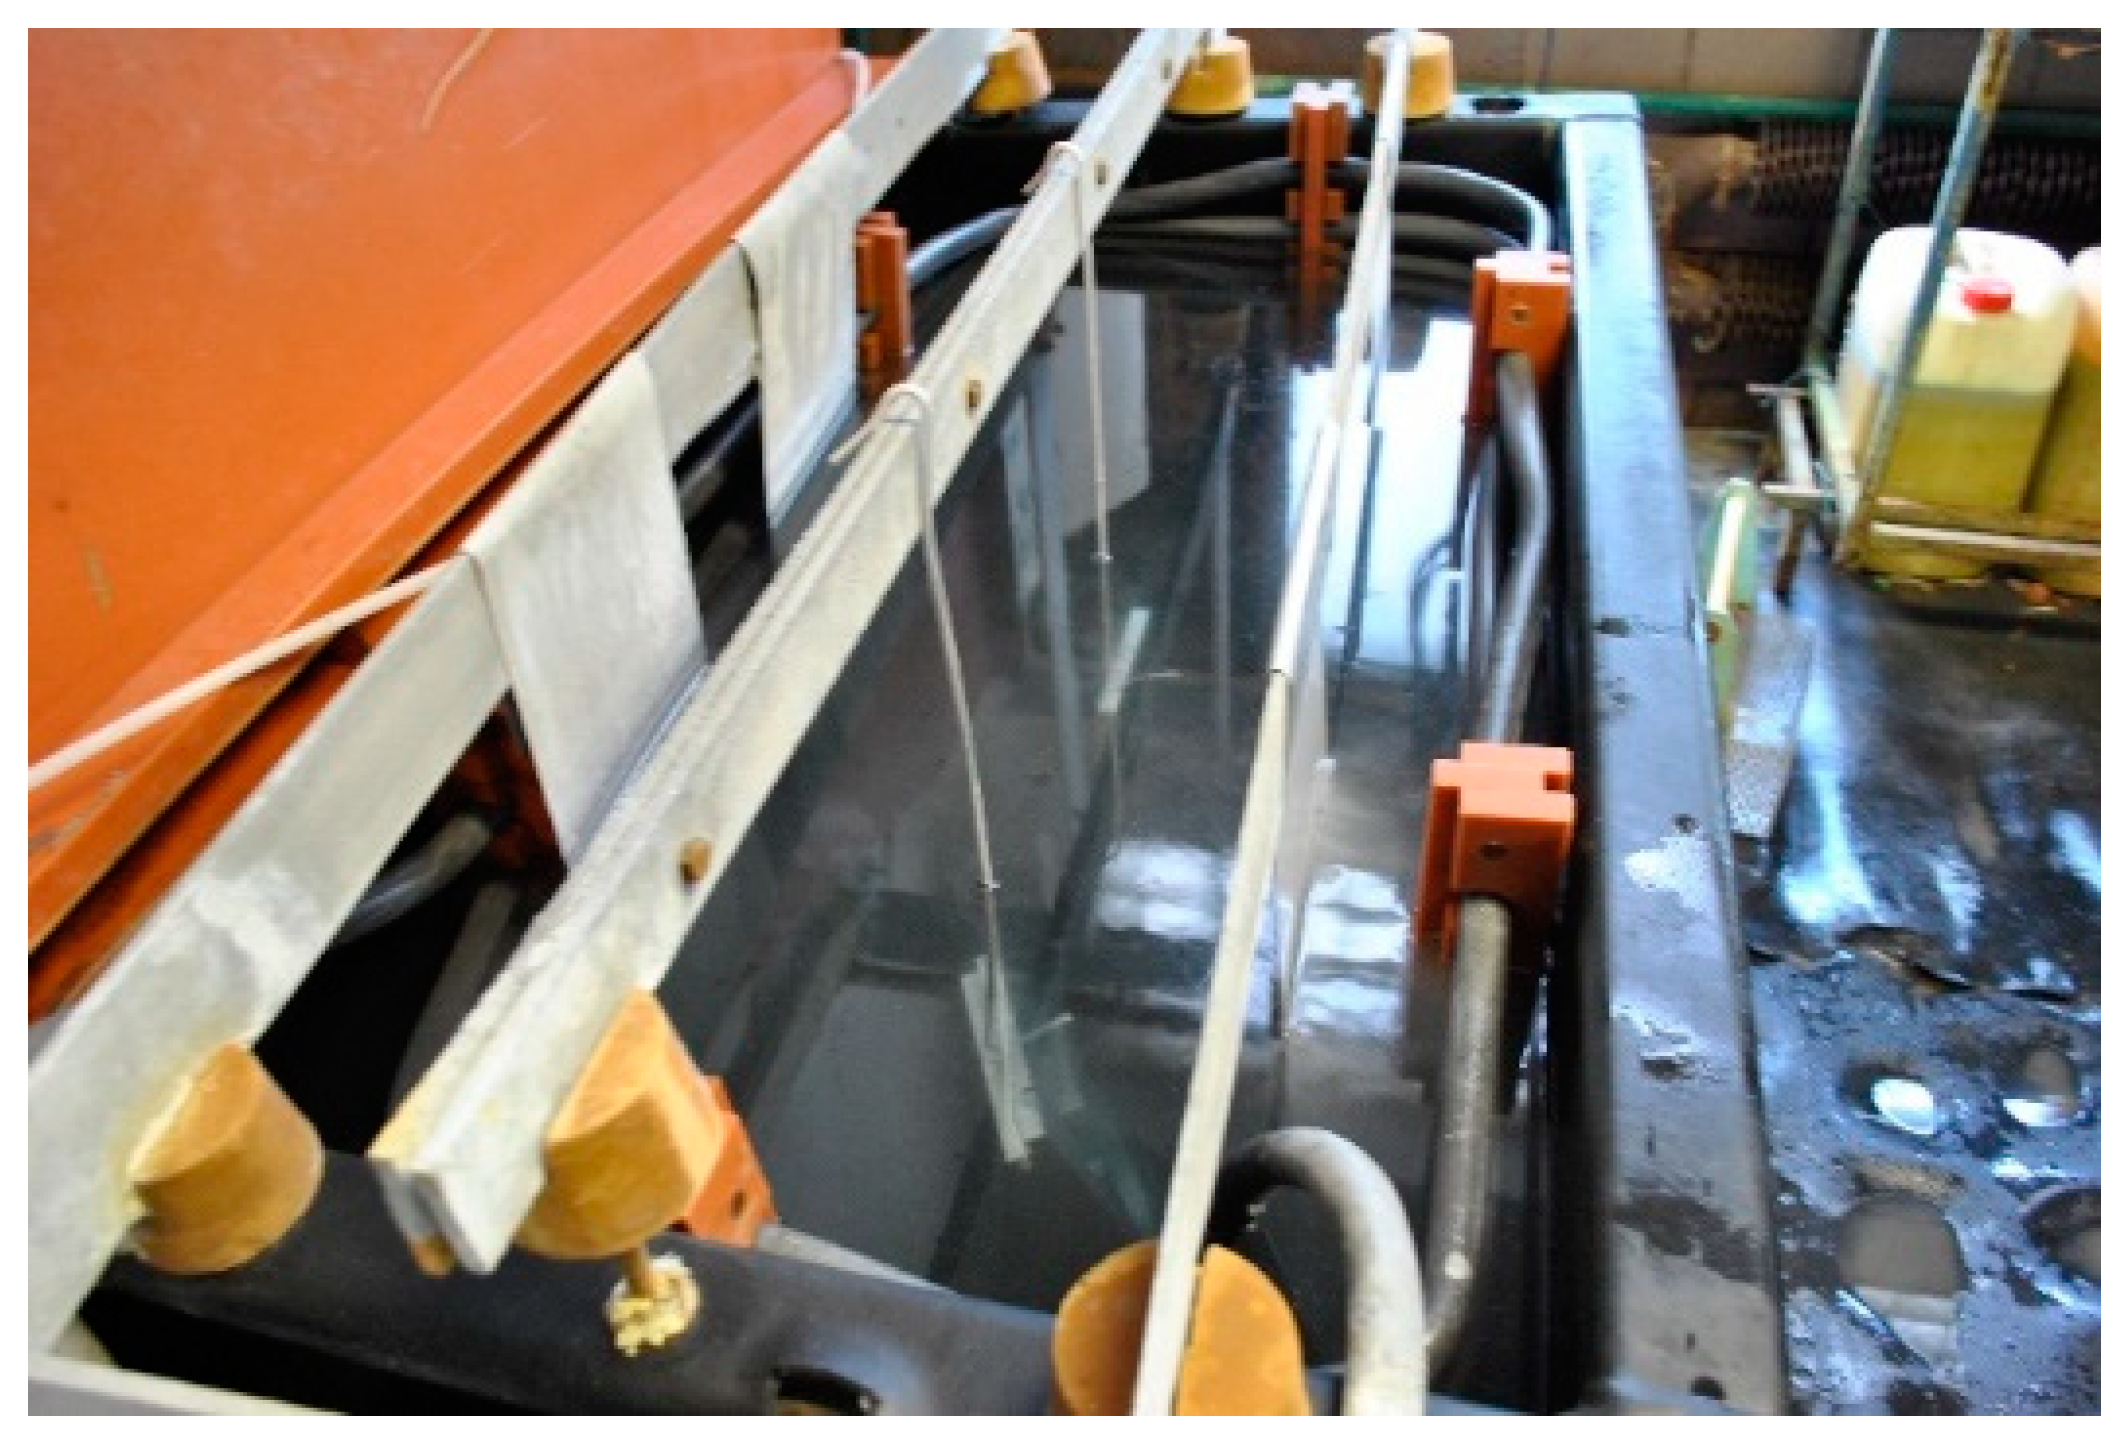
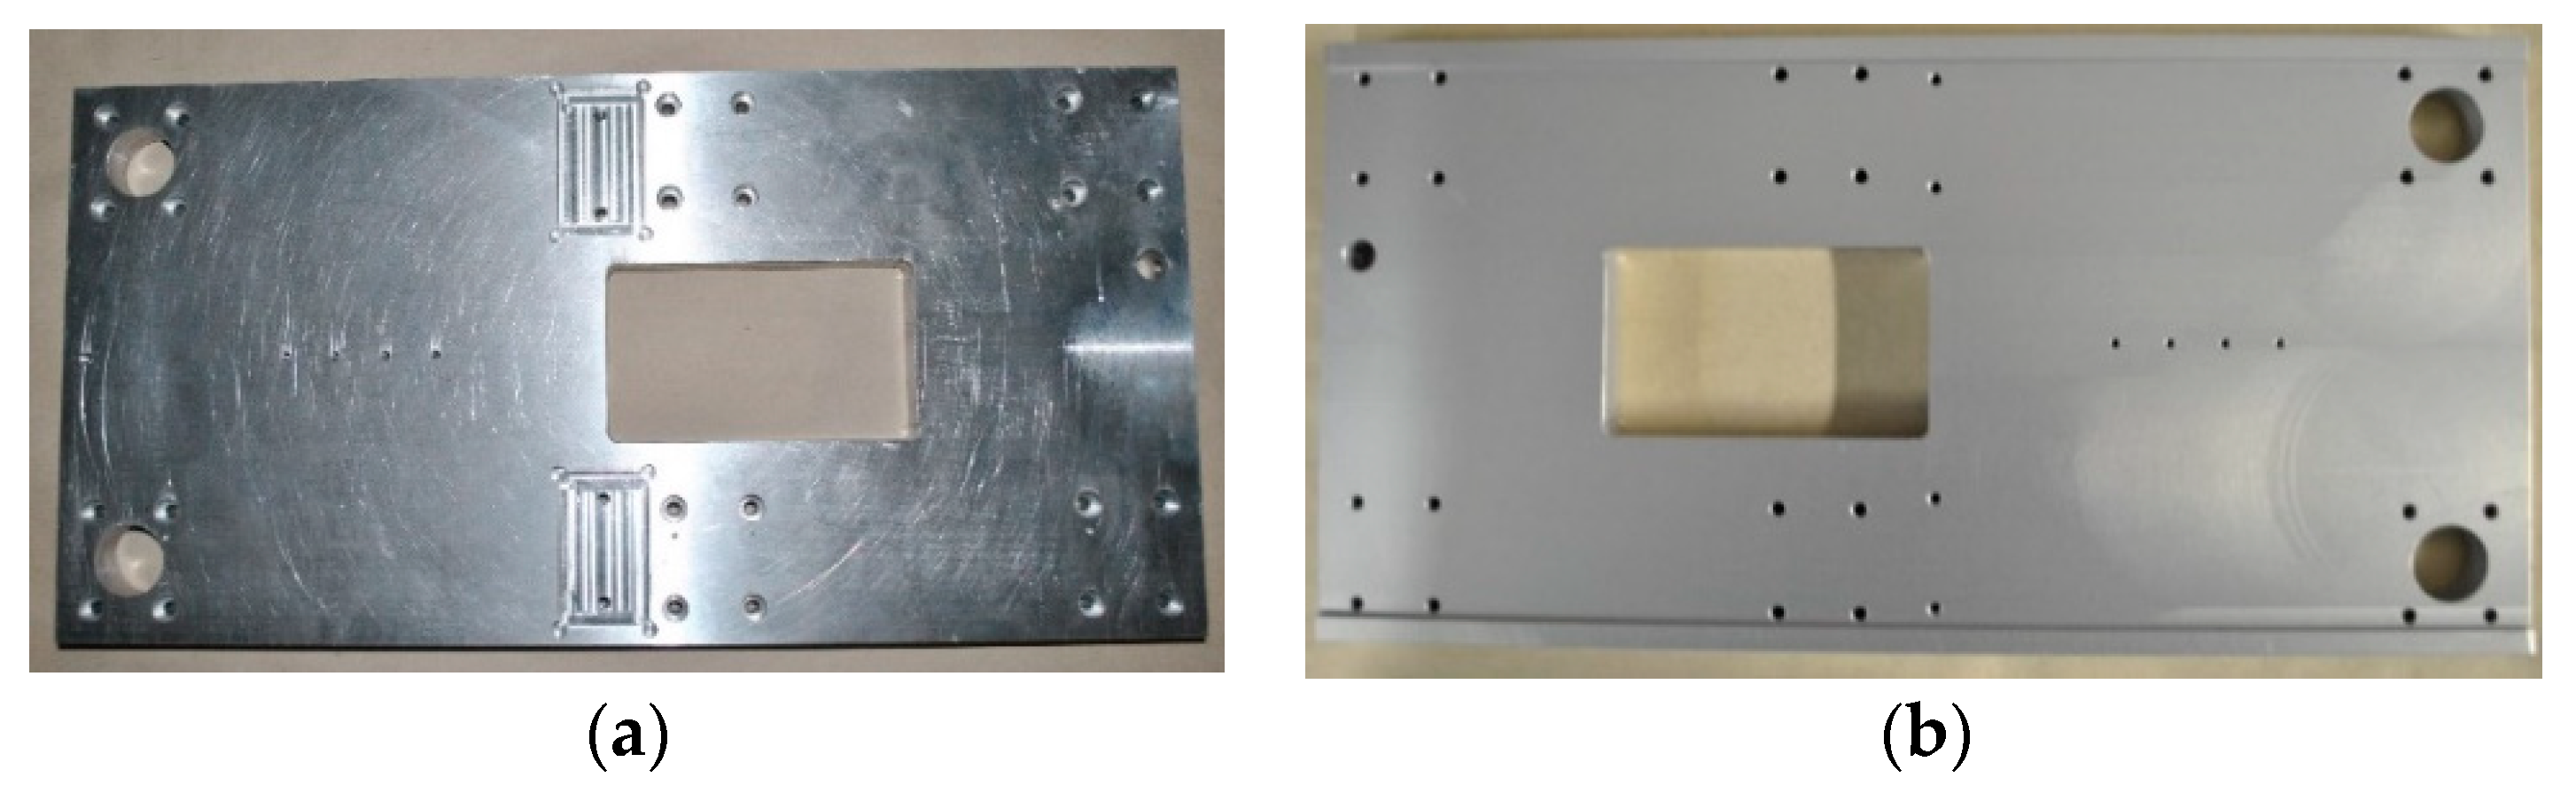
−2, we can observe the change in the course of the actually measured thicknesses of the layer with the maximum anodic oxidation time of about 40 min and its subsequent gradual decrease down to the end of the monitored interval of the anodic oxidation time. Examples of components used in practical verification are shown in Figure 15.
From the point of view of the time-consuming character of verifying the experimental relationship in practice, which took place in the operation of the private company of one of the authors, this verification took more than 7 months since this is a commercial operation of the surface treatments and it was necessary to adhere to the material. This verification was performed on real orders. The company‘s customers provided consent for experimental verification. For this reason, it was not possible to carry out practical verification also at other current densities.

4. Conclusions

The attention of the research of chemical and technological influences on the thickness of the aluminium layer formed was concentrated on the interaction of several factors. For this purpose, the methodology of the planned experiments was used, which allows a large amount of information to be obtained in a small number of tests. The methodology of processing experimentally acquired data aimed to provide numerically and statistically correct conclusions. A detailed statistical analysis of layer thicknesses in the range of anode current densities most commonly used in practice was performed.
Thus, the main objective of the submitted article was to analyse more deeply and comprehensively the impact of basic physical and chemical factors on the thickness of the layer formed by the anodic oxidation of aluminium. The final evaluation of the fulfilment of this goal with the recommendation for practice can be defined from several essential aspects:
  • In terms of the influence of physical and chemical factors acting in the anodic oxidation process, the anode current density plays a key role, resulting in different effects of the observed factors and their interactions, with the most significant factor (in terms of the main effects) being the anodic oxidation time JA = 1 A·dm−2 and JA = 2 A·dm−2, and the amount of sulfuric acid in the electrolyte at JA = 3 A·dm−2 and JA = 5 A·dm−2, always taking into account the interactions among the factors whose influence is different within the anode current densities used and, in addition to the thickness of the layer to be formed, also takes into account its qualitative properties.
  • At the experimentally defined interval, aluminium does not have a significant impact on the thickness of the formed layer, but, on the other hand, it affects its quality, and when exceeding the amount of 12 g·L−1, qualitatively inappropriate layers with high porosity start to be formed.
  • An absolute model member in the range of 48.14% to 42.63% has the most significant impact in the analysis of individual anode current densities, which implies that when forming the layer by anodic oxidation, other influences such as the material of constructional components, the influence of the purity of the water used, and the mixing of the electrolyte must be taken into consideration.
  • Mathematical models created in the experimental analysis for individual anode current densities and based on practical verification can be used to calculate the thickness of the layer with an accuracy of up to 90%; their application is possible only within the intervals of the individual factors.
  • Determining the influence of physical factors (electrolyte temperature and anodic oxidation time) and chemical factors (the amount of sulfuric acid in the electrolyte), creation and analysis of predictive models with the determination of the critical values of the individual factors, defining the areas of the influence of the factors as well as determining the theoretical speed of the layer formation/dissolution, which in real practice enables more accurate understanding of anodic oxidation as well as determination of the critical values of the individual acting factors.
Mathematical models were developed by mathematical and statistical analysis to determine the thickness of the layer formed with a relative accuracy of 10% on the basis of practical verification under real production conditions. Moreover, optimum combinations of input variables were established for practical purposes in order to achieve the desired thickness of the surface layer in order to minimize the input costs and reduce the time needed to create it. This is related to an increase in the productivity of the production process while maintaining the other required qualitative indicators; this results in more efficient formation of the layers, which is desired by the customers.
The results obtained in the experimental section will serve as the basis for modifying the GS method of anodic oxidation of aluminium in order to shorten the optimized production time while increasing the layer formation rate and increasing its hardness with minimal input costs. Further experiments needed to meet this goal were carried out under the responsibility of the company KTL, s.r.o. and in cooperation with the Pragochema research and development department. We can conclude that the practical and theoretical contributions of the experiments are very promising and prestigious in the long run because on one hand there is a gradual increase in the use of aluminium and its alloys in various areas of industry, and on the other hand, insufficient attention is paid to this promising issue.

Author Contributions

Conceptualization, M.G. and A.V.; Methodology, M.H. and J.V.; Validation, M.K. and A.C.; Formal Analysis, J.K.; Investigation, M.G. and A.V.; Writing—Original Draft Preparation, M.H. and J.V.; Writing—Review and Editing, M.K., A.C. and J.K.

Funding

The research work was funded by the grants VEGA 1/0393/18, KEGA 026TUKE-4/2016, EU Structural Funds Project ITMS (No. 26220220103), APVV 15-0405 and the project of University of Zilina: OPVav-2009/2.2/04-SORO (No. 26220220101).

Conflicts of Interest

The authors declare no conflict of interest.

References

  1. Michna, S.; Lukac, I.; Louda, P.; Ocenasek, V.; Schneider, H.; Drapala, J.; Kořený, A.; Miskufova, A. Aluminium Materials and Technologies from A to Z, 1st ed.; ADIN: Prešov, Slovakia, 2007; p. 613. [Google Scholar]
  2. Aerts, T.; Jorcin, J.B.; De Graeve, I.; Terryn, H. Comparison between the influence of applied electrode and electrolyte temperatures on porous anodizing of aluminium. Electrochim. Acta 2010, 55, 3957–3965. [Google Scholar] [CrossRef]
  3. Aerts, T.; Dimogerontakis, T.; De Graeve, I.; Fransaer, J.; Terryn, H. Influence of the anodizing temperature on the porosity and the mechanical properties of the porous anodic oxide film. Surf. Coat. Technol. 2007, 201, 7310–7317. [Google Scholar] [CrossRef]
  4. Aerts, T.; De Graeve, I.; Terryn, H. Control of the electrode temperature for electrochemical studies: A new approach illustrated on porous anodizing of aluminium. Electrochem. Commun. 2009, 11, 2292–2295. [Google Scholar] [CrossRef]
  5. Huang, Y.; Shih, H.; Huang, H.; Daugherty, J.; Wu, S.; Ramanathan, S.; Chang, C.; Mansfeld, F. Evaluation of the corrosion resistance of anodized aluminium 6061 using electrochemical impedance spectroscopy (EIS). Corros. Sci. 2008, 50, 3569–3575. [Google Scholar] [CrossRef]
  6. Abulsain, M.; Berkani, A.; Bonilla, F.A.; Liu, Y.; Arenas, M.A.; Skeldon, P.; Thompson, G.E.; Bailey, P.; Noakes, T.C.Q.; Shimizu, K.; et al. Anodic oxidation of Mg–Cu and Mg–Zn alloys. Electrochim. Acta 2004, 49, 899–904. [Google Scholar] [CrossRef] [Green Version]
  7. Su, Z. Porous Anodic Metal Oxides. Ph.D. Thesis, University of St Andrews, St Andrews, UK, September 2009. [Google Scholar]
  8. Garcia-Vergara, S.J.; Skeldon, P.; Thompson, G.E.; Habazaki, H. A flow model of porous anodic film growth on aluminium. Electrochim. Acta 2006, 52, 681–687. [Google Scholar] [CrossRef]
  9. Skoneczny, W. Analysis of Al2O3 layers morphology and microstructure. Physicochem. Mech. Mater. 2010, 46, 130–135. [Google Scholar] [CrossRef]
  10. Liu, Y.; Skeldon, P.; Thompson, G.E.; Habazaki, H.; Shimizu, K. Anodic film growth on an Al-21 at.% Mg alloy. Corros. Sci. 2002, 44, 1133–1142. [Google Scholar] [CrossRef]
  11. Oh, J.; Thompson, C.V. The role of electric field in pore formation during aluminium anodization. Electrochim. Acta 2011, 56, 4044–4051. [Google Scholar] [CrossRef]
  12. Vrublevsky, I.; Chernyakova, K.; Bund, A.; Ispas, A.; Schmidt, U. Effect of anodizing voltage on the sorption of water molecules on porous alumina. Appl. Surf. Sci. 2012, 258, 5394–5398. [Google Scholar] [CrossRef]
  13. Nakajima, M.; Miura, Y.; Fushimi, K.; Habazaki, H. Spark anodizing behaviour of titanium and its alloys in alkaline aluminate electrolyte. Corros. Sci. 2009, 51, 1534–1539. [Google Scholar] [CrossRef]
  14. López, V.; Gonzalez, J.A.; Otero, E.; Escudero, E.; Morcillo, M. Atmospheric corrosion of bare and anodised aluminium in a wide range of environmental conditions. Part II: Electrochemical responses. Surf. Coat. Technol. 2002, 153, 235–244. [Google Scholar] [CrossRef] [Green Version]
  15. Zhang, J.; Zhao, X.; Zuo, Y.; Xiong, J. The bonding strength and corrosion resistance of aluminium alloy by anodizing treatment in a phosphoric acid modified boric acid/sulfuric acid bath. Surf. Coat. Technol. 2008, 202, 3149–3156. [Google Scholar] [CrossRef]
  16. Alcala, G.; Mato, S.; Skeldon, P.; Thompson, G.E.; Mann, A.B.; Habazaki, H.; Shimizu, K. Mechanical properties of barrier-type anodic alumina films using nanoindentation. Surf. Coat. Technol. 2003, 173, 293–298. [Google Scholar] [CrossRef]
  17. Bensalah, W.; Elleuch, K.; Feki, M.; DePetris-Wery, M.; Ayedi, H.F. Comparative study of mechanical and tribological properties of alumina coatings formed on aluminium in various conditions. Mater. Des. 2009, 30, 3731–3737. [Google Scholar] [CrossRef]
  18. Fratila-Apachitei, L.E.; Duszczyk, J.; Katgerman, L. Voltage transients and morphology of AlSi (Cu) anodic oxide layers formed in H2SO4 at low temperature. Surf. Coat. Technol. 2002, 157, 80–94. [Google Scholar] [CrossRef]
  19. Zhou, F.; Baron-Wiecheć, A.; Garcia-Vergara, S.J.; Curioni, M.; Habazaki, H.; Skeldon, P.; Thompson, G.E. Effects of current density and electrolyte temperature on the volume expansion factor of anodic alumina formed in oxalic acid. Electrochim. Acta 2012, 59, 186–195. [Google Scholar] [CrossRef]
  20. Han, C.Y.; Willing, G.A.; Xiao, Z.; Wang, H.H. Control of the anodic aluminium oxide barrier layer opening process by wet chemical etching. Langmuir 2007, 23, 1564–1568. [Google Scholar] [CrossRef]
  21. Bensalah, W.; Elleuch, K.; Feki, M.; Wery, M.; Ayedi, H.F. Optimization of anodic layer properties on aluminium in mixed oxalic/sulphuric acid bath using statistical experimental methods. Surf. Coat. Technol. 2007, 201, 7855–7864. [Google Scholar] [CrossRef]
  22. Holicka, Z.; Chovancová, M.; Zemanová, M. Anodic oxidation of aluminium in acidic electrolytes. Chem. Listy 2000, 94, 1081–1086. [Google Scholar]
  23. Bella, F.; Muñoz-García, A.B.; Colò, F.; Meligrana, G.; Lamberti, A.; Destro, M.; Pavone, M.; Gerbaldi, C. Combined structural, chemometric, and electrochemical investigation of vertically aligned TiO2 nanotubes for Na-ion batteries. ACS Omega 2018, 3, 8440–8450. [Google Scholar] [CrossRef]
  24. Guarnieri, M.; Trovò, A.; D’Anzi, A.; Alotto, P. Developing vanadium redox flow technology on a 9-kW 26-kWh industrial scale test facility: Design review and early experiments. Appl. Energy 2018, 230, 1425–1434. [Google Scholar] [CrossRef]
  25. Zaibi, M.; Cherif, H.; Champenois, G.; Sareni, B.; Roboam, X.; Belhadj, J. Sizing methodology based on design of experiments for freshwater and electricity production from multi-source renewable energy systems. Desalination 2018, 446, 94–103. [Google Scholar] [CrossRef]
  26. Sedghamiz, M.A.; Raeissi, S.; Attar, F.; Salimi, M.; Mehrabi, K. In-situ transesterification of residual vegetable oil in spent bleaching clay with alkali catalysts using CCD-RSM design of experiment. Fuel 2019, 237, 515–521. [Google Scholar] [CrossRef]
  27. Bess, J.D.; Woolstenhulme, N.E.; Davis, C.B.; Dusanter, L.M.; Folsom, C.P.; Parry, J.R.; Shorthill, H.T.; Zhao, H. Narrowing transient testing pulse widths to enhance LWR RIA experiment design in the TREAT facility. Ann. Nucl. Energy 2019, 124, 548–571. [Google Scholar] [CrossRef]
  28. Iljaž, J.; Wrobel, L.C.; Hriberšek, M.; Marn, J. The use of Design of Experiments for steady-state and transient inverse melanoma detection problems. Int. J. Therm. Sci. 2019, 135, 256–275. [Google Scholar] [CrossRef]
  29. Miccoli, B.; Cauda, V.; Bonanno, A.; Sanginario, A.; Bejtka, K.; Bella, F.; Fontana, M.; Demarchi, D. One-dimensional ZnO/gold junction for simultaneous and versatile multisensing measurements. Sci. Rep. 2016, 6, 29763. [Google Scholar] [CrossRef] [PubMed]
  30. Sakr, M.; Hanafi, R.; Fouad, M.; Al-Easa, H.; El-Moghazy, S. Design and optimization of a luminescent Samarium complex of isoprenaline: A chemometric approach based on Factorial design and Box-Behnken response surface methodology. Spectrochim. Acta A 2019, 208, 114–123. [Google Scholar] [CrossRef] [PubMed]
  31. Dos Santos Souza, L.F.; Vandepitte, D.; Tita, V.; de Medeiros, R. Dynamic response of laminated composites using design of experiments: An experimental and numerical study. Mech. Syst. Signal Process. 2019, 115, 82–101. [Google Scholar] [CrossRef]
  32. Hu, Q.; Liu, Y.; Zhang, T.; Geng, S.; Wang, F. Modeling the corrosion behavior of Ni–Cr–Mo–V high strength steel in the simulated deep sea environments using design of experiment and artificial neural network. J. Mater. Sci. Technol. 2019, 35, 168–175. [Google Scholar] [CrossRef]
  33. Toshiyuki, K. Manufacturing of anodic porous alumina for barriers in a dielectric barrier discharge reactor. J. Electrostat. 2008, 66, 395–400. [Google Scholar]
  34. Hsing-Hsiang, S.; Shiang-Lin, T. Study of anodic oxidation of aluminium in mixed acid using a pulsed current. Surf. Coat. Technol. 2000, 124, 278–285. [Google Scholar]
  35. Theohari, S.; Kontogeorgou, C. Effect of temperature on the anodizing process of aluminium alloy AA 5052. Appl. Surf. Sci. 2013, 284, 611–618. [Google Scholar] [CrossRef]
  36. Chung, C.K.; Liao, M.W.; Chang, H.C.; Lee, C.T. Effects of temperature and voltage mode on nanoporous anodic aluminium oxide. Thin Solid Films 2011, 520, 1554–1558. [Google Scholar] [CrossRef]
  37. Yakovleva, N.M.; Anicai, L.; Yakovlev, A.N.; Dima, L.; Khanina, E.Y.; Buda, M.; Chupakhina, E.A. Structural study of anodic films formed on aluminium in nitric acid electrolyte. Thin Solid Films 2002, 416, 16–23. [Google Scholar] [CrossRef]
  38. Mason, R.B.; Fowle, P.E. Anodic Behavior of aluminium and its alloys in sulfuric acid electrolytes. J. Electrochem. Soc. 1954, 101, 53–59. [Google Scholar] [CrossRef]
  39. Diggle, J.W.; Downie, T.C.; Goulding, C.W. The dissolution of porous oxide films on aluminium. Electrochim. Acta 1970, 15, 1079–1093. [Google Scholar] [CrossRef]
  40. Wood, G.C.; O’sullivan, J.P. The anodizing of aluminium in sulphate solutions. Electrochim. Acta. 1970, 15, 1865–1876. [Google Scholar] [CrossRef]
  41. Vrublevsky, I.; Parkoun, V.; Schreckenbach, J.; Goedel, W.A. Dissolution behaviour of the barrier layer of porous oxide films on aluminium formed in phosphoric acid studied by a re-anodizing technique. Appl. Surf. Sci. 2006, 252, 5100–5108. [Google Scholar] [CrossRef]
  42. Akolkar, R.; Landau, U.; Kuo, H.; Wang, Y.M. Modeling of the current distribution in aluminium anodization. J. Appl. Electrochem. 2004, 34, 807–813. [Google Scholar] [CrossRef]
  43. Meloun, M.; Militký, J.; Hill, M. Statistical Analysis of Multidimensional Data in Examples; Charles University: Prague, Czech Republic, 2017. [Google Scholar]
  44. Michal, P.; Piteľ, J.; Vagaská, A. Possibilities of controlling the technological process of anodic oxidation of aluminium. In Proceedings of the Automation and Management Theory and Practice ARTEP, Stará Lesná, Slovakia, 20–22 February 2013; Technical University of Košice: Košice, Slovakia, 2013. [Google Scholar]
  45. Karthikeyan, S.; Jeeva, P.A.; Raj, V.; Ramkumar, D.; Arivazhagan, N.; Narayanan, S. Improvement of corrosion resistance of anodized aluminium surfaces. J. Corros. Sci. Eng. 2013, 16. in press. [Google Scholar]
  46. Michal, P.; Vagaská, A.; Fechová, E.; Gombár, M.; Kmec, J. The Application of Predictive Model to Describe and Control Technological Process. In ICSMMS 2015, Proceedings of the 2nd International Conference on Sensors and Materials Manufacturing Science, 17–18 January 2015, Paris, France; Bosi Edu: Nanjing, China, 2015; pp. 1–4. [Google Scholar]
  47. Michal, P.; Vagaská, A.; Gombár, M.; Hošovský, A.; Kmec, J. Monitoring of influence of significant parameters during anodizing of aluminium. In SAMI 2014, Proceedings of the 12th International Symposium on Applied Machine Intelligence and Informatics, Herľany, Slovakia, 23–25 January 2014; IEEE: Danvers, MA, USA, 2014; pp. 49–54. [Google Scholar]
  48. Michal, P.; Vagaská, A.; Gombár, M.; Kmec, J. Mathematical modelling and optimization of technological process using design of experiments methodology. Appl. Mech. Mater. 2014, 616, 61–68. [Google Scholar] [CrossRef]
  49. Michal, P.; Vagaská, A.; Gombár, M.; Kmec, J.; Spišák, E.; Badida, M. Prediction of the effect of chemical composition of electrolyte on the thickness of anodic aluminium oxide layer. Int. J. Math. Models Methods Appl. Sci. 2014, 8, 152–155. [Google Scholar]
Figure 1. Diagram of the Hull’s tank connection.
Coatings 09 00057 g001
Figure 2. Simulation of electrical potential and current density distribution in experimental verification. (a) simulation of the electrical potential distribution in Hull’s tub; (b) simulation of the electrical potential distribution in Hull’s cavity; (c) simulation of the current density distribution in Hull’s tub; (d) simulation of the current density distribution in Hull’s tub.
Coatings 09 00057 g002
Figure 3. Distribution of current densities in samples in the selected experiments.
Coatings 09 00057 g003
Figure 4. Screening analysis of experimental data for the current density of 5 A·dm−2.
Coatings 09 00057 g004
Figure 5. Diagram of design space.
Coatings 09 00057 g005
Figure 6. Analysis of residues as a demonstration for the current density of JA = 5 A⋅dm−2.
Coatings 09 00057 g006
Figure 7. (a) The magnitude of the effect of the model absolute member for JA = 1 to 5 A·dm−2; (b) The influence of the percentage of the model absolute member for JA = 1 to 5 A·dm−2.
Coatings 09 00057 g007
Figure 8. (a) The magnitude of the main model effects for JA = 1 to 5 A·dm−2; (b) The influence of the percentage of the main model effects for JA = 1 to 5 A·dm−2.
Coatings 09 00057 g008
Figure 9. (a) The magnitude of the model two-level effects for JA = 1 to 5 A·dm−2; (b) The influence of the percentage of the model two-level effects for JA = 1 to 5 A·dm−2.
Coatings 09 00057 g009
Figure 10. (a) The magnitude of the model three-level effects for JA = 1 to 5 A·dm−2; (b) The influence of the percentage of the model three-level effects for JA = 1 to 5 A·dm−2.
Coatings 09 00057 g010
Figure 11. (a) Effect of the sulphuric acid amount for JA = 1 to 5 A·dm−2 at the electrolyte temperature of 18 °C and the anodic oxidation time of 35 min; (b) Effect of the electrolyte temperature for JA = 1 to 5 A·dm−2 with of 200 g·L−1 of sulphuric acid and the anodic oxidation time of 35 min.
Coatings 09 00057 g011
Figure 12. Influence of the anodic oxidation time at the current density of 1–5 A·dm−2, for the sulphuric acid amount of in the solution of 200 g⋅L−1 and the electrolyte temperature of 18 °C.
Coatings 09 00057 g012
Figure 13. Shot of the anodic oxidation process in practical verification.
Coatings 09 00057 g013
Figure 14. Experimental test diagram as a demonstration for JA\=\1 A·dm−2 (at values: m(H2SO4) = 214.53 g·L−1, m(Al) = 7.43 g·L−1, T = 14.7 °C, U = 14 V, I = 120 A, surface area of the treated parts 120 dm2, material EN AW 5083) of the anodic oxidation process in practical verification.
Coatings 09 00057 g014
Figure 15. A plate (a) before and (b) after anodic oxidation by the GS method.
Coatings 09 00057 g015
Table 1. GS experimental conditions.
Method of Anodic OxidationType of Experiment PlanNumber of FactorsNumber of TestsControlled FactorsConstant Factors
Factor CodeFactorFactor LevelAnode/Cathode MaterialVoltage
−2−1012
GSCentral Composite Plan426x1m (H2SO4) (g·L−1)25.00100.00175.00250.00325.00EN AW-1050A H24 12 V
x2m (Al) (g·L−1)1.323.976.629.2611.91
x3t (°C)2.0012.0022.0032.0042.00
x4T (min)10.0025.0042.5060.0080.00
1 The parameters x1 represent the amount of sulphuric acid in the electrolyte, x2 the amount of aluminium in the electrolyte, x3 the electrolyte temperature, and x4 the anodic oxidation time.
Table 2. The composition of the H2SO4 solution/weight percentage of the additive elements (%).
H2SO4ChloridesNitrogen (Total)SeFeAsHeavy MetalsKMnO4
min. 96%max. 0.0001max. 0.0001max. 0.0005max. 0.0001max. 0.000003max. 0.0005max. 0.0002
Table 3. Composition of Al2O3/weight percentage of the additive elements (%).
Al2O3Loss by AnnealingChloridesSulphates
min. 99.6max. 0.3max. 0.005max. 0.1
Table 4. Summary of the suitability of two of the selected statistical models.
Model Parameter JA = 1 A⋅dm−2JA = 2 A⋅dm−2JA = 3 A⋅dm−2JA = 4 A⋅dm−2JA = 5 A⋅dm−2
R-square0.9317340.9152120.9315510.9420080.952236
R-square adj0.9051860.8822380.8993390.9147180.929759
Table 5. Model parameter estimation as a demonstration for the current density of JA = 5 A·dm−2.
TermEstimateStd Errort RatioProb >|t|Lower 95%Upper 95%VIF
Intercept12.8619050.40611431.67<0.000112.00507913.71873
x41.60740740.5372382.990.00820.47393392.74088093
x15.22888890.5372389.73<0.00014.09541546.36236243
x32.07083330.3101756.68<0.00011.41642212.72524461
x1·x3−1.1938890.379885−3.140.0059−1.995376−0.3924021
x3·x3−2.1371560.298892−7.15<0.0001−2.767763−1.506551
x4·x4·x40.71439810.2193273.260.00460.25165951.17713683
x4·x4·x1−3.5248610.65798−5.36<0.0001−4.913077−2.1366453
x4·x1·x3−1.3193060.379885−3.470.0029−2.120792−0.5178191
Table 6. Testing the effects using the F-test as a sample for the current density of JA = 5 A⋅dm−2.
SourceNparmDFSum of SquaresF RatioProb > F
x41120.670078.9520.0082
x111218.7302394.7295<0.0001
x311102.9204244.5736<0.0001
x1·x31122.805939.8770.0059
x3·x311118.0506651.1263<0.0001
x4·x4·x41124.4975110.60960.0046
x4·x4·x11166.2647828.6985<0.0001
x4·x1·x31127.8490712.06110.0029
Table 7. Residue autocorrelation testing as a demonstration for the sample density JA = 5 A⋅dm−2.
Durbin–WatsonNumber of obs.AutocorrelationProb < DW
1.8802859260.00180.4706

