IRI Sensitivity to the Influence of Surface Distress on Flexible Pavements


Abstract
:1. Introduction
2. Materials and Methods
2.1. International Roughness Index (IRI)
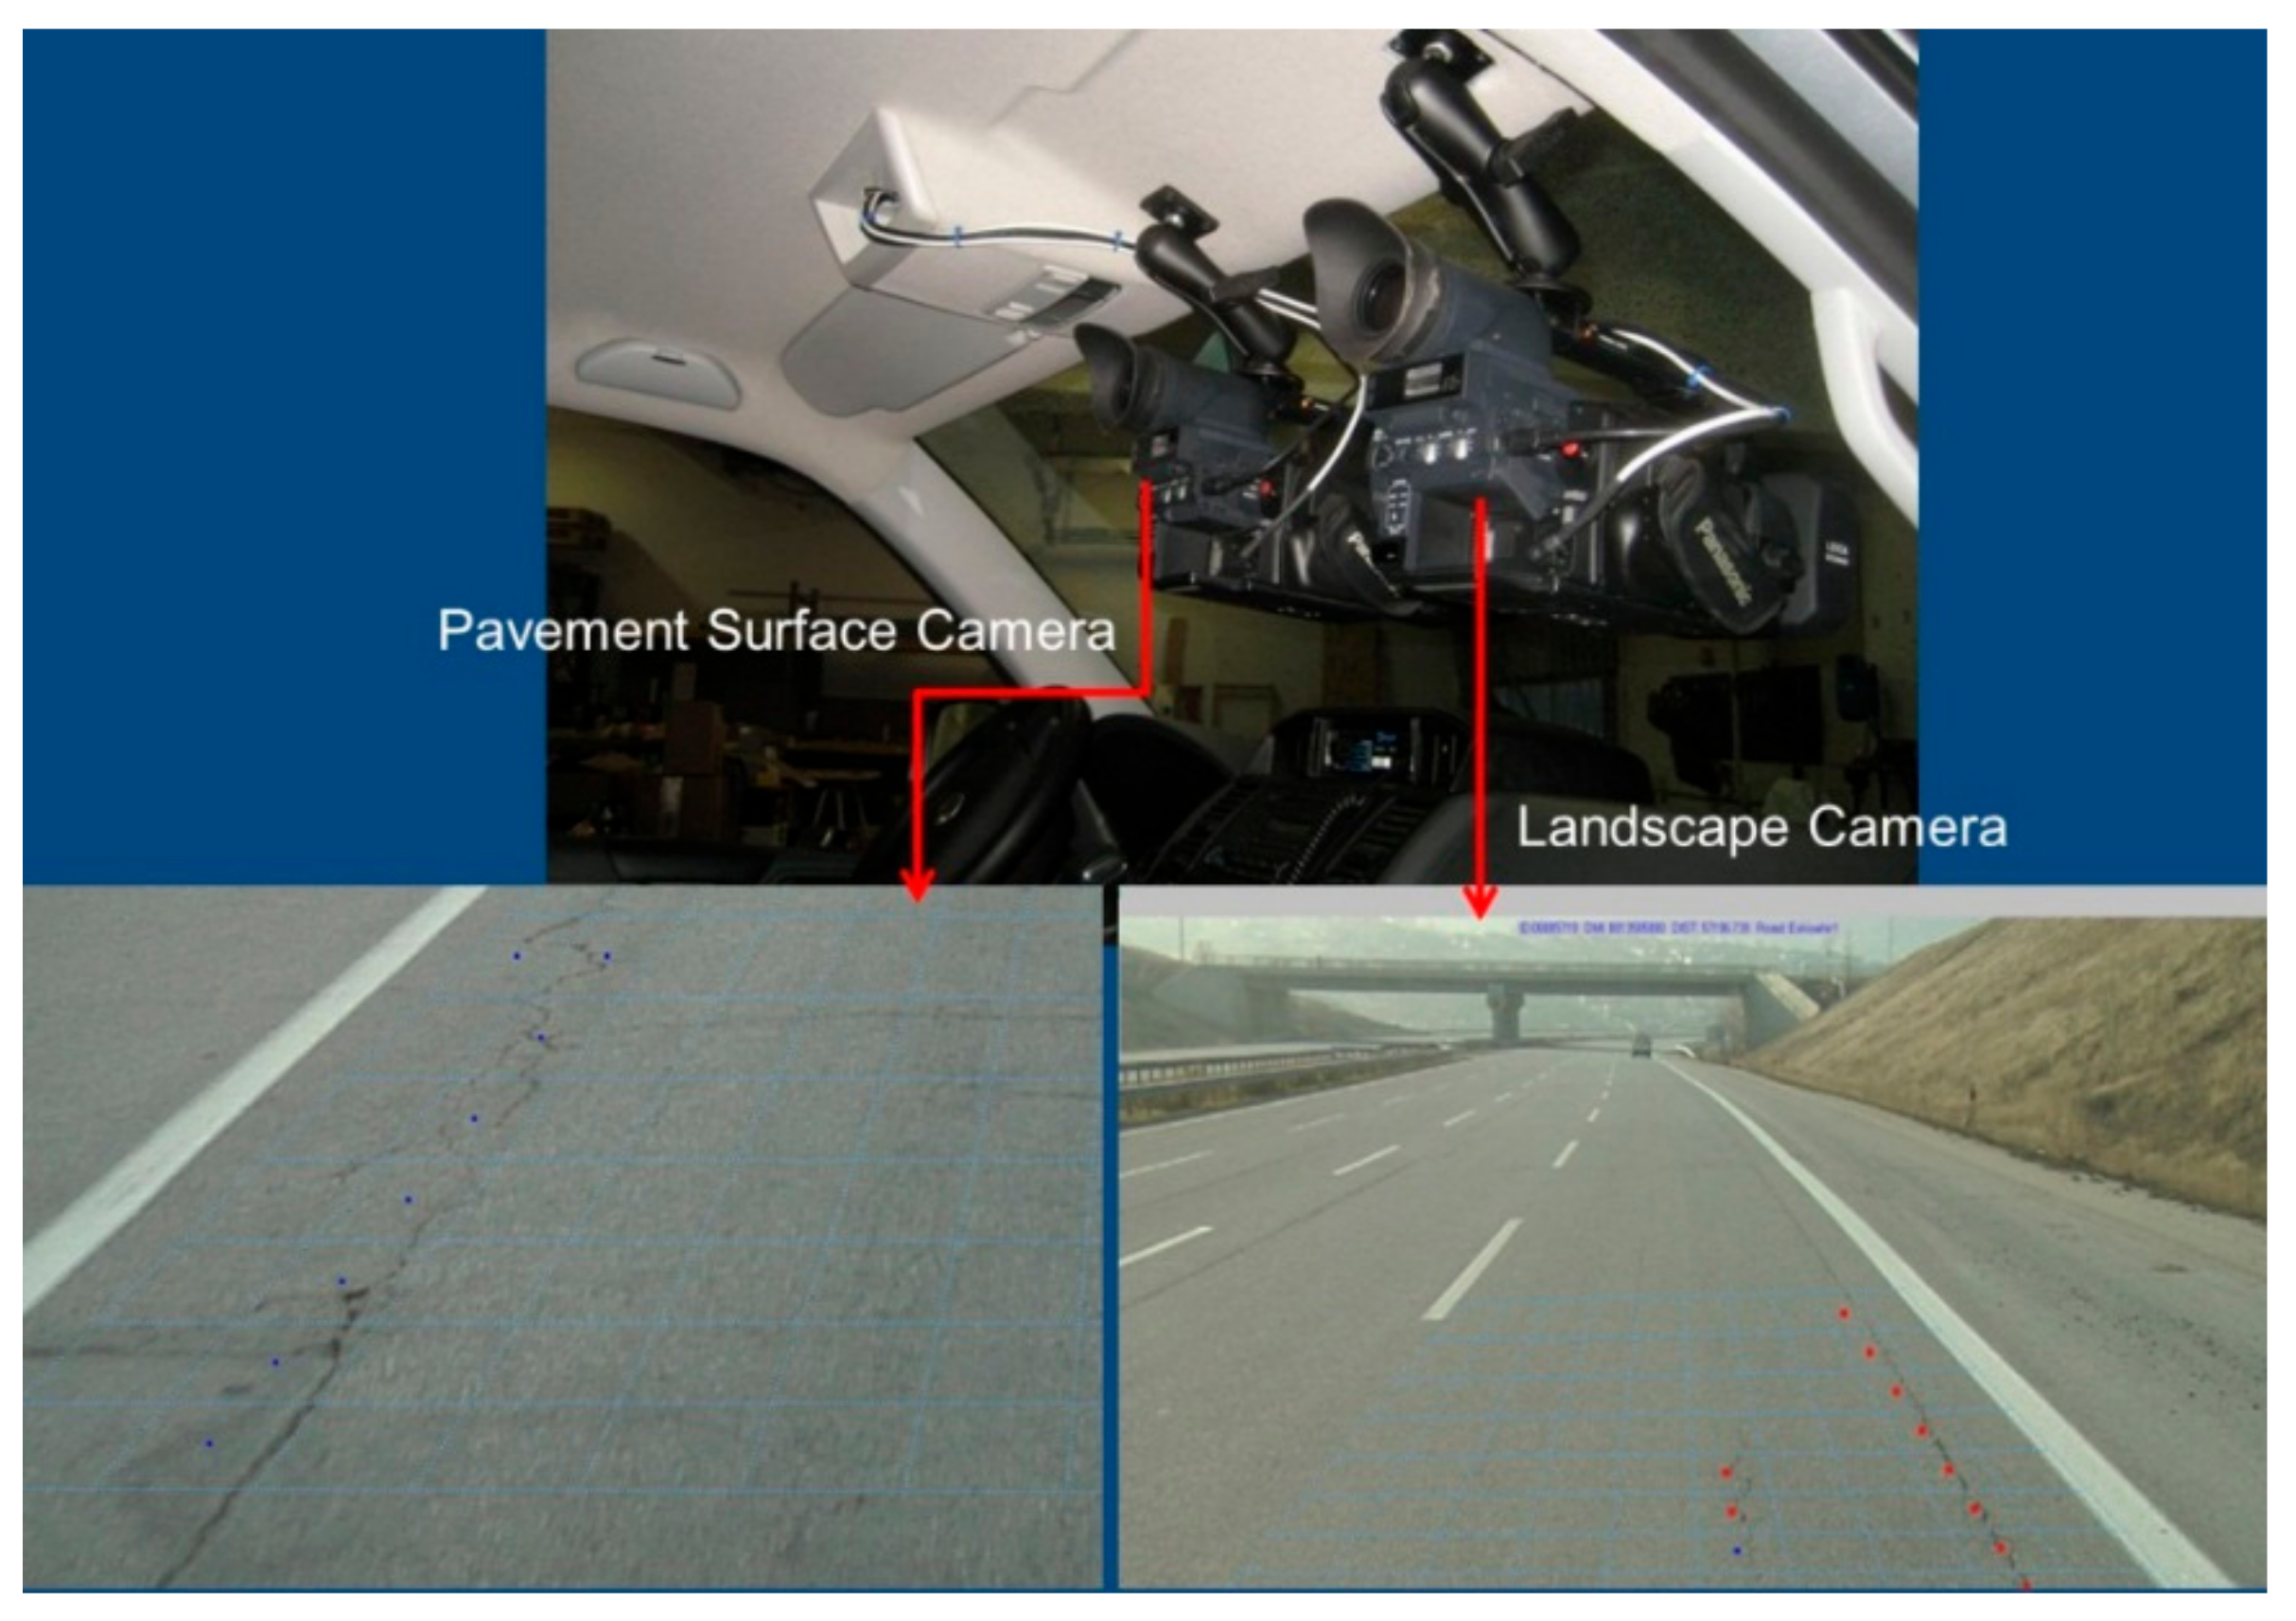
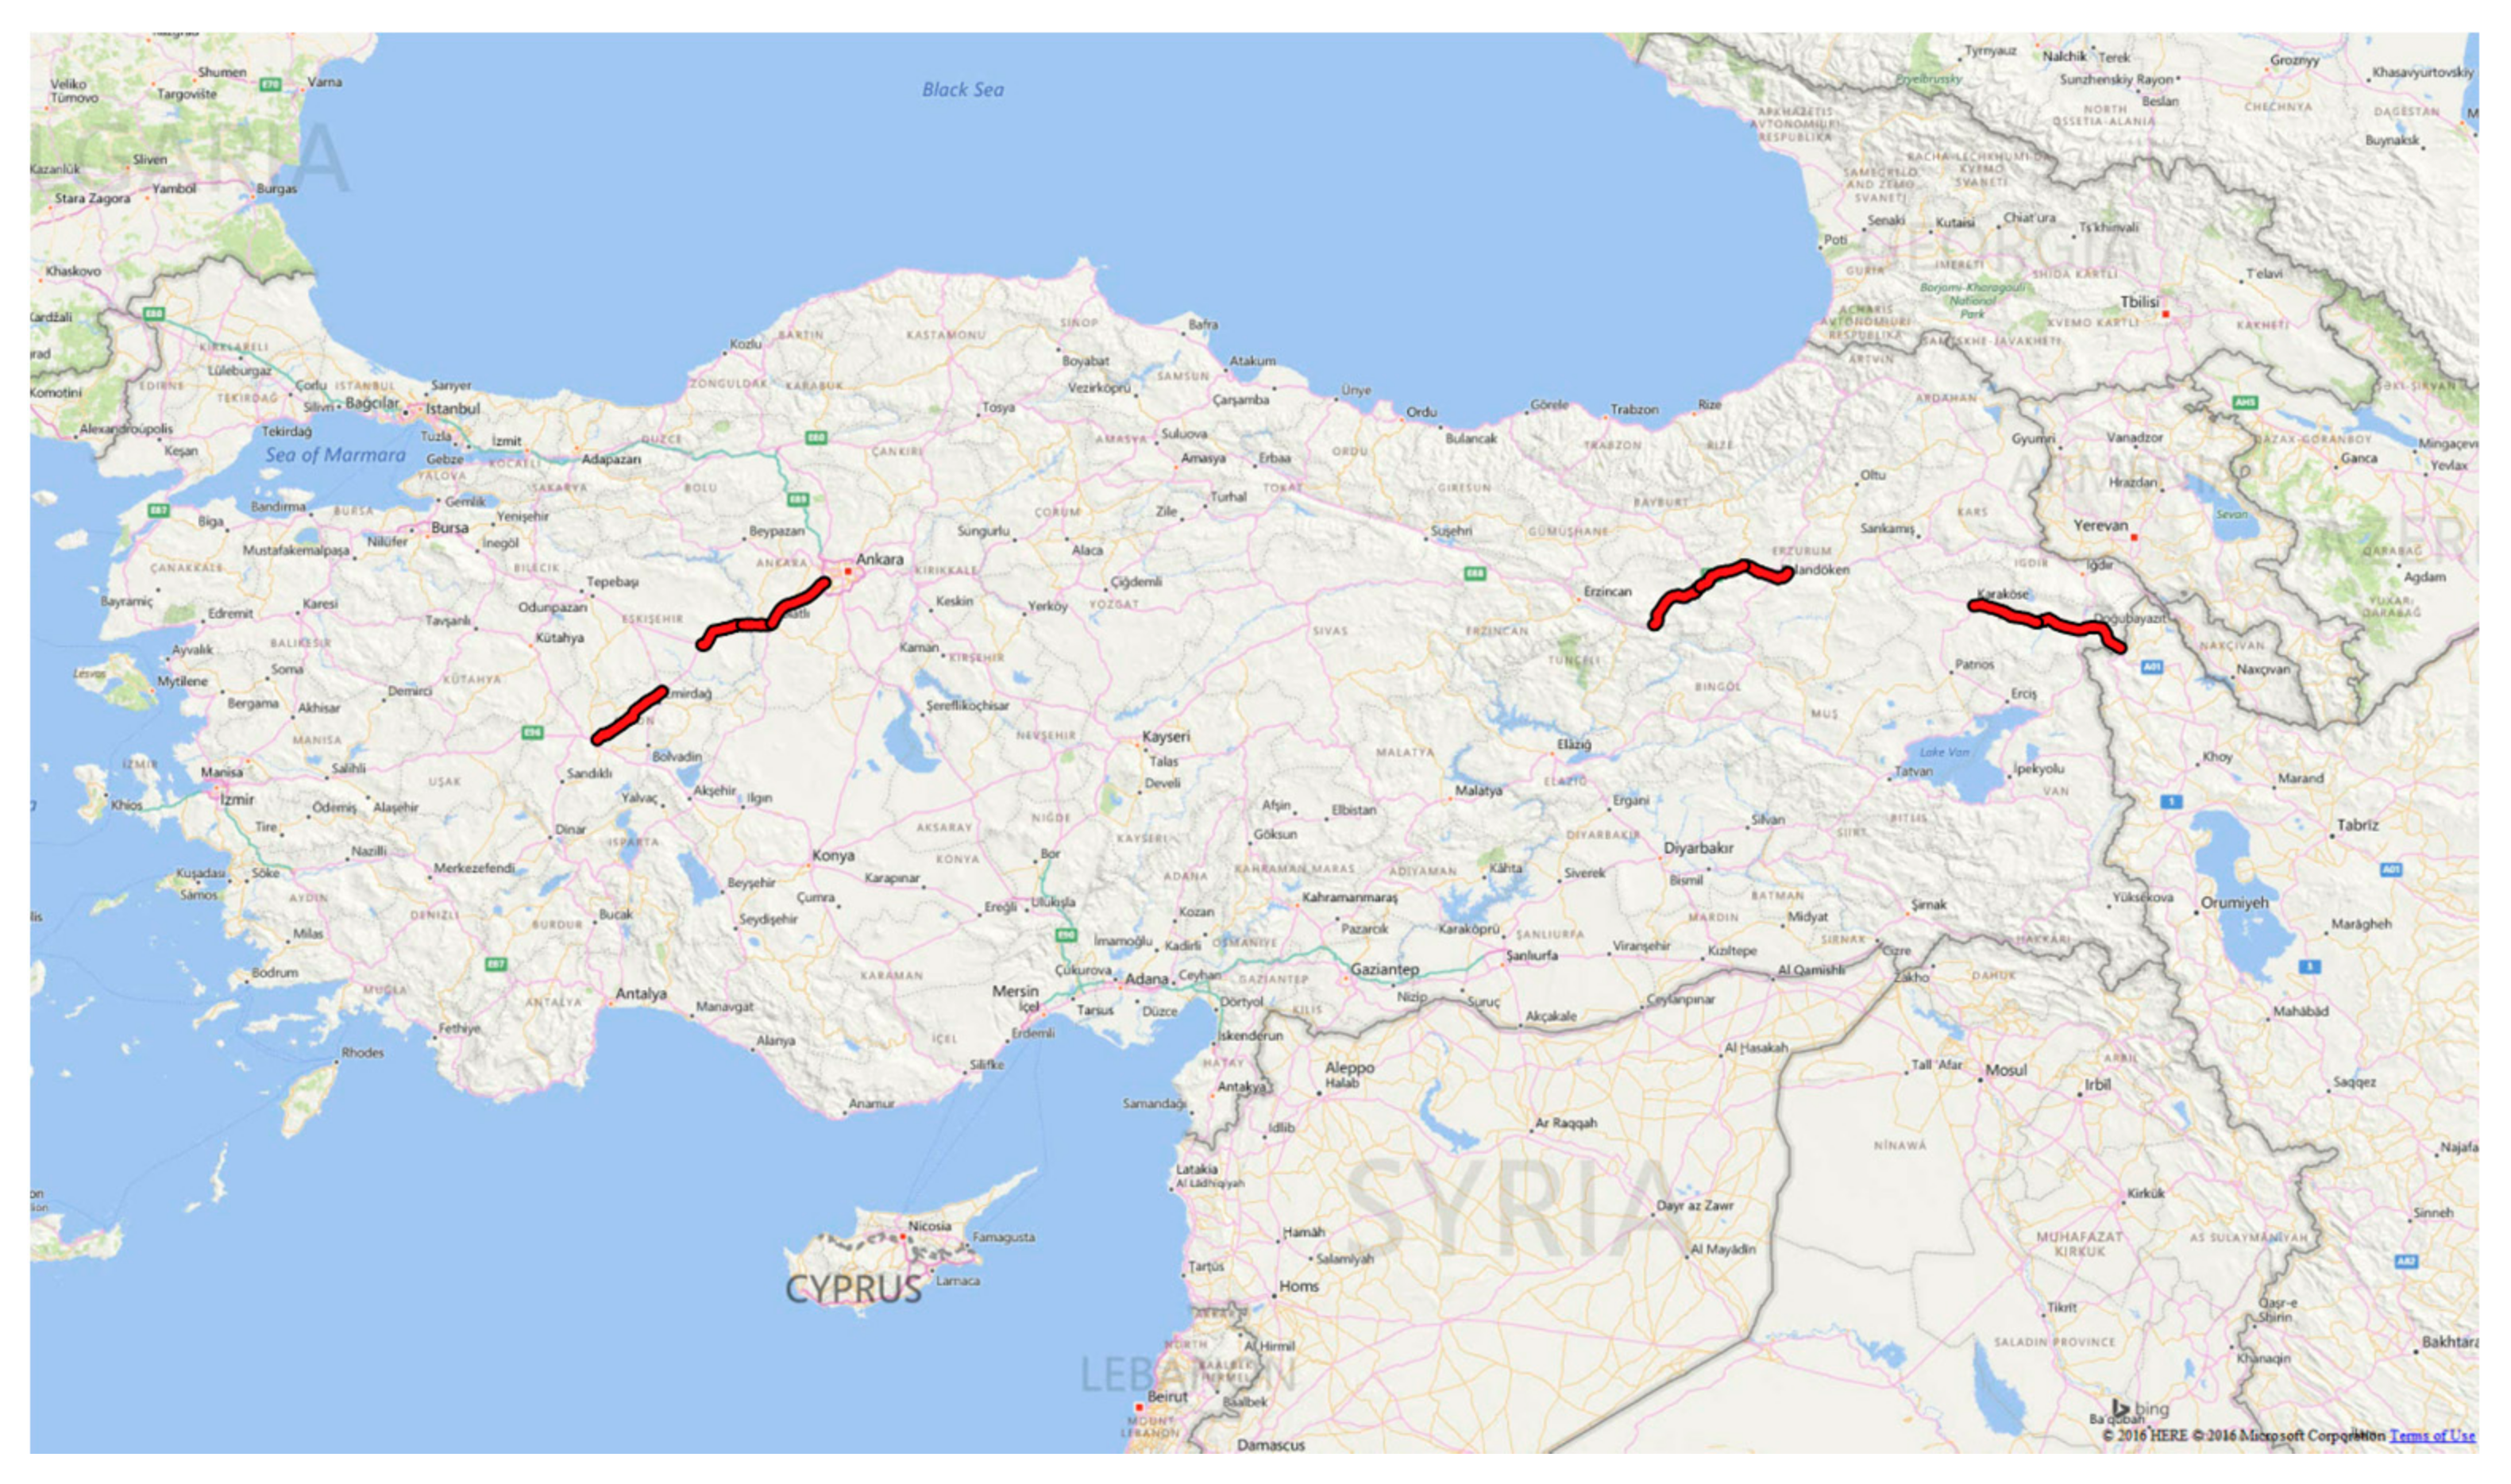
2.2. Field Studies
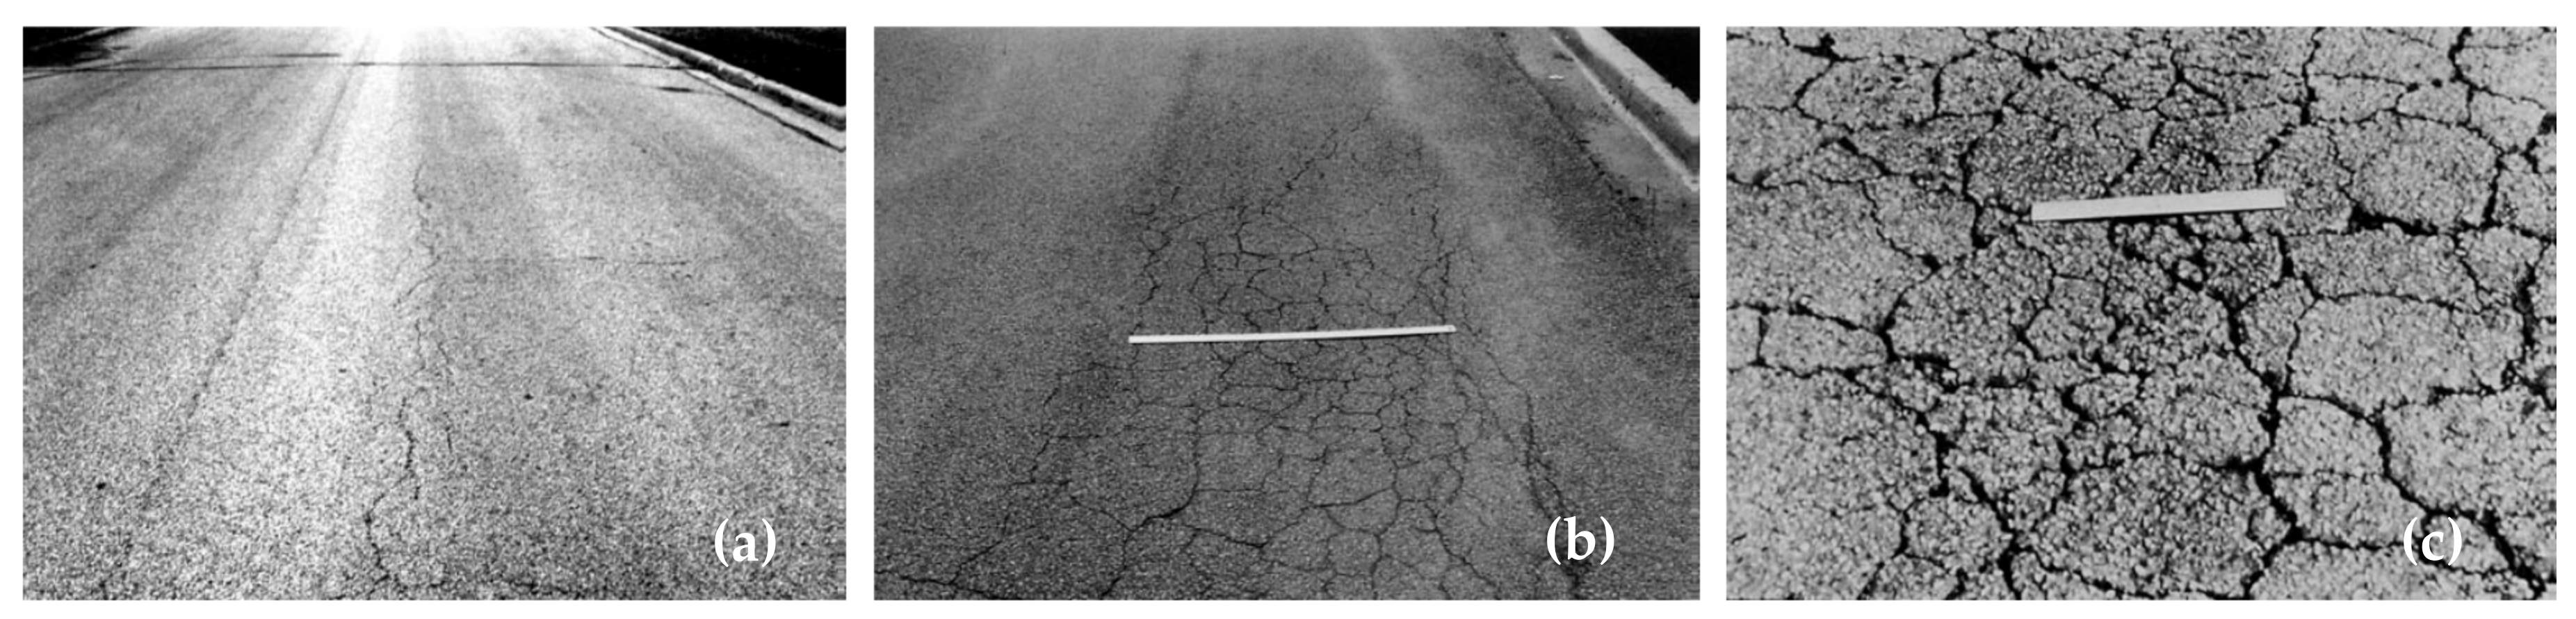
2.3. Evaluation of Pavement Distress
2.4. Multivariate Adaptive Regression Splines (MARS) Approach
2.5. Modelling of Relationships between Surface Distress and International Roughness Index
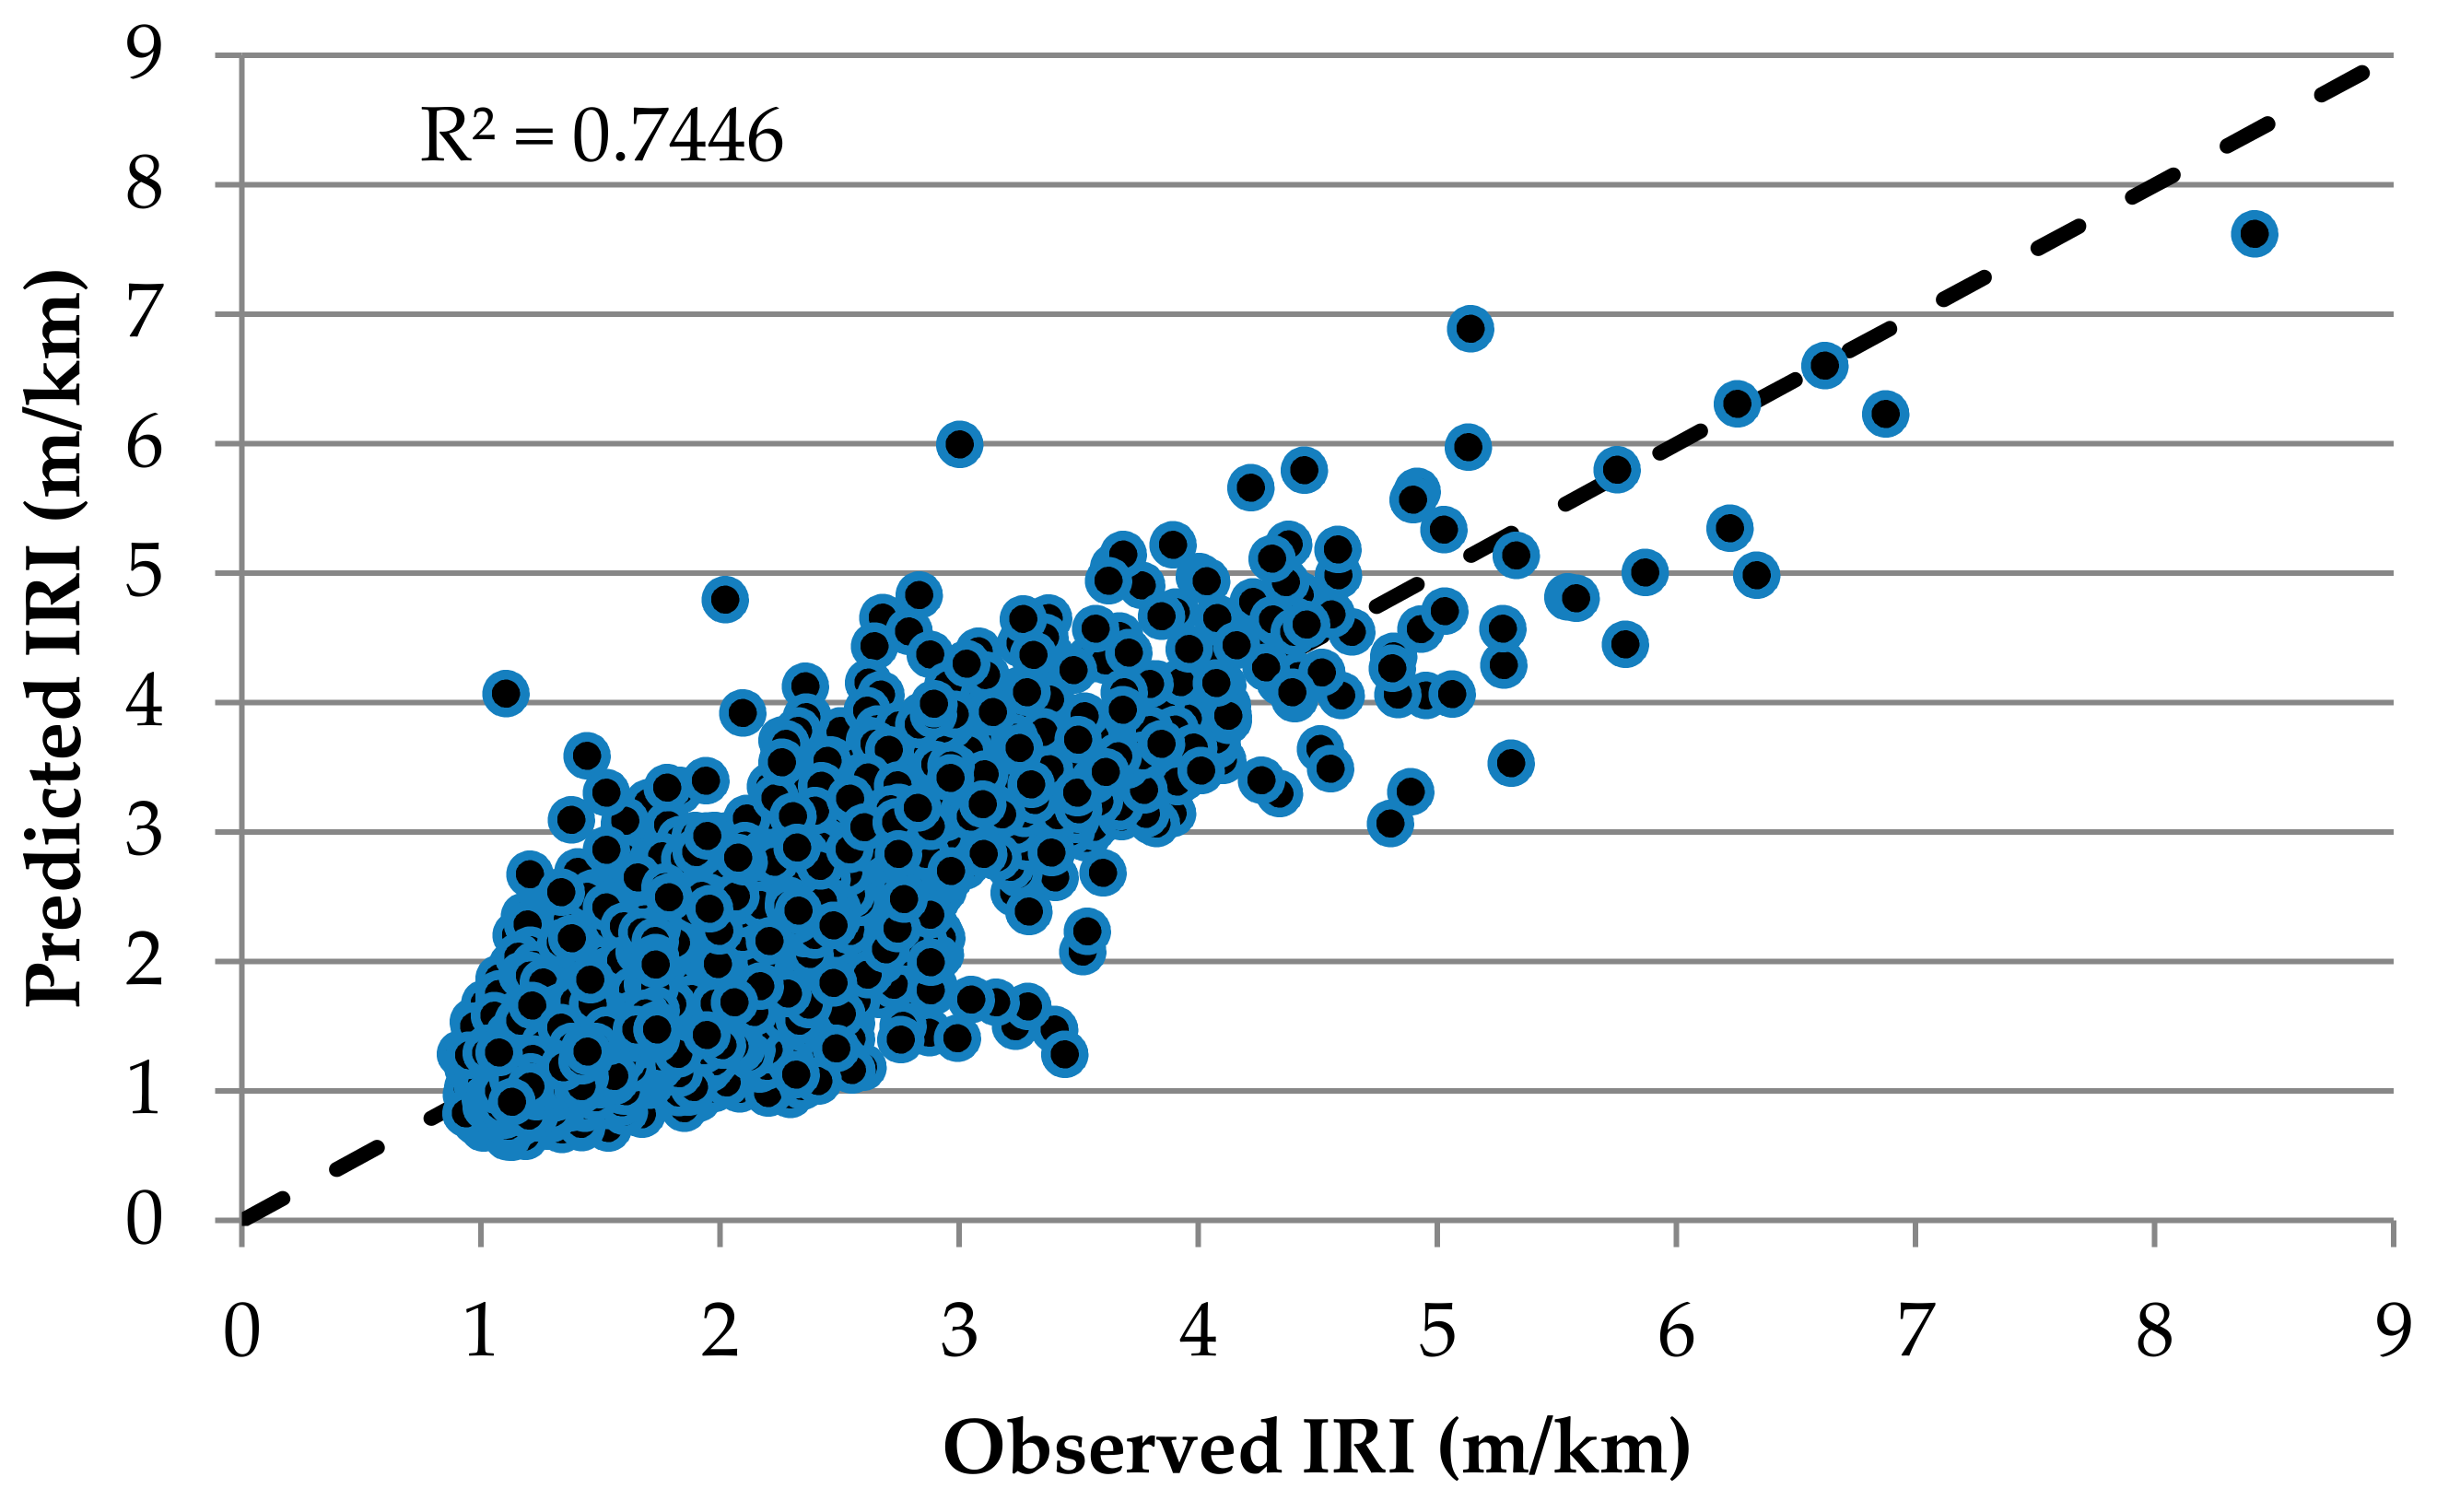
3. Results
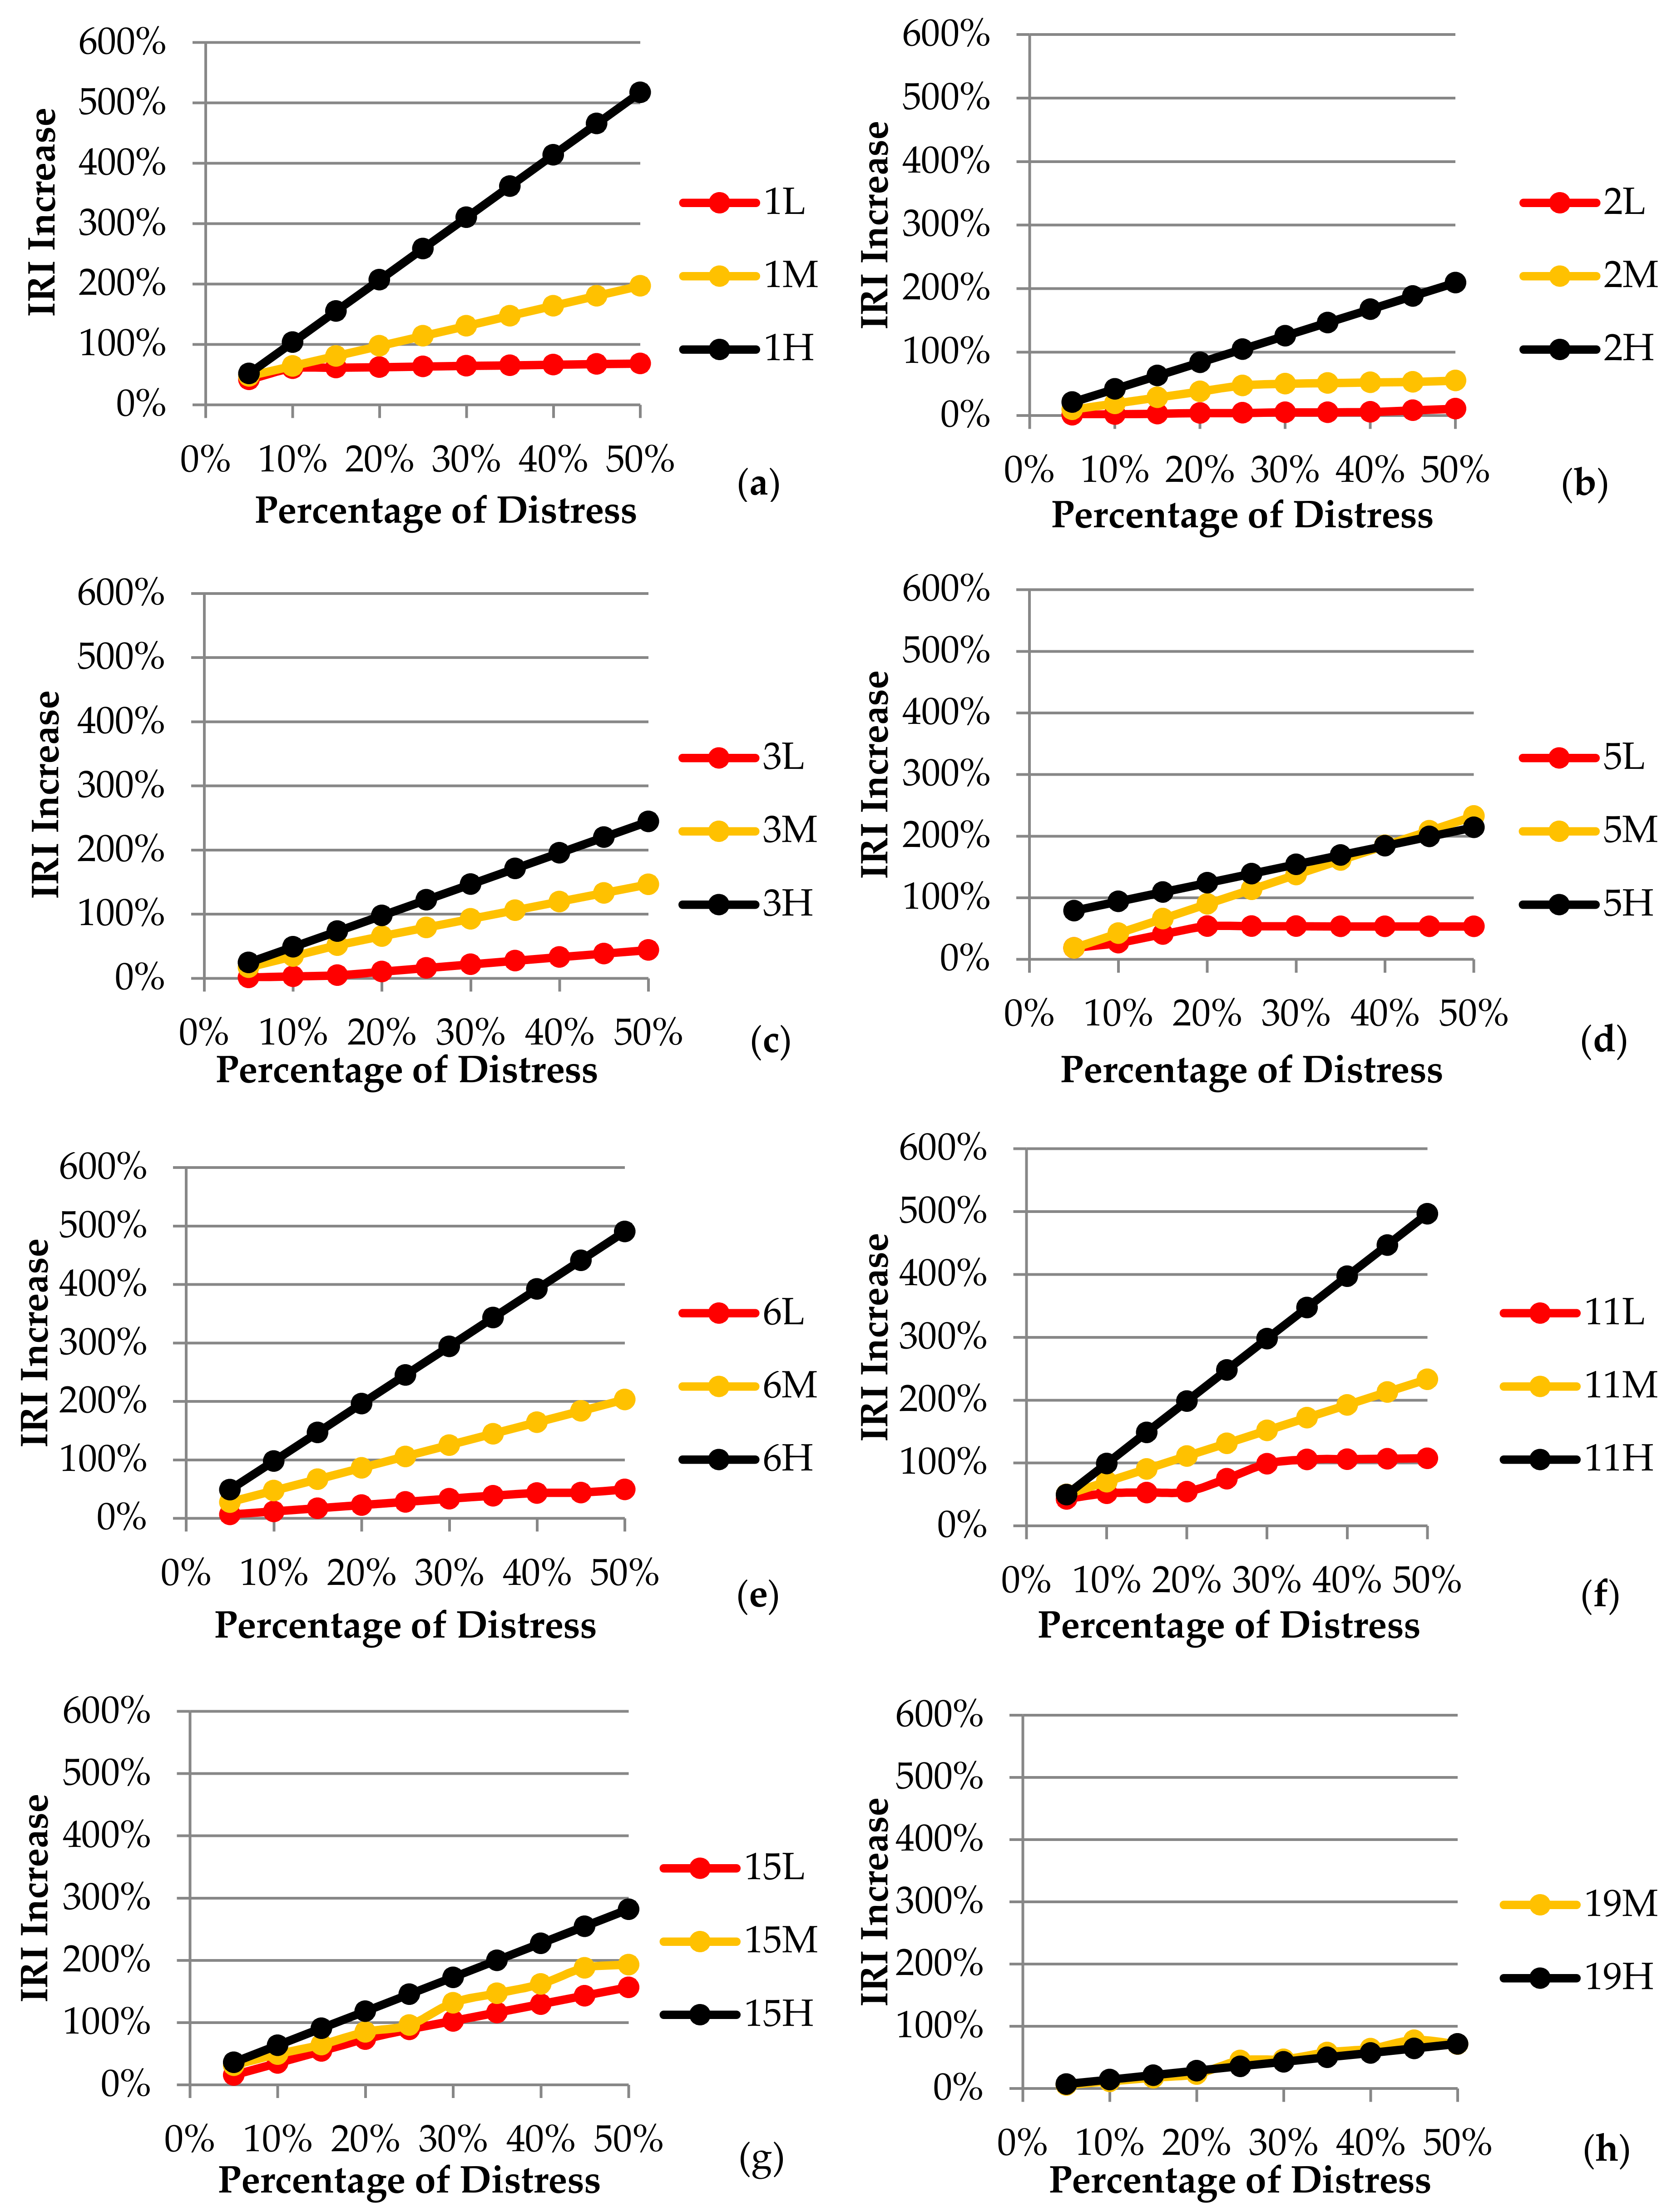
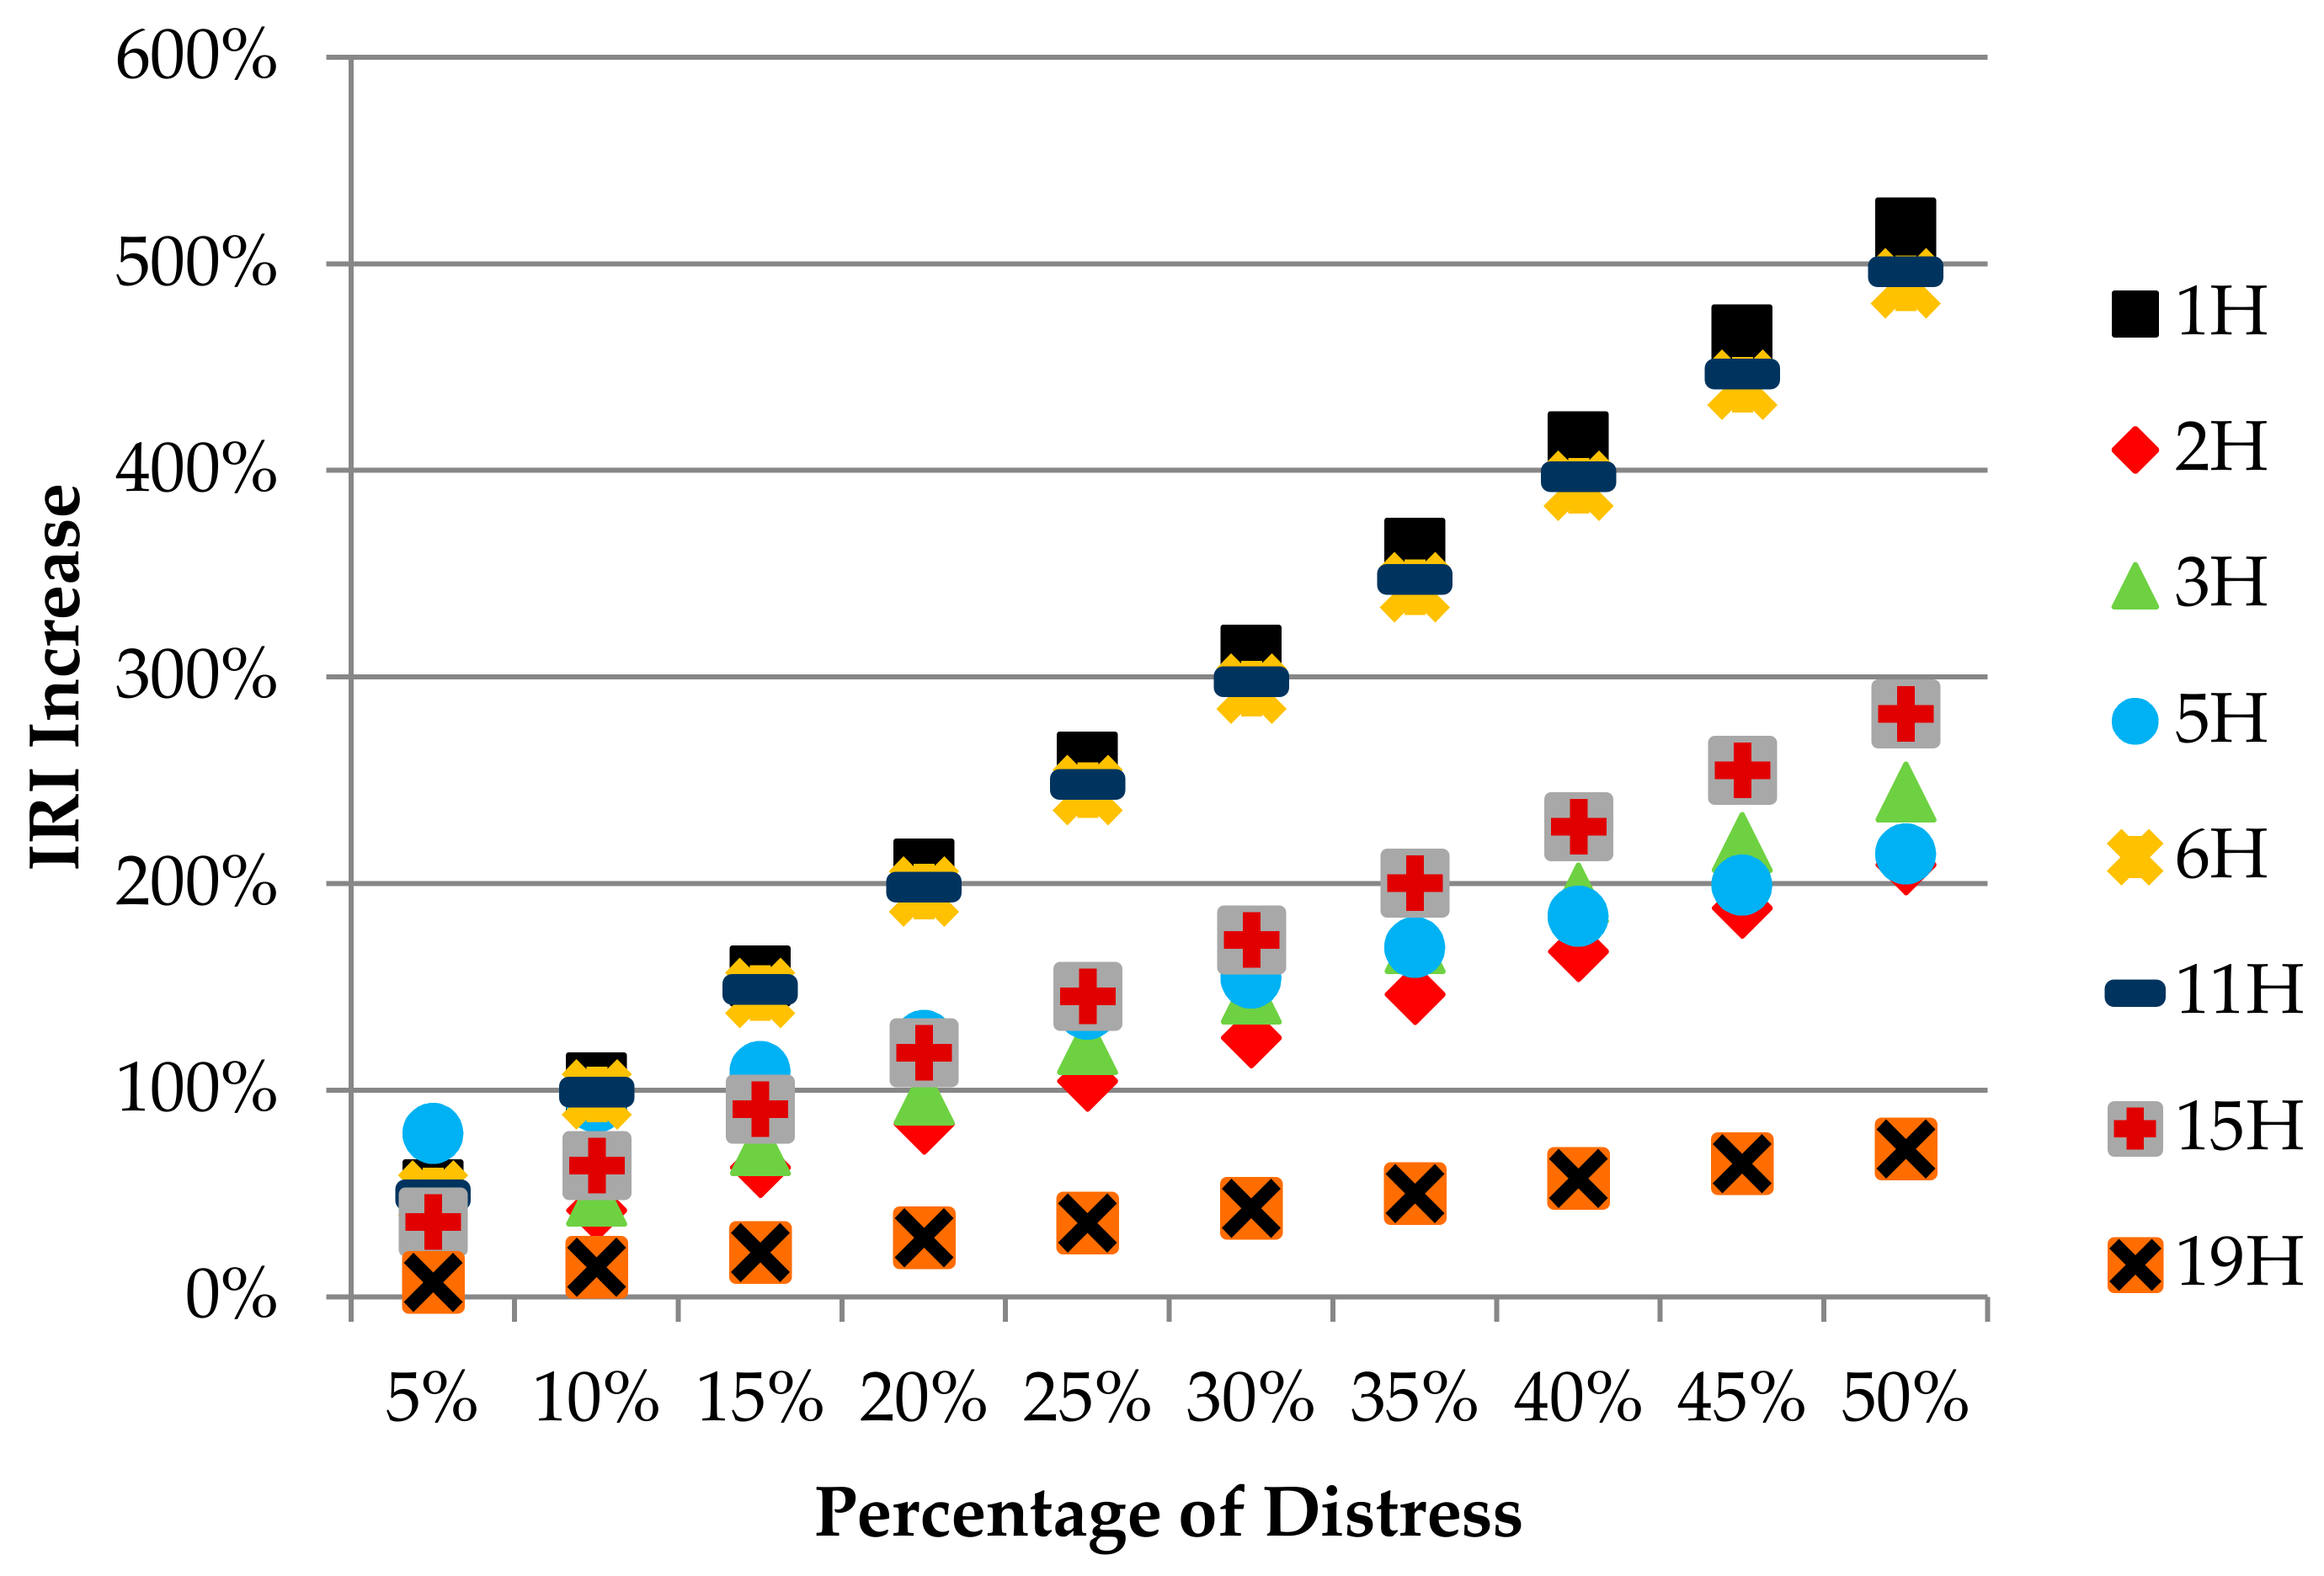
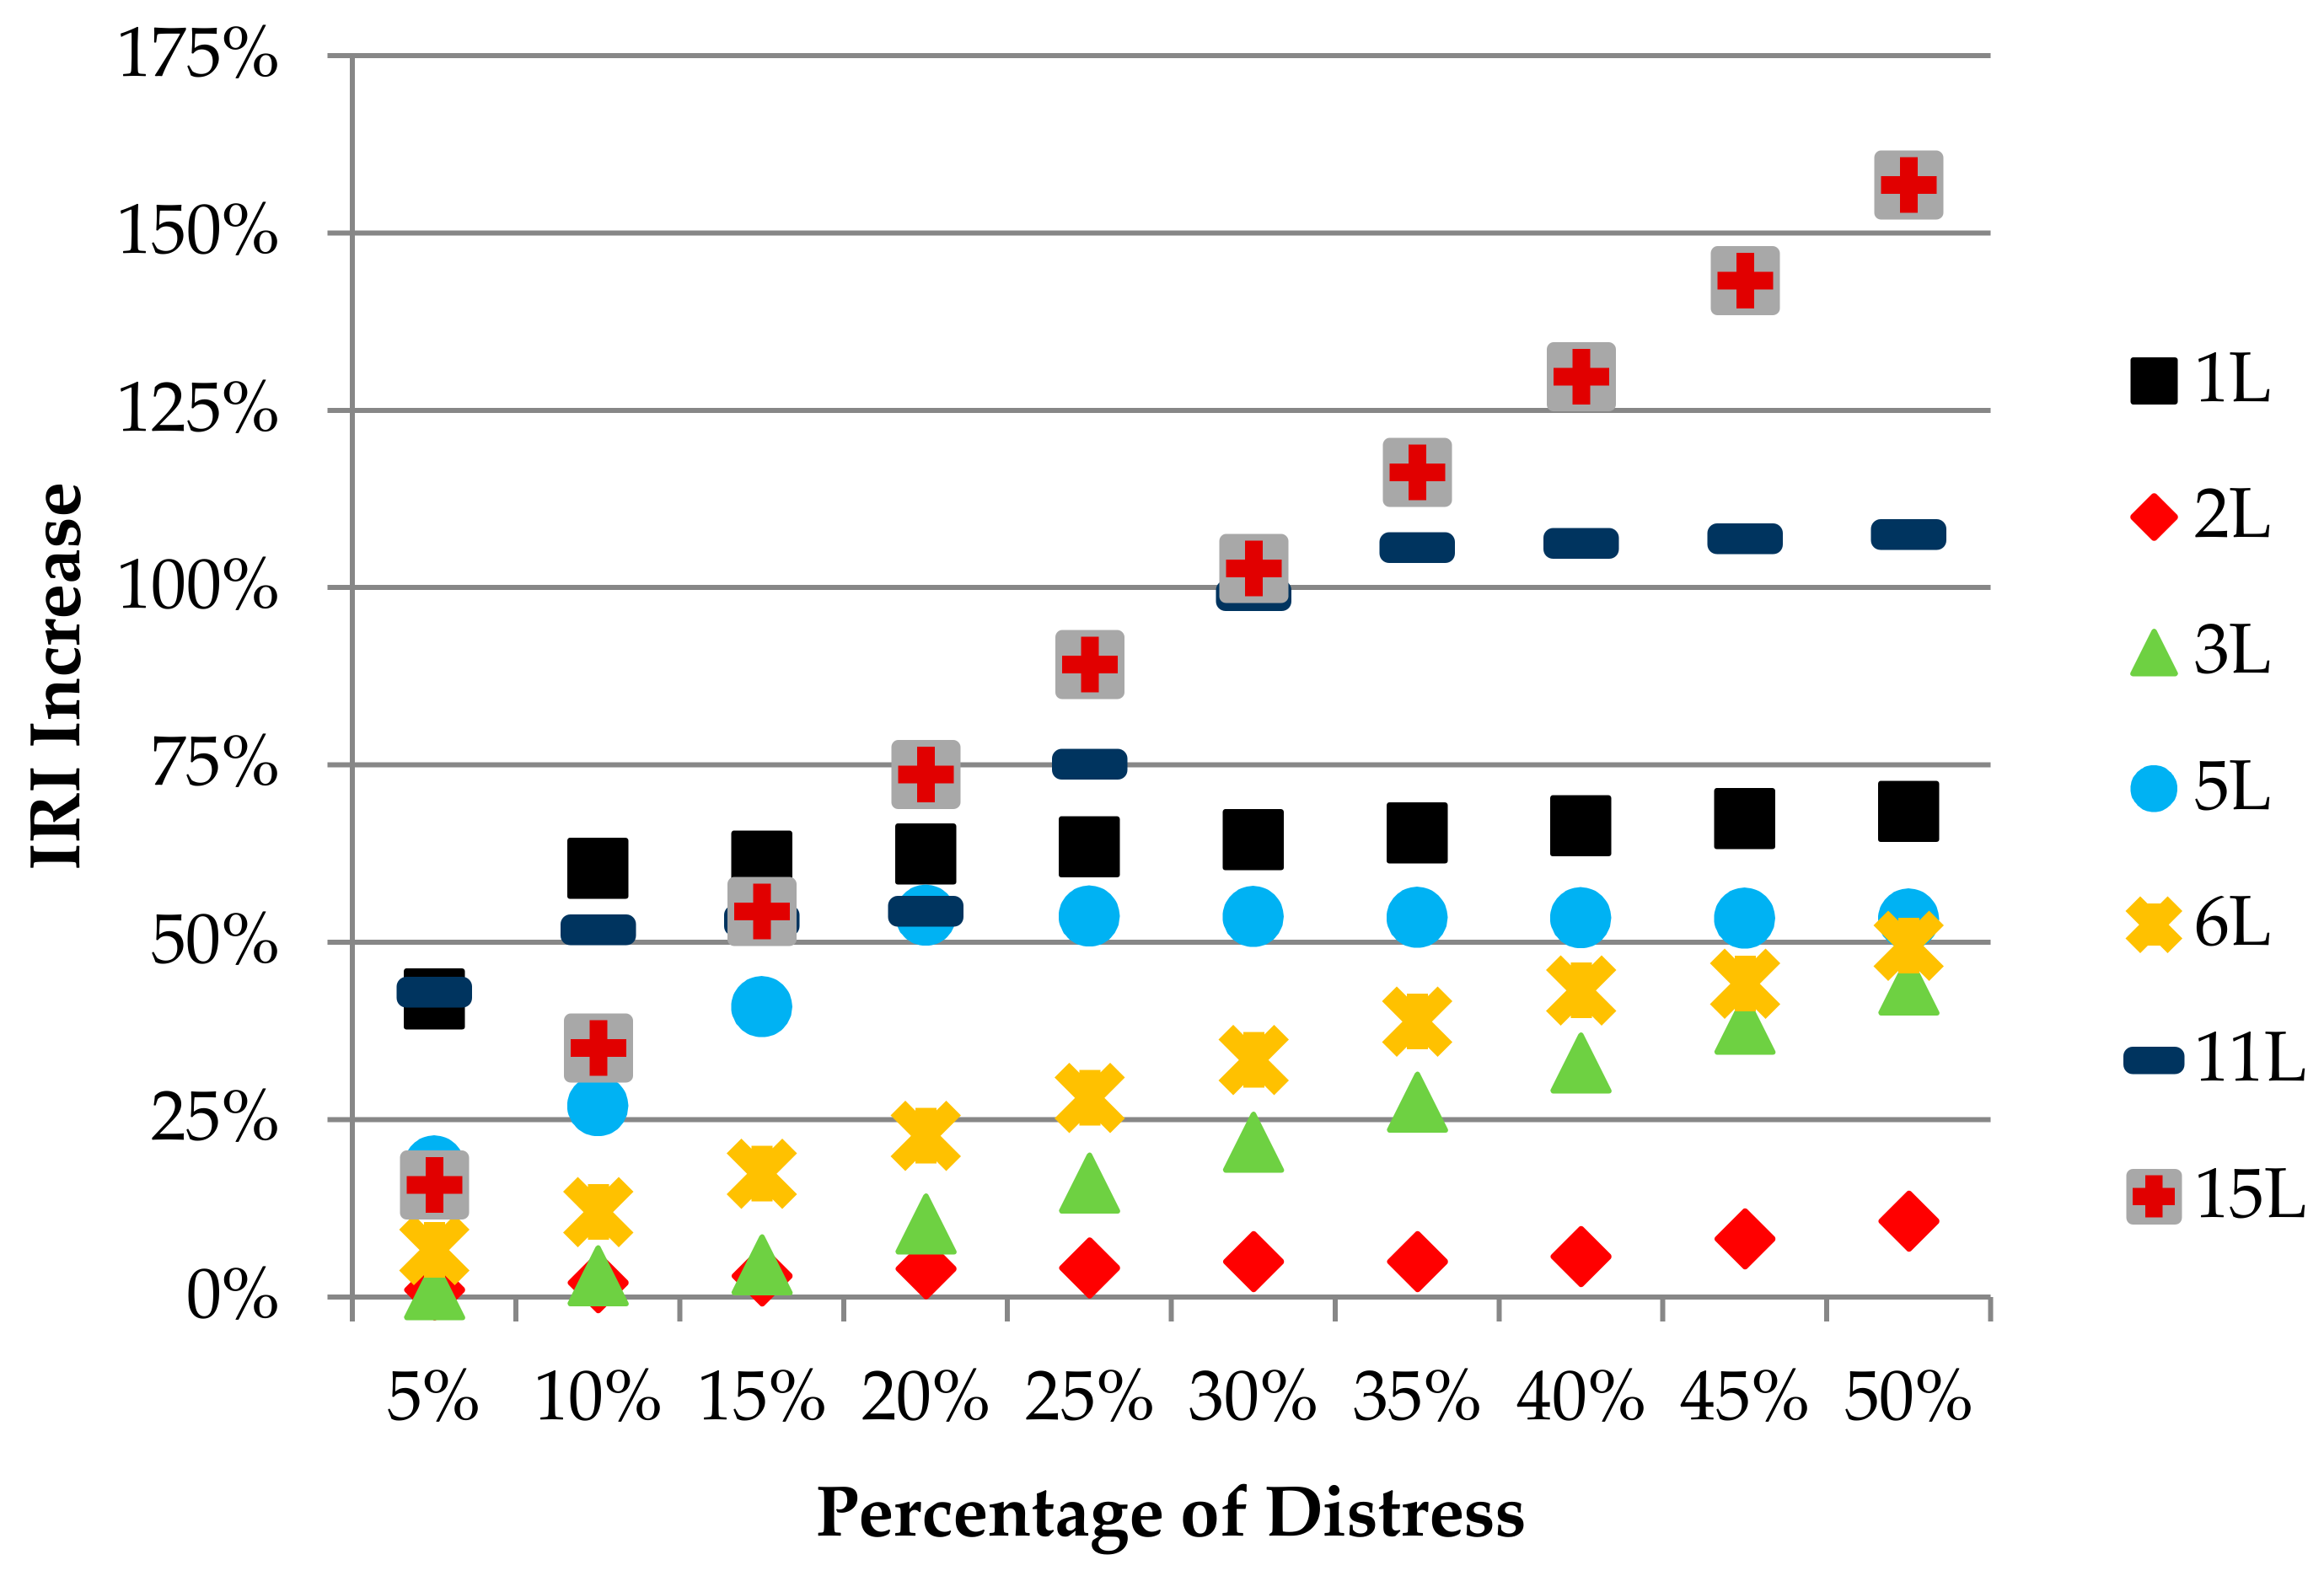
- (Figure 6a) The alligator cracking caused a 50% increase in IRI in all severities of distress, if the distress occurred at 5% of the evaluated area. However, if the distress was seen in 50% of the area, it caused an increase in value of about 70% in low severity, 200% in medium severity, and 500% in high severity.
- (Figure 6b) During cases of bleeding-type distress, an increase in low severity by 1%, moderate severity by 9%, and high severity by 21% occurred in IRI when 5% of the distress was seen in the evaluated area. However, if it was observed in 50% of the evaluated area, low severity caused an increase in IRI by 11%, moderate severity by 55%, and high severity by 209%. It is remarkable that there was about 20 times the difference between low-severity distress and high-severity distress in the IRI increase.
- (Figure 6c) IRI was relatively less affected by block cracking-type distress, which was the result of combined states of longitudinal and transverse cracks. When observed at 5% of the evaluated area, low severity caused an increase in IRI by 1%, moderate severity by 17%, and high severity by 24%. Conversely, if it was seen in 50% of the surface area, it caused an increase in the IRI by 44% in low severity, 146% in medium severity, and 244% in high severity. Moderate and high severity distress led to a much greater increase in the IRI than low severity distress.
- (Figure 6d) It is known that the corrugation-type distress, such as a signal waves, result in a disturbance in the transverse direction of the highway pavement. When the distress was observed in 5% of the evaluated area, it was understood that there was an increase in IRI by 18% from low severity, 18% from moderate severity, and 79% from high severity. It is noteworthy that high severity distress resulted in a significant increase in IRI, while low and moderate distress caused a very insignificant increase, according to the model's conclusions. When the distress was observed in 50% of the evaluated area, an increase in IRI value was seen in low intensity by 53%, moderate intensity by 232%, and high intensity by 214%. The difference in the IRI increase that occurred when the distress was seen in the small area shrunk considerably in comparison to the large area. Moreover, the increase in IRI was very close to each other for moderate and high severity distress. The fact that the medium severity IRI increase rate was higher than the high severity IRI increase rate was thought to be due to insufficient data for the calibration of this type of distress used to create the model. This should be considered to be a problem in detecting the sensitivity of the input parameters of the models created from a large number of inputs and it should be kept in mind that the effects of high severity corrugation-type distress on the IRI increase in subsequent studies needs to be verified.
- (Figure 6e) Surface distress of the depression-type affected the increase in IRI negatively in a significant way. When the distress was observed in 5% of the evaluated area, it was understood that it caused an increase in IRI by 7% in low severity, 28% in medium severity, and 49% in high severity. However, if the distress was seen in 50% of the area, it led to an increase in the IRI by 50% in low severity, 203% in medium severity, and 491% in high severity.
- (Figure 6f) Considering the case of 5% of the evaluated area, the patching-type distress caused an increase in IRI by 43% in the low severity, and 50% in the medium and high severity. When observed in 50% of the area, low severity caused an increase in IRI by 107%, moderate severity by 233%, and high severity by 496%. The patching was a type of distress that provided a significant increase in the IRI, especially in the case of a large quantity of evaluated area.
- (Figure 6g) It was seen that the increase in the IRI value of rutting-type distress in the same quantity, low, medium, and high severities, did not make much difference compared to the other types of distress. When the distress was observed in 5% of the evaluated area, it was observed that it caused an increase in IRI by 16% in low severity, 31% in medium severity, and 36% in high severity. If the distress was observed in 50% of the area, it caused an increase of 157% in low severity, 193% in moderate severity, and 282% in high severity.
- (Figure 6h) Finally, raveling-type distress was evaluated in a similar way. As stated in the distress identification standard, raveling-type distress was evaluated at two levels of severity, moderate and high. It was understood that this type of distress led to an increase of IRI by 6%–7% if observed in 5% of the evaluated area and 71%–72% if observed in 50% of the evaluated area for two different severities of distress. Since the raveling-type distress did not change much of the macro roughness seen on the pavement surface, it was determined that the increase in the IRI value in the model was the least impactful type of distress.
4. Discussion
5. Conclusions
Funding
Acknowledgments
Conflicts of Interest
References
- Guide for Design of Pavement Structures; American Association of State Highway and Transportation Officials: Washington, DC, USA, 1993; p. 624.
- Hozayen, H.A.; Alrukaibi, F. Development of acceptance measures for long term performance of bot highway projects. In Efficient Transportation and Pavement Systems: Characterization, Mechanisms, Simulation, and Modeling; Sayed, A.-Q., Ed.; Taylor&Francis Group: London, UK, 2009; pp. 335–348. [Google Scholar]
- Al-Omari, B.; Darter, M.I. Effect of pavement deterioration types on IRI and rehabilitation. Transp. Res. Rec. 1995, 1505, 57–65. [Google Scholar]
- Aguiar-Moya, J.P.; Prozzi, J.A.; de Fortier Smit, A. Mechanistic-empirical iri model accounting for potential bias. J. Transp. Eng. 2011, 137, 297–304. [Google Scholar] [CrossRef]
- Mactutis, J.; Alavi, S.; Ott, W. Investigation of relationship between roughness and pavement surface distress based on westrack project. Transp. Res. Rec. 2000, 1699, 107–113. [Google Scholar] [CrossRef]
- Sandra, A.K.; Sarkar, A.K. Development of a model for estimating international roughness index from pavement distresses. Int. J. Pavement Eng. 2013, 14, 715–724. [Google Scholar] [CrossRef]
- Attoh-Okine, N.O.; Mensah, S.; Nawaiseh, M. A New Technique for Using Multivariate Adaptive Regression Splines (MARS) in Pavement Roughness Prediction. Proc. Inst. Civ. Eng. Transp. 2003, 156, 51–55. [Google Scholar] [CrossRef]
- Chandrakasu, M.; Rajiah, M. Development of a roughness estimation model for low volume roads. Grdevinar 2018, 70, 97–104. [Google Scholar] [Green Version]
- Chandra, S.; Sekhar, C.R.; Bharti, A.K.; Kangadurai, B. Relationship between pavement roughness and distress parameters for indian highways. J. Transp. Eng. 2013, 139, 467–475. [Google Scholar] [CrossRef]
- Mahmood, M.; Rahman, M.; Mathavan, S. Distress based pavement performance prediction models. In Proceedings of the Eighth International Conference on Maintenance and Rehabilitation of Pavements, Singapore, 27–29 July 2016; pp. 357–368. [Google Scholar]
- Zhou, L.; Ni, F.; Leng, Z. Development of an asphalt pavement distress evaluation method for freeways in china. Int. J. Pavement Res. Technol. 2014, 7, 159–167. [Google Scholar]
- Lin, J.-D.; Yau, J.-T.; Hsiao, L.-H. Correlation analysis between international roughness index (IRI) and pavement distress by neural network. In Proceedings of the 82nd Annual Meeting of the Transportation Research Board, Washington, DC, USA, 12–16 January 2003. [Google Scholar]
- Yang, J.; Lu, J.; Gunaratne, M.; Xiang, Q. Overall pavement condition forecasting using neural networks—An application to florida highway network. In Proceedings of the 82nd Annual Meeting of the Transportation Research Board, Washington, DC, USA, 12–16 January 2003. [Google Scholar]
- Attoh-Okine, N.O. Analysis of learning rate and momentum term in backpropagation neural network algorithm trained to predict pavement performance. Adv. Eng. Softw. 1999, 30, 291–302. [Google Scholar] [CrossRef]
- Terzi, S. Modeling the pavement serviceability ratio of flexible highway pavements by artificial neural networks. Constr. Build. Mater. 2007, 21, 590–593. [Google Scholar] [CrossRef]
- Choi, J.H.; Adams, T.M.; Bahia, H.U. Pavement roughness modeling using back-propagation neural networks. Comput.-Aided Civ. Infrastruct. Eng. 2004, 19, 295–303. [Google Scholar] [CrossRef]
- Pan, N.-F.; Ko, C.-H.; Yang, M.-D.; Hsu, K.-C. Pavement performance prediction through fuzzy regression. Expert Syst. Appl. 2011, 38, 10010–10017. [Google Scholar] [CrossRef]
- Moazami, D.; Behbahani, H.; Muniandy, R. Pavement rehabilitation and maintenance prioritization of urban roads using fuzzy logic. Expert Syst. Appl. 2011, 38, 12869–12879. [Google Scholar] [CrossRef]
- Karaşahin, M.; Terzi, S. Performance model for asphalt concrete pavement based on the fuzzy logic approach. Transport 2014, 29, 18–27. [Google Scholar] [CrossRef]
- Terzi, S. Modeling for pavement roughness using the anfis approach. Adv. Eng. Softw. 2013, 57, 59–64. [Google Scholar] [CrossRef]
- Kırbaş, U.; Karaşahin, M. Estimating PCI using Vibration Data for Asphalt Concrete Pavements. In Proceedings of the 2nd World Congress on Civil, Structural, and Environmental Engineering (CSEE’17), Barcelona, Spain, 2–4 April 2017; pp. 1–9. [Google Scholar]
- Lantieri, C.; Lamperti, R.; Simone, A.; Vignali, V.; Sangiorgi, C.; Dondi, G. Mobile laser scanning system for assessment of the rainwater runoff and drainage conditions on road pavements. Int. J. Pavement Res. Technol. 2015, 8, 1–9. [Google Scholar]
- Suanpaga, W.; Yoshikazu, K. Riding quality model for asphalt pavement monitoring using phase array type L-band synthetic aperture radar (PALSAR). Remote Sens. 2010, 2, 2531–2546. [Google Scholar] [CrossRef]
- Jo, Y.; Ryu, S. Pothole detection system using a black-box camera. Sensors 2015, 15, 29316–29331. [Google Scholar] [CrossRef] [PubMed]
- Radopoulou, S.C.; Brilakis, I. Patch detection for pavement assessment. Autom. Constr. 2015, 53, 95–104. [Google Scholar] [CrossRef]
- Lokeshwor, H.; Das, L.K.; Goel, S. Robust method for automated segmentation of frames with/without distress from road surface video clips. J. Transp. Eng. 2014, 140, 31–41. [Google Scholar] [CrossRef]
- Koch, C.; Brilakis, I. Pothole detection in asphalt pavement images. Adv. Eng. Inf. 2011, 25, 507–515. [Google Scholar] [CrossRef]
- Dondi, G.; Barbarella, M.; Sangiorgi, C.; Lantieri, C.; De Marco, L. A semi-automatic method for identifying defects on road surfaces. In ICSDC 2011: Integrating Sustainability Practices in the Construction Industry; Chong, W.K.O., Hermreck, C., Eds.; American Society of Civil Engineers: Reston, VA, USA, 2012; pp. 704–711. [Google Scholar]
- ASTM E 950 Standard Test Method for Measuring the Longitudinal Profile of Traveled Surfaces with an Accelerometer Established Inertial Profiling Reference; ASTM International: West Conshohocken, PA, USA, 2009.
- Sayers, M.W.; Karamihas, S.M. The Little Book of Profiling; University of Michigan: Ann Arbor, MI, USA, 1998. [Google Scholar]
- Sayers, M.W.; Gillespie, T.D.; Queiroz, C.A.V. The International Road Roughness Experiment: Establishing Correlation and a Calibration Standard for Measurements; The World Bank: Washington, DC, USA, 1986; p. 454. [Google Scholar]
- Perera, R.W.; Kohn, S.D. Quantification of Smoothness Index Differences Related to Long-Term Pavement Performance Equipment Type; FHWA-HRT-05-054; Federal Highway Administration: McLean, VA, USA, 2005; p. 145.
- Sayers, M.W. On the calculation of international roughness index from longitudinal road profile. Transp. Res. Rec. 1995, 1501, 1–12. [Google Scholar]
- Cantisani, G.; Loprencipe, G. Road roughness and whole body vibration: Evaluation tools and comfort limits. J. Transp. Eng. 2010, 136, 818–826. [Google Scholar] [CrossRef]
- ASTM E 1923-08 Standard Practice for Computing International Roughness Index of Roads from Longitudinal Profile Measurements; ASTM International: West Conshohocken, PA, USA, 2008.
- ASTM D 6433-11 Standard Practice for Roads and Parking Lots Pavement Condition Index Surveys; ASTM International: West Conshohocken, PA, USA, 2011.
- Loprencipe, G.; Pantuso, A. A specified procedure for distress identification and assessment for urban road surfaces based on pci. Coatings 2017, 7, 65. [Google Scholar] [CrossRef]
- Friedman, J.H. Multivariate adaptive regression splines. Ann. Stat. 1991, 19, 1–67. [Google Scholar] [CrossRef]
- Weber, G.-W.; Batmaz, İ.; Köksal, G.; Taylan, P.; Yerlikaya-Özkurt, F. Cmars: A new contribution to nonparametric regression with multivariate adaptive regression splines supported by continuous optimization. Inverse Prob. Sci. Eng. 2012, 20, 371–400. [Google Scholar] [CrossRef]
- Attoh-Okine, N.O.; Cooger, K.; Mensah, S. Multivariate adaptive regression (MARS) and hinged hyperplanes (HHP) for doweled pavement performance modeling. Constr. Build. Mater. 2009, 23, 3020–3023. [Google Scholar] [CrossRef]
- Rounaghi, M.M.; Abbaszadeh, M.R.; Arashi, M. Stock price forecasting for companies listed on tehran stock exchange using multivariate adaptive regression splines model and semi-parametric splines technique. Phys. A 2015, 438, 625–633. [Google Scholar] [CrossRef]
- Zhang, W.G.; Goh, A.T.C. Multivariate adaptive regression splines for analysis of geotechnical engineering systems. Comput. Geotech. 2013, 48, 82–95. [Google Scholar] [CrossRef]


| Road No. | Annual Average Daily Traffic | Percentage of Heavy Vehicle (%) | Max. Temp. (°C) | Min. Temp. (°C) | Measurement Date (M.Y) |
|---|---|---|---|---|---|
| 200-10 | 11,549 | 31% | 40.8 | –21.5 | 12.2009 |
| 200-11 | 11,549 | 31% | 40.8 | –21.5 | 12.2009 |
| 200-12 | 16,586 | 26% | 40.8 | –21.5 | 12.2009 |
| 100-26 | 2566 | 51% | 39.2 | –32.6 | 10.2010 |
| 100-27 | 3907 | 49% | 27.6 | –15.5 | 10.2010 |
| 100-28 | 8544 | 22% | 27.6 | –15.5 | 10.2010 |
| 100-32 | 2388 | 41% | 30.0 | –16.2 | 10.2010 |
| 100-33 | 2301 | 42% | 38.6 | –25.0 | 10.2010 |
| 260-21 | 2822 | 45% | 27.6 | –15.5 | 10.2010 |
| Distress Code | Distress Name | Unit of Measure | Defined Severity Levels | Cause |
|---|---|---|---|---|
| 1 | Alligator cracking | m2 | Yes | Load |
| 2 | Bleeding | m2 | Yes | Other |
| 3 | Block cracking | m2 | Yes | Climate |
| 4 | Bumps and sags | m | Yes | Other |
| 5 | Corrugation | m2 | Yes | Other |
| 6 | Depression | m2 | Yes | Other |
| 7 | Edge cracking | m | Yes | Load |
| 8 | Joint reflection cracking | m | Yes | Climate |
| 9 | Lane/shoulder drop-off | m | Yes | Other |
| 10 | Long. and trans. cracking | m | Yes | Climate |
| 11 | Patching | m2 | Yes | Other |
| 12 | Polished aggregate | m2 | No | Other |
| 13 | Potholes | Number | Yes | Load |
| 14 | Railroad crossings | m2 | Yes | Other |
| 15 | Rutting | m2 | Yes | Load |
| 16 | Shoving | m2 | Yes | Other |
| 17 | Slippage cracking | m2 | Yes | Other |
| 18 | Swell | m2 | Yes | Other |
| 19 | Raveling | m2 | Yes | Climate |
| 20 | Weathering | m2 | Yes | Climate |
| IRI and 1L | IRI and 1M | IRI and 1H | IRI and 2L | IRI and 2M | IRI and 2H | |
| Correlation | 0.434 | 0.348 | 0.088 | 0.092 | 0.062 | 0.141 |
| Significance | 0.000 | 0.000 | 0.000 | 0.000 | 0.000 | 0.000 |
| IRI and 3L | IRI and 3M | IRI and 3H | IRI and 5L | IRI and 5M | IRI and 5H | |
| Correlation | 0.092 | 0.224 | 0.073 | 0.155 | 0.230 | 0.225 |
| Significance | 0.000 | 0.000 | 0.000 | 0.000 | 0.000 | 0.000 |
| IRI and 6L | IRI and 6M | IRI and 6H | IRI and 10L | IRI and 10M | IRI and 10H | |
| Correlation | 0.227 | 0.157 | 0.084 | 0.096 | 0.163 | 0.090 |
| Significance | 0.000 | 0.000 | 0.000 | 0.000 | 0.000 | 0.000 |
| IRI and 11L | IRI and 11M | IRI and 11H | IRI and 13L | IRI and 13M | IRI and 13H | |
| Correlation | 0.349 | 0.267 | 0.146 | 0.148 | 0.069 | 0.142 |
| Significance | 0.000 | 0.000 | 0.000 | 0.000 | 0.000 | 0.000 |
| IRI and 15L | IRI and 15M | IRI and 15H | IRI and 19M | IRI and 19H | ||
| Correlation | 0.431 | 0.231 | 0.130 | 0.193 | 0.068 | |
| Significance | 0.000 | 0.000 | 0.000 | 0.000 | 0.000 |
| Basic Functions | Basic Functions |
|---|---|
| BF1 = max(0; 1L − 9.4) | BF35 = max(0; 6M − 1.3333) |
| BF2 = max(0; 9.4 − 1L) | BF36 = max(0; 1.3333 − 6M) |
| BF3 = max(0; 15L − 4.3333) | BF37 = max(0; 10L − 30.0667) |
| BF4 = max(0; 4.3333 − 15L) | BF38 = max(0; 30.0667 − 10L) |
| BF5 = max(0; 11L − 5.9) | BF39 = max(0; 2H) |
| BF6 = max(0; 5.9 − 11L) | BF40 = max(0; 6H) |
| BF7 = max(0; 5H − 2) | BF41 = max(0; 13M) |
| BF8 = max(0; 2 − 5H) | BF42 = max(0; 15M − 20.3333) |
| BF9 = max(0; 3M − 16) | BF43 = max(0; 13H) |
| BF10 = max(0; 16 − 3M) | BF44 = max(0; 1L − 4.6667) |
| BF11 = max(0; 11M − 5) | BF45 = max(0; 19H) |
| BF12 = max(0; 5 − 11M) | BF46 = max(0; 19M − 20) |
| BF13 = max(0; 15M − 7.9) | BF47 = max(0; 2L − 18.8333) |
| BF14 = max(0; 7.9 − 15M) | BF48 = max(0; 5L − 1.5) |
| BF15 = max(0; 1M − 2.6667) | BF49 = max(0; 5L − 5.8333) |
| BF16 = max(0; 2.6667 − 1M) | BF50 = max(0; 15M − 24.8333) |
| BF17 = max(0; 5L − 19.3333) | BF51 = max(0; 1H) |
| BF18 = max(0; 19.3333 − 5L) | BF52 = max(0; 10H) |
| BF19 = max(0; 6L − 7.3333) | BF53 = max(0; 10L − 8.1000) |
| BF20 = max(0; 7.3333 − 6L) | BF54 = max(0; 10L − 46) |
| BF21 = max(0; 5M − 4.1) | BF55 = max(0; 11L − 31.3333) |
| BF22 = max(0; 4.1 − 5M) | BF56 = max(0; 11L − 20.6667) |
| BF23 = max(0; 19M − 35.3333) | BF57 = max(0; 3H) |
| BF24 = max(0; 35.3333 − 19M) | BF58 = max(0; 10L − 38.3333) |
| BF25 = max(0; 11H) | BF59 = max(0; 15L − 21.7333) |
| BF26 = max(0; 2M − 29) | BF60 = max(0; 3L − 7) |
| BF27 = max(0; 29 − 2M) | BF61 = max(0; 15M − 12.1) |
| BF28 = max(0; 3L − 32.3333) | BF62 = max(0; 10M − 11.6) |
| BF29 = max(0; 32.3333 − 3L) | BF63 = max(0; 11.6 − 10M) |
| BF30 = max(0; 13L) | BF64 = max(0; 6L − 4.5) |
| BF31 = max(0; 15H − 1) | BF65 = max(0; 2L − 29.6667) |
| BF32 = max(0; 1 − 15H) | BF66 = max(0; 5L − 10.4) |
| BF33 = max(0; 2L − 4.6667) | BF67 = max(0; 10M − 5) |
| BF34 = max(0; 4.6667 − 2L) |
| Statistical Component | IRI |
|---|---|
| Mean (observed) | 1.855523 |
| Standard deviation (observed) | 0.905978 |
| Mean (predicted) | 1.855523 |
| Standard deviation (predicted) | 0.781759 |
| Mean (residual) | 0.000000 |
| Standard deviation (residual) | 0.457873 |
| R-square | 0.744579 |
| R-square adjusted | 0.739196 |
| Function | Mean | Standard Deviation | Number of Basic Function | Independent Variable |
|---|---|---|---|---|
| 1 | 1.506778 | 3.613975 | 3 | 1L |
| 2 | 0.204866 | 1.427734 | 2 | 1M |
| 3 | 0.007132 | 0.193302 | 1 | 1H |
| 4 | 3.249570 | 8.611857 | 4 | 2L |
| 5 | 0.619575 | 4.944756 | 2 | 2M |
| 6 | 0.048002 | 0.991252 | 1 | 2H |
| 7 | 1.154942 | 6.085346 | 3 | 3L |
| 8 | 0.407284 | 3.433640 | 2 | 3M |
| 9 | 0.009813 | 0.317481 | 1 | 3H |
| 10 | 2.403955 | 5.109487 | 5 | 5L |
| 11 | 0.276196 | 2.159583 | 2 | 5M |
| 12 | 0.156546 | 1.524540 | 2 | 5H |
| 13 | 0.477147 | 1.922288 | 3 | 6L |
| 14 | 0.086636 | 1.009642 | 2 | 6M |
| 15 | 0.005362 | 0.133473 | 1 | 6H |
| 16 | 7.88986 | 12.27248 | 5 | 10L |
| 17 | 0.567759 | 2.820660 | 3 | 10M |
| 18 | 0.028275 | 0.544379 | 1 | 10H |
| 19 | 1.611209 | 6.957987 | 4 | 11L |
| 20 | 0.215023 | 1.824592 | 2 | 11M |
| 21 | 0.028154 | 0.518288 | 1 | 11H |
| 22 | 0.029944 | 0.253386 | 1 | 13L |
| 23 | 0.012038 | 0.157478 | 1 | 13M |
| 24 | 0.019269 | 0.244752 | 1 | 13H |
| 25 | 5.970056 | 7.472103 | 3 | 15L |
| 26 | 1.309388 | 4.257650 | 5 | 15M |
| 27 | 0.085635 | 0.836833 | 2 | 15H |
| 28 | 0.874375 | 5.929459 | 3 | 19M |
| 29 | 0.066029 | 1.260636 | 1 | 19H |
© 2018 by the author. Licensee MDPI, Basel, Switzerland. This article is an open access article distributed under the terms and conditions of the Creative Commons Attribution (CC BY) license (http://creativecommons.org/licenses/by/4.0/).
Share and Cite
Kırbaş, U. IRI Sensitivity to the Influence of Surface Distress on Flexible Pavements. Coatings 2018, 8, 271. https://doi.org/10.3390/coatings8080271
Kırbaş U. IRI Sensitivity to the Influence of Surface Distress on Flexible Pavements. Coatings. 2018; 8(8):271. https://doi.org/10.3390/coatings8080271
Chicago/Turabian StyleKırbaş, Ufuk. 2018. "IRI Sensitivity to the Influence of Surface Distress on Flexible Pavements" Coatings 8, no. 8: 271. https://doi.org/10.3390/coatings8080271
APA StyleKırbaş, U. (2018). IRI Sensitivity to the Influence of Surface Distress on Flexible Pavements. Coatings, 8(8), 271. https://doi.org/10.3390/coatings8080271