Article

Universality of Droplet Impingement: Low-to-High Viscosities and Surface Tensions

by
Yukihiro Yonemoto
1,* and
Tomoaki Kunugi
2
1
Advanced Thermal and Fluid Energy System, Division of Industrial Fundamentals, Faculty of Advanced Science and Technology, Kumamoto University, 2-39-1, Kurokami, Chuo-ku, Kumamoto-shi, Kumamoto 860-8555, Japan
2
Department of Nuclear Engineering, Kyoto University, C3-d2S06, Kyoto Daigaku-Katsura, Nishikyo-ku, Kyoto 615-8540, Japan
*
Author to whom correspondence should be addressed.
Coatings 2018, 8(11), 409; https://doi.org/10.3390/coatings8110409
Submission received: 15 October 2018 / Revised: 9 November 2018 / Accepted: 13 November 2018 / Published: 19 November 2018

Abstract

:
When a droplet impinges on a solid surface, its kinetic energy is mainly converted to capillary energy and viscous dissipation energy, the ratio of which depends on the wettability of the target surface and the liquid properties. Currently, there is no experimental or theoretical evidence that suggests which types of liquids exhibit the capillary energy-dominated impingement behavior. In this paper, we reported the droplet impingement behavior for a wide range of liquid viscosities, surface tensions and target surface wettabilities. Then, we showed that a recently developed energy balance equation for the droplet impingement behavior can be universally employed for predicting the maximum spreading contact area diameter of a droplet for Newtonian liquids in deposition process by modelling the droplet surface deformation. Subsequently, applicability limitations of recent existing models are discussed. The newly developed model demonstrated that the capillary energy-dominated impingement behavior can be observed at considerably low viscosities of liquid droplets such as that of the superfluid of liquid helium.

1. Introduction

Impingement of droplets on solid surfaces is a key physical factor in combustion, coating processes, inkjet printing, and spray cooling [1,2]. After the impingement of the droplets, characteristic behaviors, such as deposition, fingering, rebounding and splashing, are observed [3,4,5]. In particular, the deposition and subsequent spreading without forming a crown shape is a basic behavior of droplet impingement on solid surfaces. Theoretical, empirical, and semi-empirical relations that describe this process have been proposed in previous research [6,7,8,9,10,11,12,13,14,15,16,17,18,19,20,21] to predict the maximum spreading factor βm, defined as the ratio dmax/d0, where dmax is the maximum spreading diameter and d0 is the initial droplet diameter. Correlations between βm, Weber number We (=ρlu2d0lg, where ρl, u, d0, and σlg represent the liquid density, impinging velocity, initial droplet diameter, and surface energy density of the liquid, respectively) and Reynolds number Re (=ρlud0l, where μl is the viscosity of the liquid) are mainly discussed considering the balance between the inertia, viscosity, and capillary effects [3,8,9,22,23,24]. However, it is important to note that the parameter dmax in the existing models is not necessarily equivalent to the contact area diameter. Rather, dmax in most existing models is defined as the distance between the top of both sides of the free surface at the maximum expansion, and thus, dmax is the maximum diameter of the contact area only if the position of the droplet’s side surface does not exceed the position of the contact line. In the existing models, two definitions for βm are mixed. This increases the difficulty of accurately modelling adhesion energy in the spreading process. In the spreading process, effect of the adhesion is calculated from surface tension in the horizontal direction at the contact line as follows: σlg(1 − cosθ). Recent studies have reported the effect and importance of the vertical component of the surface tension (σlgsinθ) on the wetting phenomena [25,26,27,28,29]. This factor has long been neglected because of the resistance of the solid surface [30]. For droplet impingement, the vertical component is a key factor for predicting the spreading contact area precisely. Recently, we derived an energy balance equation that includes the vertical component of the surface tension [31]. From the previously derived model, two limiting solutions were obtained for the ratio between the maximum contact area diameter dm and the initial droplet diameter d0, βm ≈ We1/2 and βm ≈ Re1/5. The scaling of βm ≈ Re1/5 is theoretically certified in the case of the impingement behavior of high-viscosity liquid droplets [31]. However, there is no available experimental data [32] to support the solution βm ≈ We1/2. In recent numerical simulation [33], the droplet impingement behavior over a wide range of We numbers was investigated using the phase field method, assuming a constant friction factor that depends on the kinds of liquid and solid materials. Finally, the new scaling law βm ≈ (μlRe/μf)1/2 is proposed. In the present study, we report the behavior of droplet impingement covering a wide range of liquid viscosities, surface tensions, and target surface wettabilities for superhydrophilic (SHPi), silicone rubber (SR), polycarbonate (PC), and superhydrophobic (SHPo) substrates, including the existing experimental data for a superamphiphobic substrate. As shown in this paper, our modified model can be universally used to predict the maximum spreading contact area diameter unlike other existing models. In particular, our model shows that constant parameters appearing in some previous models [15,17,33] are not actually constant. The limits of applicability for recent existing models are discussed. This paper also reports an analytical result of the wetting behavior of low-viscosity liquid droplets, such as liquid helium. This modified model demonstrates that the impingement behavior of a superfluid will exhibit the scaling relation of βm ≈ We1/2.

2. Experiment

In the experiments with droplets, purified water (Wako Pure Chemical Industries, Ltd., Osaka, Japan; ρl = 998.2 kg m−3, μl = 10−3 Pa s and σlg = 72.8 × 10⁻³ N·m−1), pure ethanol (Kenei Pharmaceutical Co., Ltd., Osaka, Japan; purity = 99.5%, ρl = 789.2 kg m−3, μl = 1.2 × 10⁻³ Pa s and σlg = 21.1 × 10⁻³ N·m−1) and two types of silicon oils (Shin-Etsu Chemical Co., Ltd., Tokyo, Japan; ρl = 968.3 and 967.1 kg m−3, μl = 0.306 and 3.062 Pa s and σlg = 21.1 × 10⁻³ and 21.3 × 10⁻³ N·m−1, respectively) were used. The solids studied herein were as follows: a superhydrophilic (SHPi) substrate (3M Japan Ltd., Tokyo, Japan), polycarbonate (PC; Sumitomo Bakelite Co., Ltd., Tokyo, Japan), silicone rubber (SR; AS ONE Corporation, Osaka, Japan) and a superhydrophobic (SHPo) substrate (Toyo Aluminium K.K., Osaka, Japan). We used 3MTM ScotchitintTM and aluminum tape from Toyal Lotus® (the so-called ‘lotus-effect’ tape) as superhydrophilic and superhydrophobic substrates, respectively. The wettability properties of the solid substrates are evaluated by measuring contact angle hysteresis (CAH) of θre − θad [34]. The value of CAH is obtained using the tilted plane method (sliding droplet) with purified water on each solid substrate [35]. The values of CAH for SHPi, PC, SR, and SHPo are 2.0° ± 0.3° (two standard deviation (2 SD)), 25.4° ± 3.2° (2 SD), 17.9° ± 6.0° (2 SD), and 11.3° ± 2.6° (2 SD), respectively. Here, for the case of SHPi, rear contact line adheres to the solid substrate and does not move. Therefore, the value of CAH is evaluated using the value of θre − θad when the front contact line begins moving. For the case of the superamphiphobic substrate, we referred to the results a previous study [36]. The droplet was released from various heights using a microsyringe. We assumed that the droplet was in free fall in our experiments. The droplet volumes were in range 1.1–31.6 μL. Images of the droplet behavior after impacting on the solid surfaces were captured using a high-speed video camera (HX-5; NAC Image Technology, Ltd., Tokyo, Japan). From these images, u, d0, and dm were measured. Here, dm is the measured value of the maximum contact area diameter. In the experiments, the temperature and humidity were in the ranges 21.0–23.0 °C and 51.0%–55.0%, respectively.

3. Prediction of Maximum Spreading Contact Area Diameter

In our model [31], the relationship between βm, Re, and We for each release condition of a droplet is calculated using the following energy balance equation:
We 3 + 4 + 2 3 ρ l g r 0 h m σ lg = 27 16 r 0 2 h m 2 β m We Re + ( 1 cos θ ¯ ) β m 2 h m r 0 β m sin θ ¯ + S def π r 0 2
In this equation, θ ¯ is the averaged contact angle (°) of the static contact angle θst and contact angle at maximum spreading θm. βm is the ratio between the maximum contact area diameter dm and the initial droplet diameter d0. hm is the droplet height. The subscript m indicates that the contact diameter reaches the maximum diameter. In an actual situation, the droplet is not strictly at equilibrium. Therefore, a value of a contact angle obtained via the sessile droplet experiment (apparent static contact angle) is used for θst. With respect to the values of θm, the measured values are used in Equation (1). However, the values of θm for each solid substrates are quite constant over the impingement velocities even if the droplet volume changes: θm = 128.2° ± 6.3°(2 SD) for water on SR, 161° ± 2.7°(2 SD) for water on SHPo, 44.8° ± 4.4°(2 SD) for water on SHPi, 66.4° ± 6.4°(2 SD) for ethanol on SR, 139.1° ± 11.8° (2 SD) for Oil 300 cs on SR, and 148.1° ± 12.3°(2 SD) for Oil 3000 cs on SR. A similar tendency was also reported by Lee et al. (2016) [23]. In Equation (1), the first, second, and third terms on the left-hand side represent the non-dimensional kinetic energy Ekine, the non-dimensional initial surface energy Esurf and the non-dimensional gravitational potential energy Egrav, respectively. On the right-hand side of Equation (1), the first and fourth terms represent the non-dimensional viscous dissipation energy Evis and the non-dimensional deformed surface energy Edef, respectively. The second and third terms represent the non-dimensional adhesion energy Esprd. In the present study, some existing models (see the Appendix A; the equations in the Appendix are expressed as Equations (A1) and (A2), etc., in the main text) are also used for the comparison of the experimental data, although the parameter dmax in the existing models is not necessarily defined as the value of the contact area diameter.

4. Result and Discussion

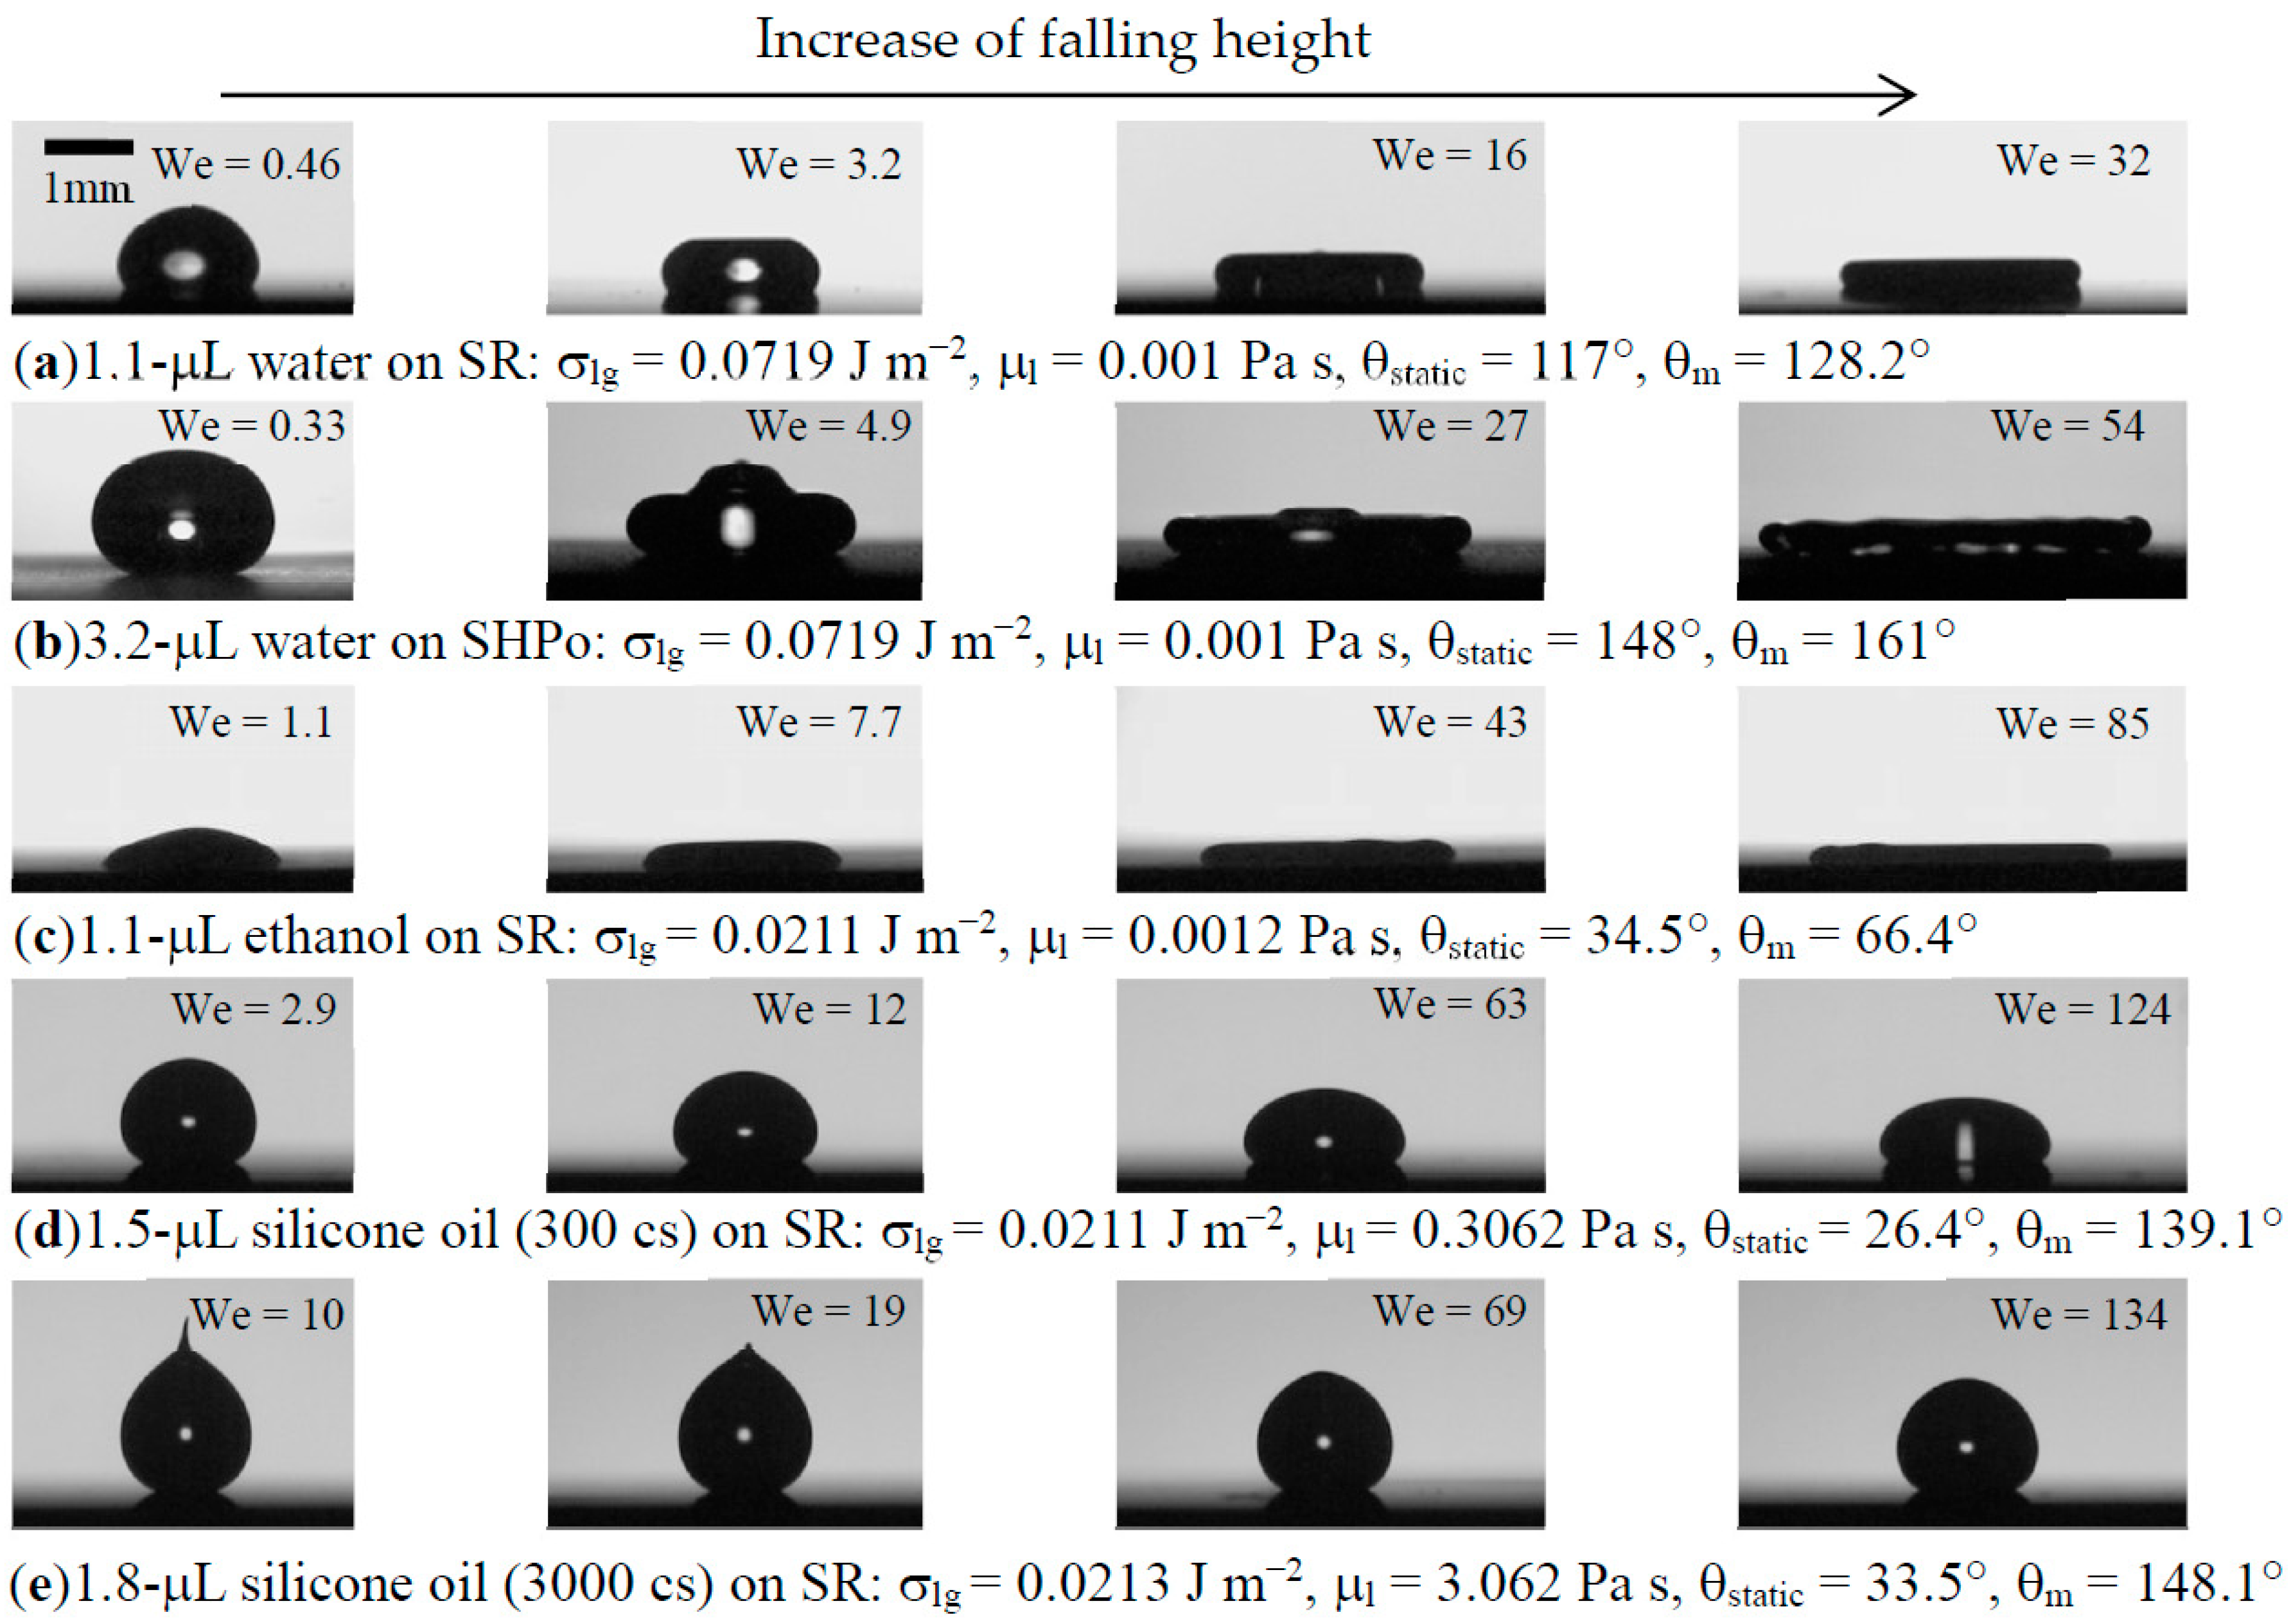
The images of the maximum spreading of droplets for water, ethanol, and silicone oils on solid substrates are shown in Figure 1. We observed that the contact angles at maximum spreading (θm) for the high-viscosity liquid were considerably large in value in comparison with the static contact angles for the low-viscosity liquids. Additionally, the shape of the droplet near the contact line was almost similar to that observed in the hydrophobic case (Figure 1a,b) rather than that observed in the hydrophilic case (Figure 1c). The high-viscosity liquid exhibited a specific behavior: the contact angle was obtuse at maximum spreading even when the static contact angle was small (corresponding to the hydrophilic case), e.g. θm
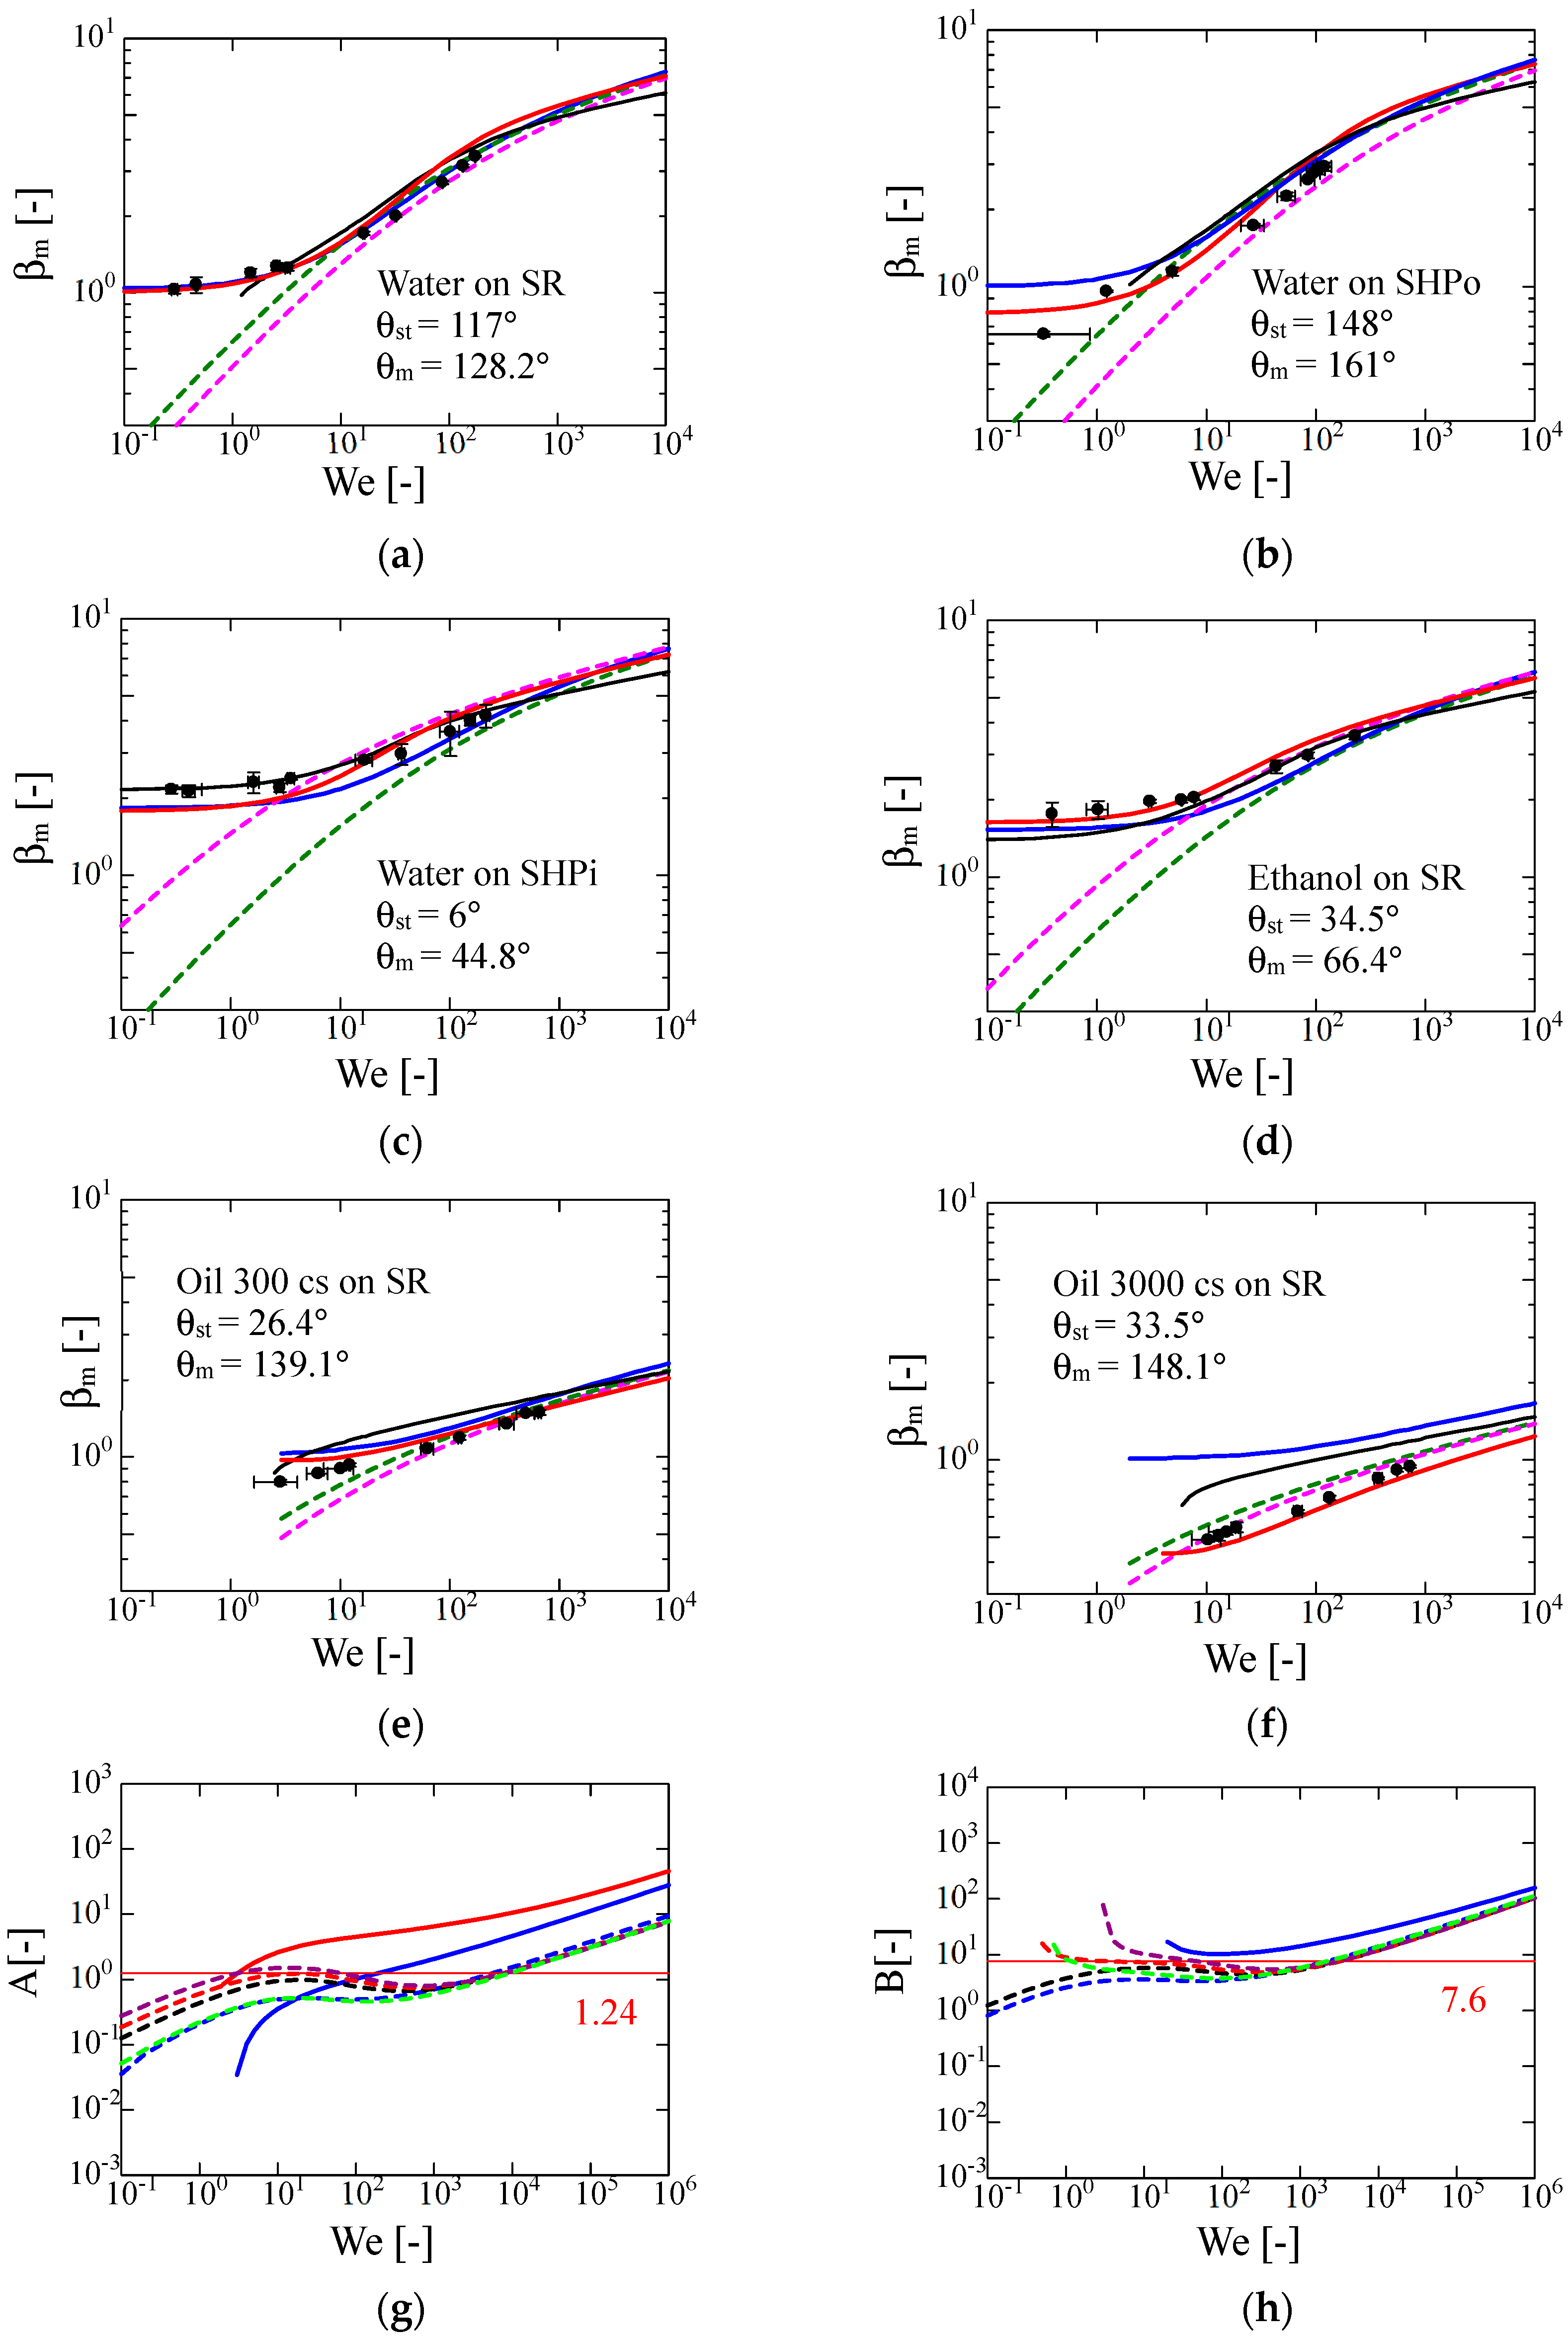
st = 4.4 for the silicone differential oil o3000 cs (hereinafter referred to as ‘Oil 3000 cs’) on SR, 1.1 for water on SR, and 1.9 for ethanol on SR. The relationships between βm and We for each different liquid on different surfaces are shown in Figure 2. Some existing models are compared with the experimental data. In our model, the surface deformation term in Equation (1) is modelled based on the experimental evidence of the specific behavior for a high-viscosity liquid as:
S def = f ( θ ¯ ) S harm + ( 1 f ( θ ¯ ) ) S disc
where Sharm is the harmonic average of the surface areas for a spherical cap (Ssph) and disc shape (Sdisc) [31]. f( θ ¯ ) is defined as:
f ( θ ¯ ) = 1 + cos θ ¯ 2 . 0 f ( θ ¯ ) 1
Equation (2) indicates that the surface deformation of the droplet is mainly dependent on θ ¯ . Though the focus of this study is on the deposition process from the initiation of contact to the end of the spreading phase, the evaluation of surface deformation is important in analysing the rebound behavior of a droplet falling onto a superhydrophobic substrate. After reaching the maximum spreading diameter, the diameter of a droplet on a superhydrophobic substrate will retract. The surface deformation (Equation (2)) is relevant to the detailed consideration of this retraction process because the energy driving the retraction is supplied by the surface deformation. However, whether the droplet will rebound depends on the gravitational potential energy, adhesion energy, and viscous dissipation caused by fluid motion.
Figure 2 shows the relationship between βm and We for the low- and high-viscosity liquids. In Figure 2a–f, the red, blue and black solid lines represent the results obtained using our model (Equations (1) and (2)), the model proposed by Lee et al. [17] (Equations (A3)) and the model proposed by Huang et al. (Equation (A9)), respectively. The green and pink dashed lines represent the results obtained using the model proposed by Laan et al. (Equation (A1)) and those obtained using the model proposed by Zhang et al. [16] (Equations (A1) and (A2)), respectively. In Figure 2g,h, the fitting parameters of A in Equation (A1) and B in Equation (A3) are evaluated using our model. The red solid horizontal lines of 1.24 and 7.6 in each figure are the values of A and B used in the original models. The red and blue solid lines in each figure represent the values of A and B, respectively, for the cases of Oil 3000 cs and Oil 300 cs, respectively. The red, black, blue, purple, and light green dashed lines correspond to the values of water on SR, water on PC, ethanol on SR, water on SHPo, and water on SHPi, respectively. From Figure 2, we found that the model proposed by Lee et al. (Equation (A3)) [17] and our model [31] with the use of Equation (2) both showed good agreement with the experimental data.
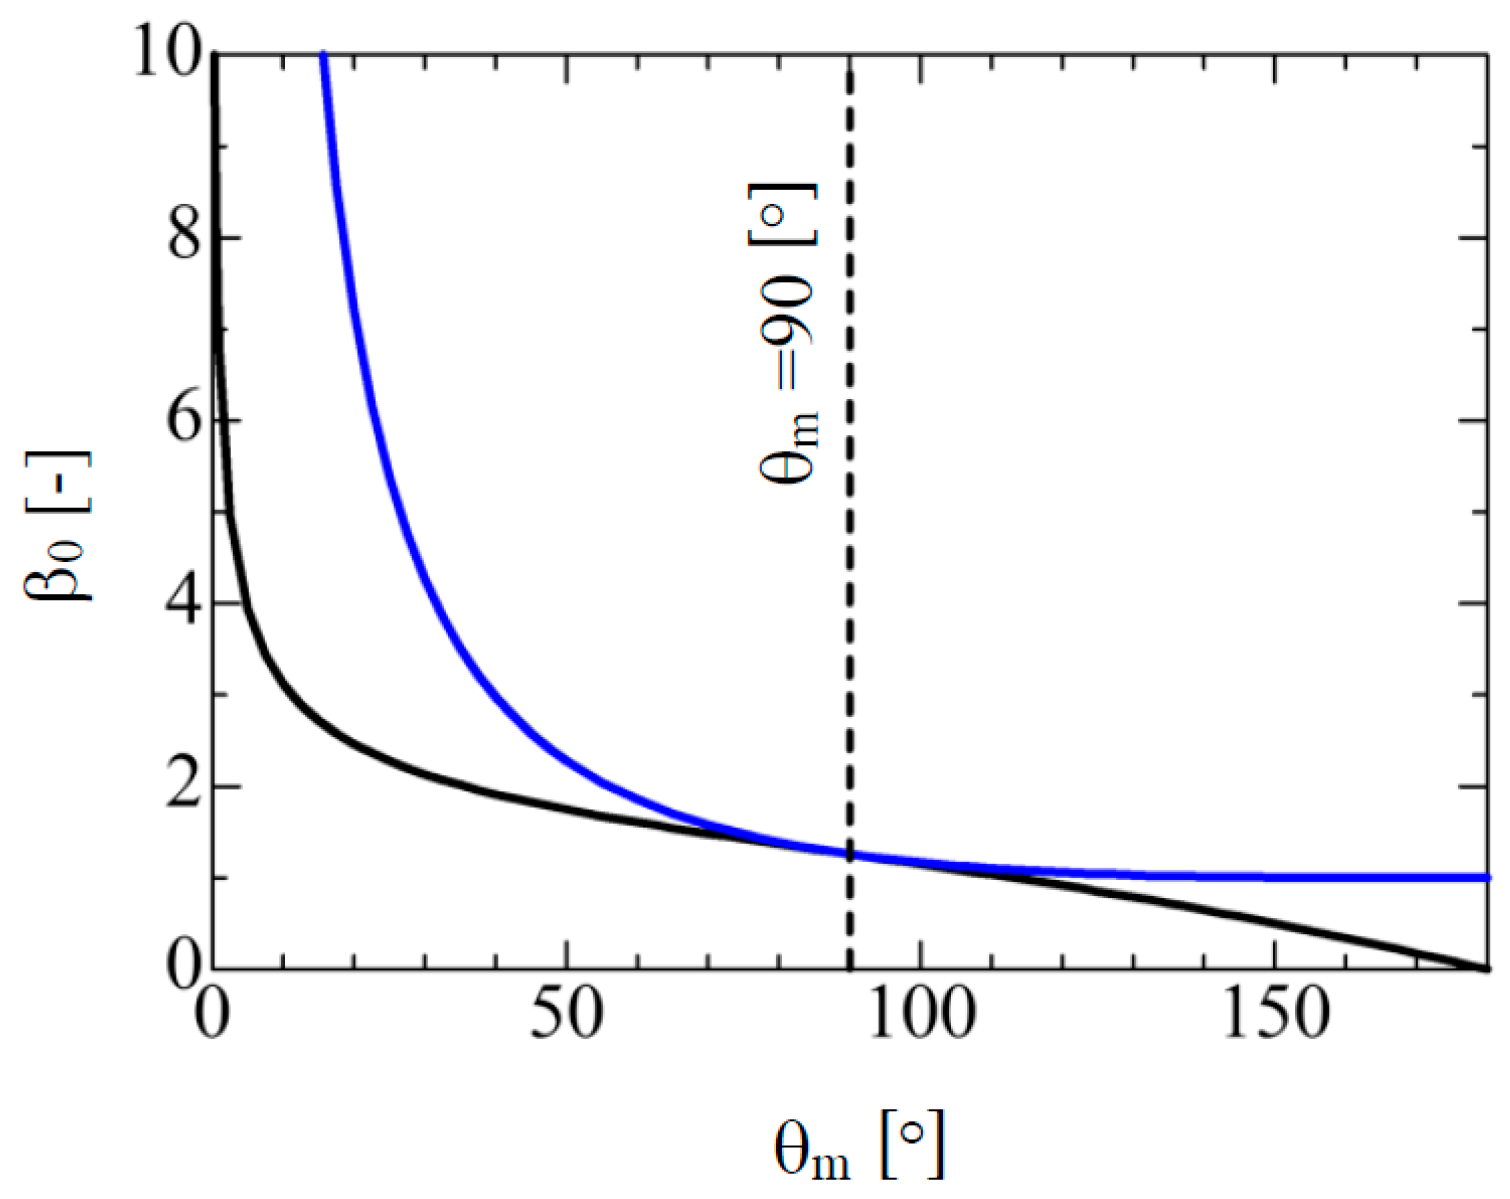
However, for the high-viscosity liquid (Oil 3000 cs), Equation (A3) deviated from the experimental data. This deviation originated from the concept of Equation (A3): the value of β0 in β m 2 β 0 2 = f ( Re ,   We ) is analytically evaluated. Strictly, the high-viscosity liquid under the conditions βm < 1 and θm > 90°cannot be expressed by this model because β0 approaches 1 as θm approaches 180° as shown in Figure 3, which means that the lower limit of βm = 1 exists. In addition, the fitting parameters A and B used in Equations (A1) and (A3), respectively, are not constant (see Figure 2g,h). Actually, in the case of Oil 3000 cs, parameter B cannot be calculated because β m 2 β 0 2 is negative, thereby yielding an imaginary number in the numerator of β m 2 β 0 2 / Re 1 / 5 in Equation (A3). Such negative values can appear in some other cases. Notably, in 
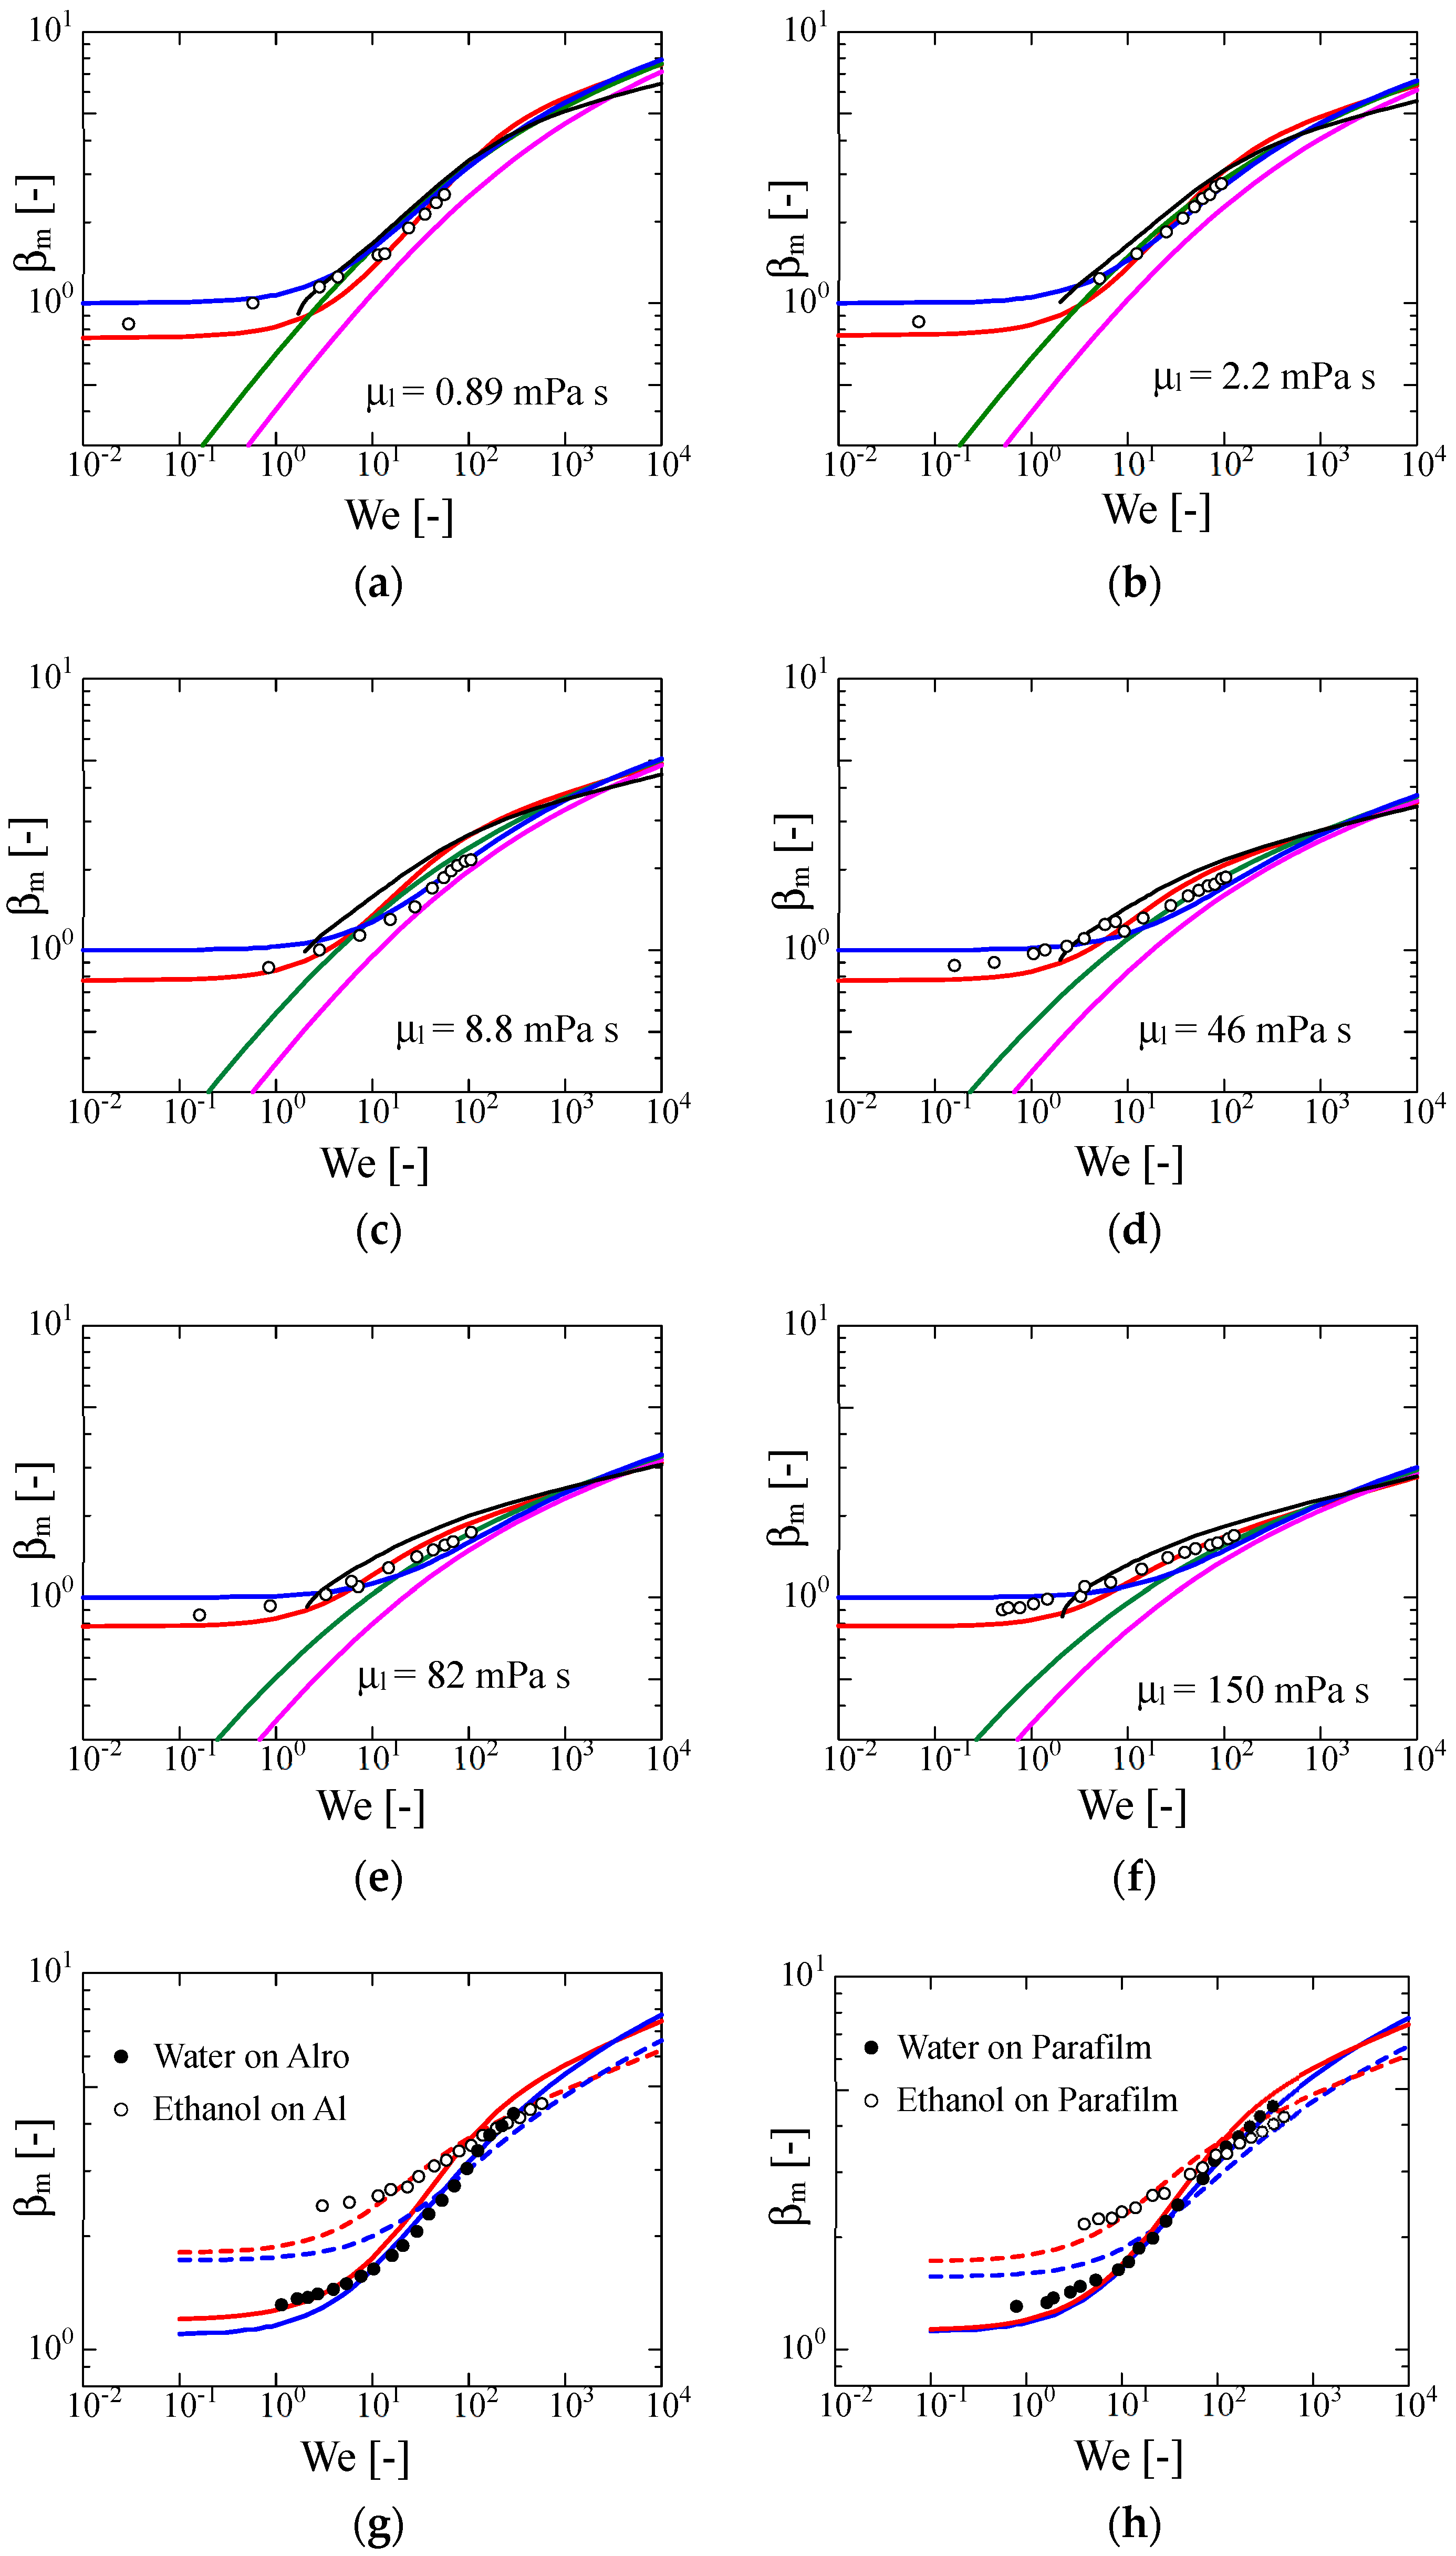
Figure 2b, the droplets in all cases rebounded after the maximum spreading diameter was reached. Here, the comparison of our model with other existing experimental data for the case of glycerol–water mixtures on superamphiphobic surfaces [36] (Figure 4a–f), ethanol and water on some different substrates, such as aluminum plate roughened by sand paper (Alro), as well as aluminum and parafilm [23] (Figure 4g,h) are performed. In the literature [36], the maximum spreading diameter (dmax) is defined by a distance between the top of both sides of free surface: dc is defined as the maximum spreading contact area diameter in the literature. Therefore, we calibrated the extracted value using dc ≈ 0.77dmax from the image reported in the literature [36]. This value of dc is used herein. Figure 4 shows the relationship between βm and We for some existing data of low-to-high viscosities for glycerol–water mixtures [36] (Figure 4a–f), and the ethanol and water on Alro (rough) and Al, and parafilm [23] (Figure 4g,h). In Figure 4a–f, the red, green, pink, blue, and black solid lines represent the results calculated by our model (Equations (1) and (2)), the model proposed by Zhang et al. [16] (Equations (A1) and (A2)), the model proposed by Lee et al. [17] (Equation (A3)) and the model proposed by Huang et al. [24] (Equation (A9)), respectively. In Figure 4g,h, the red and blue lines represent the results calculated using our model (Equations (1) and (2)) and the model proposed by Lee et al. [17] (Equation (A3)), respectively. The dashed and solid lines denote the results obtained for ethanol and water, respectively. From Figure 4, we observed that our model (Equations (1) and (2)) and that proposed by Lee et al. (Equation (A3)) show good agreement with the experimental results at a glance. However, the model proposed by Lee et al. does not catch the trend of the experimental data in the low-We region as the liquid viscosity of the glycerol–water mixture cases increases because this model potentially has a lower limit, i.e., βm ≈1. Then, the data for the ethanol droplets on Al and parafilm deviate from the calculated results obtained from Equation (A3), as shown in Figure 4g,h. Equation (A4) are developed based on a spherical cap droplet, which means that deviation may occur in the case of impingement of a low surface tension droplet, because the dynamic contact angle is not necessarily small.
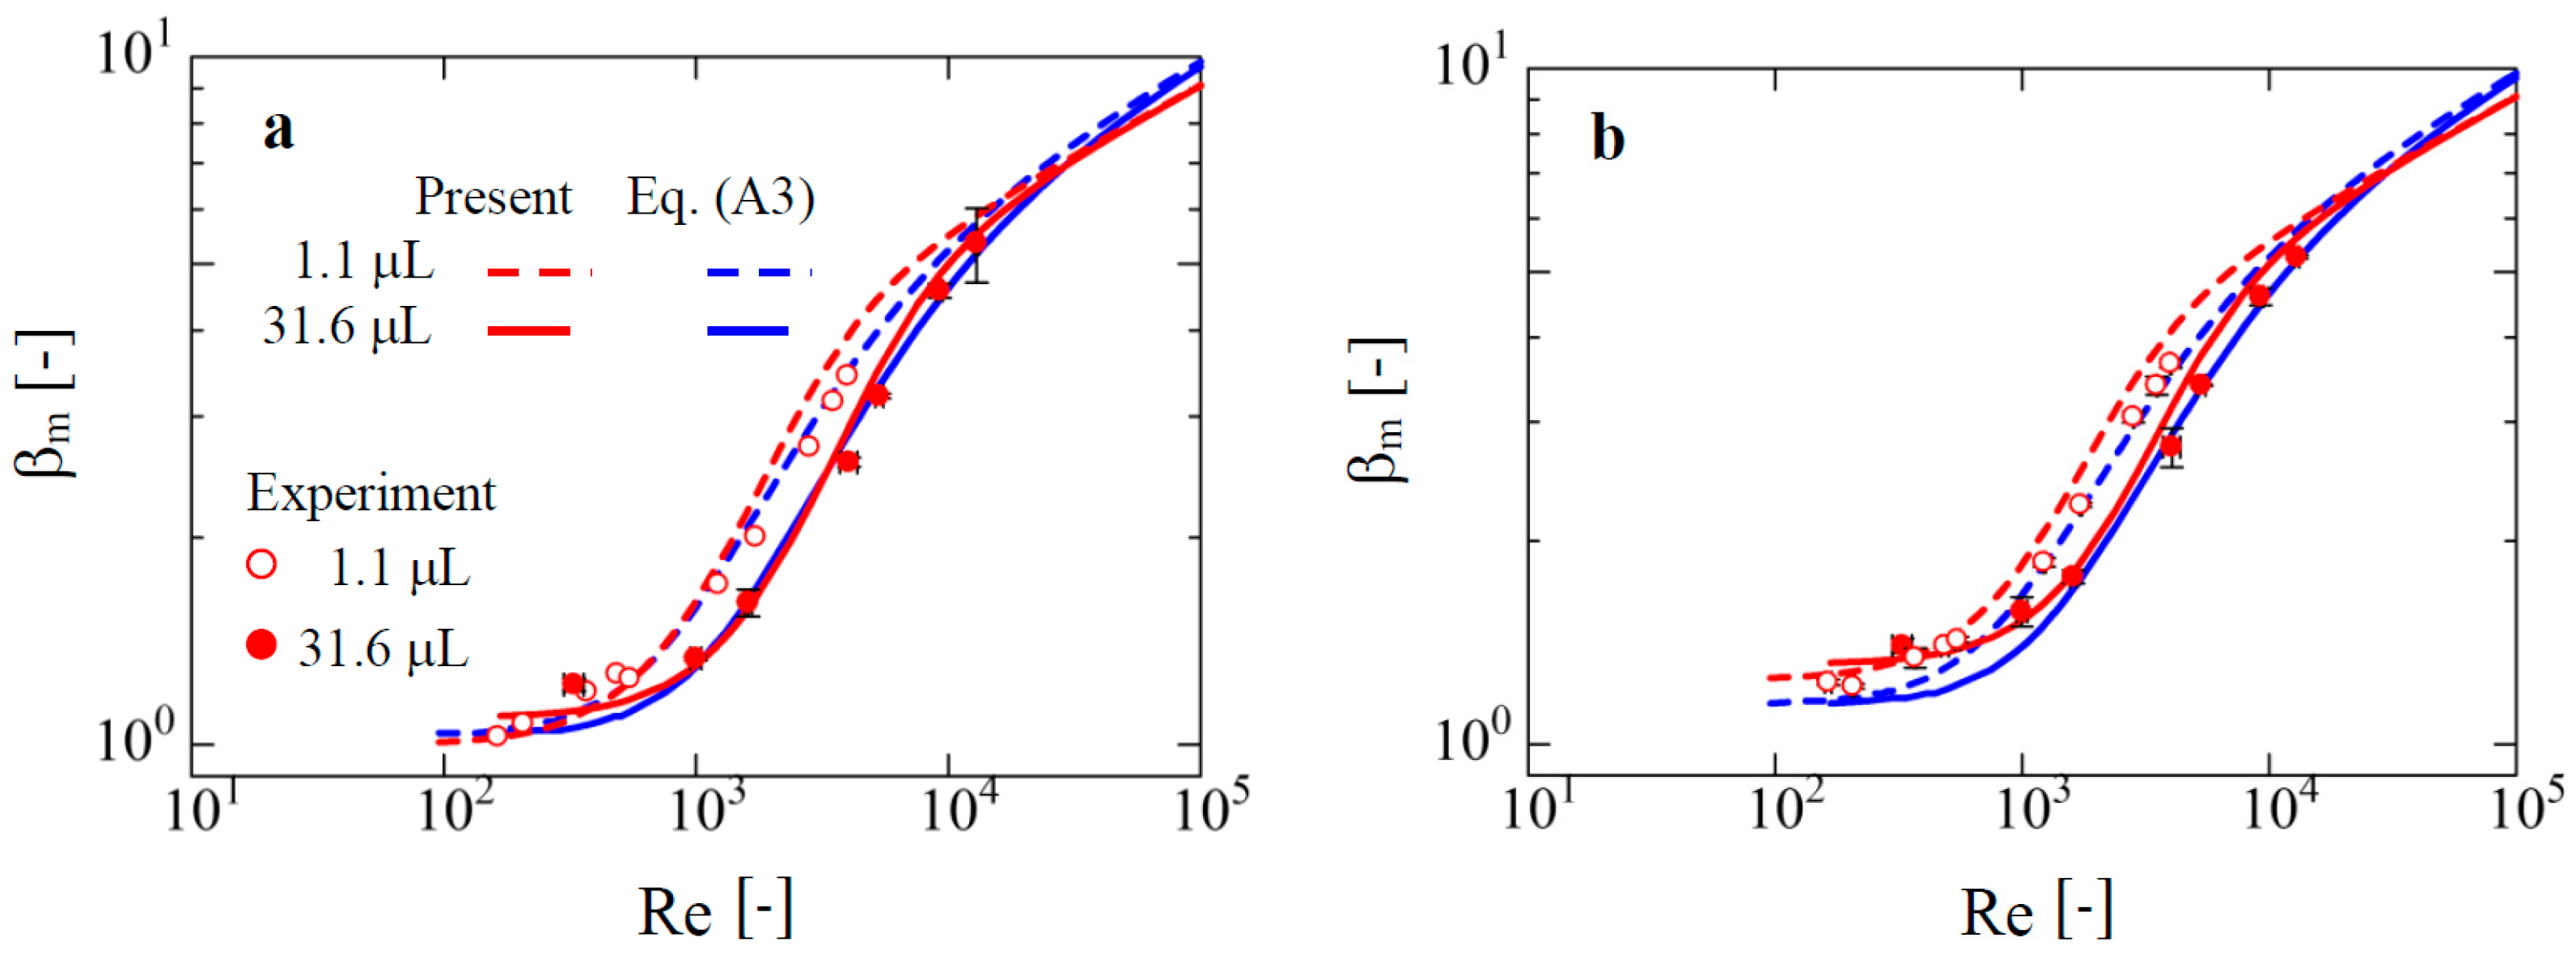
Figure 5 shows the relation between βm and Re for a purified water droplet with different volumes on SR and PC substrates. The experimental data are compared with our model and Equation (A3). The dashed and solid lines in both figures refer to the volumes of 1.1 μL and 31.6 μL, respectively. The red and blue lines represent the results evaluated by Equations (1) and (A3), respectively. From this figure, our model shows good agreement with the experimental data for ranges from low to high Re number. This may be because volume effects, such as gravitational potential, are included in Equation (1).
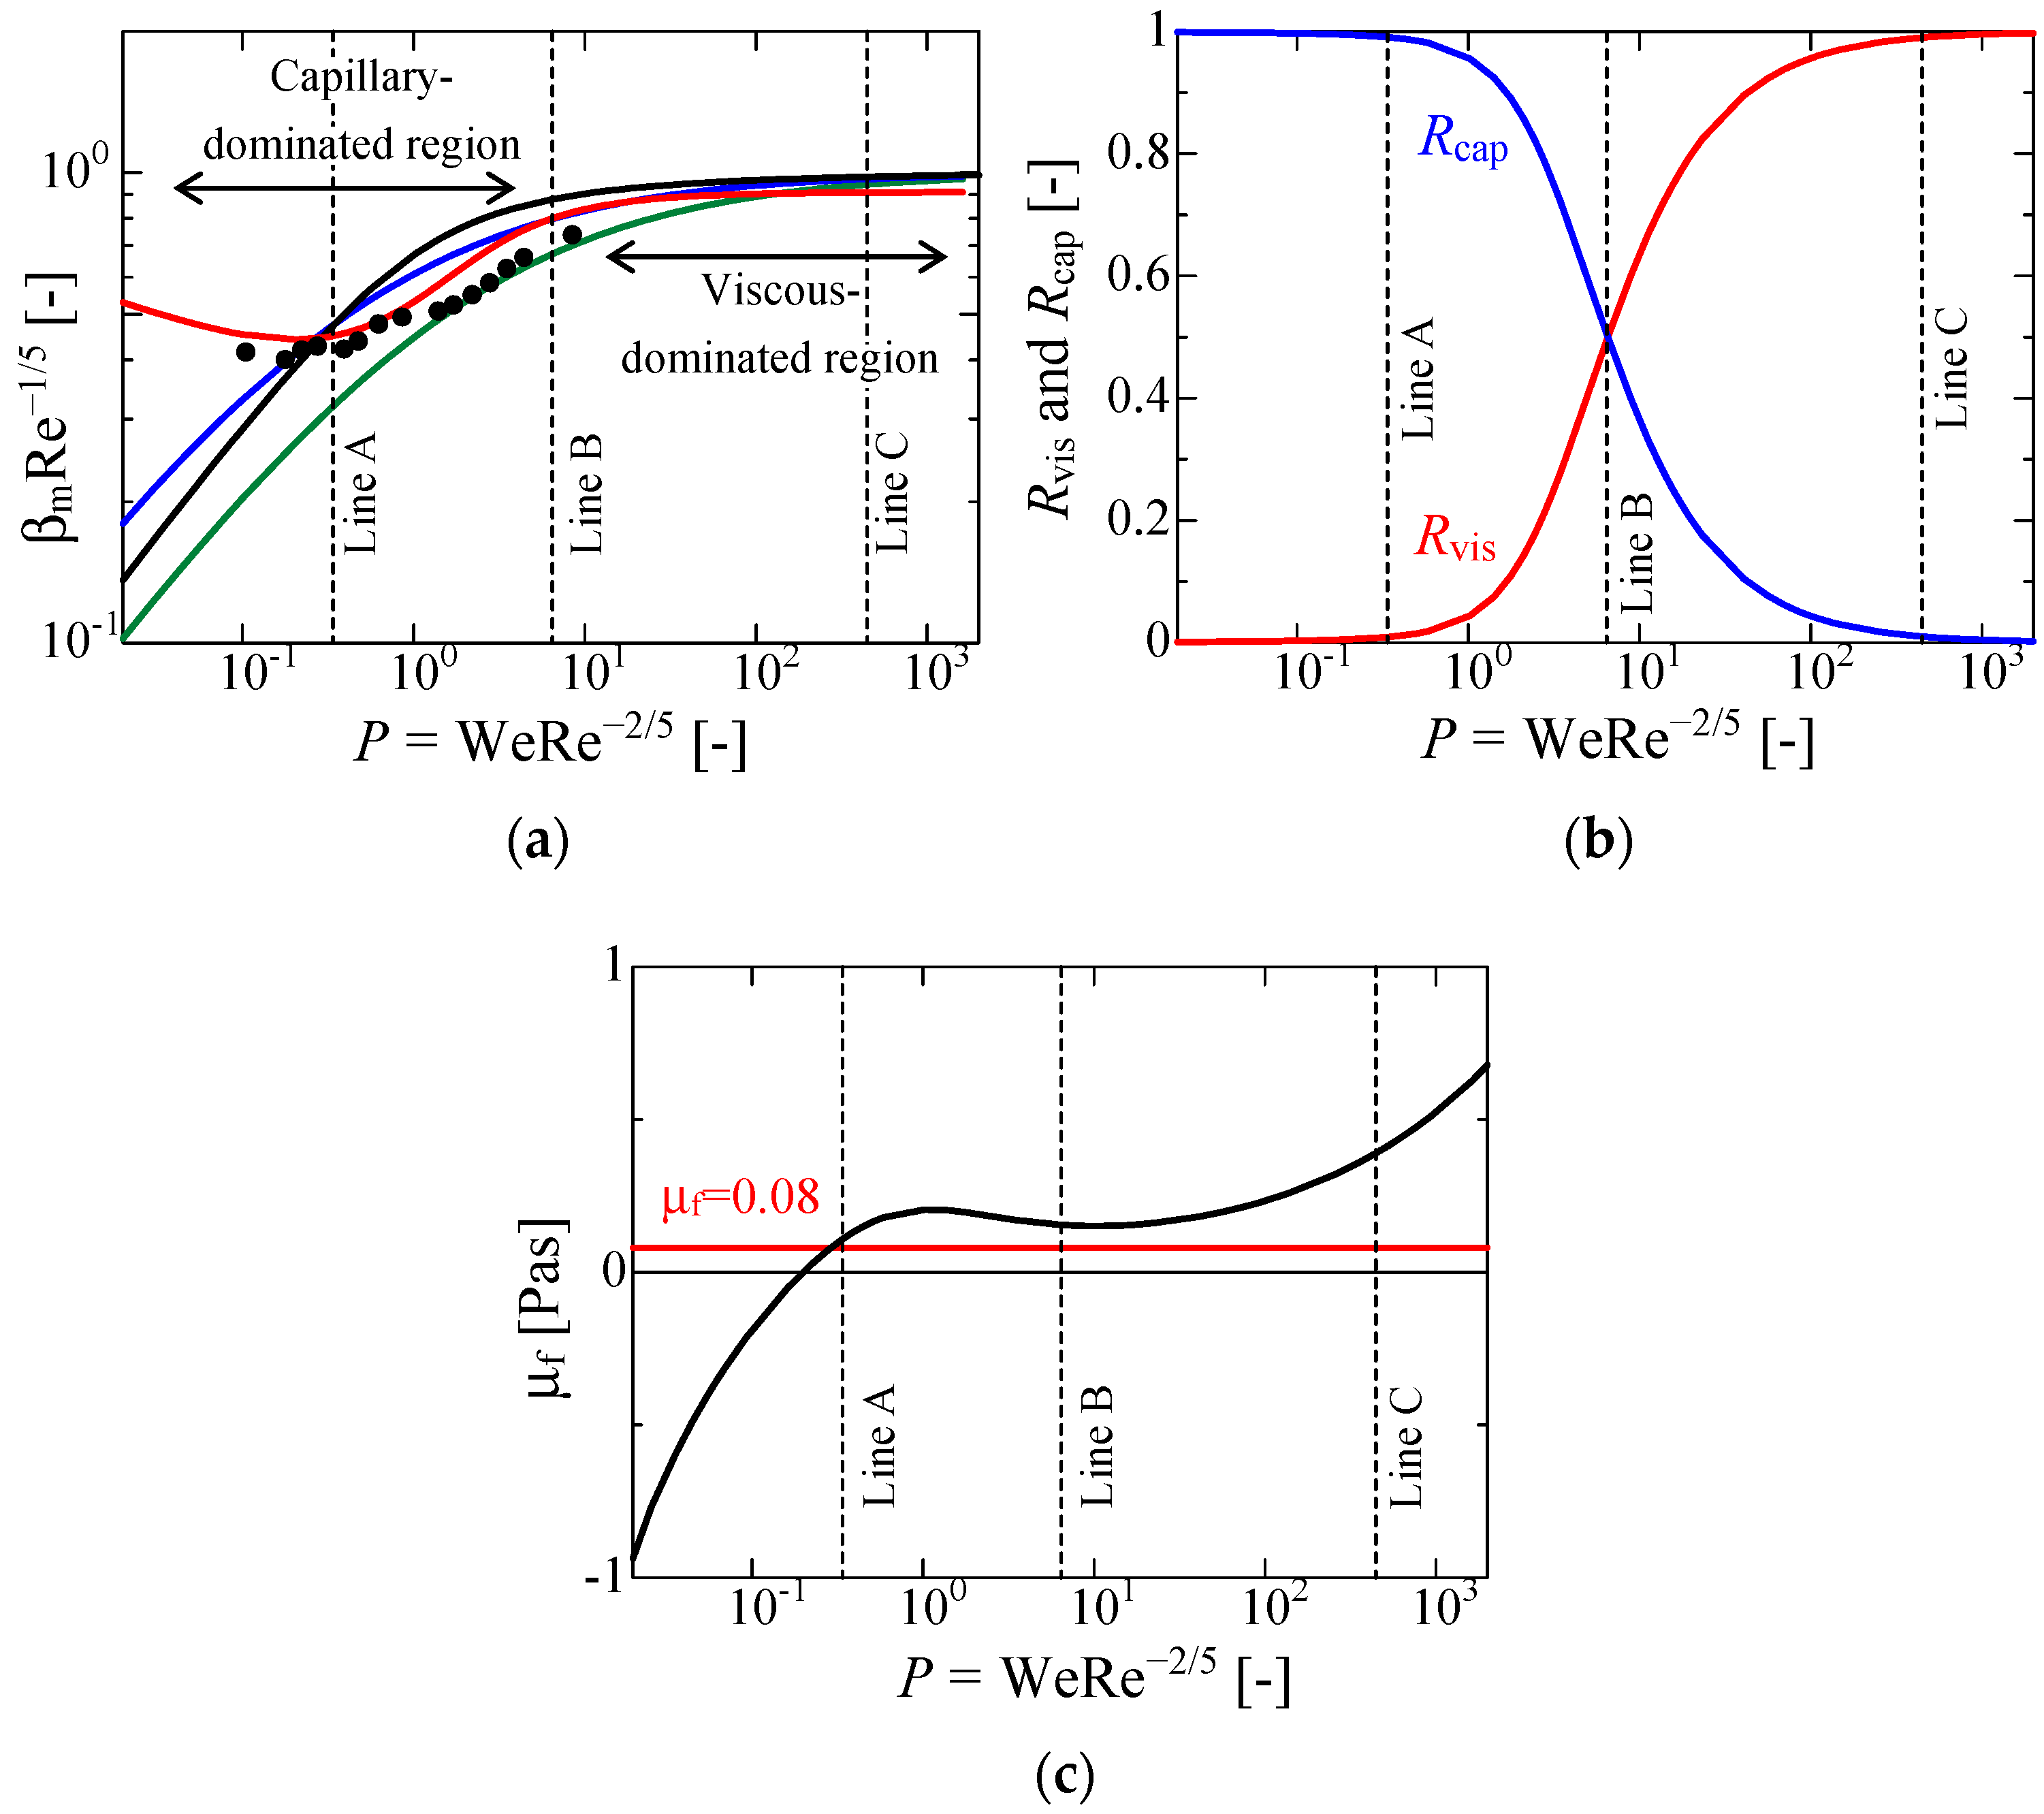
Figure 6a shows the relationship between βmRe−1/5 and the impact number P (=WeRe−2/5) of a water droplet (4.1 μL) on aluminum with a smooth surface (Alsm); the data are extracted from the literature [23]. In Figure 6b, the energy transition for this case is depicted. Rvis and Rcap represent the non-dimensional viscous dissipation Evis and the non-dimensional capillary energy Ecap = Esprd + Edef, respectively, normalised by the non-dimensional initial impact energy Eini = Ekine + Esurf + Egrav in the following equations:
R cap = [ ( 1 cos θ ¯ ) β m 2 h m r 0 β m sin θ ¯ + S def π r 0 2 ] / ( We 3 + 4 + 2 3 ρ l g r 0 h m σ lg )
R vis = ( 27 16 r 0 2 h m 2 β m We Re ) / ( We 3 + 4 + 2 3 ρ l g r 0 h m σ lg )
The lines A and C indicate that 99% of the initial impact energy is converted into Evis and Ecap, respectively. The line B shows that the Eini value is equally converted into Evis and Ecap. The intersection of the two lines gives a transition point clearer than that given by the previous definition of Er = Evis/Esprd [31]. From Figure 6a, in the low-impact number region where the capillary effect becomes dominant (Figure 6b), we observed that the experimental data deviate from the green solid line (Equation (A1)). This model is developed based on the numerical results proposed by Eggers et al. [2], where the effect of wettability on the spreading behavior was almost not considered because the contact angle was set to be constant (θ = 180°). In addition, the derivations of the scalings for βm ≈ We1/2 and βm ≈ Re
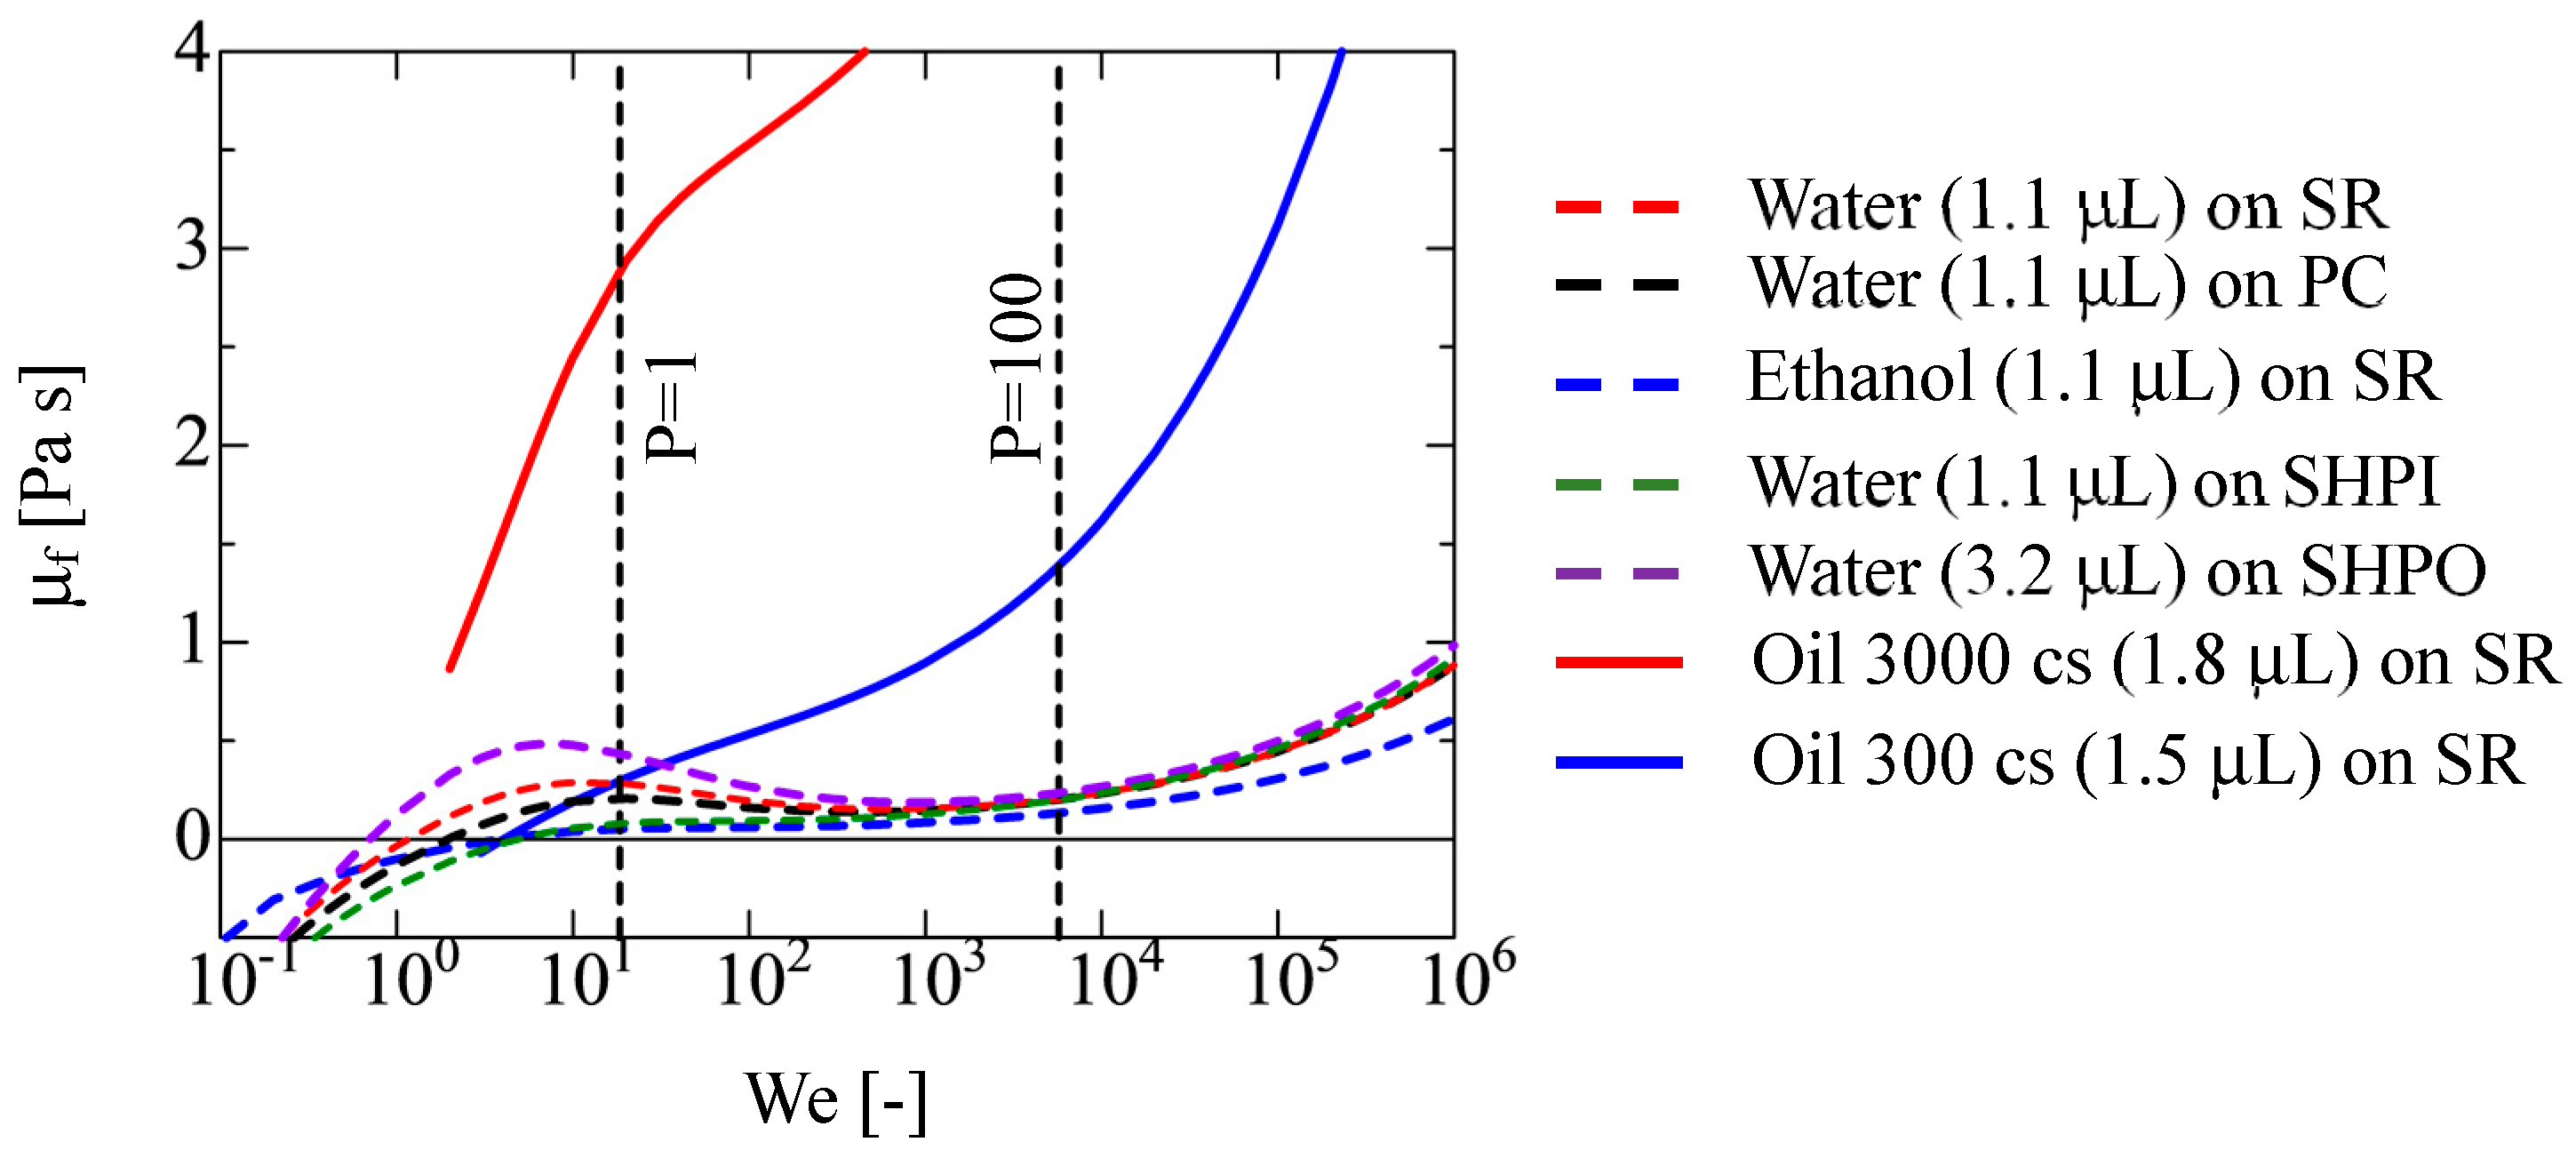
1/5 were made via order estimation. Recently, Wang et al. simulated the droplet impingement behavior with a phase field method considering the friction factor μf, which controls the contact line velocity [33]. In the simulation, the same result of the deviation from Equation (A1) was reported (Figure 6a). This supports the validity of our model. However, our model indicates that the value of μf, calculated from Equation (A5), is not constant and takes a negative value in the low-P region as shown in Figure 7. This indicates that the validity of Equation (A5) is disputable because the equation is derived by rough order estimation.
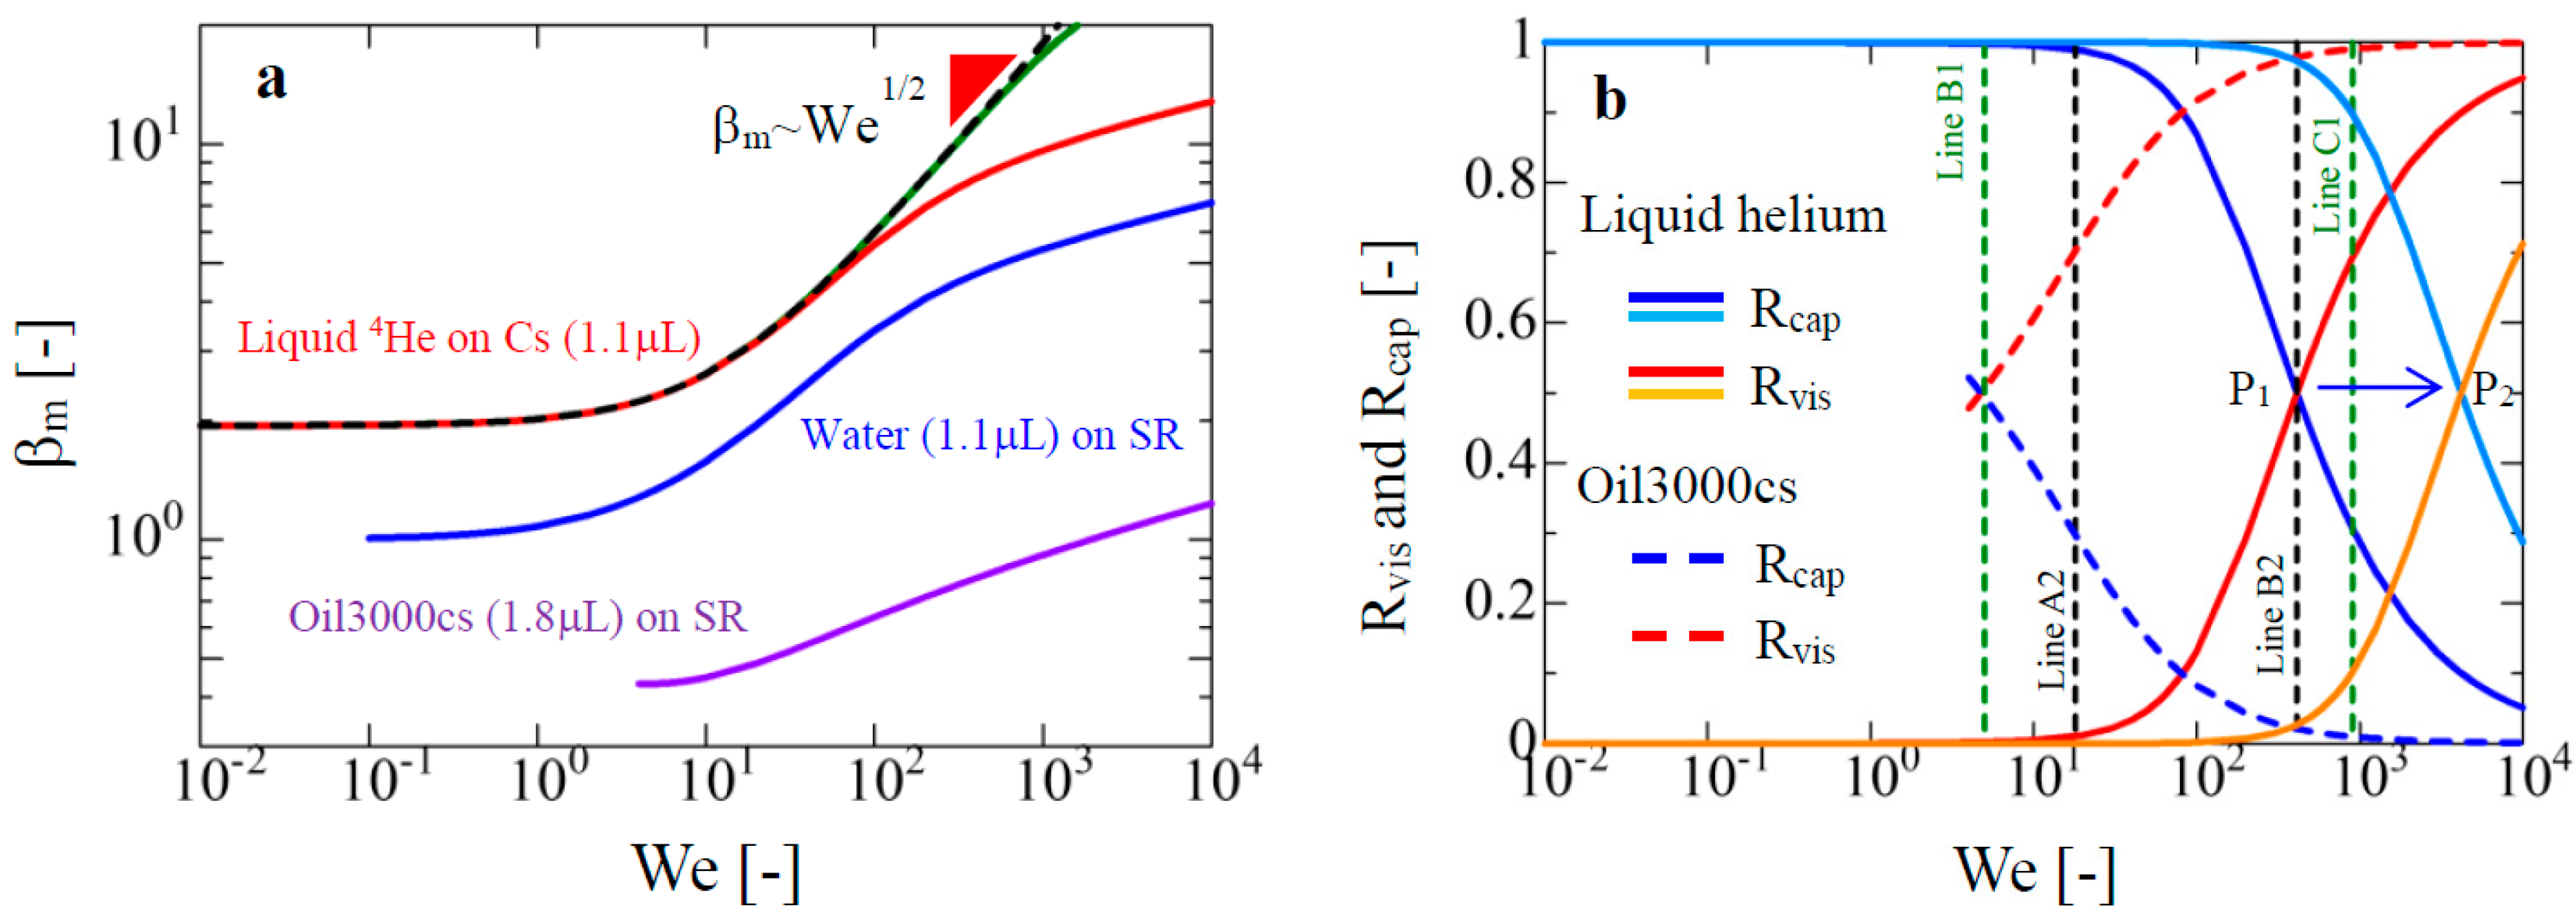
Figure 8 shows the relationship between βm and We for a low-viscosity liquid droplet, such as liquid helium. This analysis models the superfluid 4He on a cesium (Cs) coated substrate [37,38,39]. The red solid line was plotted using our modified model with the properties of liquid helium (ρl = 145.2 kg m−3, μl = 1.346 × 10⁻⁶ Pa s, and σlg = 0.332 × 10⁻³ N·m−1 at T = 1.5 K) [40]. The advancing contact angle is 27.3°, based on measured data of liquid helium wettability on Cs-coated substrate in the literature [39]. We use this as the value of θm. Liquid helium (4He) on Cs-coated substrate does not wet the surface, and hence, has a finite contact angle, because the cesium surface exhibits the weak-binding substrate for liquid 4He [37]. This behavior has been experimentally observed and theoretically modelled [37,38]. However, there are no data available for the static contact angle because there are few studies that investigates the liquid helium sessile droplet behavior in detail. Therefore, we set that the static contact angle θst of 4He on Cs is 3.6° by assuming that the similar ratio of θmst (ca. 7.5) for the case of water on SHPi (θm = 44.8° and θst = 6.0°) can be applied to that of the liquid helium on Cs case. The viscosity of liquid helium approaches zero as the temperature approaches 0 K [41]. The results obtained using μl = 1.346 × 10⁻⁸ Pa s are depicted with the solid green line in Figure 8a. The scaling between βm and We is almost βm ≈ We1/2 within the range We < 103 in Figure 8a, as the viscosity of the liquid helium approaches zero (μl = 1.346 × 10⁻⁸ Pa s). The black dashed line, solid green line, and solid red line nearly overlap in the range of We < 102. In Figure 8b, the blue and red solid lines are the results for Rcap and Rvis for the case of μl = 1.346 × 10⁻⁶ Pa s, respectively. Then, the light blue and orange solid lines are the results for Rcap and Rvis for the case of μl = 1.346 × 10⁻⁸ Pa s, respectively. The intersection of Rcap and Rvis moves from P1 toward P2 as the viscosity approaches zero. In Figure 8b, in the region We < 103m ≈ We1/2 in Figure 8a), we see that the conversion of energy to capillary energy (Rcap) is dominant over the energy converted through viscous dissipation (Rvis). In the case of the high-viscosity liquid (Oil 3000 cs), Rvis is dominant compared with Rcap in the area between Line B1 and Line C1.

5. Conclusions

We have investigated the deposition behavior of droplet after impingement covering a wide range of liquid viscosities, surface tensions, and target surface wettabilities for superhydrophilic (SHPi), silicone rubber (SR), polycarbonate (PC), and superhydrophobic (SHPo) substrates, including the existing experimental data for a superamphiphobic substrate. The results are compared to some analytical and empirical models including our model with a modification. The present results highlight the universality of our modified model for prediction of the maximum spreading contact area diameter of Newtonian liquids unlike other existing models. Then, the present model demonstrates that the impingement behavior of a superfluid 4He on Cs will exhibit the scaling relation of βm ≈ We1/2 as the viscosity approaches zero. Considering the energy budget of the superfluid, we observed that the conversion of energy to capillary energy is dominant in comparison with that of viscous dissipation. This type of analysis for energy transition would be considerably useful for investigating the unstable phenomena of droplet impingement, e.g., the fingering and splashing behaviors, from a theoretical point of view. In the present model, the dynamic contact angle, which is determined when the contact area diameter reaches a maximum value, is experimentally measured. Therefore, the theoretical prediction of this value would increase the usefulness of the model. Moreover, in the present study, we use several kinds of solid substrate having varied elastic modulus values. It may be important for complete modelling of the droplet impingement behavior to therefore consider the elastic modulus and other solid properties. Nevertheless, we expect that our model will become the basic theory for understanding the physics of droplet erosion, inkjet printing, spray cooling with normal fluids and superfluids, combustion, and cleaning in near future.

Author Contributions

Data Curation, Y.Y.; Formal Analysis, Y.Y. and T.K.; Writing—Original Draft Preparation, Y.Y.; Writing—Review & Editing, Y.Y. and T.K.

Funding

This work was funded in part by JSPS KAKENHI (17K14590).

Acknowledgments

The authors are grateful to Yosuke Kawano for his assistance in data collection.

Conflicts of Interest

The authors declare no competing interests.

Appendix A

Models for Data Analysis

With regard to energy conservation, the main consideration is the balance of energy among the kinetic (ekine), spreading (esprd), and viscous dissipation (evis) energies [8,9,22,23]. Huang et al. [24] proposed an analytical model wherein the viscous dissipation at a low impact speed was considered in the energy conservation. Besides the energy conservation approach, some semi-empirical models have been proposed to predict the value of βm. Based on the approach proposed by Eggers et al. [6], Laan et al. proposed the βmRe−1/5 = f(P) with a fitting parameter, P, which is the impact number (WeRe−2/5) [15]. Subsequently, this model was modified by Zhang et al. to consider the dependency of the contact angle on the fitting parameter [16]. Recently, Lee et al. [17] modified the model proposed by Laan et al. [15] by considering the effect of the dynamic contact angle on the maximum spreading diameter.
In the present paper, six existing models, including our model, are compared with experimental data. These models are briefly outlined as follows:
Model 1. This model was proposed by Laan et al. [15], expressed as:
β m Re 1 / 5 = P 1 / 2 A + P 1 / 2
where P and A are the impact number WeRe−2/5 and the arbitrary fitting parameter 1.24, respectively.
Model 2. This model was proposed by Zhang et al. [16], which is mainly based on Equation (A1). In particular, the contact angle dependency of the parameter is expressed in the equation:
A = 0.87θ − 0.31
where θ (rad) is the equilibrium contact angle used in Equation (A2).
Model 3. This model was proposed by Lee et al. [17], expressed as:
β m 2 β 0 2 Re 1 / 5 = We 1 / 2 B + We 1 / 2
where β0 and B are the maximum spreading ratios at zero impingement velocity and arbitrary fitting parameter of 7.6, respectively. β0 is expressed as:
β 0 = { ( 4 sin 3 θ d 2 3 cos θ d + cos 3 θ d ) 1 / 3 ,   if   θ d < 90 ° ( 1 ( 2 + cos θ d ) sin 4 ( θ d / 2 ) ) 1 / 3 , if   θ d > 90 °
where θd is the dynamic contact angle. In the present paper, θd in Equations (A4) is considered as θm.
Model 4. This model was proposed by Wang et al. [33], expressed as:
Re = β m 2 ( μ f μ l + 1 Ca + β m 3 )
where μf is the friction factor that controls the contact line velocity. Equation (A5) is derived by considering the order estimation in the energy balance equation.
Model 5. This model was proposed by Yonemoto and Kunugi [31]. The energy balance equation, including the vertical and horizontal components of the surface tension, is considered. Next, the following relation is derived:
We 3 + 4 + 2 3 ρ l g r 0 h m σ lg = 27 16 r 0 2 h m 2 β m We Re + ( 1 cos θ ¯ ) β m 2 h m r 0 β m sin θ ¯ + S def π r 0 2
where θ ¯ is the simple averaged contact angle (°) of the static and dynamic contact angles. The droplet height, where the contact diameter reaches maximum contact area diameter, is given by hm and is expressed as:
h m = 2 A f 1 + π A 2 f β m 2 r 0
where f = 3 π + ( 3 π ) 2 + β m 6 A 6 3 + 3 π ( 3 π ) 2 + β m 6 A 6 3 and A = ( 4 π 3 ) 1 / 3 .
From Equation (A6), because the viscous dissipation is negligible in the capillary region, we can derive a limiting solution for the capillary region as:
We = 3 β m 2 ( 1 cos θ ¯ ) 3 h m r 0 β m sin θ ¯ 2 ρ l g r 0 h m σ lg 12 + 3 S def π r 0 2
Model 6. This model was proposed by Huang et al. [24], the equations of which are presented as:
3 4 ( We Re + We Re ) β m 4 + 3 ( 1 cos θ a ) β m 3 ( We + 12 ) β m + 8 = 0 ,   V 0 < V 3 4 ( We Re + We Re Re Re ) β m 4 + 3 ( 1 cos θ a ) β m 3 ( We + 12 ) β m + 8 = 0 .   V 0 V
In the above equations, Re* = ρld0V*/μl and We* = ρl(V*)2d0lg, where V* is the critical velocity. These equations are derived by considering the viscous dissipation at the low impact speed of a droplet in the energy conservation. Note that the model is divided into two regions based on V*. The value of V* is evaluated using the relation:
V = { 4 σ lg ( 2 ρ l μ l r 0 ) 1 / 2 β sph [ 4 β s p h 2 2 ( 1 cos θ a ) + cos θ a sin 2 θ a ] } 2 / 3
where β s p h r m r 0 = ( 4 2 3 cos θ a sin 2 θ a 2 cos 3 θ a ) 1 / 3 .
In the above models, βm in the Models 5 and 6 is defined by the ratio between the maximum contact area diameter and the initial droplet diameter.

References

  1. De Gans, B.J.; Duineveld, P.C.; Schubert, U.S. Inkjet printing of polymers: State of the art and future developments. Adv. Mater. 2004, 16, 203–213. [Google Scholar] [CrossRef]
  2. Serras-Pereira, J.; Aleiferis, P.G.; Walmsley, H.L.; Davies, T.J.; Cracknell, R.F. Heat flux characteristics of spray wall impingement with ethanol, butanol, iso-octane, gasoline and E10 fuels. Int. J. Heat Fluid Flow 2013, 44, 662–683. [Google Scholar] [CrossRef] [Green Version]
  3. Josserand, C.; Thoroddsen, S.T. Drop impact on a solid surface. Annu. Rev. Fluid Mech. 2016, 48, 365–391. [Google Scholar] [CrossRef]
  4. Liu, Y.; Moevius, L.; Xu, X.; Qian, T.; Yeomans, J.M.; Wang, Z. Pancake bouncing on superhydrphobic surfaces. Nat. Phys. 2014, 10, 515–519. [Google Scholar] [CrossRef] [PubMed]
  5. De Ruiter, J.; Lagraauw, R.; van den Ende, D.; Mugele, F. Wettability-independent bouncing on flat surfaces mediated by thin air films. Nat. Phys. 2015, 11, 48–53. [Google Scholar] [CrossRef]
  6. Eggers, J.; Fontelos, M.A.; Josserand, C.; Zaleski, S. Drop dynamics after impact on a solid wall: Theory and simulations. Phys. Fluids 2010, 22, 062101. [Google Scholar] [CrossRef]
  7. Cheng, L. Dynamic spreading of drops impacting onto a solid surface. Ind. Eng. Chem. Process Des. Dev. 1977, 16, 192–197. [Google Scholar] [CrossRef]
  8. Chandra, S.; Avedisian, C.T. On the collision of a droplet with a solid surface. Proc. R. Soc. A 1991, 432, 13–41. [Google Scholar] [CrossRef]
  9. Pasandideh-Fard, M.; Qiao, Y.M.; Chandra, S.; Mostaghimi, J. Capillary effects during droplet impact on a solid surface. Phys. Fluids 2001, 8, 650–659. [Google Scholar] [CrossRef]
  10. Clanet, C.; Béguin, C.; Richard, D.; Quéré, D. Maximal deformation of an impacting drop. J. Fluid Mech. 2004, 517, 199–208. [Google Scholar] [CrossRef]
  11. Roisman, I.V. Inertia dominated drop collisions. II. An analytical solution of the Navier-Stokes equations for a spreading viscous film. Phys. Fluids 2009, 21, 052104. [Google Scholar] [CrossRef]
  12. Marengo, M.; Antonini, C.; Roisman, I.V.; Tropea, C. Drop collisions with simple and complex surfaces. Curr. Opin. Colloid Interface Sci. 2011, 16, 292–302. [Google Scholar] [CrossRef]
  13. Antonini, C.; Amirfazli, A.; Marengo, M. Drop impact and wettability: From hydrophilic to superhydrophobic surfaces. Phys. Fluids 2012, 24, 102014. [Google Scholar] [CrossRef]
  14. Seo, J.; Lee, J.S.; Kim, H.Y.; Yoon, S.S. Empirical model for the maximum spreading dimeter of low-viscosity droplets on a dry wall. Exp. Therm. Fluid Sci. 2015, 61, 121–129. [Google Scholar] [CrossRef]
  15. Lann, N.; De Bruin, K.G.; Bartolo, D.; Josserand, C.; Bonn, D. Maximum diameter of impacting liquid droplets. Phys. Rev. Appl. 2014, 2, 044018. [Google Scholar] [CrossRef]
  16. Zhang, J.; Han, T.-Y.; Yang, J.-C.; Ni, M.-J. On the spreading of impacting drops under the influence of a vertical magnetic field. J. Fluid Mech. 2016, 809, R3. [Google Scholar] [CrossRef]
  17. Lee, J.B.; Laan, N.; De Bruin, K.G.; Skantzaris, G.; Shahidzadeh, N.; Derome, D.; Carmeliet, J.; Bonn, D. Universal rescaling of drop impact on smooth and rough surfaces. J. Fluid Mech. 2016, 786, R4. [Google Scholar] [CrossRef]
  18. Scheller, B.L.; Bousfield, D.W. Newtonian drop impact with a solid surface. AIChE J. 1995, 41, 1357–1367. [Google Scholar] [CrossRef]
  19. Bayer, I.S.; Megaridis, C.M. Contact angle dynamics in droplets impacting on flat surfaces with different wetting characteristics. J. Fluid Mech. 2006, 558, 415–449. [Google Scholar] [CrossRef]
  20. Sen, S.; Vaikuntanathan, V.; Sivakumar, D. Experimental investigation of biofuel drop impact on stainless steel surface. Exp. Therm. Fluid Sci. 2014, 54, 38–46. [Google Scholar] [CrossRef]
  21. Wildeman, S.; Visser, C.W.; Sun, C.; Lohse, D. On the spreading of impacting drops. J. Fluid Mech. 2016, 805, 636–655. [Google Scholar] [CrossRef] [Green Version]
  22. Ukiwe, C.; Kwok, D.Y. On the maximum spreading diameter of impacting droplets on well-prepared solid surfaces. Langmuir 2005, 21, 666–673. [Google Scholar] [CrossRef] [PubMed]
  23. Lee, J.B.; Derome, D.; Guyer, R.; Carmeliet, J. Modeling the maximum spreading of liquid droplets impacting wetting and nonwetting surfaces. Langmuir 2016, 32, 1299–1308. [Google Scholar] [CrossRef] [PubMed]
  24. Huang, H.-M.; Chen, X.-P. Energetic analysis of drop’s maximum spreading on solid surface with low impact speed. Phys. Fluids 2018, 30, 022106. [Google Scholar] [CrossRef] [Green Version]
  25. Das, S.; Marchand, A.; Andreotti, B.; Snoeijer, J.H. Elastic deformation due to tangential capillary forces. Phys. Fluids 2011, 23, 072006. [Google Scholar] [CrossRef] [Green Version]
  26. Paxson, A.T.; Varanasi, K.K. Self-similarity of contact line depinning from textured surfaces. Nat. Commun. 2013, 4, 1492. [Google Scholar] [CrossRef] [PubMed] [Green Version]
  27. Yonemoto, Y.; Kunugi, T. Wettability model for various-sized droplets on solid surfaces. Phys. Fluids 2014, 26, 0821101. [Google Scholar] [CrossRef]
  28. Fernandez-Toledano, J.-C.; Blake, T.D.; De Coninck, J. Young’s equation for a two-liquid system on the nanometer scale. Langmuir 2017, 33, 2929–2938. [Google Scholar] [CrossRef] [PubMed]
  29. Fernandez-Toledano, J.-C.; Blake, T.D.; Lambert, P.; De Coninck, J. On the cohesion of fluids and their adhesion to solids: Young’s equation at the atomic scale. Adv. Colloid Interface Sci. 2017, 245, 102–107. [Google Scholar] [CrossRef] [PubMed]
  30. De Gennes, P.G.; Brochard-Wyard, F.; Quéré, D. Capillarity and Wetting Phenomena: Drops, Bubbles, Pearls, Waves; Springer: Berlin, Germany, 2003. [Google Scholar]
  31. Yonemoto, Y.; Kunugi, T. Analytical consideration of liquid droplet impingement on solid surfaces. Sci. Rep. 2017, 7, 2362. [Google Scholar] [CrossRef] [PubMed] [Green Version]
  32. Taborek, P.; Wallace, M.; Mallin, D.; Aguirre, A.; Langley, K.; Thoroddsen, S. Impact, spreading and splashing of superfluid drops. Presented at the 70th Annual Meeting of the APS Division of Fluid Dynamics, Denver, CO, USA, 19–21 November 2017. [Google Scholar]
  33. Wang, Y.; Amberg, G.; Carlson, A. Local dissipation limits the dynamics of impacting droplets on smooth and rough substrates. Phys. Rev. Fluids 2017, 2, 033602. [Google Scholar] [CrossRef]
  34. Eral, H.B.; ’T Mannetje, D.J.C.M.; Oh, J.M. Contact angle hysteresis: A review of fundamentals and applications. Colloid Polym. Sci. 2013, 291, 247–260. [Google Scholar] [CrossRef]
  35. Yonemoto, Y.; Suzuki, S.; Uenomachi, S.; Kunugi, T. Sliding behavior of water-ethanol mixture droplets on inclined low-surface-energy solid. Int. J. Heat Mass Transf. 2018, 120, 1315–1324. [Google Scholar] [CrossRef]
  36. Zhao, B.; Wang, X.; Zhang, K.; Chen, L.; Deng, X. Impact of viscous droplets on superamphiphobic surfaces. Langmuir 2017, 33, 144–151. [Google Scholar] [CrossRef] [PubMed]
  37. Cheng, E.; Cole, M.W.; Saam, W.F.; Treiner, J. Helium prewetting and nonwetting on weak-binding substrates. Phys. Rev. Lett. 1991, 67, 1007–1010. [Google Scholar] [CrossRef] [PubMed]
  38. Nacher, P.J.; Dupont-Roc, J. Experimental evidence for nonwetting with superfluid helium. Phys. Rev. Lett. 1991, 67, 2966–2969. [Google Scholar] [CrossRef] [PubMed]
  39. Ross, D.; Taborek, P.; Rutledge, J.E. Contact angle of superfluid helium droplets on a cesium surface. J. Low Temp. Phys. 1998, 111, 1–10. [Google Scholar] [CrossRef]
  40. Donnelly, R.J.; Barenghi, C.F. The observed properties of liquid helium at the saturated vapor pressure. J. Phys. Chem. Ref. Data 1998, 27, 1217–1274. [Google Scholar] [CrossRef]
  41. Mantia, M.L.; Duda, D.; Rotter, M.; Skrbek, L. Velocity statistics in quantum turbulence. Procedia IUTAM 2013, 9, 79–85. [Google Scholar] [CrossRef]
Figure 1. Snapshots of the maximum spreading of droplets released from several falling heights. (a) 1.1 μL water on silicone rubber (SR); (b) 3.2 μL water on superhydrophobic (SHPo) surface; (c) 1.1 μL ethanol on SR; (d) 1.5 μL silicone oil (300 cS) on SR; (e) 1.8 μL silicone oil (3000 cs) on SR.
Coatings 08 00409 g001
Figure 2. Relationship between βm and We for the low- and high-viscosity liquids. (a) 1.1-μL water on SR; (b) 3.2-μL water on SHPo surface; (c) 1.6-μL water on the superhydrophilic (SHPi) surface; (d) 1.1-μL ethanol on SR; (e) 1.5-μL silicone oil (Oil 300 cs) on SR; (f) 1.8-μL silicone oil (Oil 3000 cs) on SR. (g,h) The fitting parameters of A in Equation (A1) and B in Equation (A3) evaluated using our model. The red solid horizontal lines of 1.24 and 7.6 in each figure are the values of A and B used in the original models. The red and blue solid lines in each figure represent the values of A and B, respectively, for the cases of Oil 3000 cs and Oil 300 cs, respectively. The red, black, blue, purple, and light green dashed lines correspond to the values of water on SR, water on PC, ethanol on SR, water on SHPo, and water on SHPi, respectively.
Coatings 08 00409 g002
Figure 3. Profile of β0 against θm. Black and blue solid lines are calculated from Equation (A4), respectively.
Coatings 08 00409 g003
Figure 4. Relationship between βm and We for some existing data [23,36]. (af) Graphs are presented in the order of low-to-high viscosities for glycerol–water mixtures [36]. The red, green, pink, blue, and black solid lines represent the results by our model (Equations (1) and (2)), the model proposed by Zhang et al. [16] (Equations (A1) and (A2)), the model proposed by Lee et al. [17] (Equation (A3)) and the model proposed by Huang et al. [24] (Equation (A9)), respectively. (g,h) Ethanol and water on Alro (rough) and Al, and parafilm [23]. The red and blue lines represent the results calculated using our model (Equations (1) and (2)) and the model proposed by Lee et al. [17] (Equation (A3)), respectively. The dashed and solid lines denote the results obtained for ethanol and water, respectively.
Coatings 08 00409 g004
Figure 5. Relationship between βm and Re for purified water with different volumes on SR (a) and PC (b) substrates. 1.1 μL (white dot) and 31.6 μL (red dot) water on SR. The red dashed and solid lines represent the analytical results of 1.1 μL and 31.6 μL cases calculated by our model (Equations (1) and (2)), respectively. The blue dashed and solid lines represent the analytical results of 1.1 μL and 31.6 μL cases calculated using Equation (A3), respectively.
Coatings 08 00409 g005
Figure 6. Analysis of droplet impingement for the water droplet (4.1 μL) on aluminum with a smooth surface (Alsm) [23]. (a) Relationship between βmRe−1/5 and the impact number P (=WeRe−2/5). The red, black, blue, and green solid lines represent the results calculated using our model (Equations (1) and (5)), the model proposed by Huang et al. (Equation (A9)), Zhang et al. (Equations (A1) and (A2)), and Laan et al. (Equation (A1)), respectively. (b) Energy transition for Rvis and Rcap; 99% of Eini is converted to Ecap at Line A. Eini is converted to 50% of Ecap and 50% of Evis at Line B (transition point from the capillary-to-viscous-dominated regions). 99% of Eini is converted to Evis at Line C. (c) Variation in the friction factor μf with respect to P evaluated using our model (Equations (1) and (2)); the value of μf = 0.08 Pa s, expressed by the red horizontal solid line, is used in the simulation of a previous study [33]. The average value of μf in the limit of P < 100 (only positive values of μf are used) is 0.16.
Coatings 08 00409 g006
Figure 7. Variation of μf for several impingement cases in the present study.
Coatings 08 00409 g007
Figure 8. Droplet impingement behavior for two extreme liquid conditions. (a) Relationship between βm and We for the superfluid 4He droplet on cesium (Cs) at 1.5 K (red solid line) [37,38,39], water droplet (blue solid line), and Oil 3000 cs (purple solid line); the red, blue, and purple solid lines are calculated using Equations (1) and (2). The black dashed line plots the limit solution evaluated by Equation (A8) with Equation (2). The solid green line plots results for liquid helium, whose viscosity is 10−2 times that of superfluid helium (μl = 1.346 × 10⁻⁸ Pa s). (b) Energy transition for a liquid-helium droplet and Oil 3000 cs; The helium (1.5 K) model is plotted using blue and red solid lines for Rcap and Rvis. At Line A2, 99% of Eini is converted to Ecap. At Line B2, Eini is converted to 50% of Ecap and 50% of Evis. The solid light-blue and orange lines are the results for the liquid helium of μl = 1.346 × 10⁻⁸ Pa s. The liquid helium model is almost entirely within the capillary-dominated region. The Oil 3000 cs model is plotted using blue and red dashed lines for Rcap and Rvis. At Line B1, Eini is converted to 50% of Ecap and 50% of Evis. At Line C1, 99% of Eini is converted to Evis. The Oil 3000 cs model lies almost entirely within the viscous-dominated region.
Coatings 08 00409 g008

