Article

Suppressing Grain Growth on Cu Foil Using Graphene

1
Department of Energy Systems Research, Ajou University, Suwon 16499, Korea
2
Department of Materials Science and Engineering, Ajou University, Suwon 16499, Korea
3
School of Advanced Materials Science & Engineering, Sungkyunkwan University, Suwon 16419, Korea
4
School of Advanced Institute of Nanotechnology (SAINT), Sungkyunkwan University, Suwon 16419, Korea
*
Authors to whom correspondence should be addressed.
These authors contributed equally to this work.
Coatings 2018, 8(10), 334; https://doi.org/10.3390/coatings8100334
Submission received: 20 August 2018 / Revised: 11 September 2018 / Accepted: 21 September 2018 / Published: 23 September 2018

Abstract

:
The effect of graphene coating on the growth of grains on bulk copper film was studied. When methane gas is catalytically decomposed on the surface of copper, and a carbon–copper solid solution is formed at high temperature, precipitated carbon on the copper surface forms graphene during rapid cooling through strong sp2 covalent bonding. The graphene layer can prevent the growth of grains by suppressing the diffusion of copper atoms on the surface, even after continuous heat treatment at high temperatures. The actual size of the copper grains was analyzed in terms of repetitive high-temperature heat treatment processes, and the grain growth process was simulated by using thermodynamic data, such as surface migration energy and the binding energy between copper and carbon. In general, transition metals can induce graphene growth on surfaces because they easily form carbon solid solutions at high temperatures. It is expected that the process of graphene growth will be able to suppress grain growth in transition metals used at high temperatures and could be applied to materials that are prone to thermal fatigue issues such as creep.

1. Introduction

Since the performance of a device (or system) using metal as a component is influenced by grain size [1,2], texture (preferred orientation) [3,4,5], and surface roughness [6,7,8], it is necessary to manage these characteristics well, in order to maintain constant device performance. However, because of the nature of metallic materials, these microstructures can be changed by heat from the environment or generated by the device itself (effects on the atomic movement based on Fick’s Law) [9,10,11,12]. Therefore, a technology that can maintain a constant microstructure for a long time, even at a high temperature, can be said to be very important from the viewpoint of the reliability of the device it has been applied to.
Traditionally, the method used to inhibit grain growth was to prevent the diffusion of atoms by pinning secondary precipitates in grain boundaries [13,14]. However, since the types and sizes of the precipitates depend on the sort of metal or alloy, there has been a problem in that separate metal reaction studies have to be carried out for each variety of metal [15,16].
In this study, we propose a method to obtain high-temperature stability, which can be applied to various metals, using carbon precipitate (graphene) and we then test it experimentally by using copper (Cu). In particular, Cu thin films are widely used in the electronics industry because of their high thermal and electrical conductivity [17,18,19]. This conductivity is particularly influenced by the size and arrangement of grains, so close attention to graining is required [20,21]. It is known that the surface behaves similar to a liquid at a temperature close to its melting point of 1084 °C [22,23] at which Cu atoms actively move, and the grains grow in a crystalline orientation (described as the 111 orientation), in the most thermally stable direction [24,25].
When graphene is grown on Cu foil by chemical vapor deposition (CVD), graphene is weakly bound to the Cu foil (0.33 eV per atom, the magnitude of the binding energy between graphene and transition metal atoms varies, depending on how many electrons are filled in the outermost orbitals of the metal atoms) [26,27]. Graphene synthesized onto the transition metal surface has been studied mainly in relation to chemical stability—such as corrosion and oxidation protection [28,29]—and has not been studied in terms of grain growth control, although the bulk graphene/Cu composite materials have been studied for mechanical strength [30,31,32]. In this study, however, graphene was proposed for suppressing grain growth on metal in consideration of the excellent thermal conductivity and bonding energy associated with metal atoms. The repeated heat treatment of graphene-coated copper samples, synthesized at high temperatures, was investigated.

2. Materials and Methods

2.1. Sample Preparation

A commercial 25 µm copper foil (item no. 13382, 99.8% purity, Alfa Aesar, Ward Hill, MA, USA) was first immersed in 0.1 M ammonium persulfate solution ((NH4)2S2O8, item No. 248614, ACS reagent, 98.0%, Sigma-Aldrich, St. Louis, MO, USA) for 1 min for cleaning and to etch oxide from the surface. Next, graphene growth was induced by loading the pre-etched Cu foil onto a quartz tube reaction chamber. Each Sample (A–C) was subjected to a CVD process three times, with and without methane (CH4) flow.
The CVD process used went as follows:
  • The pressure in the chamber was pumped down to 5 mTorr using a mechanical pump;
  • Hydrogen (H2) gas was injected into the chamber at 40 sccm, the temperature of the Cu foil then raised to 1000 °C over 60 min;
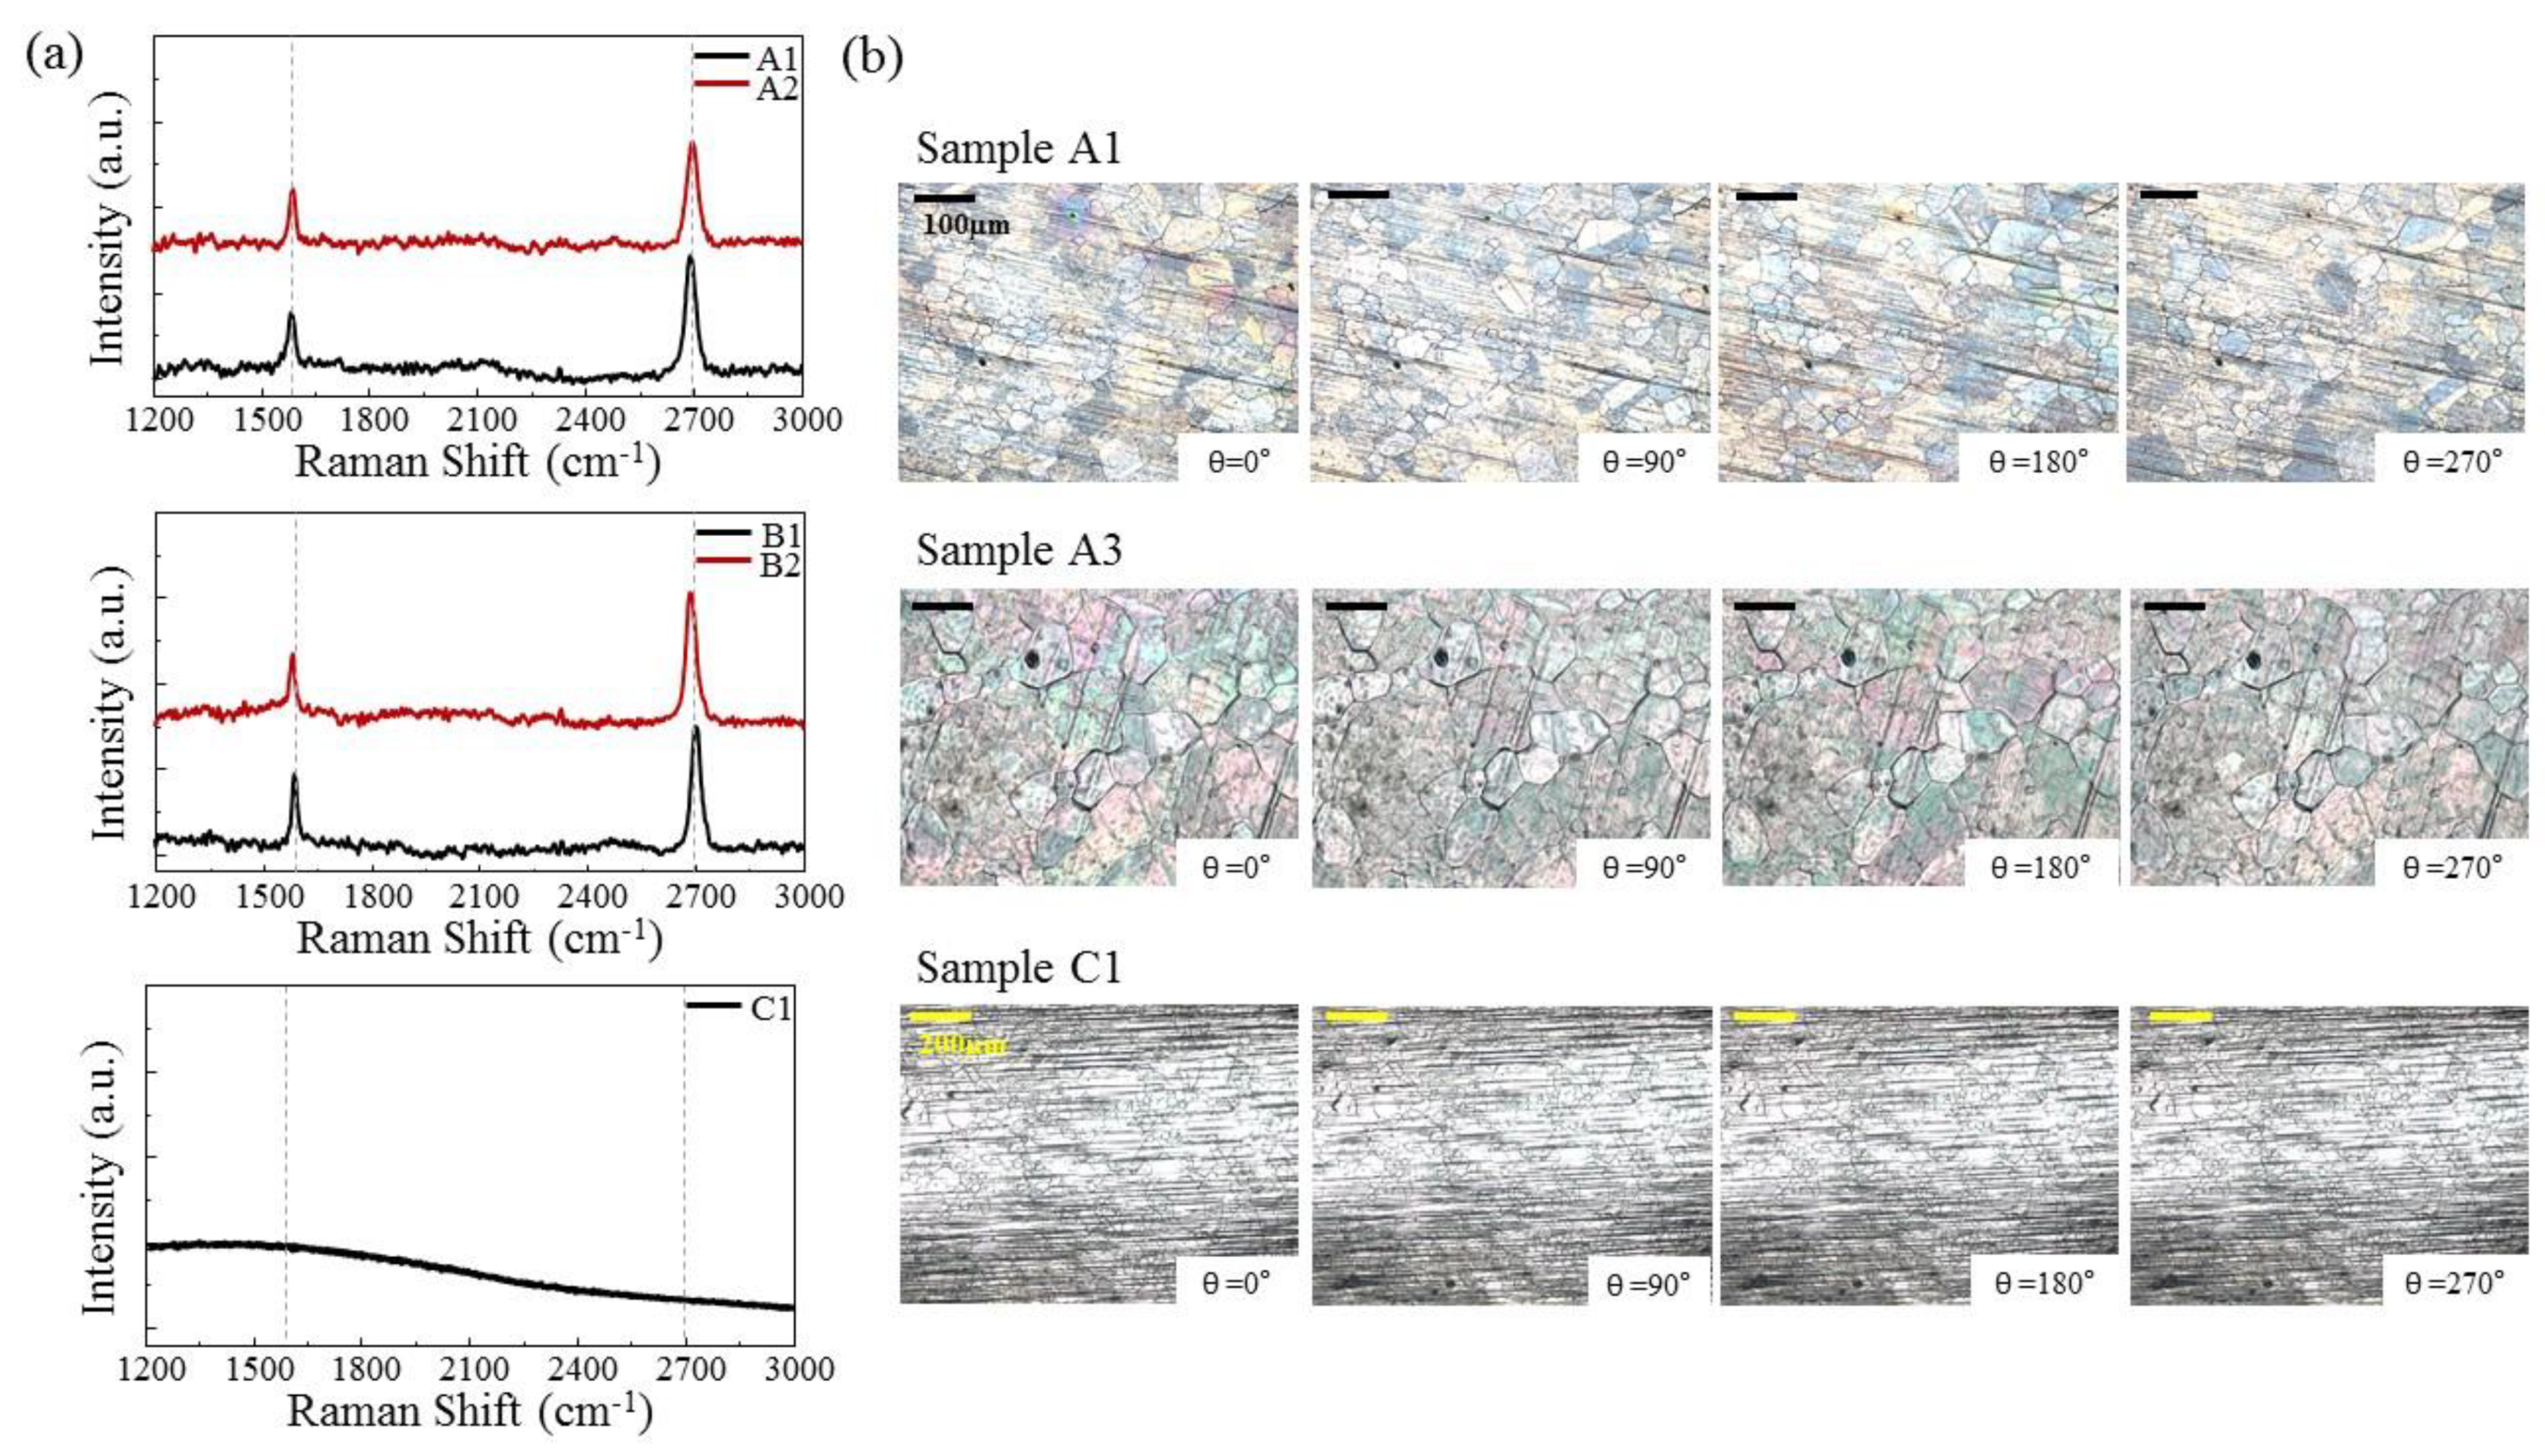
  • CH4 gas was injected into the chamber at 10 sccm for 10 min, for Samples A and B; for Sample C, there was no CH4 injection;
  • Finally, the furnace was opened and rapidly cooled for about 20 min to 200 °C.
This CVD process was repeated up to two more times to examine the thermal effect on grain growth on Cu, as follows: Sample A had CH4 injection three times, Sample B had CH4 injection in the first process only, and Sample C did not have CH4 injection at any time.

2.2. Analysis

The Graphene/Cu samples were characterized by light microscopy (LM), Polarized light microscopy (PLM), X-ray diffraction (XRD), and Raman spectrometry. LM images were taken with a U-MSSP49 (Olympus, Tokyo, Japan) microscope, and, for PLM images, the samples were directly spin-coated with liquid crystal (4’-PENTYL-4-BIPHENYLCARBONITRILE, Sigma-Aldrich, item No. 328510, 98%), then images were taken with the LM device and polarizer (U-AN369-3, Olympus). XRD analysis was performed with a Rigaku MiniFlex spectrometer (3 kW, Cu-Kα, HD307172, Rigaku, Tokyo, Japan). Raman spectra were obtained with a LabRAM HR Evolution-Nicolet iS50 (Jobin Yvon, Horiba-Thermo, Kyoto, Japan) spectrometer, at 532 nm laser wavelength, 5 mm in diameter.

3. Results and Discussion

When the Cu foil reaches 1000 °C, the growth temperature of graphene, the surface of the Cu foil behaves like a liquid (Cu foil has a melting point of 1084 °C). At this temperature, the Cu atoms move freely to adopt a (111) direction, which is a thermodynamically stable direction resulting in retention of the (111) preferred orientation after rapid cooling.
However, when graphene is formed on the surface of Cu by precipitated carbon, it exhibits a different crystal orientation. The Cu (100) crystal plane, which can be nucleated easily on the graphene surface as it is kinetically favored over the (111) orientation, is formed at the bottom of graphene [25,33]. The (100) grains can suppress the bulk grain growth (111) orientation, as shown in Figure 1a. For an explanation of the sampling sequence, see also Figure 1b and Table 1.
Each Cu foil sample exhibited growth of grains. However, the grain growth tendency on Samples A and B, which were covered with graphene, was relatively less than that on Sample C (see Figure 2a showing the grains on Cu, taken by LM). Sample C exhibited a noticeably larger grain size when the CVD cycle was repeated. There was no significant change in grain size between each sample in the first CVD process. It is known that the CVD process for growing graphene made the Cu grain larger than annealing at the same temperature [34], but, in our experiment, there was an annealing time of 30 min before graphene growth. Since the grain growth effect of the 30 min annealing was greater than the effect of 10 min of graphene growth, each sample did not show a large difference in grain size after the first CVD process.
These results indicated that the graphene layer on the Cu surface suppressed grain growth on Cu. As mentioned in Figure 1a, the increase in Cu (111) orientation has a direct effect on the grain growth, so it was necessary to confirm the ratio of the (111) peak, using XRD analysis. As shown in Figure 2b and Table 2, repeating the CVD cycle did not gradually change the XRD peak. This is because Cu has a very large grain size distribution, and the penetration depth of the X-ray is deeper than the depth of the surface which is affected by graphene. The surface affected by graphene is atomically shallow, because graphene can only affect Cu atoms that are slightly bonded to it.
We calculated the average grain size on each Cu foil. As the images in Figure 3a,b had lots of scratches, the computer program we used could not find the grain exactly. Therefore, we used the circle method from ASML E112 [35] (Incorrect ref order, 36 detected before 35. References should be cited in numerical order.) to distinguish the grain and scratches correctly. Equation (1) was used to calculate the grain size, by drawing a circle with a diameter of 200 µm on an LM image magnified ×100, as seen in Figure 3a,b.
F m = F k / ( 0.67 n + z )
In Equation (1), Fk was the measured circle area on the LM image, z was the number of grains completely within the test circle, and n was the number of grains intercepted by the test circle. By assuming that the grains were circular, the average diameter of the grains was calculated using Equation (2).
D = 2 F m π
Figure 3c shows the average grain area calculated with Equation (2). Because of the large grain size distribution of the Cu foil [36], 20 images per sample were taken and calculated to minimize the errors when selecting specific parts. Noting that the graphene was synthesized after annealing the Cu foil in the first CVD process, it was natural that there was no significant difference in grain size after the first cycle. From the second cycle, the grain size increase on the pure Cu foil with the CVD cycle was greater than that of the Cu foil with graphene. Furthermore, when the CVD cycle was repeated, the increase in the average grain size in the graphene-covered Cu foil became extremely small, and the grain area became constant.
Figure 4a shows the Raman shift of Samples A1, A2, B1, B2, and C1. In graphene, three peaks corresponding to the positions of approximately 1350, 1600, and 2700 cm−1 appeared, which were called D peak, G peak, and 2D peak, respectively [37,38]. In Samples A1, A2, B1, and B2, there was a small D peak which indicated high quality and small defects of the graphene. The number of layers and quality of the graphene could be analyzed with the other two peaks. In all samples except Sample C, the intensity ratio of the two peaks (I2D/IG) was between 2 and 3, which means that a single-layer graphene was synthesized. The intensity ratios of Samples A2 and B2 were not different from those of A1 and B1, meaning that repeated heating did not damage nor affect the number of graphene layers. Sample C, which was not injected with CH4 during the CVD process, did not have any evidence of graphene. The graphene grain images obtained by repeating the CVD cycle once (A1) and three times (A3) were observed using PLM, and can be seen in Figure 4b [39]. The colors of A1 and A3 are different because of the different thicknesses of the liquid crystal. Sample C1 does not show any difference at various angles because the liquid crystal could not be aligned without graphene.
The grain size of the graphene did not change considerably. However, in Sample A3 in Figure 4b, we can see a rougher surface, which was caused by the movement of the Cu particles on the surface as a result of the repeated CVD cycles.
We used the formula in Equation (3) below to calculate the theoretical grain size [40,41].
D D 0 = ( k t ) 1 / n
In Equation (3), D was the grain size at time t, D0 was the initial grain size, n was the grain growth exponent, and k was a temperature-dependent and grain boundary mobility relative constant, which was expressed with Arrhenius equation (Equation 4).
k = k 0 e ( E a / R T )
In Equation (4), k was the rate constant, T was the absolute temperature, k0 was the pre-exponential factor, Ea was the activation energy, and R was the universal gas constant. We first determined the value of k0 by substituting the grain size value from Samples C1–C3. The plot of k for 1000/T of pure Cu using this value is shown in Figure 5a. The plot of graphene-covered Cu was drawn by applying the C–Cu binding energy (3182 J/mol) [26,27] and the activation energy of pure Cu. With this plot, the k value for 1000 °C was calculated as 0.05 µm2 s−1.
In Figure 5b, the theoretical grain diameter was calculated by substituting the k value. In the case of graphene–Cu, it behaved like pure Cu at the first CVD cycle (0 to 2400 s) because graphene was synthesized after 40 min of heating (30 min of annealing and 10 min of injecting CH4). Thus, the (DD0) value was calculated with the activation energy of pure Cu for the first cycle and with the activation energy of graphene–Cu (which contains C–Cu bonding energy) as well as the activation energy of pure Cu for the second and third cycles. After the first cycle, the theoretical value and the experimental value were significantly different for graphene–Cu, while the values were almost in agreement in pure Cu.
The reasons for this can be seen in Figure 5c. First, since graphene has high thermal conductivity [42,43], it takes away the heat from the Cu foil. Therefore, the Cu foil cannot receive the full thermal energy equivalent of 1000 °C; therefore, the corresponding grain growth does not occur. The second reason is that the C atoms are dissolved in the Cu foil at high temperatures. The remaining C atoms in the Cu foil suppress the potential shift of Cu dislocations and consequently interfere with grain growth [44,45].

4. Conclusions

In conclusion, we investigated the effect of graphene on grain growth on Cu foil. A thermodynamic model was used to predict the extent of grain growth, on both graphene-covered Cu foil and pure Cu foil, and these predictions were then compared with actual experimental data.
It was seen that there was less grain growth on the surface of graphene-covered Cu than on pure Cu. Grain growth occurred less than the predicted theoretical value on the surface of the graphene-covered Cu, because of the high thermal conductivity of graphene and because C atoms dissolved in the Cu.
It is expected that the application of graphene will suppress grain growth on transition metals used at high temperatures and that this technique will be easily applied to make materials more stable and less prone to thermal fatigue such as creep.

Author Contributions

Conceptualization, J.L. and H.K.Y.; Methodology, J.L. and H.S.; Validation, J.L. and H.S. and H.K.Y.; Formal Analysis, J.L.; Investigation, J.L. and H.S.; Data Curation, J.L. and H.S.; Writing-Original Draft Preparation, J.L.; Writing-Review & Editing, J.L., H.S. H.K.Y. and J.-Y.C.; Visualization, J.L. and H.S.; Supervision, H.K.Y. and J.-Y.C.; Project Administration, J.L. and H.K.Y.; Funding Acquisition, H.K.Y.

Funding

This research received no external funding.

Acknowledgments

This work was supported by the Ajou University research fund.

Conflicts of Interest

The authors declare no conflict of interest.

References

  1. Beaudoin, A.J.; Acharya, A.; Chen, S.R.; Korzekwa, D.A.; Stout, M.G. Consideration of grain-size effect and kinetics in the plastic deformation of metal polycrystals. Acta Mater. 2000, 48, 3409–3423. [Google Scholar] [CrossRef]
  2. Saida, K.; Zhou, Y.; North, T.H. The influence of base metal grain size on isothermal solidification during transient liquid-phase brazing of nickel. J. Mater. Sci. 1993, 28, 6427–6432. [Google Scholar] [CrossRef]
  3. Wu, P.D.; MacEwen, S.R.; Lloyd, D.J.; Neale, K.W. Effect of cube texture on sheet metal formability. Mater. Sci. Eng. A 2004, 364, 182–187. [Google Scholar] [CrossRef]
  4. Stanford, N.; Barnett, M. Effect of composition on the texture and deformation behaviour of wrought Mg alloys. Scr. Mater. 2008, 58, 179–182. [Google Scholar] [CrossRef]
  5. Koike, J.; Wada, M.; Sanada, M.; Maruyama, K. Effects of crystallographic texture on stress-migration resistance in copper thin films. Appl. Phys. Lett. 2002, 81, 1017–1019. [Google Scholar] [CrossRef]
  6. Hassan, A.M. The effects of ball- and roller-burnishing on the surface roughness and hardness of some non-ferrous metals. J. Mater. Process. Technol. 1997, 72, 385–391. [Google Scholar] [CrossRef]
  7. Kim, S.H.; Na, S.W.; Lee, N.E.; Nam, Y.W.; Kim, Y.H. Effect of surface roughness on the adhesion properties of Cu/Cr films on polyimide substrate treated by inductively coupled oxygen plasma. Surf. Coat. Technol. 2005, 200, 2072–2079. [Google Scholar] [CrossRef]
  8. Ponsonnet, L.; Reybier, K.; Jaffrezic, N.; Comte, V.; Lagneau, C.; Lissac, M.; Martelet, C. Relationship between surface properties (roughness, wettability) of titanium and titanium alloys and cell behavior. Mater. Sci. Eng. C 2003, 23, 551–560. [Google Scholar] [CrossRef]
  9. Harper, J.M.E.; Cabral Jr, C.; Andricacos, P.C.; Gignac, L.; Noyan, I.C.; Rodbell, K.P.; Hu, C.K. Mechanisms for microstructure evolution in electroplated copper thin films near room temperature. J. Appl. Phys. 1999, 86, 2516–2525. [Google Scholar] [CrossRef]
  10. Koo, J.B.; Yoon, D.Y. Abnormal grain growth in bulk Cu—The dependence on initial grain size and annealing temperature. Metall. Mater. Trans. A 2001, 32, 1911–1926. [Google Scholar] [CrossRef]
  11. Weihnacht, V.; Brückner, W. Abnormal grain growth in {111} textured Cu thin films. Thin Solid Films 2002, 418, 136–144. [Google Scholar] [CrossRef]
  12. Huang, J.S.; Zhang, J.; Cuevas, A.; Tu, K.N. Recrystallization and grain growth in bulk Cu and Cu(Sn) alloy. Mater. Chem. Phys. 1997, 49, 33–41. [Google Scholar] [CrossRef]
  13. Hibbard, G.D.; McCrea, J.L.; Palumbo, G.; Aust, K.T.; Erb, U. An initial analysis of mechanisms leading to late stage abnormal grain growth in nanocrystalline Ni. Scr. Mater. 2002, 47, 83–87. [Google Scholar] [CrossRef]
  14. Afshar, A.; Simchi, A. Abnormal grain growth in alumina dispersion-strengthened copper produced by an internal oxidation process. Scr. Mater. 2008, 58, 966–969. [Google Scholar] [CrossRef]
  15. Barmak, K.; Gungor, A.; Cabral, C.; Harper, J.M.E. Annealing behavior of Cu and dillute Cu-alloy films: Precipitation, grain growth, and resistivity. J. Appl. Phys. 2003, 94, 1605–1616. [Google Scholar] [CrossRef]
  16. Zheng, Y.; Li, X.; Cheng, X.; Li, Z.; Liu, Y.; Dong, C. Enhanced thermal stability of Cu alloy films by strong interaction between Ni and Zr (or Fe). J. Phys. D Appl. Phys. 2018, 51, 135304. [Google Scholar] [CrossRef] [Green Version]
  17. Kang, M.G.; Park, H.J.; Ahn, S.H.; Guo, L.J. Transparent Cu nanowire mesh electrode on flexible substrates fabricated by transfer printing and its application in organic solar cells. Sol. Energy Mater. Sol. Cells 2010, 94, 1179–1184. [Google Scholar] [CrossRef]
  18. Zhuang, Z.; Su, X.; Yuan, H.; Sun, Q.; Xiao, D.; Choi, M.M. An improved sensitivity non-enzymatic glucose sensor based on a CuO nanowire modified Cu electrode. Analyst 2008, 133, 126–132. [Google Scholar] [CrossRef] [PubMed]
  19. Taberna, P.L.; Mitra, S.; Poizot, P.; Simon, P.; Tarascon, J.M. High rate capabilities Fe3O4-based Cu nano-architectured electrodes for lithium-ion battery applications. Nat. Mater. 2006, 5, 567–573. [Google Scholar] [CrossRef] [PubMed]
  20. Rossnagel, S.M.; Kuan, T.S. Alteration of Cu conductivity in the size effect regime. J. Vac. Sci. Technol. B 2004, 22, 240–247. [Google Scholar] [CrossRef]
  21. Takata, N.; Lee, S.H.; Tsuji, N. Ultrafine grained copper alloy sheets having both high strength and high electric conductivity. Mater. Lett. 2009, 63, 1757–1760. [Google Scholar] [CrossRef]
  22. Hsieh, Y.P.; Chen, D.R.; Chiang, W.Y.; Chen, K.J.; Hofmann, M. Recrystallization of copper at a solid interface for improved CVD graphene growth. RSC Adv. 2017, 7, 3736–3740. [Google Scholar] [CrossRef] [Green Version]
  23. Li, X.; Cai, W.; An, J.; Kim, S.; Nah, J.; Yang, D.; Piner, R.; Velamakanni, A.; Jung, I.; Tutuc, E.; et al. Large-area synthesis of high-quality and uniform graphene films on copper foils. Science 2009, 324, 1312–1314. [Google Scholar] [CrossRef] [PubMed]
  24. Zhao, L.; Rim, K.T.; Zhou, H.; He, R.; Heinz, T.F.; Pinczuk, A.; Flynn, G.W.; Pasupathy, A.N. Influence of copper crystal surface on the CVD growth of alrge area monolayer graphene. Solid State Commun. 2011, 151, 509–513. [Google Scholar] [CrossRef]
  25. Lu, A.Y.; Wei, S.Y.; Wu, C.Y.; Hernandez, Y.; Chen, T.Y.; Liu, T.H.; Pao, C.W.; Chen, F.R.; Li, L.J.; Juang, Z.Y. Decoupling of CVD graphene by controlled oxidation of recrystallized Cu. RSC Adv. 2012, 2, 3008–3013. [Google Scholar] [CrossRef]
  26. Giovannetti, G.A.K.P.A.; Khomyakov, P.A.; Brocks, G.; Karpan, V.V.; van den Brink, J.; Kelly, P.J. Doping graphene with metal contacts. Phys. Rev. Lett. 2008, 101, 026803. [Google Scholar] [CrossRef] [PubMed]
  27. Vanin, M.; Mortensen, J.J.; Kelkkanen, A.K.; Garcia-Lastra, J.M.; Thygesen, K.S.; Jacobsen, K.W. Graphene on metals: A van der Waals density functional study. Phys. Rev. B 2010, 81, 081408. [Google Scholar] [CrossRef]
  28. Prasai, D.; Tuberquia, J.C.; Harl, R.R.; Jennings, G.K.; Bolotin, K.I. Graphene: Corrosion-inhibiting coating. ACS Nano 2012, 6, 1102–1108. [Google Scholar] [CrossRef] [PubMed]
  29. Chen, S.; Brown, L.; Levendorf, M.; Cai, W.; Ju, S.Y.; Edgeworth, J.; Li, X.; Magnuson, C.W.; Velamakanni, A.; Piner, R.D.; et al. Oxidation resistance of graphene-coated Cu and Cu/Ni alloy. ACS Nano 2011, 5, 1321–1327. [Google Scholar] [CrossRef] [PubMed]
  30. Si, X.; Li, M.; Chen, F.; Eklund, P.; Xue, J.; Huang, F.; Du, S.; Huang, Q. Effect of carbide interlayers on the microstructure and properties of graphene-nanoplatelet-reinforced copper matrix composites. Mat. Sci. Eng. A 2017, 708, 311–318. [Google Scholar] [CrossRef]
  31. Chu, K.; Wang, F.; Wang, X.H.; Huang, D.J. Anisotropic mechanical properties of graphene/copper composites with aligned graphene. Mat. Sci. Eng. A 2018, 713, 269–277. [Google Scholar] [CrossRef]
  32. Wang, X.; Wang, X.; Liu, M.; Crimp, M.A.; Wang, Y.; Qu, Z. Anisotropic thermal expansion coefficient of multilayer graphene reinforced copper matrix composites. J. Alloy. Compd. 2018, 755, 114–122. [Google Scholar] [CrossRef]
  33. Wofford, J.M.; Nie, S.; McCarty, K.F.; Bartelt, N.C.; Dubon, O.D. Graphene island on Cu foils: The interplay between shape, orientation, and defects. Nano Lett. 2010, 10, 4890–4896. [Google Scholar] [CrossRef] [PubMed]
  34. Goli, P.; Ning, H.; Li, X.; Lu, C.Y.; Novoselov, K.S.; Balandin, A.A. Thermal properties of graphene−copper−graphene heterogeneous films. Nano Lett. 2014, 14, 1497–1503. [Google Scholar] [CrossRef] [PubMed]
  35. Zielinski, E.M.; Vinci, R.P.; Bravman, J.C. Effects of barrier layer and annealing on abnormal grain growth in copper thin films. J. Appl. Phys. 1994, 76, 4516–4523. [Google Scholar] [CrossRef]
  36. ASTM E112-13 Standard Test Methods for Determining Average Grain Size; ASTM International: West Conshohocken, PA, USA, 2013.
  37. Malard, L.M.; Pimenta, M.A.A.; Dresselhaus, G.; Dresselhaus, M.S. Raman spectroscopy in graphene. Phys. Rep. 2009, 473, 51–87. [Google Scholar] [CrossRef]
  38. Park, J.S.; Reina, A.; Saito, R.; Kong, J.; Dresselhaus, G.; Dresselhaus, M.S. G’ band Raman spectra of single, double and triple layer graphene. Carbon 2009, 47, 1303–1310. [Google Scholar] [CrossRef]
  39. Kim, D.W.; Kim, Y.H.; Jeong, H.S.; Jung, H.T. Direct visualization of large-area graphene domains and boundaries by optical birefringency. Nat. Nanotechnol. 2012, 7, 29–34. [Google Scholar] [CrossRef] [PubMed]
  40. Simoes, S.; Calinas, R.; Vieira, M.T.; Vieira, M.F.; Ferreira, P.J. In situ TEM study of grain growth in nanocrystalline copper thin films. Nanotechnology 2010, 21, 145701. [Google Scholar] [CrossRef] [PubMed]
  41. Atkinson, H.V. Overview no.65: Theories of normal grain growth in pure single phase systems. Acta Metall. 1988, 36, 469–491. [Google Scholar] [CrossRef]
  42. Balandin, A.A.; Ghosh, S.; Bao, W.; Calizo, I.; Teweldebrhan, D.; Miao, F.; Lau, C.N. Superior thermal conductivity of single-layer graphene. Nano Lett. 2008, 8, 902–907. [Google Scholar] [CrossRef] [PubMed]
  43. Ghosh, D.; Calizo, I.; Teweldebrhan, D.; Pokatilov, E.P.; Nika, D.L.; Balandin, A.A.; Bao, W.; Miao, F.; Lau, C.N. Extremely high thermal conductivity of graphene: Prospects for thermal management applications in nanoelectronic circuits. Appl. Phys. Lett. 2008, 92, 151911. [Google Scholar] [CrossRef]
  44. Aaron, H.B.; Aaronson, H.I. Growth of grain boundary precipitates in Al-4% Cu by interfacial diffusion. Acta Metall. 1968, 16, 789–798. [Google Scholar] [CrossRef]
  45. Speight, M.V. Growth kinetics of grain-boundary precipitates. Acta Metall. 1968, 16, 133–135. [Google Scholar] [CrossRef]
Figure 1. (a) Changes in Cu grains at the surface during the chemical vapor deposition (CVD) process; (b) CVD process conditions. At the time indicated in blue, CH4 was injected as indicated in Table 1.
Coatings 08 00334 g001
Figure 2. (a) Light microscopy (LM) images of Samples A–C, after each CVD cycle. The red shape on each LM image is the shape of the grain (b) X-ray diffraction (XRD) intensity ratios In/I1 (n is the number of CVD cycle) for the (111) peak, for Samples A–C.
Coatings 08 00334 g002
Figure 3. LM images of (a) Sample A, and (b) Sample C. A blue dot represents a grain in the red circle, and a green dot represents a grain that spans the red circle. (c) Calculated grain area after each CVD cycle.
Coatings 08 00334 g003
Figure 4. (a) Raman spectra of Samples A1, A2 (top), and B1, B2 (middle), and C1 (bottom). (b) Polarized Light Microscopy (PLM) images of Samples A1, A3, and C1.
Coatings 08 00334 g004
Figure 5. Pure Cu foil and graphene-covered Cu foil. (a) Plot of lnk against the annealing temperature (1000/T), (b) (DD0) against time, (c) schematic representation of the reasons of the gap between experimental and theoretical values for the graphene-covered Cu in (b).
Coatings 08 00334 g005
Table 1. Sample treatment regarding CH4 injection.
Injected Gas1st Cycle2nd Cycle3rd Cycle
Sample ACH4CH4CH4
Sample BCH4XX
Sample CXXX
X means that no gas was injected.
Table 2. Intensity ratio and full width at half maximum (FWHM) related to Figure 2b.
FWHMI(111)/I(200) RatioFWHM (200)FWHM (111)
Sample A10.01830.260.137
Sample A20.03080.310.105
Sample A30.02160.280.127
Sample C10.03120.270.101
Sample C20.02300.2750.117
Sample C30.04210.270.097

