IPN Polysiloxane-Epoxy Resin for High Temperature Coatings: Structure Effects on Layer Performance after 450 °C Treatment
Abstract
:1. Introduction
2. Materials and Methods
2.1. Materials
- As binder: (IPN polymer resin) the silicone resins (Wacker Silres®, Milano (MI), Italy) and Dow Corning Xiameter® (Midland, MI, USA) and epoxy resins (DOW D.E.R.®, Midland, MI, USA), were added with acrylic resins (BASF, Joncryl®, Ludwigshafen am Rhein, Rhineland-Palatinate, Germany);
- As fillers/pigments: baryte (Aprochimide Baryte, Muggiò (MI), Italy), wollastonite (Nyco Nyad, Hermosillo, Sonora, Mexico), micro mica (Norwegian Talc, N-5355 Knarrevik, Norway), manganese ferrite black spinel (Ferro, Cleveland, OH, USA), and graphene nanoplatelets (Directa Plus, Lomazzo, Italy);
- As additives: benzoin (Miwon Speciality Chemical, Gyeonggi-do, Korea), flow control additive (Estron Chemical, Calvert City, KY, USA) and fluidization additive (Evonik Industries, Essen, Germany).
2.2. Paint Formulations
2.3. Paint Preparation
2.4. Application
2.5. Instrumental Methods
3. Results and Discussion
3.1. Adhesion
3.2. Thermal Analysis
3.3. Film Chemical Composition
3.4. SEM Analysis
4. Conclusions
Acknowledgments
Author Contributions
Conflicts of Interest
References
- Bohm, S. Graphene against corrosion. Nat. Nanotechnol. 2014, 9, 741–742. [Google Scholar] [CrossRef] [PubMed]
- Biller, K. Anticorrosion coating market to reach $31.73 bn by 2022. Focus Powder Coat. 2017, 2017, 6. [Google Scholar]
- Dhoke, S.K.; Palraj, S.; Maruthan, K.; Selvaraj, M. Preparation and characterization of heat-resistant interpenetrating polymer network (IPN). Prog. Org. Coat. 2007, 59, 21–27. [Google Scholar] [CrossRef]
- Sperling, L.H.; Hu, R. Interpenetrating polymer networks. In Polymer Blends Handbook; Utacki, L.A., Wilkie, C., Eds.; Springer: Berlin, Germany, 2014; pp. 677–724. [Google Scholar]
- Kumar, S.A.; Narayanan, T.S.N.S. Thermal properties of siliconized epoxy interpenetrating coatings. Prog. Org. Coat. 2002, 45, 323–330. [Google Scholar] [CrossRef]
- Dhoke, S.K.; Maruthan, K.; Palraj, S.; Selvaraj, M. Performance of black pigments incorporated in interpenetrating polymer network (IPN). Prog. Org. Coat. 2006, 56, 53–58. [Google Scholar] [CrossRef]
- Buxbaum, G. Introduction. In Industrial Inorganic Pigments, 2nd ed.; Wiley–VCH Verlag GmbH: Weinheim, Germany, 1998. [Google Scholar]
- Ahmad, S.; Gupta, A.P.; Sharmin, E.; Alam, M.; Pandey, S.K. Synthesis, characterization and development of high performance siloxane-modified epoxy paints. Prog. Org. Coat. 2005, 54, 248–255. [Google Scholar] [CrossRef]
- Kuilla, T.; Bhadra, S.; Yao, D.; Kim, N.H.; Bose, S.; Lee, J.H. Recent advances in graphene based polymer composites. Prog. Polym. Sci. 2010, 35, 1350–1375. [Google Scholar] [CrossRef]
- Naebe, M.; Wang, J.; Amini, A.; Khayyam, H.; Hameed, N.; Li, L.H.; Chen, Y.; Fox, B. Mechanical property and structure of covalent functionalised graphene/epoxy nanocomposites. Sci. Rep. 2014, 4, 4375. [Google Scholar] [CrossRef] [PubMed]
- Tong, Y.; Bohm, S.; Song, M. Graphene based materials and their composites as coatings. Austin J. Nanomed. Nanotechnol. 2013, 1, 1003. [Google Scholar]
- Teng, C.; Ma, C.M.; Lu, C.; Yang, S.; Lee, S.; Hsiao, M.; Yen, M.; Chiou, K.; Lee, T. Thermal conductivity and structure of non-covalent functionalized graphene/epoxy composites. Carbon 2011, 49, 5107–5116. [Google Scholar] [CrossRef]
- Potts, J.R.; Dreyer, D.R.; Bielawski, C.W.; Ruoff, R.S. Graphene-based polymer nanocomposites. Polymer 2011, 52, 5–25. [Google Scholar] [CrossRef]
- Barletta, M.; Lusvarghi, L.; Pighetti Mantini, F.; Rubino, G. Epoxy-based thermosetting powder coatings: Surface appearance, scratch adhesion and wear resistance. Surf. Coat. Technol. 2007, 201, 7479–7504. [Google Scholar] [CrossRef]
- Belder, E.G.; Rutten, H.J.J.; Perera, D.Y. Cure characterization of powder coatings. Prog. Org. Coat. 2001, 42, 142–149. [Google Scholar] [CrossRef]
- Lee, S.S.; Han, H.Z.Y.; Hilborn, J.G.; Manson, J.E. Surface structure build-up in thermosetting powder coatings during curing. Prog. Org. Coat. 1999, 36, 79–88. [Google Scholar] [CrossRef]
- Giaveri, S. High Temperature Organic Powder Coatings: Characterisation and Innovations. Master’s Thesis, Politecnico di Milano, Milan, Italy, September 2015. [Google Scholar]
- Meng, X.; Zhang, H.; Zhu, J. Characterization of particle size evolution of the deposited layer during electrostatic powder coating processes. Powder Technol. 2009, 195, 264–270. [Google Scholar] [CrossRef]
- Grundke, K.; Michel, S.; Osterhold, M. Surface tension studies of additives in acrylic resin-based powder coatings using the wilhelmy balance technique. Prog. Org. Coat. 2000, 39, 101–106. [Google Scholar] [CrossRef]
- Camino, G.; Lomakin, S.; Lazzari, M. Polydimethylsiloxane thermal degradation Part 1. Kinetic aspects. Polymer 2001, 42, 2395–2402. [Google Scholar] [CrossRef]
- Mazhar, M.; Zulfiqar, M.; Piracha, A.; Ali, S.; Ahmed, A. Comparative thermal stability of homopolysiloxanes and copolysiloxanes of dimethyl/diphenyl silanes. J. Chem. Soc. Pak. 1990, 12, 225–229. [Google Scholar]
- Deshpande, G.; Rezac, M.E. The effect of phenyl content on the degradation of poly (dimethyl diphenyl) siloxane copolymers. Polym. Degrad. Stab. 2001, 74, 363–370. [Google Scholar] [CrossRef]
- Deshpande, G.; Rezac, M.E. Kinetic aspects of the thermal degradation of poly (dimethyl siloxane) and poly (dimethyl diphenyl siloxane). Polym. Degrad. Stab. 2002, 76, 17–24. [Google Scholar] [CrossRef]
- Zhou, W.; Yang, H.; Guo, X.; Lu, J. Thermal degradation behaviours of some branched and linear polysiloxanes. Polym. Degrad. Stab. 2006, 91, 1471–1475. [Google Scholar] [CrossRef]
- Narisawa, M. Silicone resin applications for ceramic precursors and composites. Materials 2010, 3, 3518–3536. [Google Scholar] [CrossRef]
- Bernardo, E.; Fiocco, L.; Parcianello, G.; Storti, E.; Colombo, P. Advanced ceramics from preceramic polymers modified at the nano-scale: A review. Materials 2014, 7, 1927–1956. [Google Scholar] [CrossRef] [PubMed]
- Pantano, C.G.; Singh, A.K.; Zhang, H. Silicon oxycarbide glasses. J. Sol-Gel Sci. Technol. 1999, 14, 7–25. [Google Scholar] [CrossRef]







| Raw Materials | Coating Composition | |||
|---|---|---|---|---|
| ID | ||||
| S4 | S6 | SF1 | SF2 | |
| Phenyl Silicone | 25 | – | – | – |
| Methyl-Phenyl Silicone | – | 25 | 25 | 25 |
| BPA Epoxy Resin | 11 | 11 | 11 | 11 |
| Carboxyl Acrylic Resin | 15 | 15 | 15 | 15 |
| Pigment Black | 1.5 | 1.5 | 1 | 1.2 |
| Fillers (1) | 46.3 | 46.3 | 46.3 | 46.3 |
| Additives (2) | 1.2 | 1.2 | 1.2 | 1.2 |
| Graphene nanoplatelets | – | – | 0.5 | 0.3 |
| Pigments and Fillers | Chemical Analysis | Density (g·cm−3) | Oil Adsorption (g/100 g) | Particle Size (μm) |
|---|---|---|---|---|
| Pigment Black | MnFe2O4 | 4.5 (1) | 48 (2) | 0.5 (3) |
| Baryte | BaSO4 (97%)–SiO2 (2%) | 4.35 (4) | 11 (5) | 4 (6) |
| Micro Mica | KAl2(AlSi3O10)(OH)2 | 0.5 (7) | 49 (8) | 6 (9) |
| Wollastonite | CaSiO3 | 1.04 (10) | 24 (11) | 9 (3) |
| Sample | Classification | Assessment | |
|---|---|---|---|
| Before HT | After HT | ||
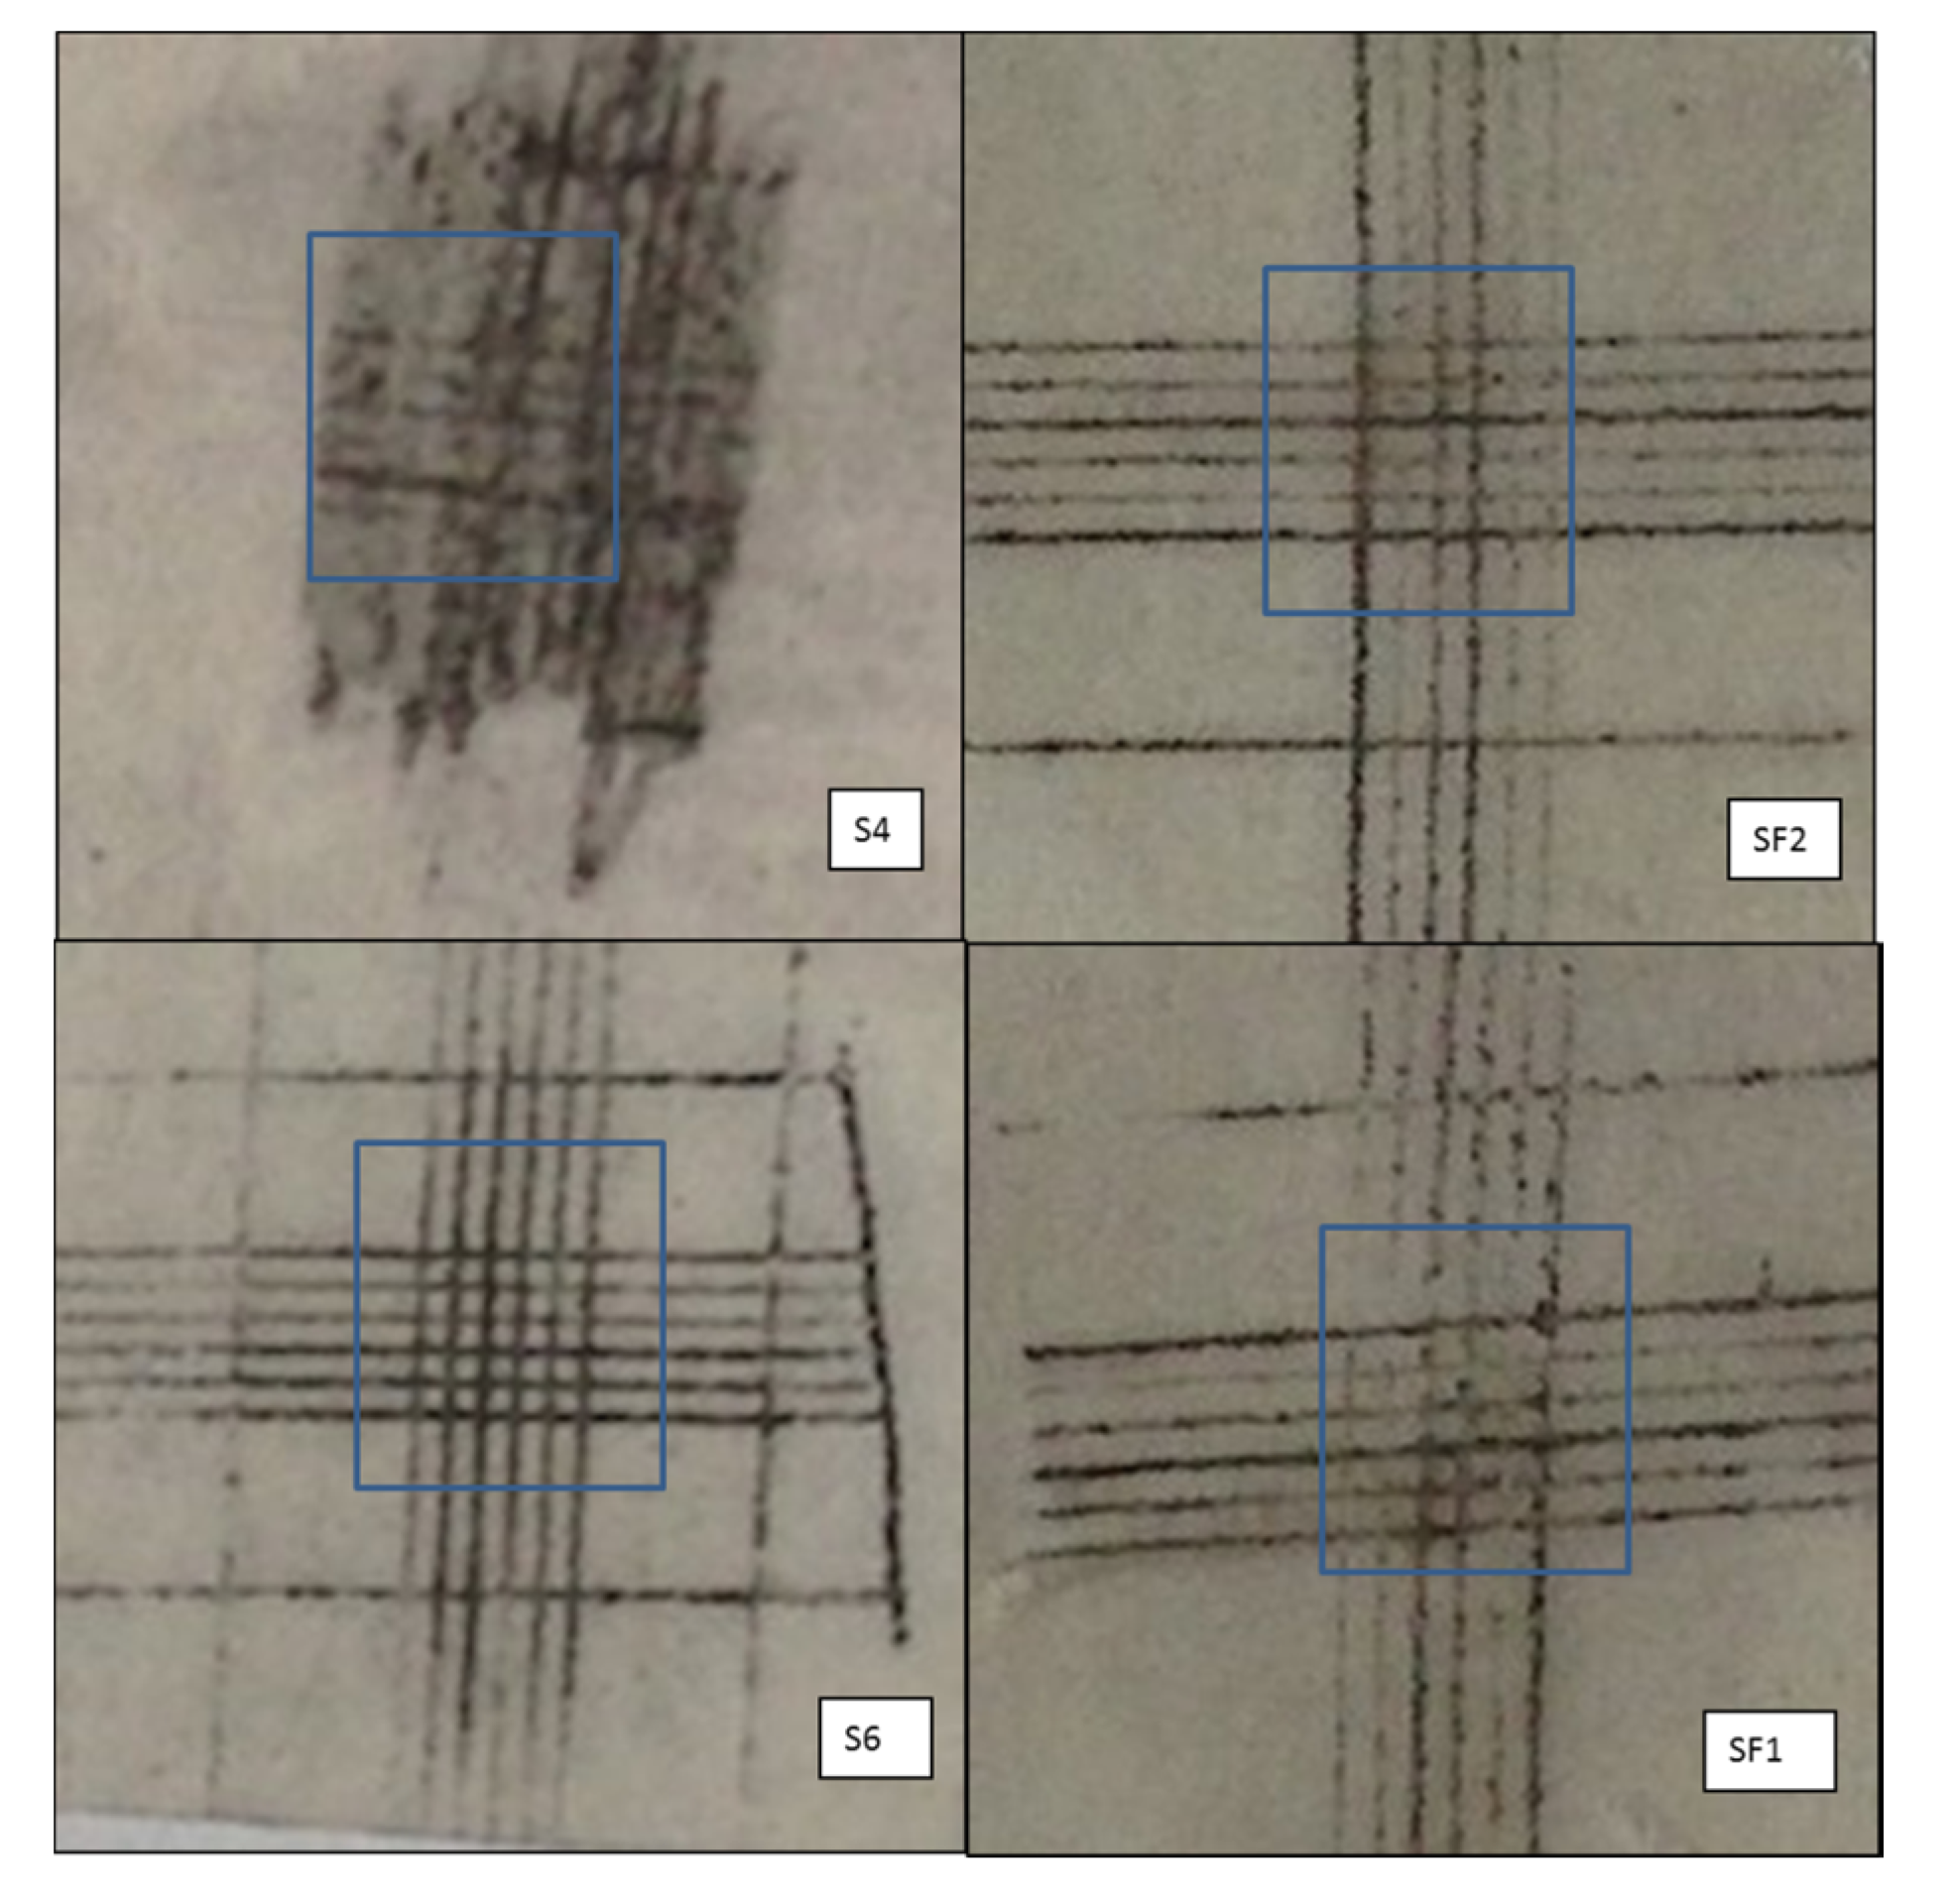
| S4 | 1 | 2 | Before HT: small flake separation (<5% of the analysed area); After HT: The coating has flaked along the edges and/or at the intersections of the cuts. Failure (5–15% of the analysed area) |
| S6 | 0 | 0 | Before/after HT: the edges of the cuts are completely smooth; none of the squares of the lattice is detached |
| SF1 | 0 | 1 | Before HT: the edges of the cuts are completely smooth; none of the squares of the lattice is detached; After HT: small flake separation (<5% of the analysed area) |
| SF2 | 2 | 1 | Before HT: The coating has flaked along the edges and/or at the intersections of the cuts. Failure (5–15% of the analysed area). After HT: small flake separation (<5% of the analysed area). |
| Steps | T (°C) | Weight Loss (wt %) | |||
|---|---|---|---|---|---|
| S4 | S6 | SF1 | SF2 | ||
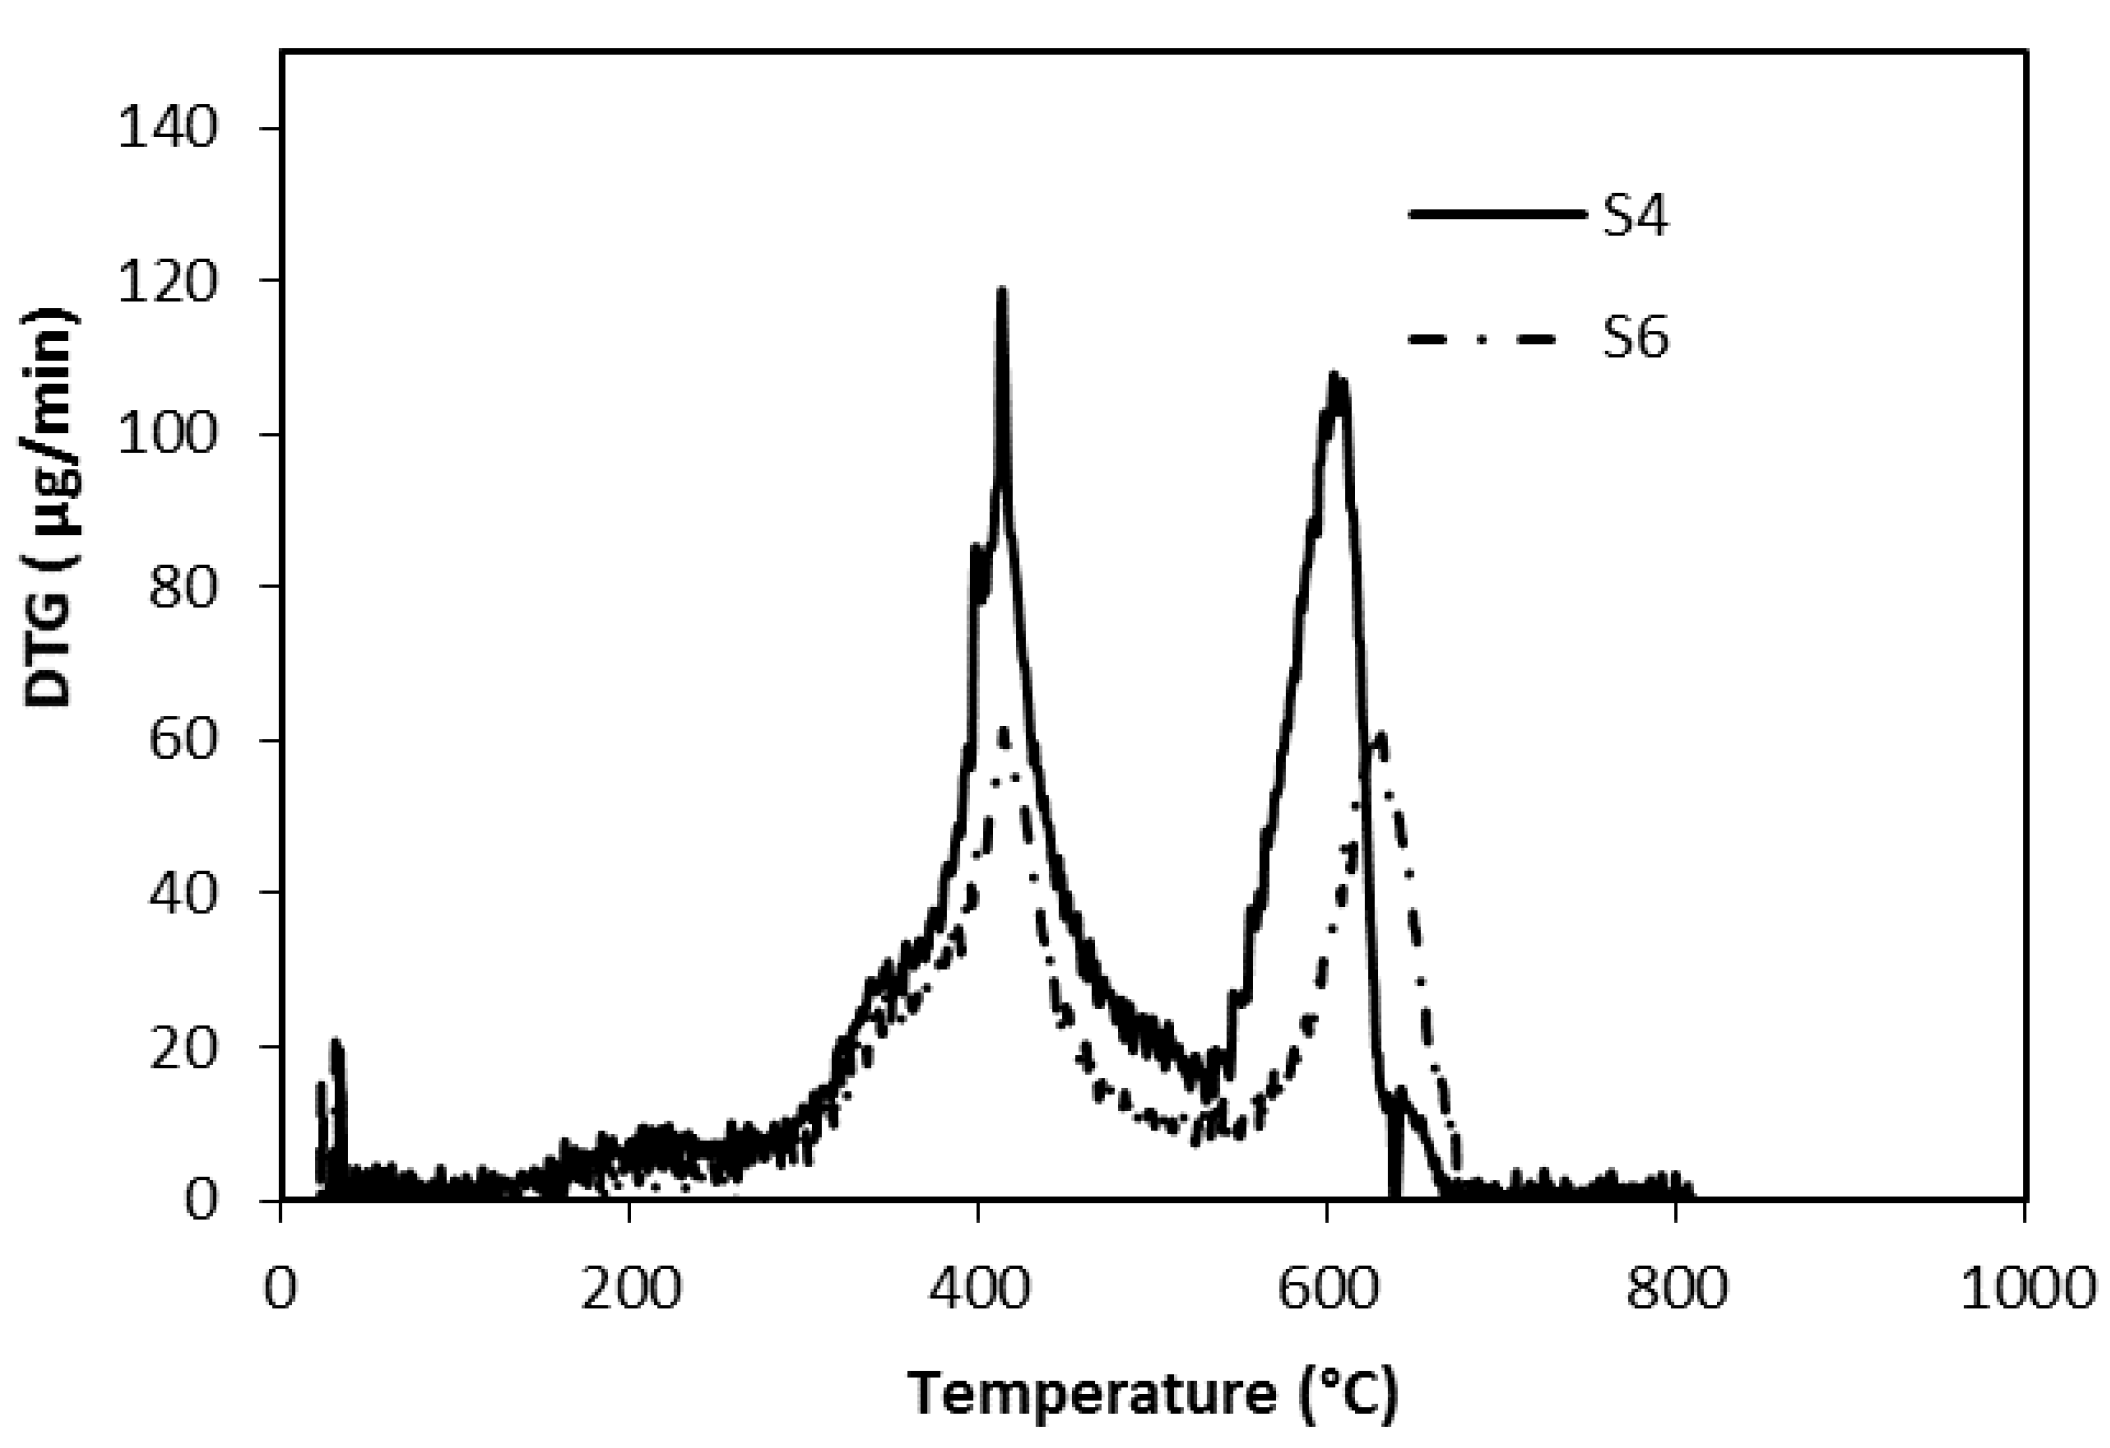
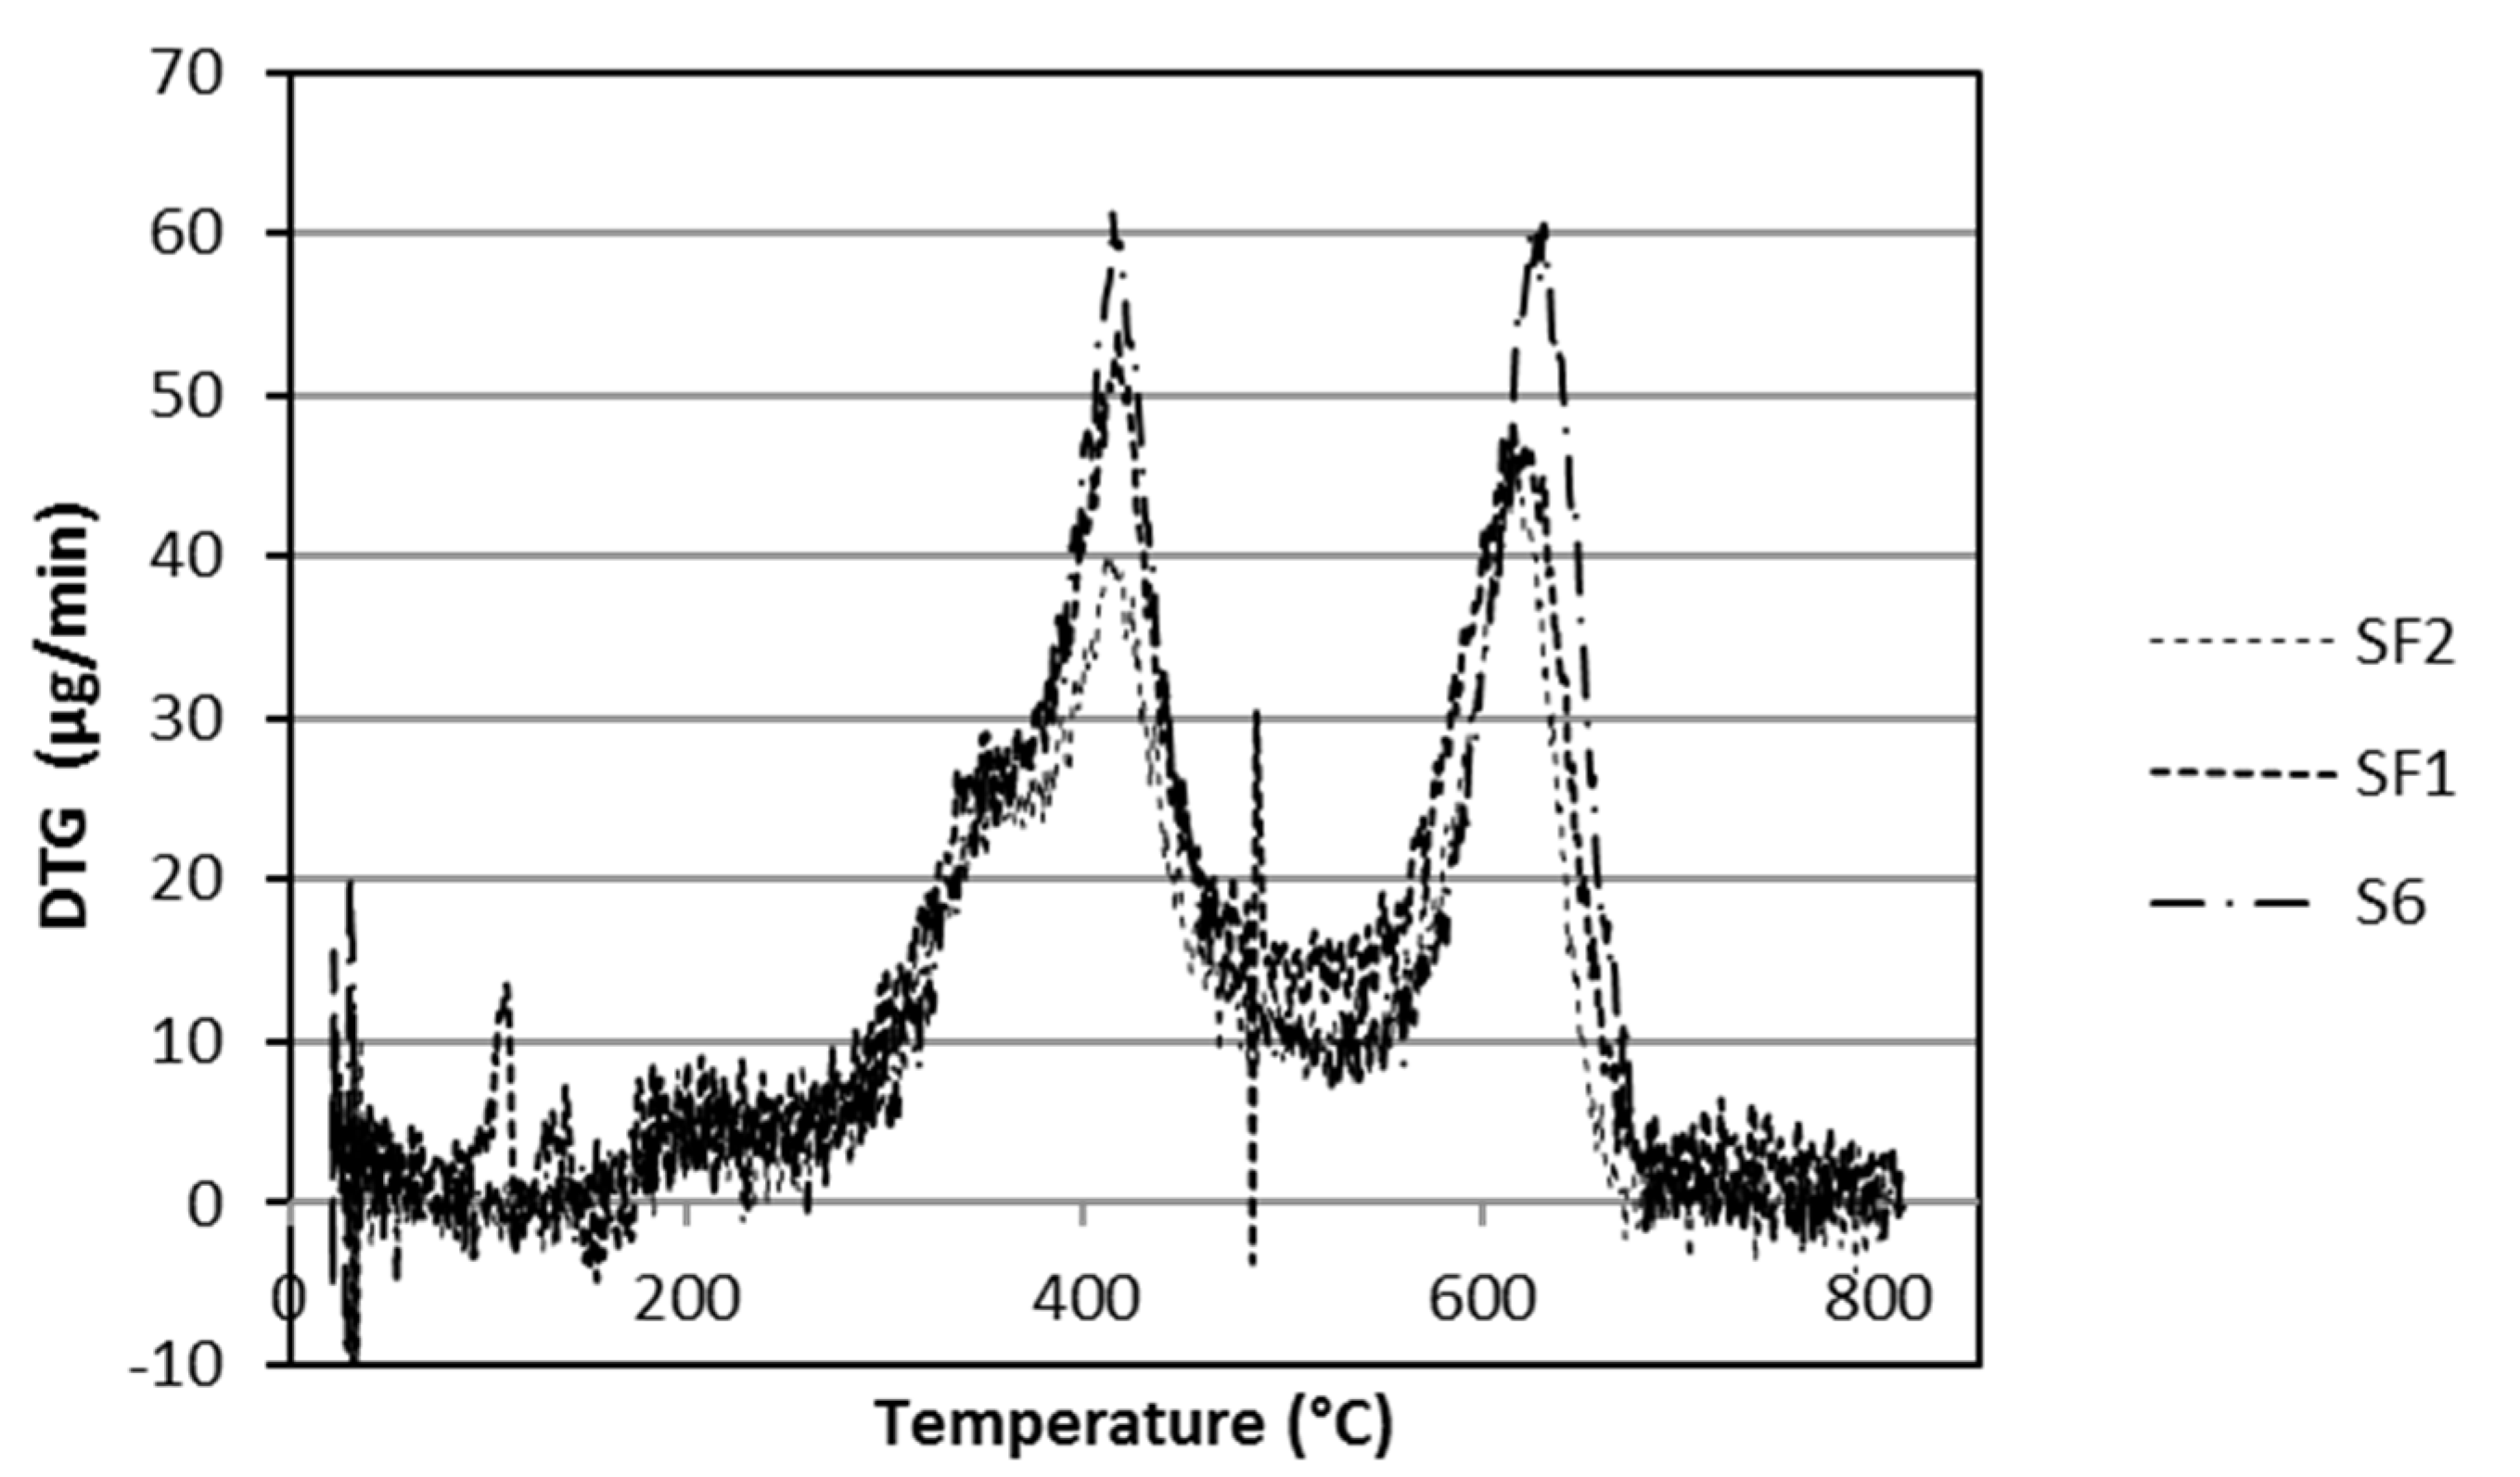
| First step | 280–530 | 15.7 | 21.6 | 22.7 | 20.6 |
| Second step | 530–680 | 11.1 | 14.8 | 14.6 | 12.4 |
| Total | 26.8 | 36.4 | 37.3 | 33.0 | |
© 2017 by the authors. Licensee MDPI, Basel, Switzerland. This article is an open access article distributed under the terms and conditions of the Creative Commons Attribution (CC BY) license (http://creativecommons.org/licenses/by/4.0/).
Share and Cite
Giaveri, S.; Gronchi, P.; Barzoni, A. IPN Polysiloxane-Epoxy Resin for High Temperature Coatings: Structure Effects on Layer Performance after 450 °C Treatment. Coatings 2017, 7, 213. https://doi.org/10.3390/coatings7120213
Giaveri S, Gronchi P, Barzoni A. IPN Polysiloxane-Epoxy Resin for High Temperature Coatings: Structure Effects on Layer Performance after 450 °C Treatment. Coatings. 2017; 7(12):213. https://doi.org/10.3390/coatings7120213
Chicago/Turabian StyleGiaveri, Simone, Paolo Gronchi, and Alessandro Barzoni. 2017. "IPN Polysiloxane-Epoxy Resin for High Temperature Coatings: Structure Effects on Layer Performance after 450 °C Treatment" Coatings 7, no. 12: 213. https://doi.org/10.3390/coatings7120213
APA StyleGiaveri, S., Gronchi, P., & Barzoni, A. (2017). IPN Polysiloxane-Epoxy Resin for High Temperature Coatings: Structure Effects on Layer Performance after 450 °C Treatment. Coatings, 7(12), 213. https://doi.org/10.3390/coatings7120213


