3.2.1. Film Thickness and Crystal Structure Analysis
Since the deposition rate of the SnS-In film is stable, SnS-In/TiO
2 heterostructures with different SnS-In layer thicknesses were prepared by varying the sputtering time of the SnS-In layer. The thicknesses of the SnS-In and TiO
2 layers for each sample are shown in
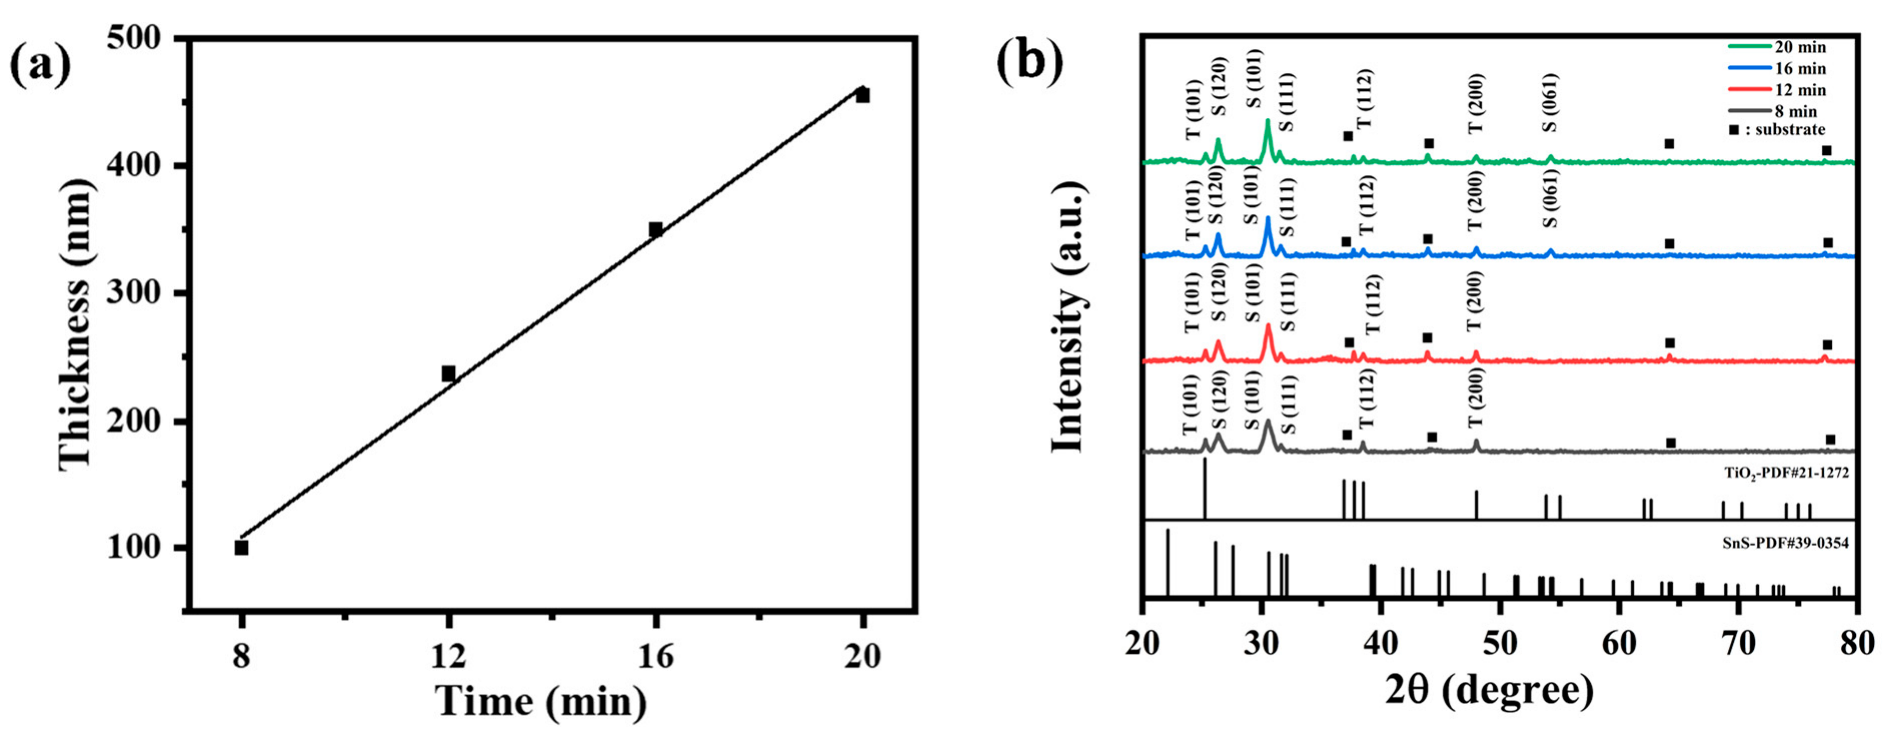
Table 6. The sputtering power of the SnS-In target was held constant at 80 W, and the thickness of the SnS-In layer increased linearly with time, as shown in
Figure 9a. The fitted R
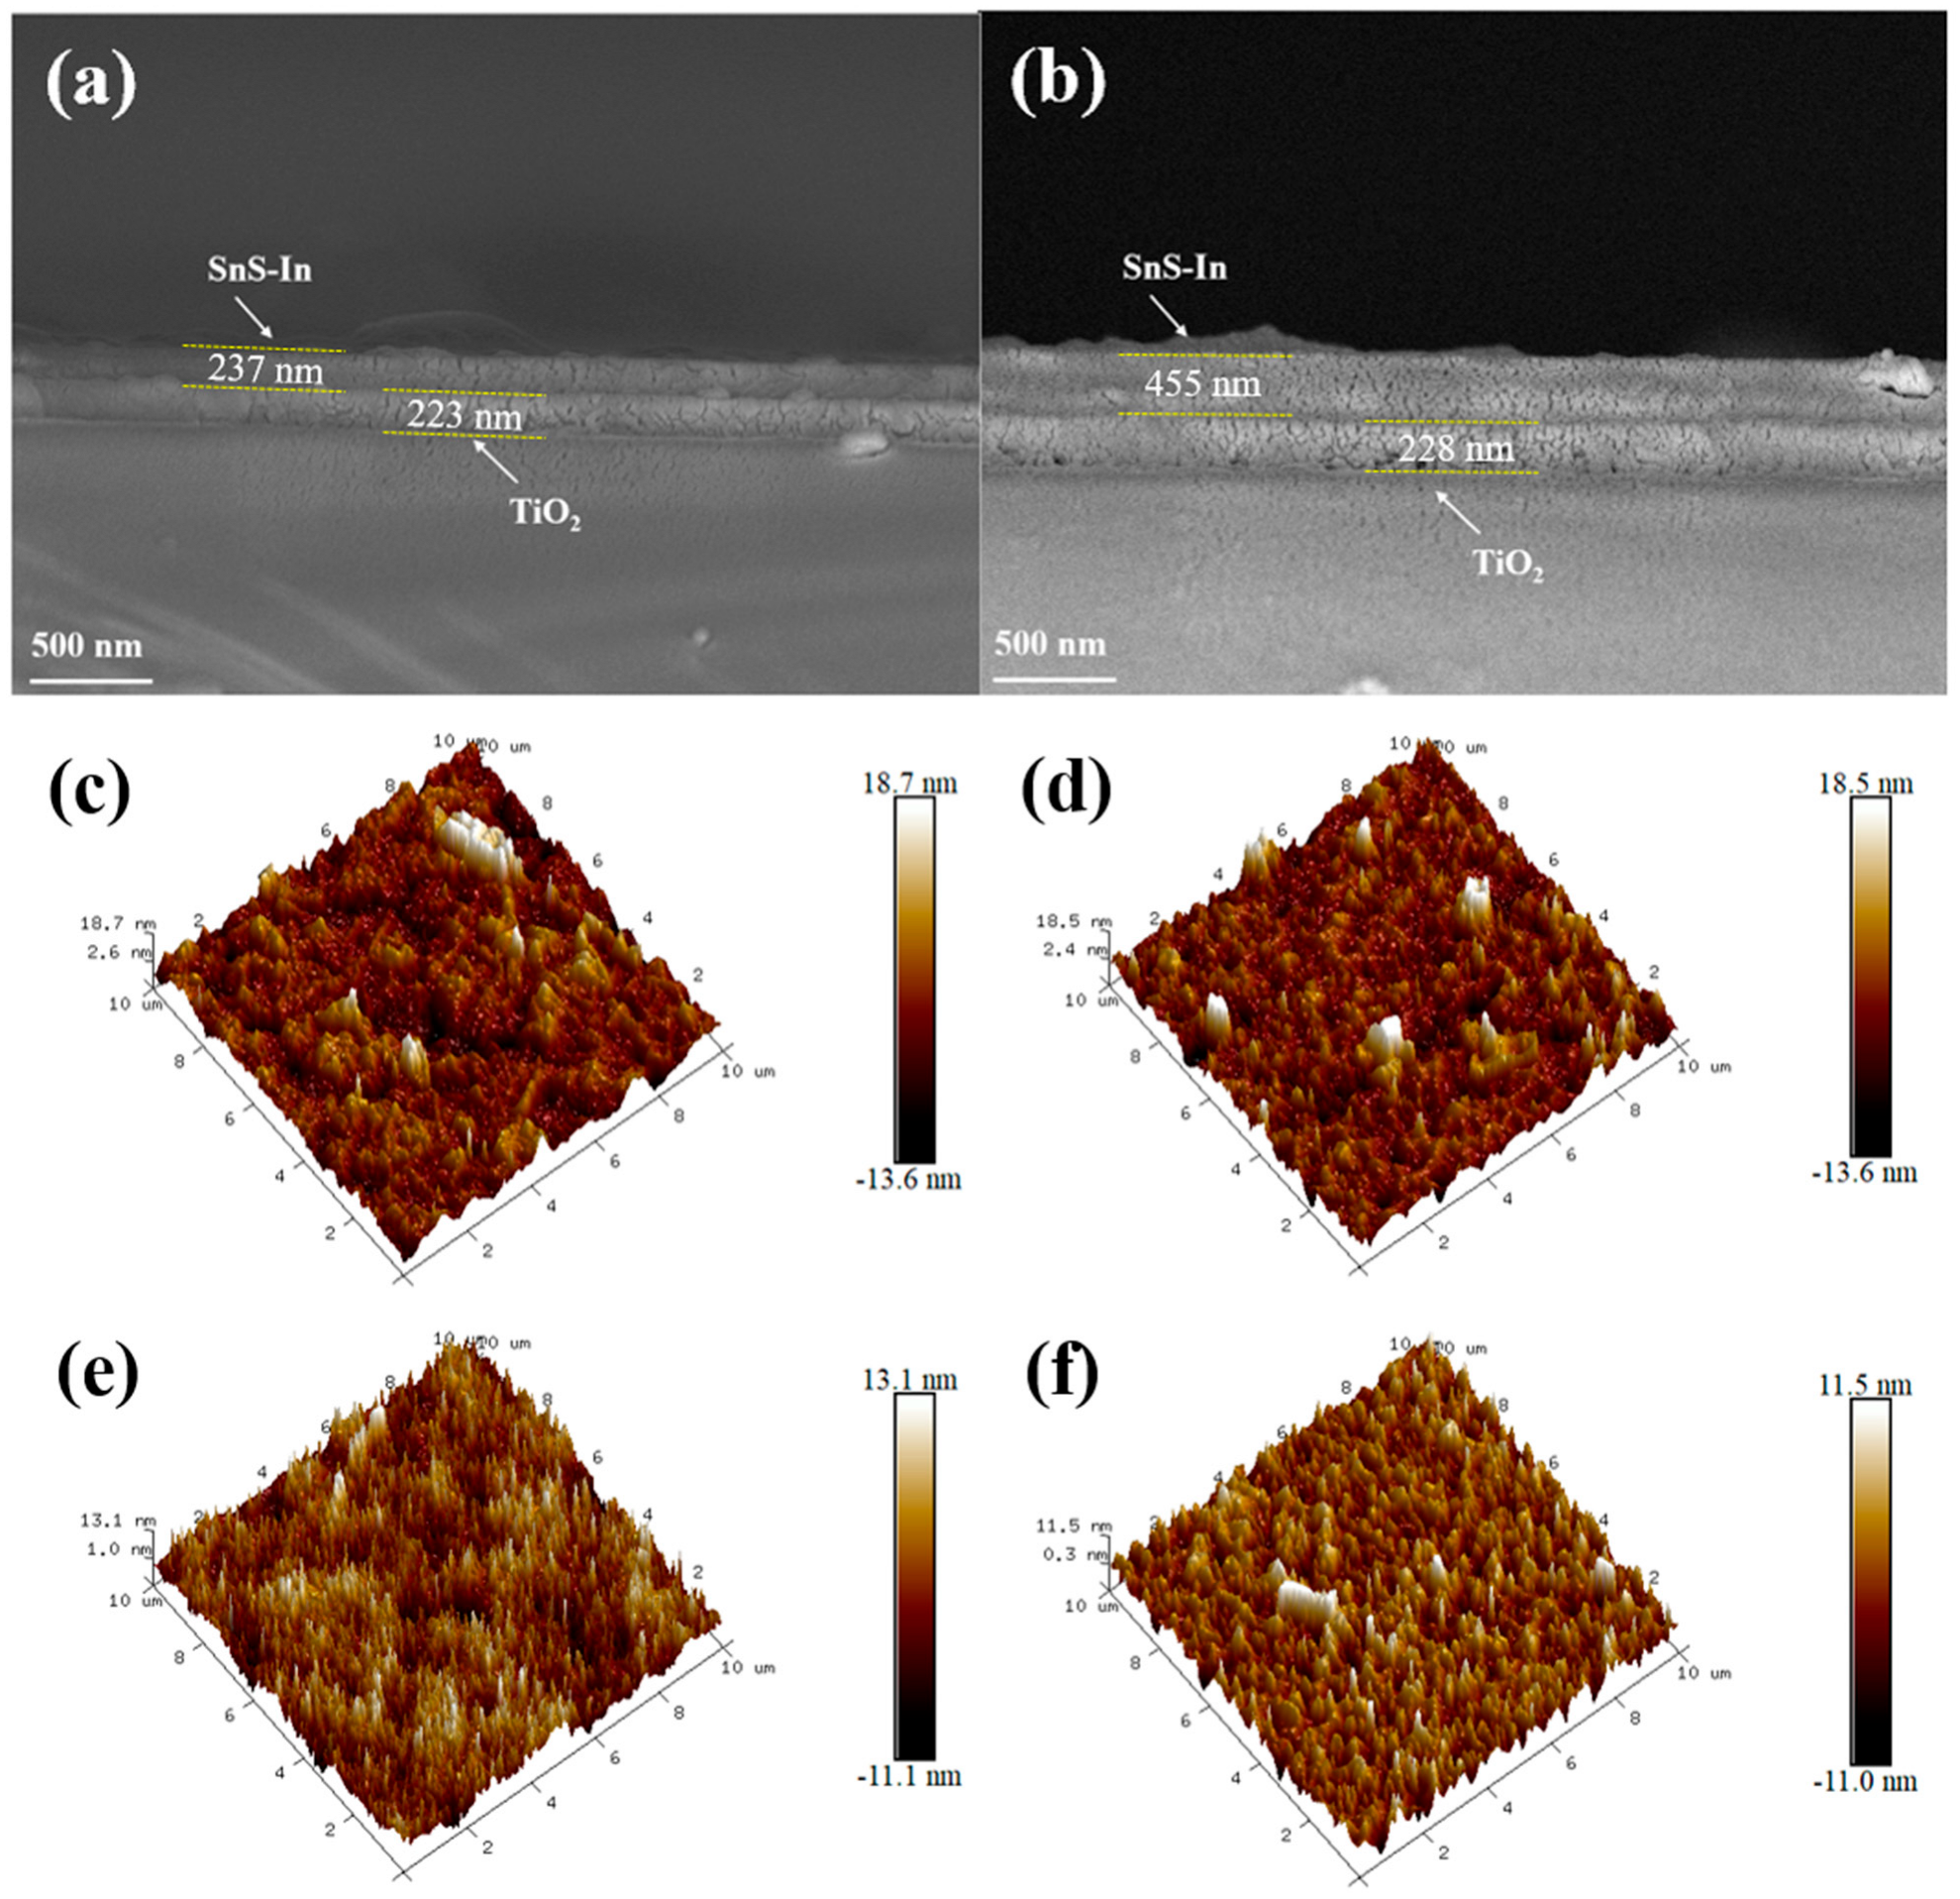
2 value of 0.9942 indicates a good linear relationship between the film thickness and sputtering time. As the deposition time was extended from 8 min to 20 min, the thickness of the SnS-In layer increased from 100 nm to 455 nm. Meanwhile, the thickness of the TiO
2 layer remained essentially unchanged.
Figure 9b shows the XRD patterns of the SnS-In/TiO
2 bilayer films. Diffraction peaks for both SnS and TiO
2 crystals are present in all samples. As the sputtering time is extended, the intensity of the TiO
2 peaks gradually weakens, while the intensity of the SnS peaks progressively increases and their full width at half maximum (FWHM) narrows. This indicates that the crystallinity of the SnS-In layer improves with increasing film thickness. The diffraction peaks of the SnS-In layer correspond well with the standard diffraction card JCPDS No. 39-0354, indicating an orthorhombic polycrystalline structure. Diffraction peaks belonging to the (120), (101), and (111) planes appeared at approximately 26.35°, 30.53°, and 31.61°. For the samples sputtered for 16 min and 20 min, a diffraction peak for the (061) plane also appeared at 54.24°. Additionally, three diffraction peaks belonging to TiO
2 can be observed, which match the standard diffraction card JCPDS No. 21-1272, confirming that the TiO
2 is in the anatase phase. The peaks at 25.30°, 38.52°, and 48.00° correspond to the (101), (112), and (200) planes, respectively.
The grain sizes and strains of both the SnS-In and TiO
2 were calculated [
24,
25], and the lattice constants of both films were determined using the Bragg equation and the interplanar spacing formula [
26,
44]. The calculated structural parameters are listed in
Table 7. The grain size of the TiO
2 films ranges from 27.0 to 27.5 nm, and their lattice constants are in good agreement with the standard values (3.7852 Å × 3.7852 Å × 9.5139 Å).
For the SnS-In layer, as the sputtering time increases from 8 min to 16 min, the grain size increases from 15.6 nm to 20.0 nm, while the strain decreases from 1.01 × 10⁻² to 7.78 × 10⁻³. This is due to the promoting effect of increased film thickness on the crystallization process. When the sputtering time is further extended to 20 min, the extent of grain growth becomes significantly smaller, indicating that the improvement in crystalline quality from increasing film thickness begins to be limited at this point.
For the SnS film, the lattice distortion caused by In-doping disrupts the crystal structure, leading to a reduction in grain size. When deposited on the TiO
2 film, the grain size is further reduced due to the morphological fluctuations of the substrate surface and the lattice constant mismatch [
33]. Consequently, the deviation from the standard lattice constants of SnS crystals (a = 4.3291 Å, b = 11.1923 Å, c = 3.9838 Å) is also further increased.
3.2.4. Optical Absorption Characterization
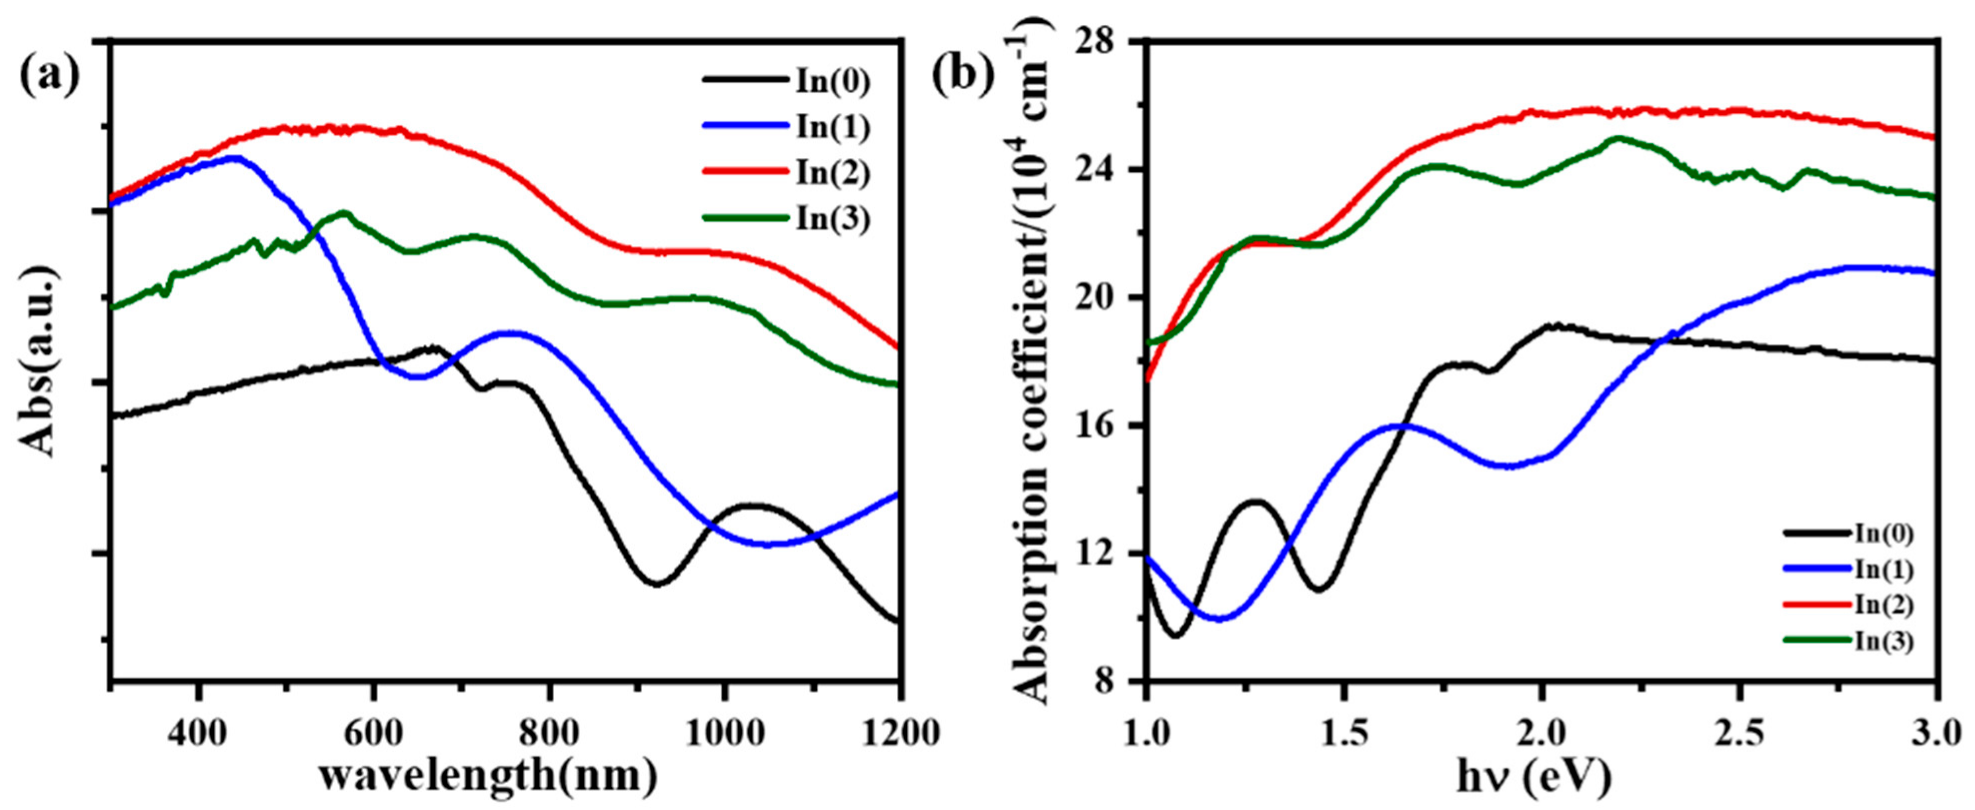
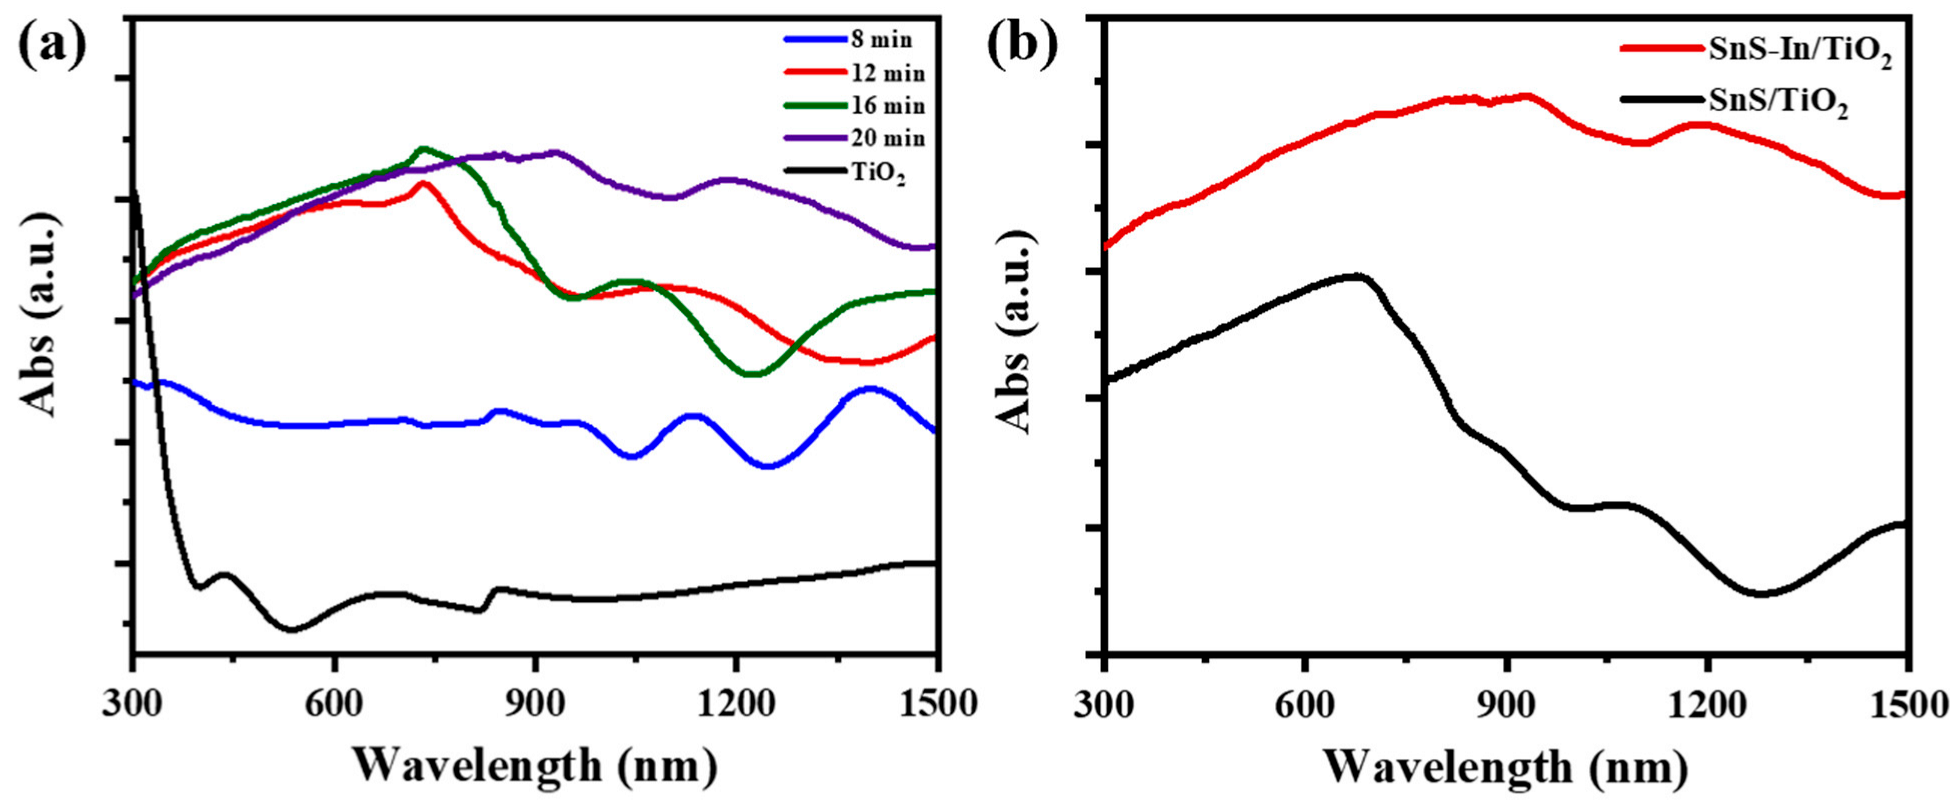
Figure 12a shows the UV-Vis-NIR diffuse reflectance spectra of the SnS-In/TiO
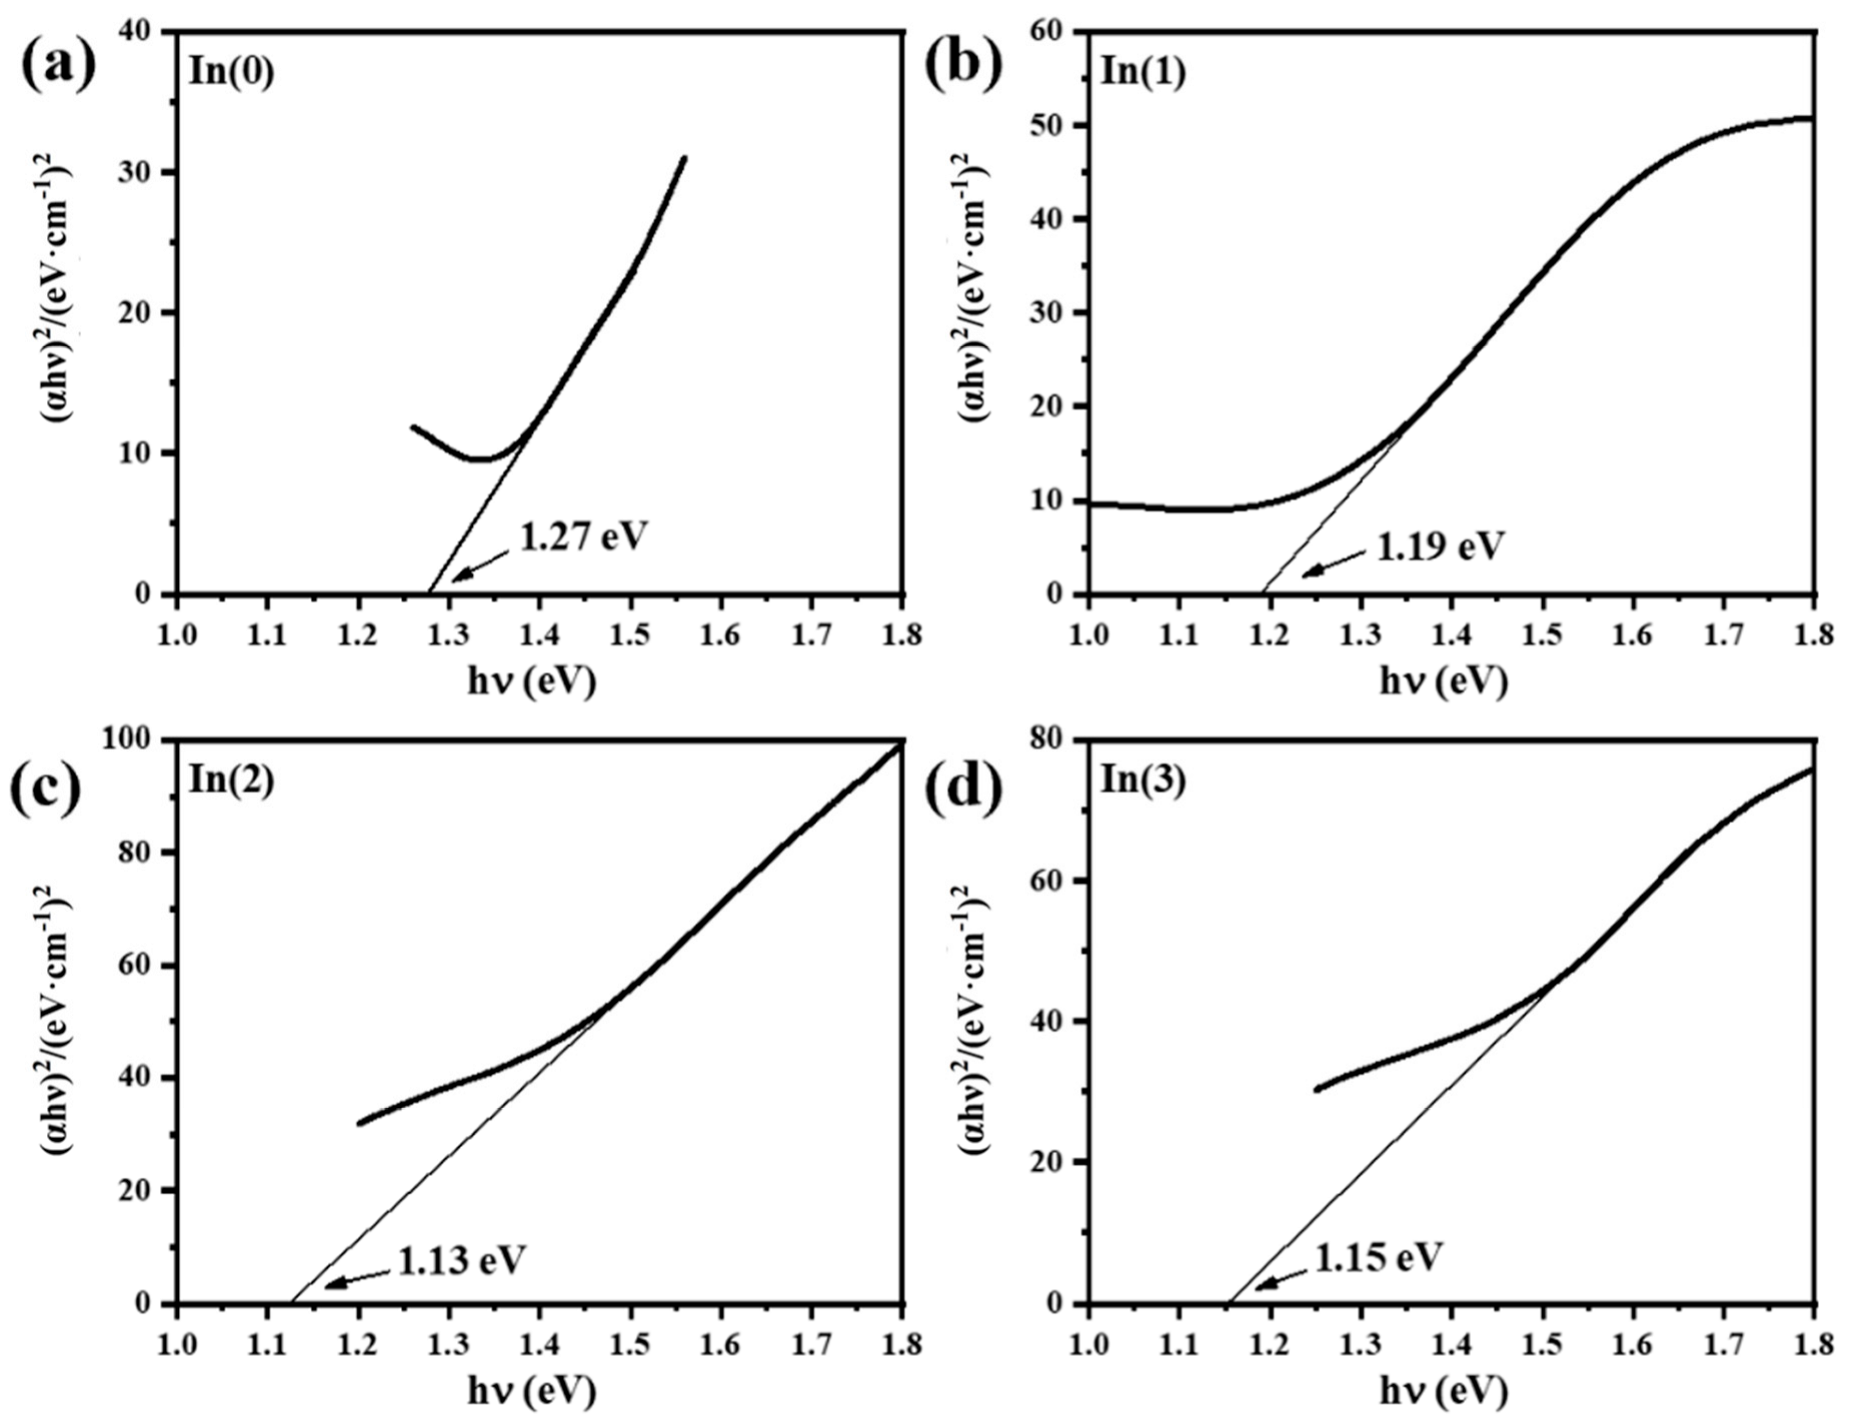
2 heterostructures prepared with different sputtering times for the SnS-In layer. According to the preceding characterization results, the band gap of the SnS-In film, after optimization of the In doping concentration, can be reduced to 1.13 eV. Therefore, when it forms a heterojunction with wide-bandgap TiO
2, the resulting structure exhibits a broadened spectral response range, showing particularly enhanced light absorption properties in the visible light region.
As the sputtering time increases from 8 to 20 min, the absorption intensity shows a clear upward trend across the full spectrum. The enhancement is especially prominent in the 600–1000 nm range, owing to the extended optical path and improved crystallinity.
However, when the sputtering time exceeds 12 min, the rate of absorption enhancement slows down significantly. In the initial stage of increasing film thickness, the light absorption efficiency is significantly improved due to the extended optical path length and the growth of grain size. When the film thickness increases to a certain extent, the light absorption efficiency gradually approaches saturation due to the exacerbation of light scattering effects and interfacial reflection losses [
26,
45].
Figure 12b compares the light absorption curves of the SnS-In/TiO
2 and SnS/TiO
2 structures, where the sputtering time for the light-absorbing layer in both cases is 20 min. Since In-doping can modulate the band structure of SnS and cause band gap shrinkage, incorporating In
3+ into the SnS layer of the heterostructure can further enhance the light absorption performance of the sample [
46].
3.2.5. Photoelectric Performance Characterization
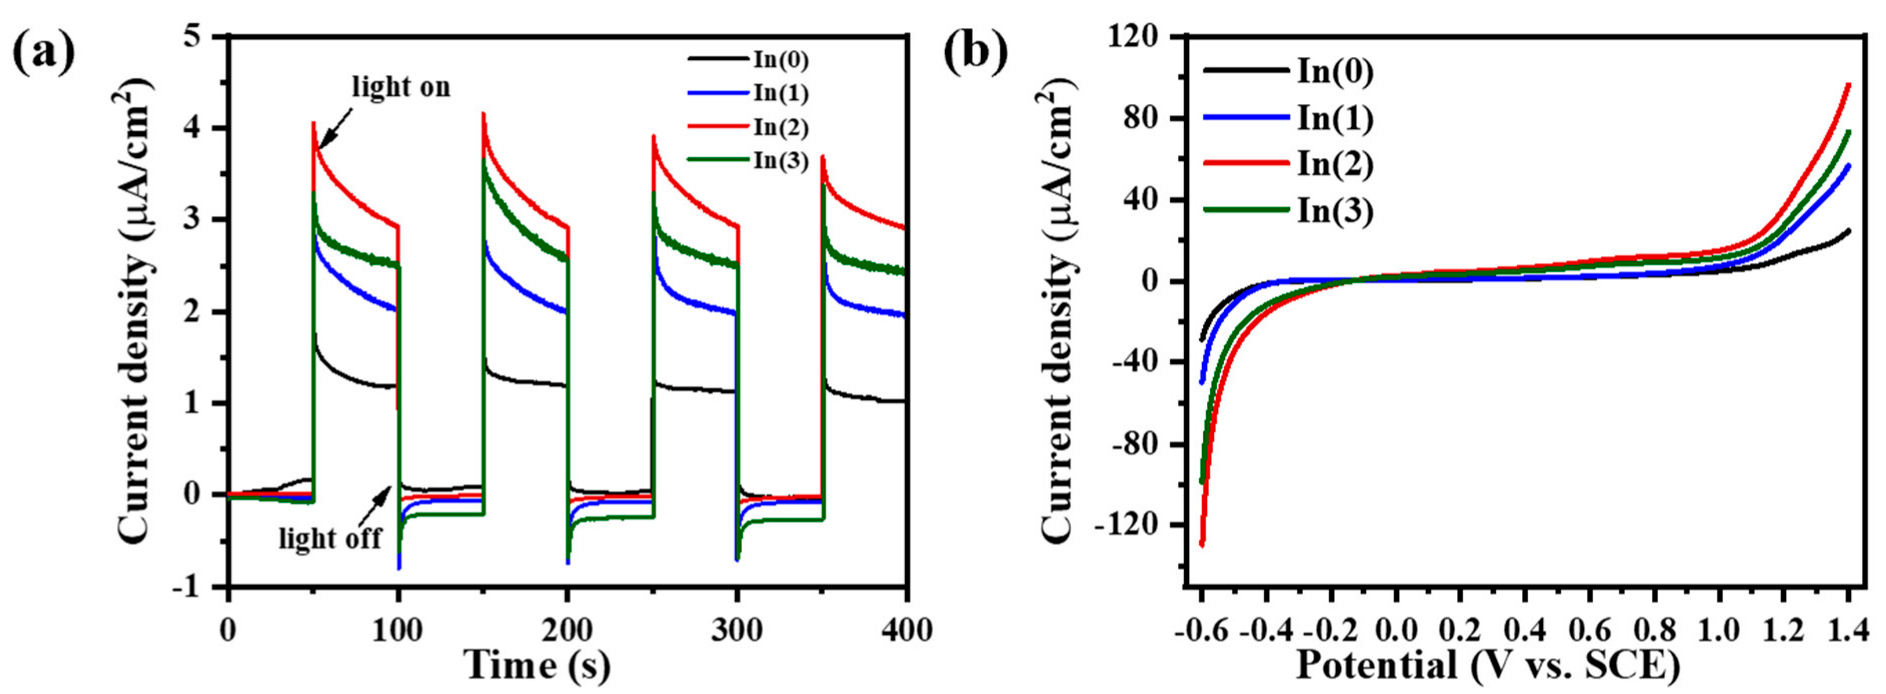
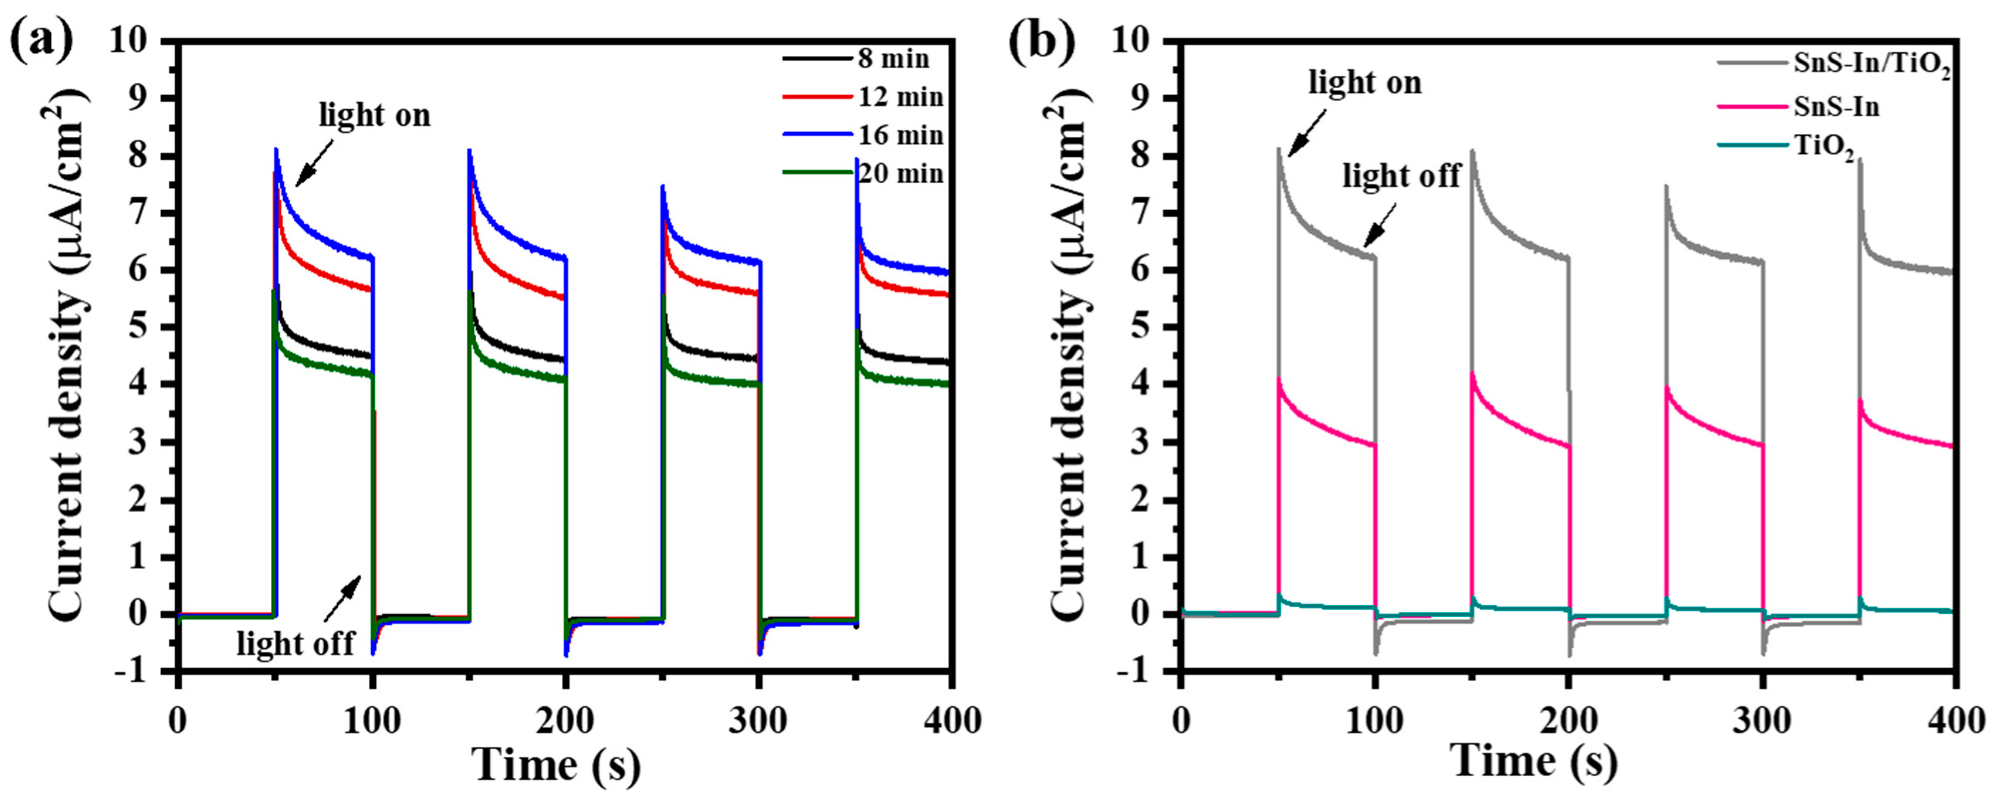
The photoelectric performance of the various samples was characterized under visible light using a three-electrode system, with the photocurrent test results shown in
Figure 13.
Figure 13a shows the current-time curves of the SnS-In/TiO
2 heterostructures prepared with different sputtering times for the SnS-In layer. As the sputtering time increases from 8 min to 16 min, the photocurrent density of the films significantly increases from 4.52 µA/cm
2 to 6.36 µA/cm
2. This is likely due to the improvement in crystalline quality resulting from the increased film thickness, which in turn enhances the light absorption efficiency [
47].
When the sputtering time is extended to 20 min, the photocurrent density of the film drops significantly to 4.40 µA/cm
2, the lowest among all the heterostructure samples. This phenomenon is primarily attributed to the enhanced scattering of charge carriers at grain boundaries and interfaces when the film thickness exceeds the optimal range, leading to a decrease in transport efficiency and, thus, suppressing the charge transport performance [
45]. Furthermore, due to the inherently low carrier mobility, a thicker film prevents some charge carriers from effectively reaching the electrode, which increases the probability of electron-hole recombination and further weakens the device’s photoresponsive capability.
Figure 13b compares the photocurrent of the heterostructure and single-layer films. The sputtering time for the SnS-In layer in the heterostructure was 16 min, and single-layer SnS-In and TiO
2 films of equivalent thickness were prepared as controls. The photocurrent generated by the heterostructure under visible light is significantly higher than that of the single-layer films, being 2.2 times higher than the SnS-In film and 53.0 times higher than the TiO
2 film.
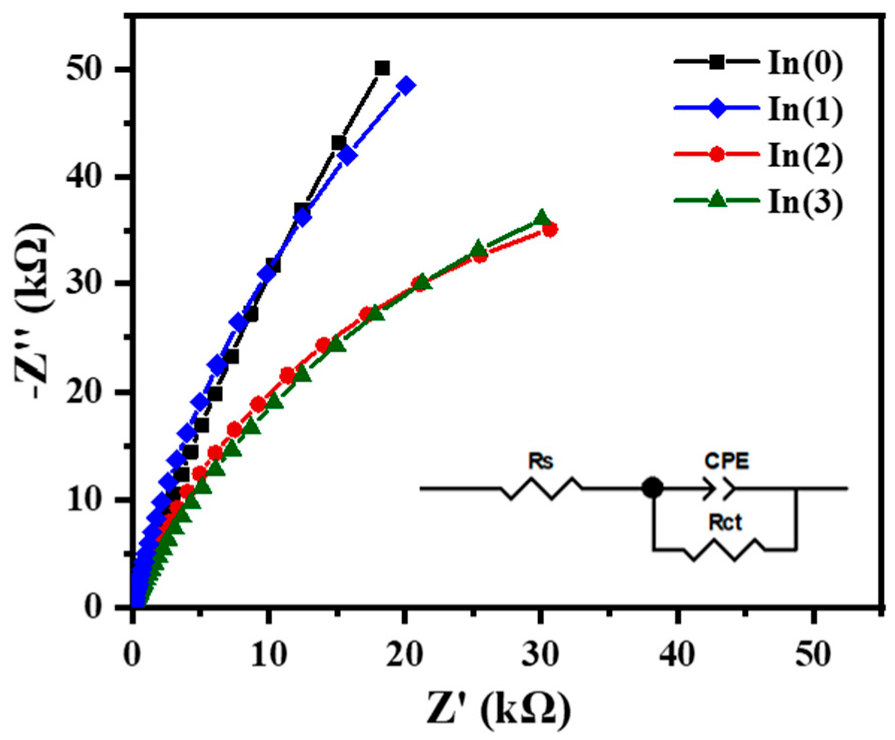
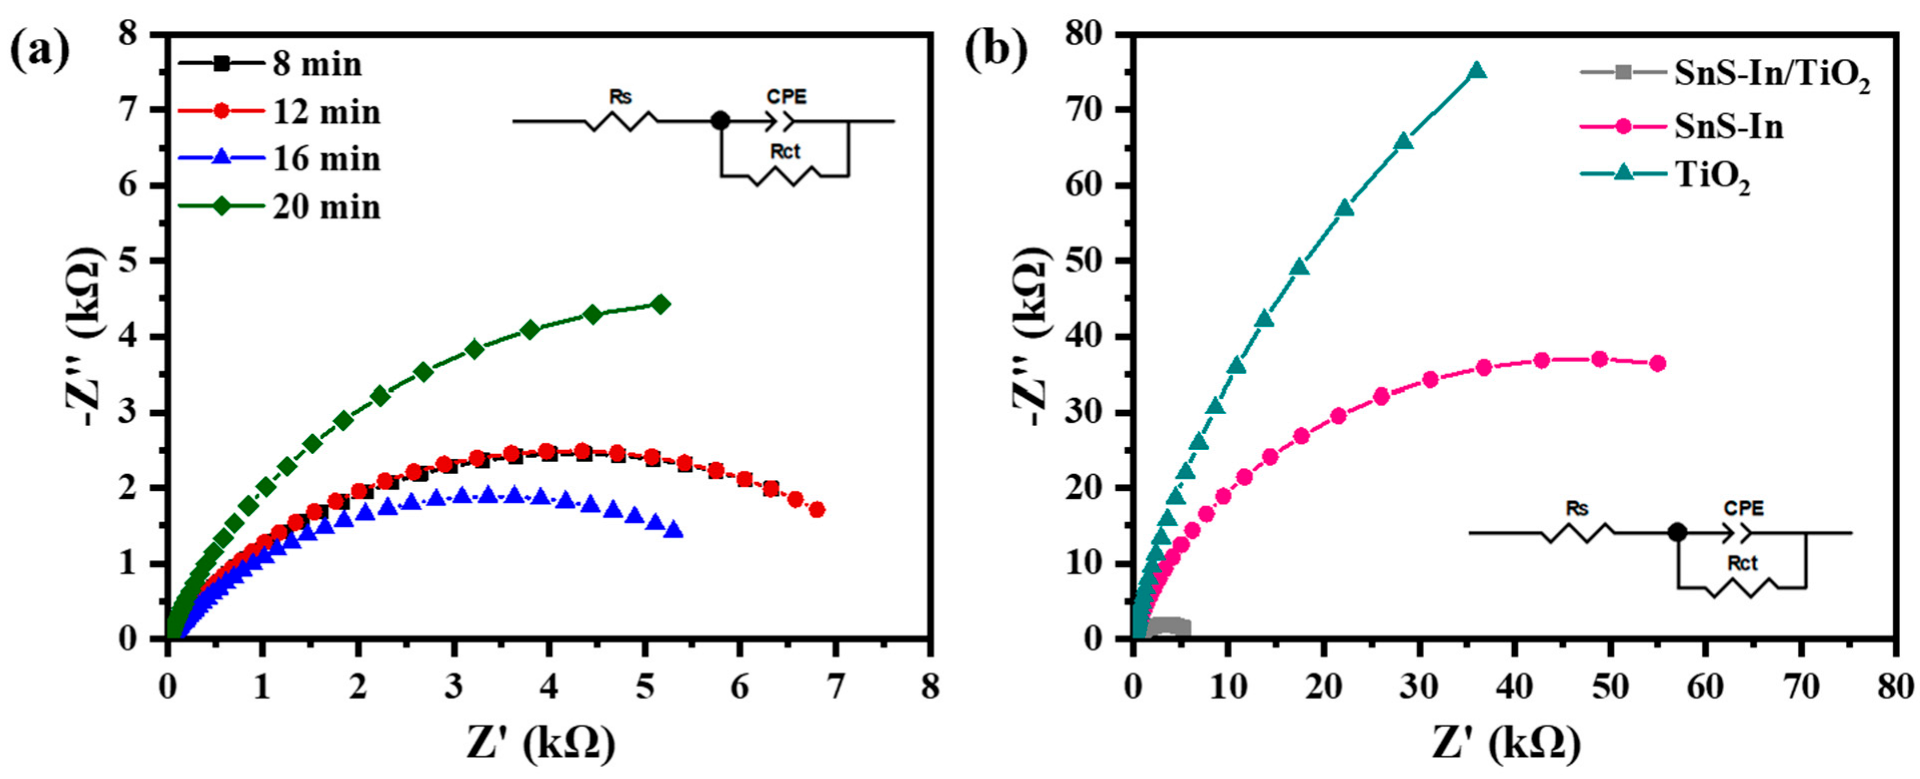
Figure 14 shows the results of the Electrochemical Impedance Spectroscopy (EIS) tests for the various samples. The EIS curves for all samples exhibit a semicircular feature, indicating that the electrochemical reaction kinetics at the semiconductor/electrolyte interface are predominantly governed by the charge transfer process [
41]. The data were fitted using the equivalent circuit shown in the Figure, and the resulting parameters, along with the calculated electron transfer rate constant (k
0) and exchange current density (J
0) are listed in
Table 9.
Compared to the single-layer SnS-In and TiO
2 films, the charge transfer resistance (Rct) for all the heterostructure films is significantly reduced, indicating that this structure plays an important role in promoting charge carrier transport [
41]. Correspondingly, compared to the single-layer films, both the electron transfer rate constant (k
0) and the exchange current density (J
0) at the heterostructure interface are one to two orders of magnitude higher. For the heterostructure films with different SnS-In layer thicknesses, as the sputtering time is extended from 8 min to 16 min, the sample’s charge transfer resistance (R
ct) gradually decreases, reaching a minimum of 6.83 kΩ, while the electron transfer rate constant (k
0) and exchange current density (J
0) increase to 1.916 × 10
−7 m/s and 1.848 × 10
−6 A/cm
2, respectively. However, when the thickness of the SnS-In layer is further increased (sputtering time of 20 min), the sample’s charge transfer resistance (R
ct) rises again to 11.93 kΩ, and the charge transfer efficiency decreases once more.
Our previous work indicated that the SnS/TiO
2 heterostructure exhibited optimal photoelectric performance when the SnS sputtering time was 12 min (thickness of approx. 244 nm) [
21]. Based on this, we compared the performance of the sample prepared with the same sputtering time in the current study with that of the previous optimal sample, with the results shown in
Figure 15. Under comparable absorption layer thicknesses, introducing In-doping into the absorption layer significantly enhances the photocurrent density of the heterostructure under visible light, while simultaneously reducing the interfacial charge transfer resistance and promoting the separation of charge carriers by the heterojunction. For the SnS-In/TiO
2 heterostructure, the photoelectric performance is further enhanced when the sputtering time is 16 min, meaning that after In-doping, the optimal thickness of the SnS absorption layer increases to 350 nm. On one hand, this is because In-doping significantly improves the light absorption performance of the SnS film, which means the SnS-In/TiO
2 heterostructure can utilize incident light more effectively. Therefore, the SnS-In layer requires a greater thickness to fully absorb photons and generate more photogenerated charge carriers [
48]. On the other hand, In-doping optimizes the carrier mobility of the SnS layer, allowing it to maintain high carrier transport efficiency even at greater thicknesses without significantly increasing recombination losses [
49,
50].
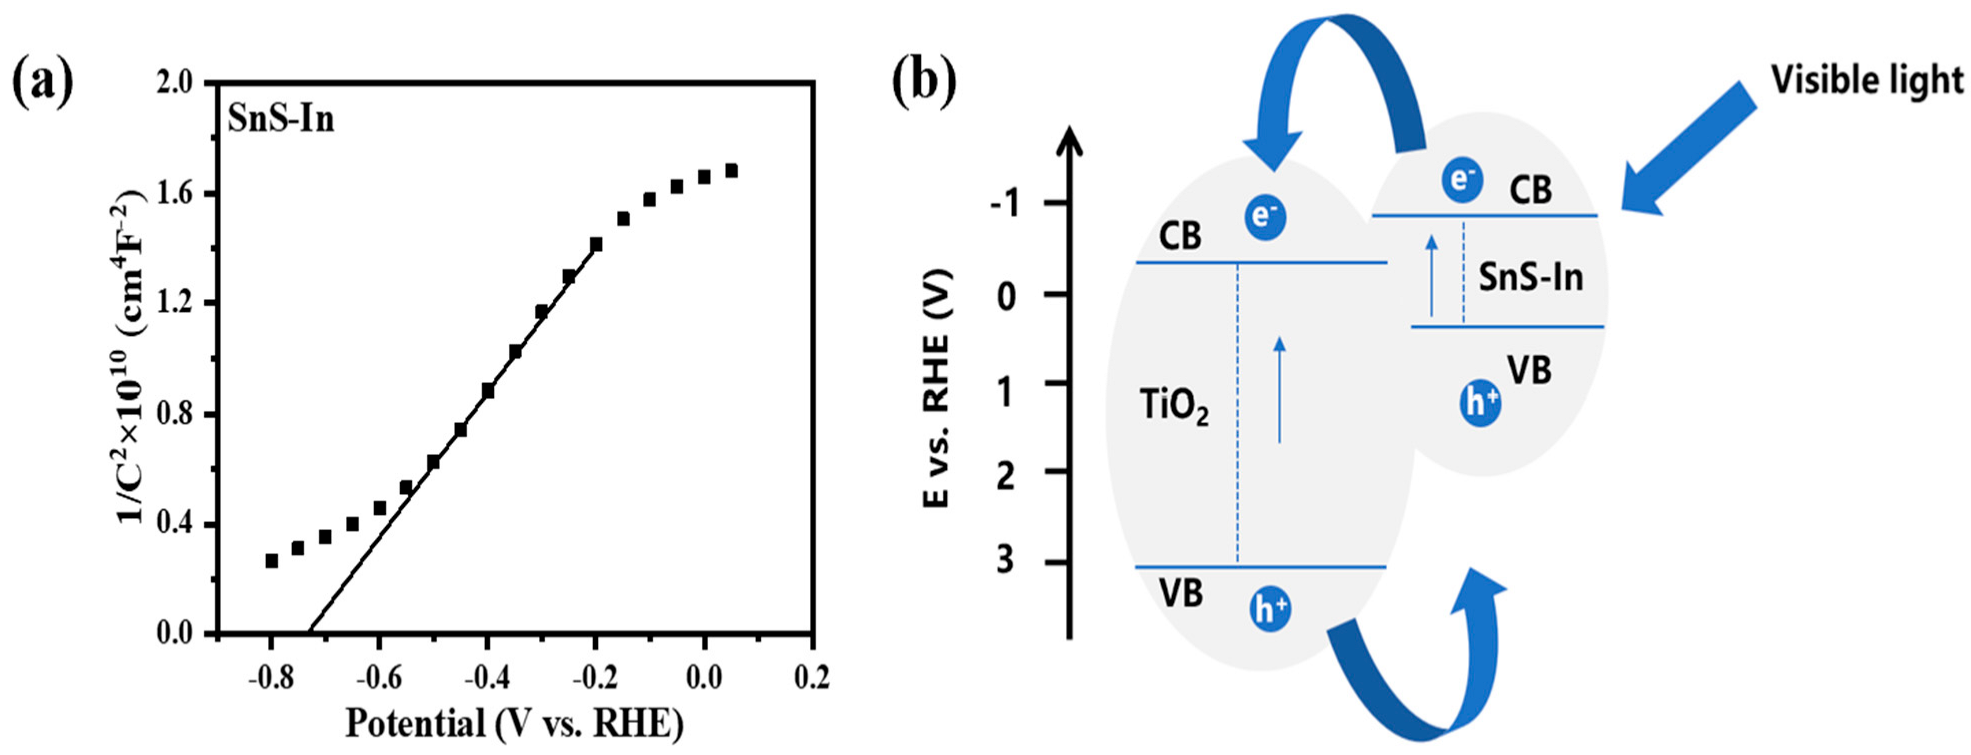
A Mott–Schottky (M-S) test was performed on the sample with an In doping concentration of 4.93%, and the resulting curve is shown in
Figure 16a. By extrapolating the linear portion of the curve to the
x-axis intercept, the flat-band potential (V
fb) of the sample can be obtained. From this, the flat-band potential of the In-doped SnS film was determined to be −0.73 V. For an n-type semiconductor, the conduction band potential (E
CB) can be approximated as the flat-band potential (V
fb) [
51]. Combined with the band gap width obtained from UV-Vis-NIR spectroscopy, the valence band potential (E
VB) of the In-doped SnS film was calculated to be 0.40 V using Equations (5) and (6) [
52]. Combining this with the previously determined band positions of the TiO
2 film, a band structure diagram for the SnS-In/TiO
2 heterostructure was constructed, as shown in
Figure 16b. Compared to the undoped SnS film, In-doping causes the conduction band potential of the film to shift to a more negative direction, which may have a certain impact on the transfer of electrons to TiO
2. However, according to the final photoelectric performance test results, In-doping significantly increases the carrier concentration and conductivity of SnS, which is sufficient to offset the negative effects brought about by the change in the conduction band position.
