Article

On the Possibility of Improving Surface Geometrical Texture During High-Performance Machining of Aluminium Without the Use of Coolant

1
AE Group Poland, 3 Jednosci Robotniczej St., 66-500 Strzelce Krajenskie, Poland
2
Faculty of Mechanical Engineering and Mechatronics, West Pomeranian University of Technology in Szczecin, 19 Piastow Ave., 70-310 Szczecin, Poland
*
Author to whom correspondence should be addressed.
Coatings 2025, 15(8), 971; https://doi.org/10.3390/coatings15080971
Submission received: 25 July 2025 / Revised: 14 August 2025 / Accepted: 15 August 2025 / Published: 20 August 2025
(This article belongs to the Special Issue Micro- and Nano- Mechanical Testing of Coatings and Surfaces)

Abstract

Sustainable production and material recycling as well as minimising energy input are the most important challenges of modern production engineering. Despite the accelerating development of incremental shaping technologies, machining is still an indispensable component of many machine part manufacturing processes. Like other manufacturing techniques, machining also has a significant impact on the environment, which should be reduced. One factor that has a negative impact on energy resources and the environment is the use of cutting fluids during machining. In this study, it was investigated whether it is possible to completely eliminate coolant in high-performance machining of parts made of aluminium and to what extent this limitation would affect changes in the shaped geometrical texture of the surface. To this end, experimental studies were carried out under industrial conditions, the results of which should be used in industrial production. The recommendations developed can influence the economic efficiency of mass production carried out in the automotive, engineering or aerospace sectors. The effect of the coolant on changes in the height indices and the unevenness of the surface geometrical texture as well as on changes in the indices describing its function was investigated. It was demonstrated that it is possible to perform high-performance dry machining without deteriorating surface geometrical texture. The effectiveness of dry milling is limited by the degree of surface unevenness when very high cutting speeds are used.

1. Introduction

The development of industry and technology in the broadest sense has had a significant impact on improving human living conditions [1]. This has happened through easier access to information, improved communication and also the automation and robotisation of various human activities [2,3]. In addition to the benefits brought by the development of technology, there are a number of negative impacts. One of the most important of these is increased industrial production, one of the biggest downsides of which is the adverse impact on the environment [4,5]. In this respect, a shortage of electricity is already being felt in many countries, as well as increasingly difficult access to natural resources (both renewable and non-renewable) [6,7]. For some time now, growing human awareness has resulted in a focus around measures to reduce pollution from industrial production [8,9]. However, the problems associated with industrial production, which are already occurring and will certainly occur in the future, are and will be impossible to completely prevent. More extensive information on the environmental and human impact of machining is written in Appendix A.
Aluminium alloys can be cut by, among other things, cemented carbides [10,11]. The carbides offered on the market are characterised by resistance to temperatures of up to approximately 1000 °C. Therefore, cutting of aluminium alloys at temperatures of up to 700 °C can be carried out without significant loss of productivity. The second most commonly used tool material in aluminium machining is polycrystalline diamond [12,13]. It is most commonly used for finishing parts made of aluminium alloys with silicon. For machining alloys with low silicon content (less than 10%), tools without protective coatings but with a polished cutting face are used. In contrast, tools with protective coatings [14] are used for machining aluminium alloys with a higher silicon content. Series production of aluminium alloy parts is based primarily on high-performance machining (HPM). Due to the much higher process parameter values and the large depth of cut in this case, the cutting tools must be characterised by a special design (with a larger number of blades while maintaining the same face diameter) [15].
In the machining of aluminium and its alloys, coolant that is precisely applied to the chip formation area allows a reduction in the temperature, friction and control of the chip shape. Higher cutting speeds can then be used without risking deterioration of tool life and the condition of the surface geometrical texture (SGT) [16]. Dry machining of aluminium alloys, on the other hand, is possible due to the relatively low temperature during cutting and the high strength of the cutting tools. However, such machining is relatively unpopular. This is due to concerns about the condition of SGT and the durability of the tools [17].
Meanwhile, machining without coolant has many advantages. First and foremost, it allows for a reduction in costs (due to the absence of coolant and facilities for its regeneration and disposal). The implementation of sustainable production that is environmentally friendly allows companies operating in the European Union to obtain concessions and exemptions from some of their operating costs. Such production is also safer for the operator.
Opponents of dry cutting point out that it can lead to a reduction in tool life (due to wear caused by adhesion and diffusion) [18,19], a reduction in dimensional/shape accuracy and a deterioration in roughness [20,21]. At the same time, there are works which claim that by dry cutting it is possible to achieve a product state similar to that of cooled cutting but through a much cheaper process. For example, in order to remove the fluid from the finishing turning process, without compromising tool life and cutting time and improving surface roughness and power consumed, it is necessary to increase the feed and radius of the tool cutting edge and reduce the cutting speed [22]. The forces generated during machining are relatively small and can additionally decrease with increasing cutting speed [23]. Furthermore, when dry cutting aluminium alloys, the values of the generated forces can be reduced by using tools with a special rake surface structure [24,25,26,27] or with a diamond-like carbon coating [28]. During experiments with dry machinable tool coatings, it was also discovered that trace amounts of free machining elements in the aluminium alloy significantly improved dry machinability [29]. It is also worth noting that one way to improve the dry cutting of engineering materials is to use external energy sources to assist the dry machining process [30]. Some examples of key energy-assisted dry machining are ultrasonic vibration-assisted machining [31] and laser-assisted machining [32].
In the literature on the subject, there are papers related to the study of the machining of cast aluminium alloys under dry turning conditions (see, for instance, [33,34]) and dry drilling conditions (see, for instance, [35,36]). However, there are still a limited number of works related to the study of the HPM process of cast aluminium alloys under dry milling conditions. The process of re-sharpening a tool on a dry machining machine for aluminium alloys using the phenomenon of liquid metal embrittlement was presented by Sugihara et al. [37,38]. Hricova et al. [39] investigated the optimal cutting parameters for an AlMgSi alloy (EN-AW 6060), using uncoated cemented carbide end mills. The effects of tool geometry (helix angle) and cutting conditions (cutting speed and feed rate) on surface finish during dry and wet milling at high speed were evaluated. Zaghbani and Songmene [40] developed an analytical model of cutting forces for dry milling of aluminium alloys at high cutting speeds. The proposed model requires knowledge of workpiece material properties and cutting conditions to estimate cutting forces and temperature during the milling process. In contrast, a parametric model of the behaviour of cutting forces as a function of feed rate and cutting speed for high-speed circumferential milling of UNS A92024-T3 (Al-Cu) stacks is presented in [41]. Relationships have been established to approximate the values of the force components for machining conditions dependent on these variables.
Khettabi et al. [42] conducted a study to optimise dry and minimum quantity lubrication (MQL) processes (additionally see Appendix A) for high-speed machining of three types of aluminium alloys, 7075, 6061 and 2024. They showed that, in certain situations, the dry process can be competitive with wet or MQL processes. Experimental results have shown that MQL milling can be interesting in terms of strength or surface finish, but when particle emissions are taken into account, dry machining is superior. Dry machining is also more favourable for different lubrication modes at very high speeds. A similar comparative analysis of dry machining and machining according to the MQL method, but for parts made of Al 7050-T7451 aluminium alloy, was performed by Chirita et al. [43]. From their analyses, it emerged that the surface roughness after milling mainly depended on the feed per blade and the cooling method. For feeds per blade up to about 0.16 mm, a higher surface roughness was obtained for dry milling. For feeds per blade above 0.16 mm, a higher surface roughness was obtained for milling according to the MQL method. Experimental studies on the emission of fine and ultrafine metallic dust during high-speed milling of 6061-T6 aluminium alloy under wet and dry conditions are described in [44]. It was confirmed that nanoparticles as small as 10 nm are generated during the machining process and that the cutting conditions have no significant effect on the characteristics of the generated nanoparticles. It was shown that most of the dust generated is due to deformation in the primary shear zone. Furthermore, the percentage of dust generated is significantly influenced by deformation conditions in the chip formation zone. It was found that high cutting speeds can reduce the percentage of particles generated during the milling process.
In the papers published to date, the 2D surface profiles of aluminium alloys after dry machining have been mainly studied [45,46,47,48,49,50]. The evaluation of SGT parameters based on 3D measurements has been performed much less frequently. Korzeniewski and Znojkiewicz [51] investigated the surfaces of an aluminium–ceramic composite after milling under various conditions, including dry milling. They analysed the effect of varying process parameters such as cutting speed, feed per blade, the depth of cut and the width of cut. The result of their paper is a description of the values of SGT parameters in relation to milling parameters. In order to add to the literature on the HPM process and its effect on 3D SGT changes in industrial conditions, our own study was performed, the results of which are presented in this paper. It was demonstrated that it is possible to perform high-performance dry machining without deteriorating SGT. Our research thus confirmed the possibility of reducing the negative impact of the HPM process on humans and the environment in the case of commonly performed surface milling operations.

2. Materials and Methods

In addition to achieving the right dimensional and shape accuracy, obtaining the right surface quality and roughness is also a very important aspect of machining. The most important factors that determine surface quality and roughness are the technical condition of the machine and the values of the technological cutting parameters, which include the cutting speed and feed rate [52,53]. In milling operations, attention should also be paid to the thickness of the cut layer and the type of milling (i.e., whether it is co-rotating or counter-rotating). Changing these parameters significantly affects SGT.
The body-type part shown in Figure 1 was tested. The body was made from EN AC Al Si9Cu3 (Fe) cast aluminium alloy. The chemical composition of the aluminium alloy is shown in Table 1. The alloy from which the tested part was made is characterised by good mechanical properties and high strength while retaining ductile properties. In addition, the material has enhanced wear and abrasion resistance and is a well-cut material.
This research was conducted under industrial conditions, while the developed experimental plan was carried out twice, i.e., with coolant (C-samples) and under dry cutting conditions (D-samples).
Dry HPM efficiency tests were carried out during a face milling operation at a depth of ap = 5.0 mm. The developed experimental plan assumed two cutting speeds—see Table 2.
The technological parameters in Table 2 were selected so as to ensure a constant volumetric cutting process efficiency when machining samples AC1 to AC3 (and AD1 to AD3). In samples BC1 and BC3 (as well as BD1 and BD3), the influence of cutting speed, vc, was examined in dry and wet milling. On the other hand, using samples AC2 and BC2 (as well as AD2 and BD2) at a constant cutting volume, the influence of feed per blade, fb, was examined.
A Sandvik CoroMill 390 four-blade face milling cutter (Sandvik Group, Stockholm, Sweden) was used to machine the part (Figure 2a). The quantities characterising the selected tool were the following: tool face diameter (dc) = 40 mm and axial rake angle (αo) = 22°. The tool body was equipped with Sandvik CoroMill 390 11T3 carbide cutting inserts (Sandvik Group, Stockholm, Sweden), for which the effective the cutting edge length l = 10 mm, corner radius rε = 0.4 mm, viper edge length bs = 0.9 mm, engagement angle kr = 90° and insert rake angle αn = 25°. The cutting inserts used were coated with PVD TiAlN [54]. One set of dry and wet cutting inserts was used during the experimental tests. At the end of the tests, there was no form of wear indicating the need to replace the inserts with new ones.
Machining was carried out on a Heller H2000 four-axis milling machining centre with a horizontal spindle (Heller Holding SE & Co., Nürtingen, Germany)—see Figure 2b. During machining, it was also possible to feed coolant through the spindle with a pressure of up to 70 bar. In addition, the space in the machining booth during some of the tests was cleaned of swarf and cooled by coolant supplied through pipes around the spindle.
The required roughness condition for the tested surface (defined in the documentation) was Ra ≤ 1.6 μm. The machining fluid used in this study was QUAKERCOOL 7101 ALF emulsion (Quaker Chemical Corporation, Conshohocken, PA, USA) [55].
SGT condition investigations were performed using a Mitutoyo Quick Vision WLI machine (Mitutoyo Corporation, Sakado, Japan). Measurements were made using a QV-WLI A-25X interferometric lens (Mitutoyo Corporation, Sakado, Japan). Due to the ribbed nature of the machined surface, all measurements were carried out on 1.5 mm × 0.3 mm fields, which were always based in the same way (see Figure 1b). Thus, with a constant cutting tool trajectory, changes occurring in exactly the same part of the machined surface were tracked in all cases. The scanning resolution in the XZ plane (marked in Figure 1b) was assumed to be 0.2 μm × 0.2 μm, resulting in a point cloud size of 11.25 million points. The data obtained was processed using MCubeMAP Ultimate software in MountainsMAP ver. 8.1 technology (Mitutoyo Corporation, Sakado, Japan). The mapped surface was levelled with the mean plane approximated by the least-squares method. The values of selected SGT indices were then determined according to the ISO 25178 family of standards [56,57,58].
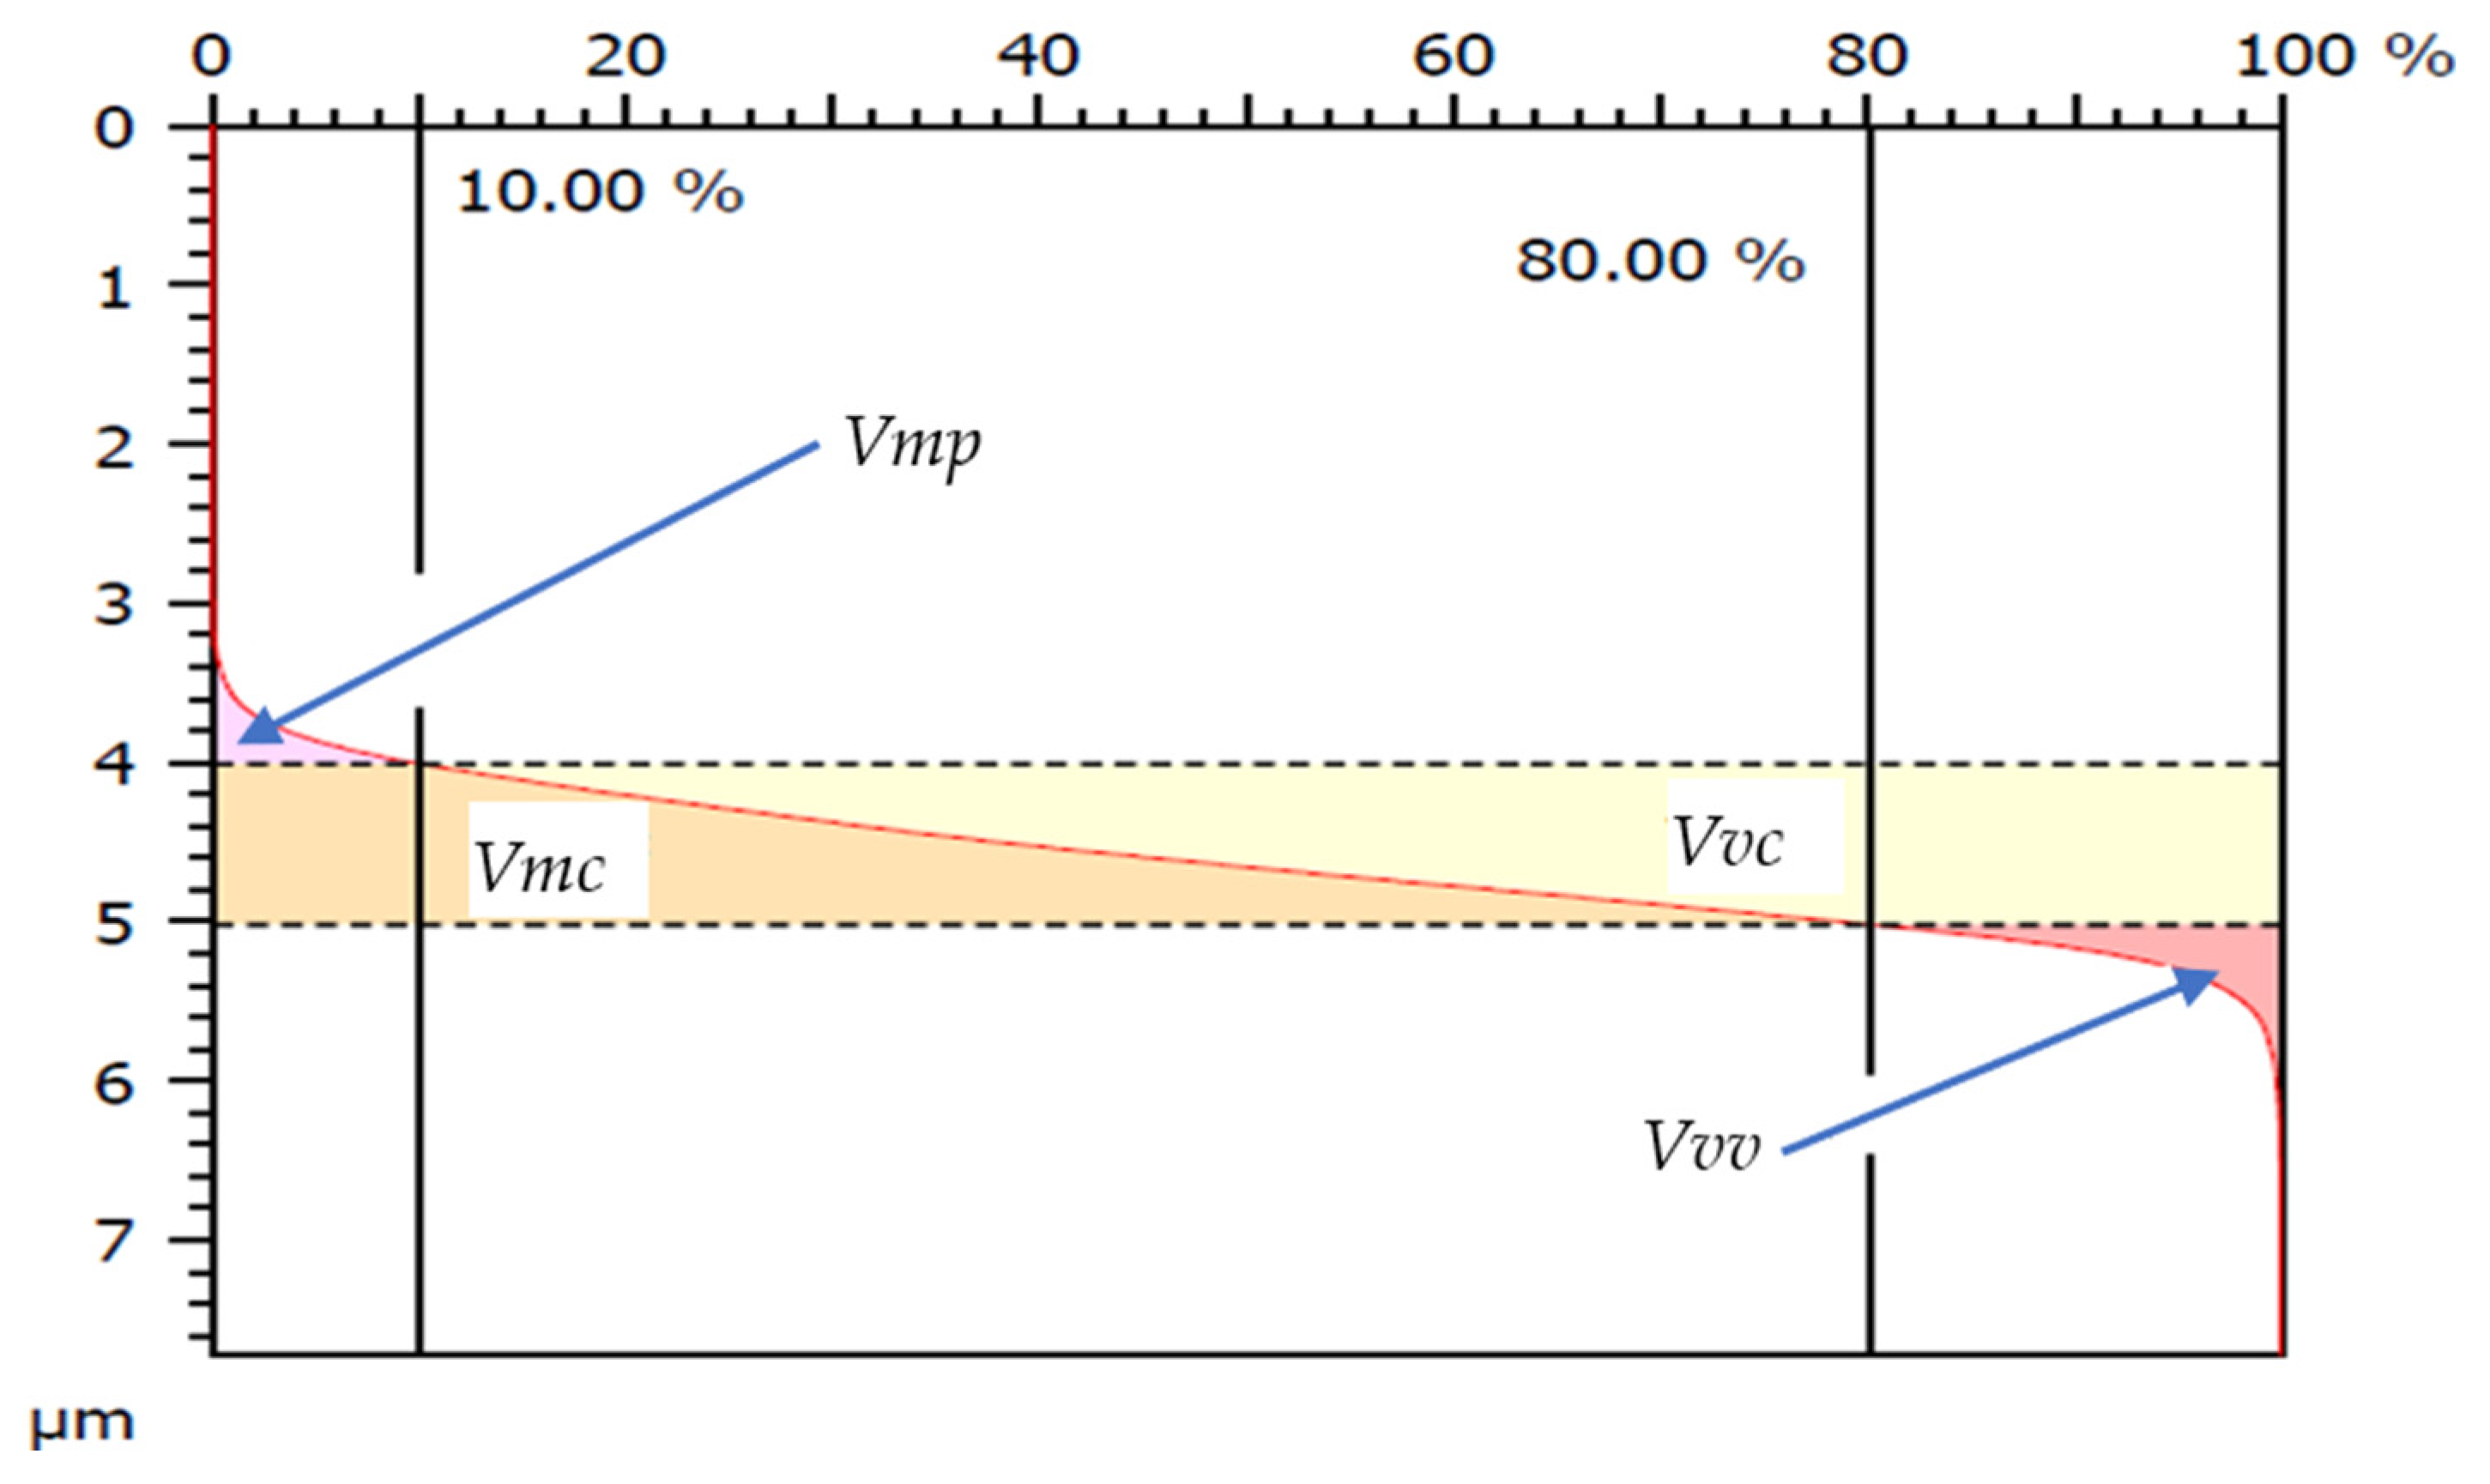
The following set of parameters was chosen to characterise the changes occurring on individual surfaces after milling [59,60]: Sa—arithmetic mean surface height (μm); Sz—maximum surface height (μm); Sp—maximum surface peak height (μm); Sv—maximum surface valley depth (μm). The changes in the values of the following indices carrying information on the volume of material and the volume of voids in the surface sections examined were also investigated [61,62]: Vm (p)—material volume at the material ratio p expressed as a percentage (μm3/mm2); Vv (p)—void volume at the material ratio p expressed as a percentage (μm3/mm2); Vmp—material volume in the hill region (μm3/mm2); Vmc—material volume within the core (μm3/mm2); Vvc—void volume within the core (μm3/mm2); Vvv—void volume below the core (μm3/mm2).
The measurement system, together with the developed measurement methodology, was verified on the surface of sample AC1 (see Table 2). For this purpose, five scans were made of the same section of the test area. The standard deviation σSx was then calculated for the values of the selected indices, i.e., Sa and Sz. The measurement uncertainty of USx was calculated using the defined value of the measurement uncertainty expansion factor k = 2.0 (covering 95% of cases around the mean value [63]) based on Equation (1):
U S x = σ S x · k
The measurement system used was shown to have a measurement uncertainty ranging from 1.7% of the Sa index to 3.5% of the Sz index. The study of changes in SGT index values was carried out on so-called mapped surfaces, which were not subjected to any additional filtering operations.

3. Results

3.1. Images of Machined Surfaces

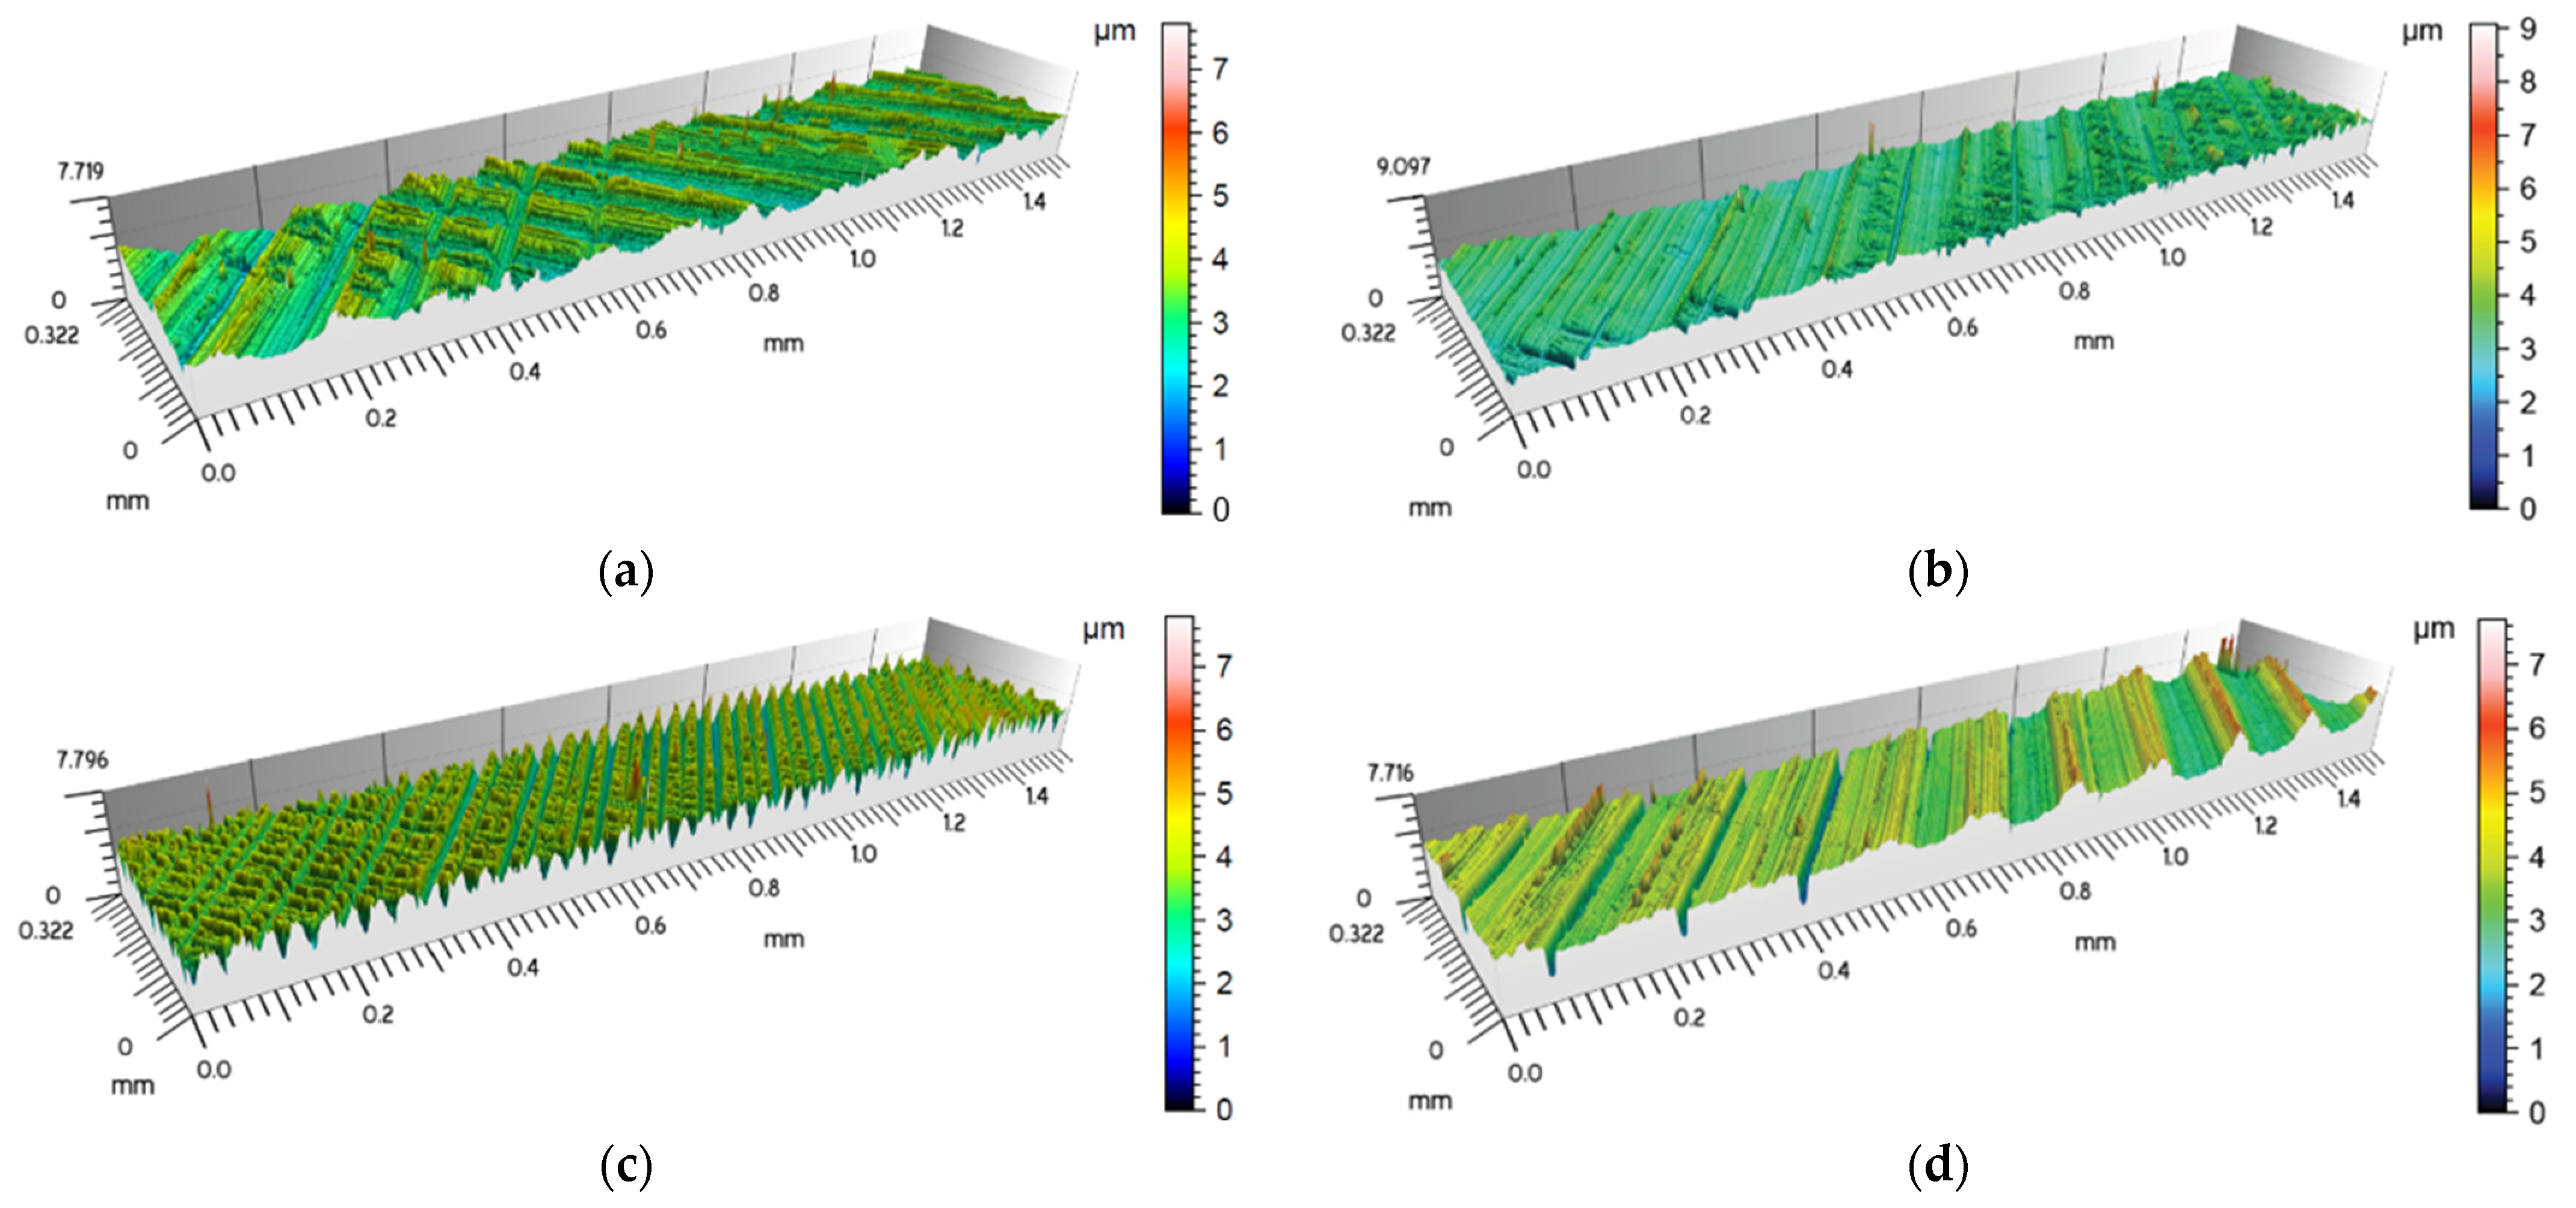
The recorded images of the surfaces machined with coolant are presented in Figure 3 and Figure 4.
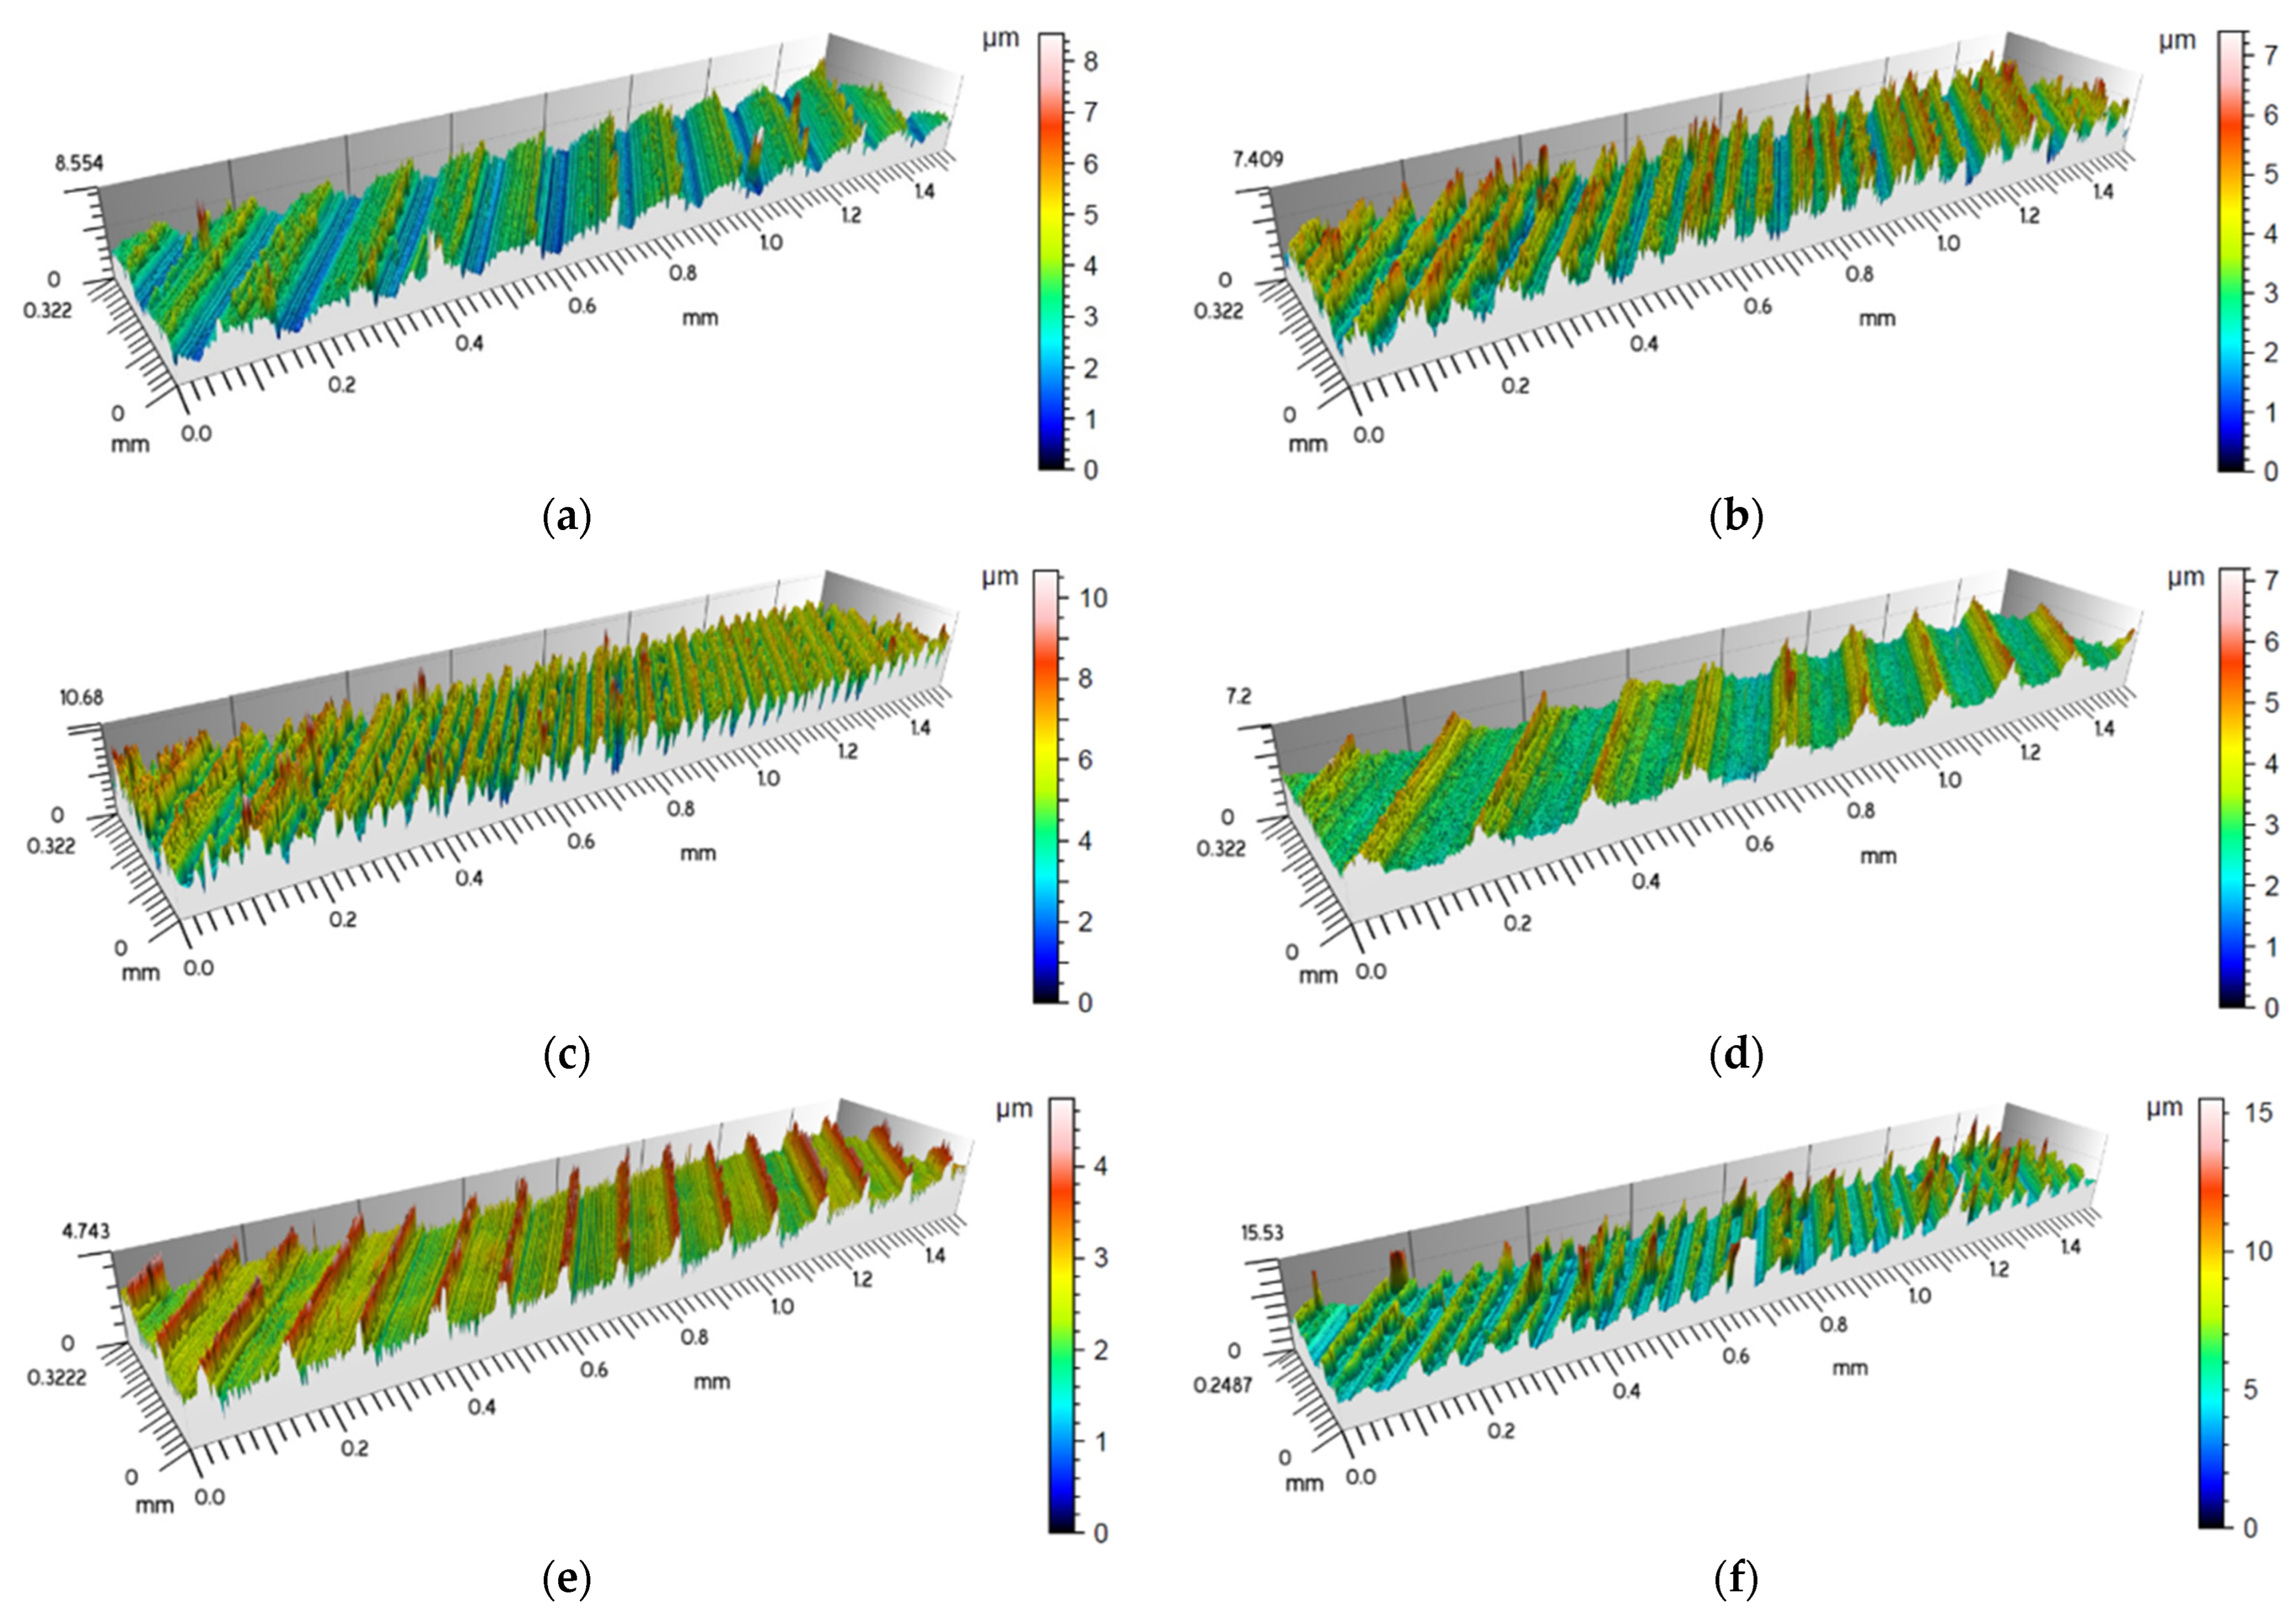
The recorded images of the surfaces machined without coolant are presented in Figure 5.

3.2. SGT Measurement Results

In addition to checking for differences in surface quality in wet and dry milling, the focus was on comparing changes in SGT depending on the technological parameters used for the HPM process. The values of selected SGT indices determined during this study are summarised in Table 3.

4. Discussion

4.1. Evaluation of Images of Machined Surfaces

Analysis of the images of the recorded surfaces (Figure 3, Figure 4 and Figure 5) reveals that wet milling of specimens AC1 to AC3 resulted in the phenomenon of back cutting of the surface, which was not observed in dry milling (surfaces of specimens AD1 to AD3). In contrast, when cutting with a lower speed value, the nature, direction and heights of the surface irregularities were the same for wet milling (specimen surfaces BC1 to BC3) and dry milling (specimen surfaces BD1 to BD3).

4.2. Evaluation of SGT Indices

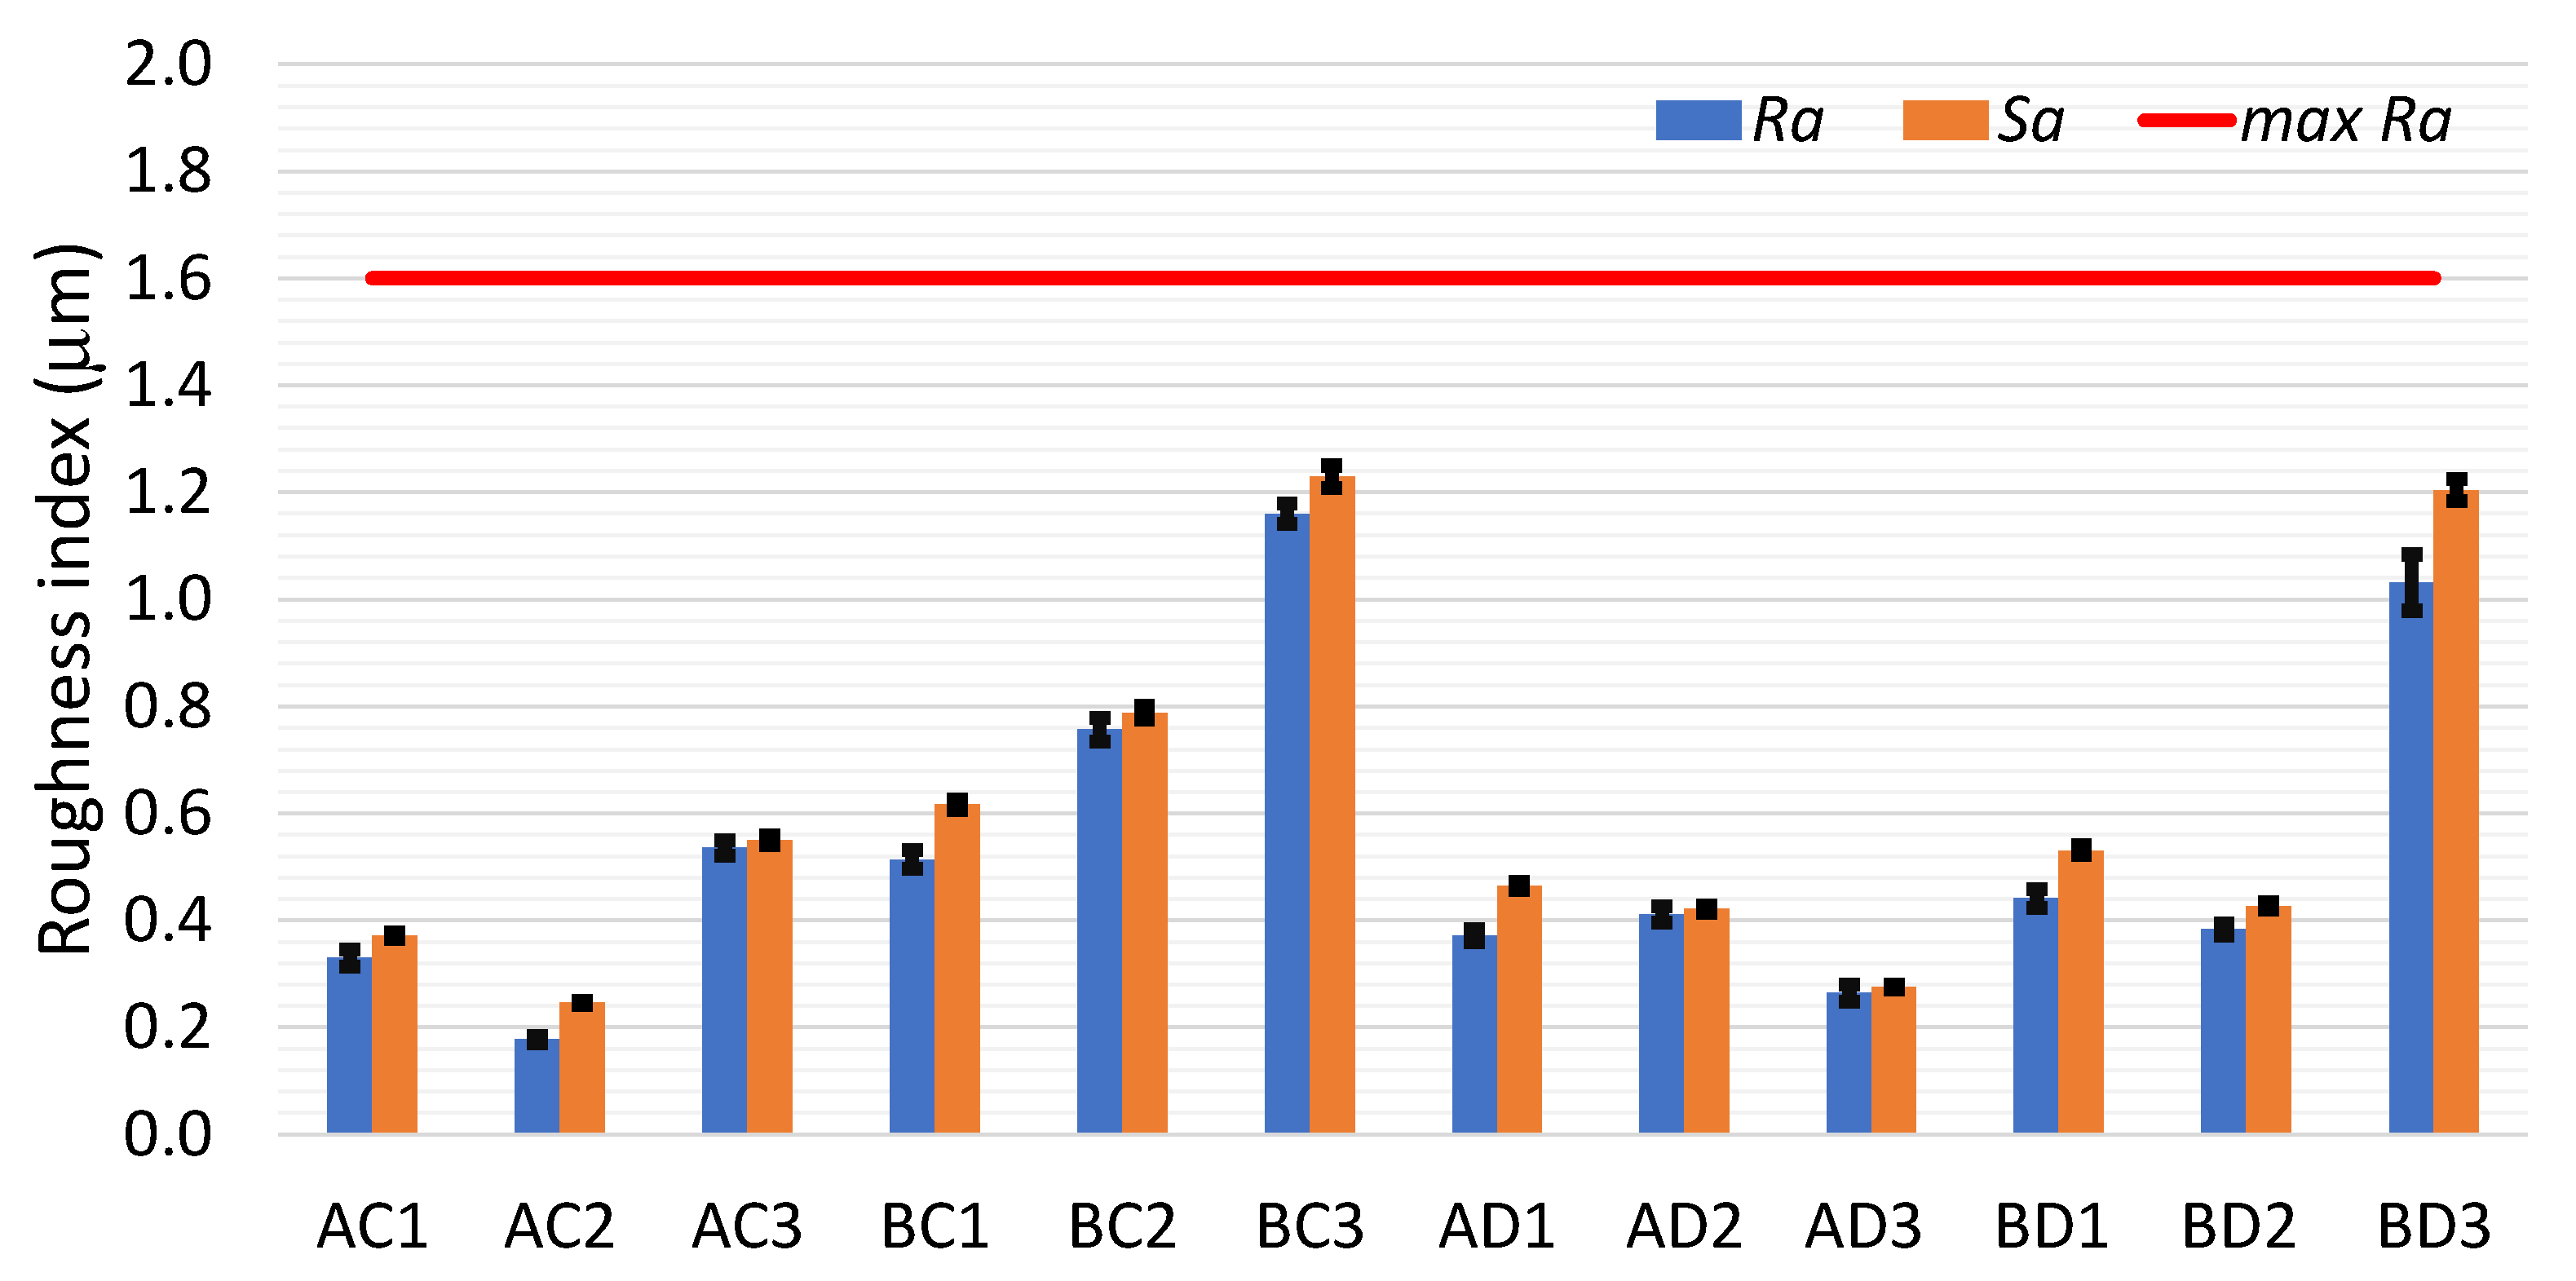
During the experimental tests, Ra values were below the maximum permissible value in all cases of the HPM process. When dry milling with higher cutting speeds, the variation in Ra values was lower than that when wet milling. The lowest value of this index was achieved for the surface of sample AC2 (Ra = 0.18 μm for milling with vc = 1760 m/min and fm = 1000 mm/min). When comparing pairs of samples including AC2 and AC3, as well as AC2 and BC2, it should be noted that feed rate had the greatest impact on the fb blade in the process of shaping surface irregularities, which is largely due to the geometry of the viper-type cutting insert (with edge length bs = 0.9 mm). The use of such cutting inserts at higher feed rates (compared to inserts with classic geometry) allows for a significant reduction in roughness height. However, due to the greater length of the active cutting edge, they are more susceptible to a reduction in cutting forces when coolant is used.
The observed Ra values in dry milling were generally lower than those obtained with cooling, ranging from 11% (for sample BD3) to as much as 49% (for sample BD2)—see Figure 6. With dry milling, a much lower effect of feed rate on the roughness index Ra was found. In this respect, the spread of Ra values in dry milling was slightly more than 21% lower than the spread of Ra values in wet milling.
It should be noted that the values of the Sa indices indicating the average deviation of the irregularities across the surface are slightly higher than the values of the Ra indices, which is commonly observed in SGT studies. When comparing the changes in Sa values as a function of technological machining parameters, there is a noticeable analogy to the interrelationship with the previously discussed changes in Ra values. The correct direction of measurement of the 2D profiles ensured that the anisotropic evaluation of the tested surfaces after HPM was consistent.
Dry milling appears to be a safe cutting method, the monitored effect of technological cutting parameters on the state of SGT being much less than that when machining with coolant. It is important to emphasise the fact that the analysis of changes in the height of irregularities on the 3D surface has lower errors compared to information obtained from a randomly selected 2D profile. Therefore, the results obtained from the 3D surface survey should be representative of other (similar) HPM cases.
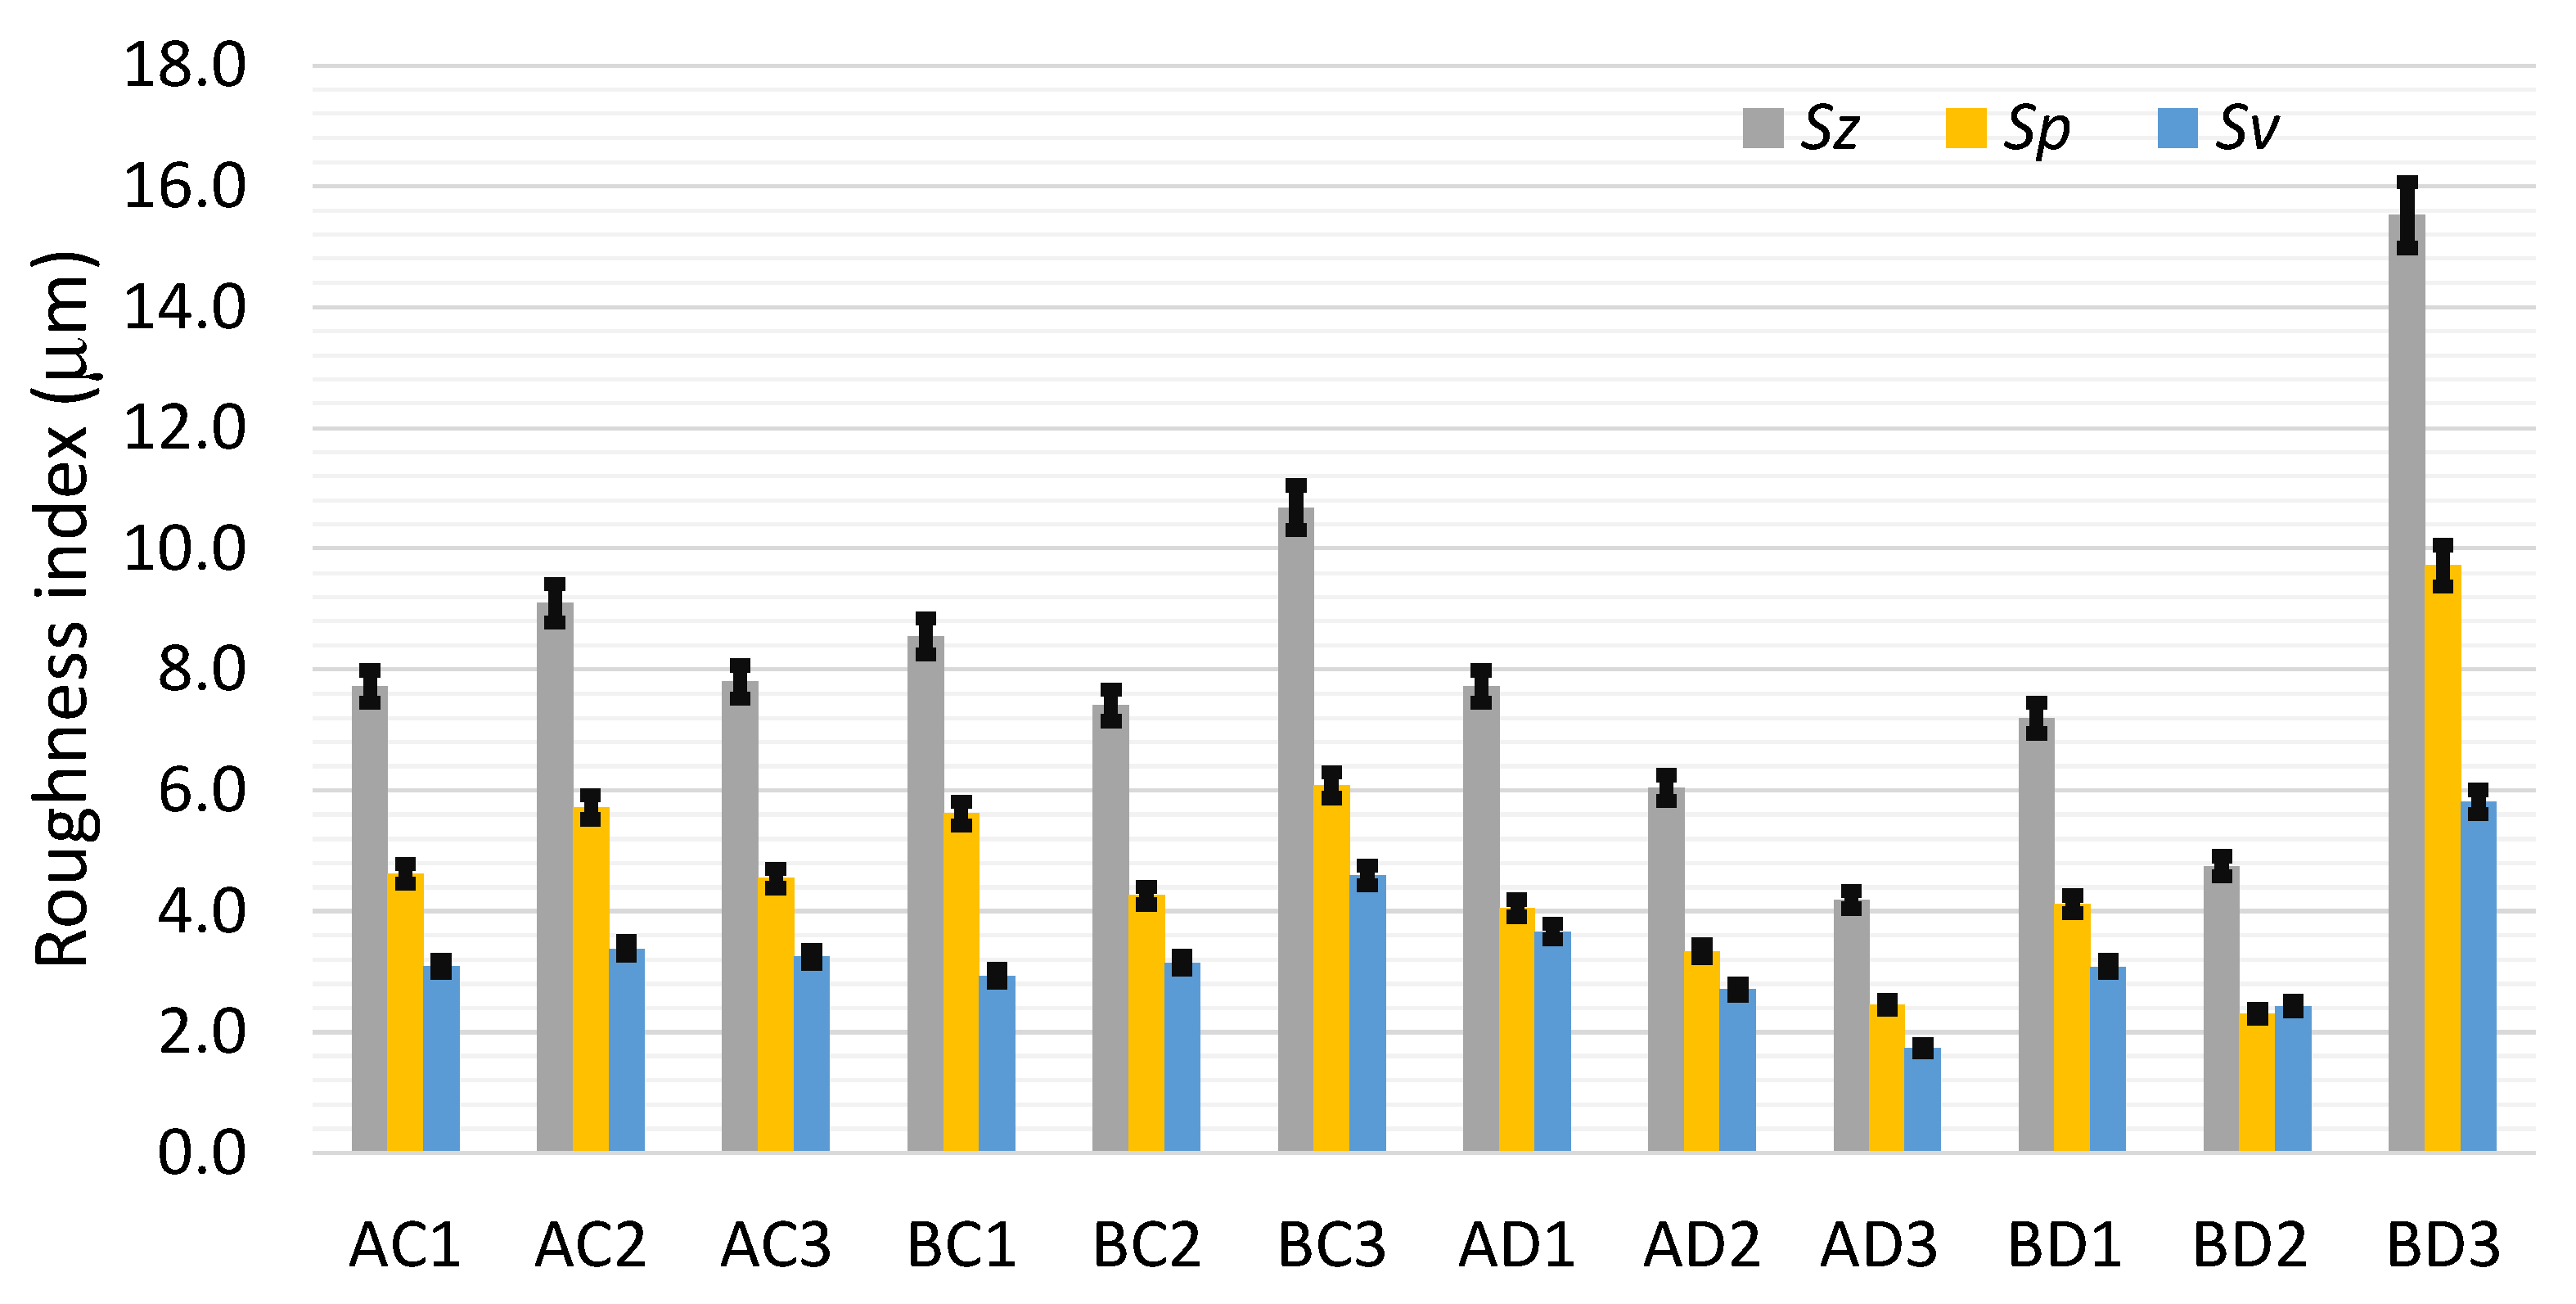
Comparing the absolute values of the difference between the highest peaks and deepest valleys on the surface (i.e., the Sz index values—Figure 7), they were about 11% lower in dry milling, and this is despite the fact that the spread of Sz values in the dry milling was more than three times greater.
Analysis of the change in the ratio of the average peak height Sp to the average valley depth Sv indicates that dry milling bridged the absolute observed difference by approximately 37% compared to cooled milling. There was a noticeable improvement in the change in this ratio when shaping the absolute peak height Sp. Although there was only a 15% absolute reduction in the peak heights Sp between dry and wet HPM processes and a 20% change in the interrelationship of Sp and Sv in dry milling, a significant 34% change in the interrelationship of the peak heights Sp and valley depths Sv was observed in wet milling.
The changes described are undoubtedly related to a change in the nature of the cutting process, which with dry milling is less sensitive to technological machining parameters, making the process more predictable, thanks to the formation of peaks of similar heights. In wet milling, on the other hand, significant differences in the material separation process become apparent depending on the coolant feed conditions. It can therefore be concluded that the method of coolant feed in wet milling represents an additional variable in the shaping of the SGT.
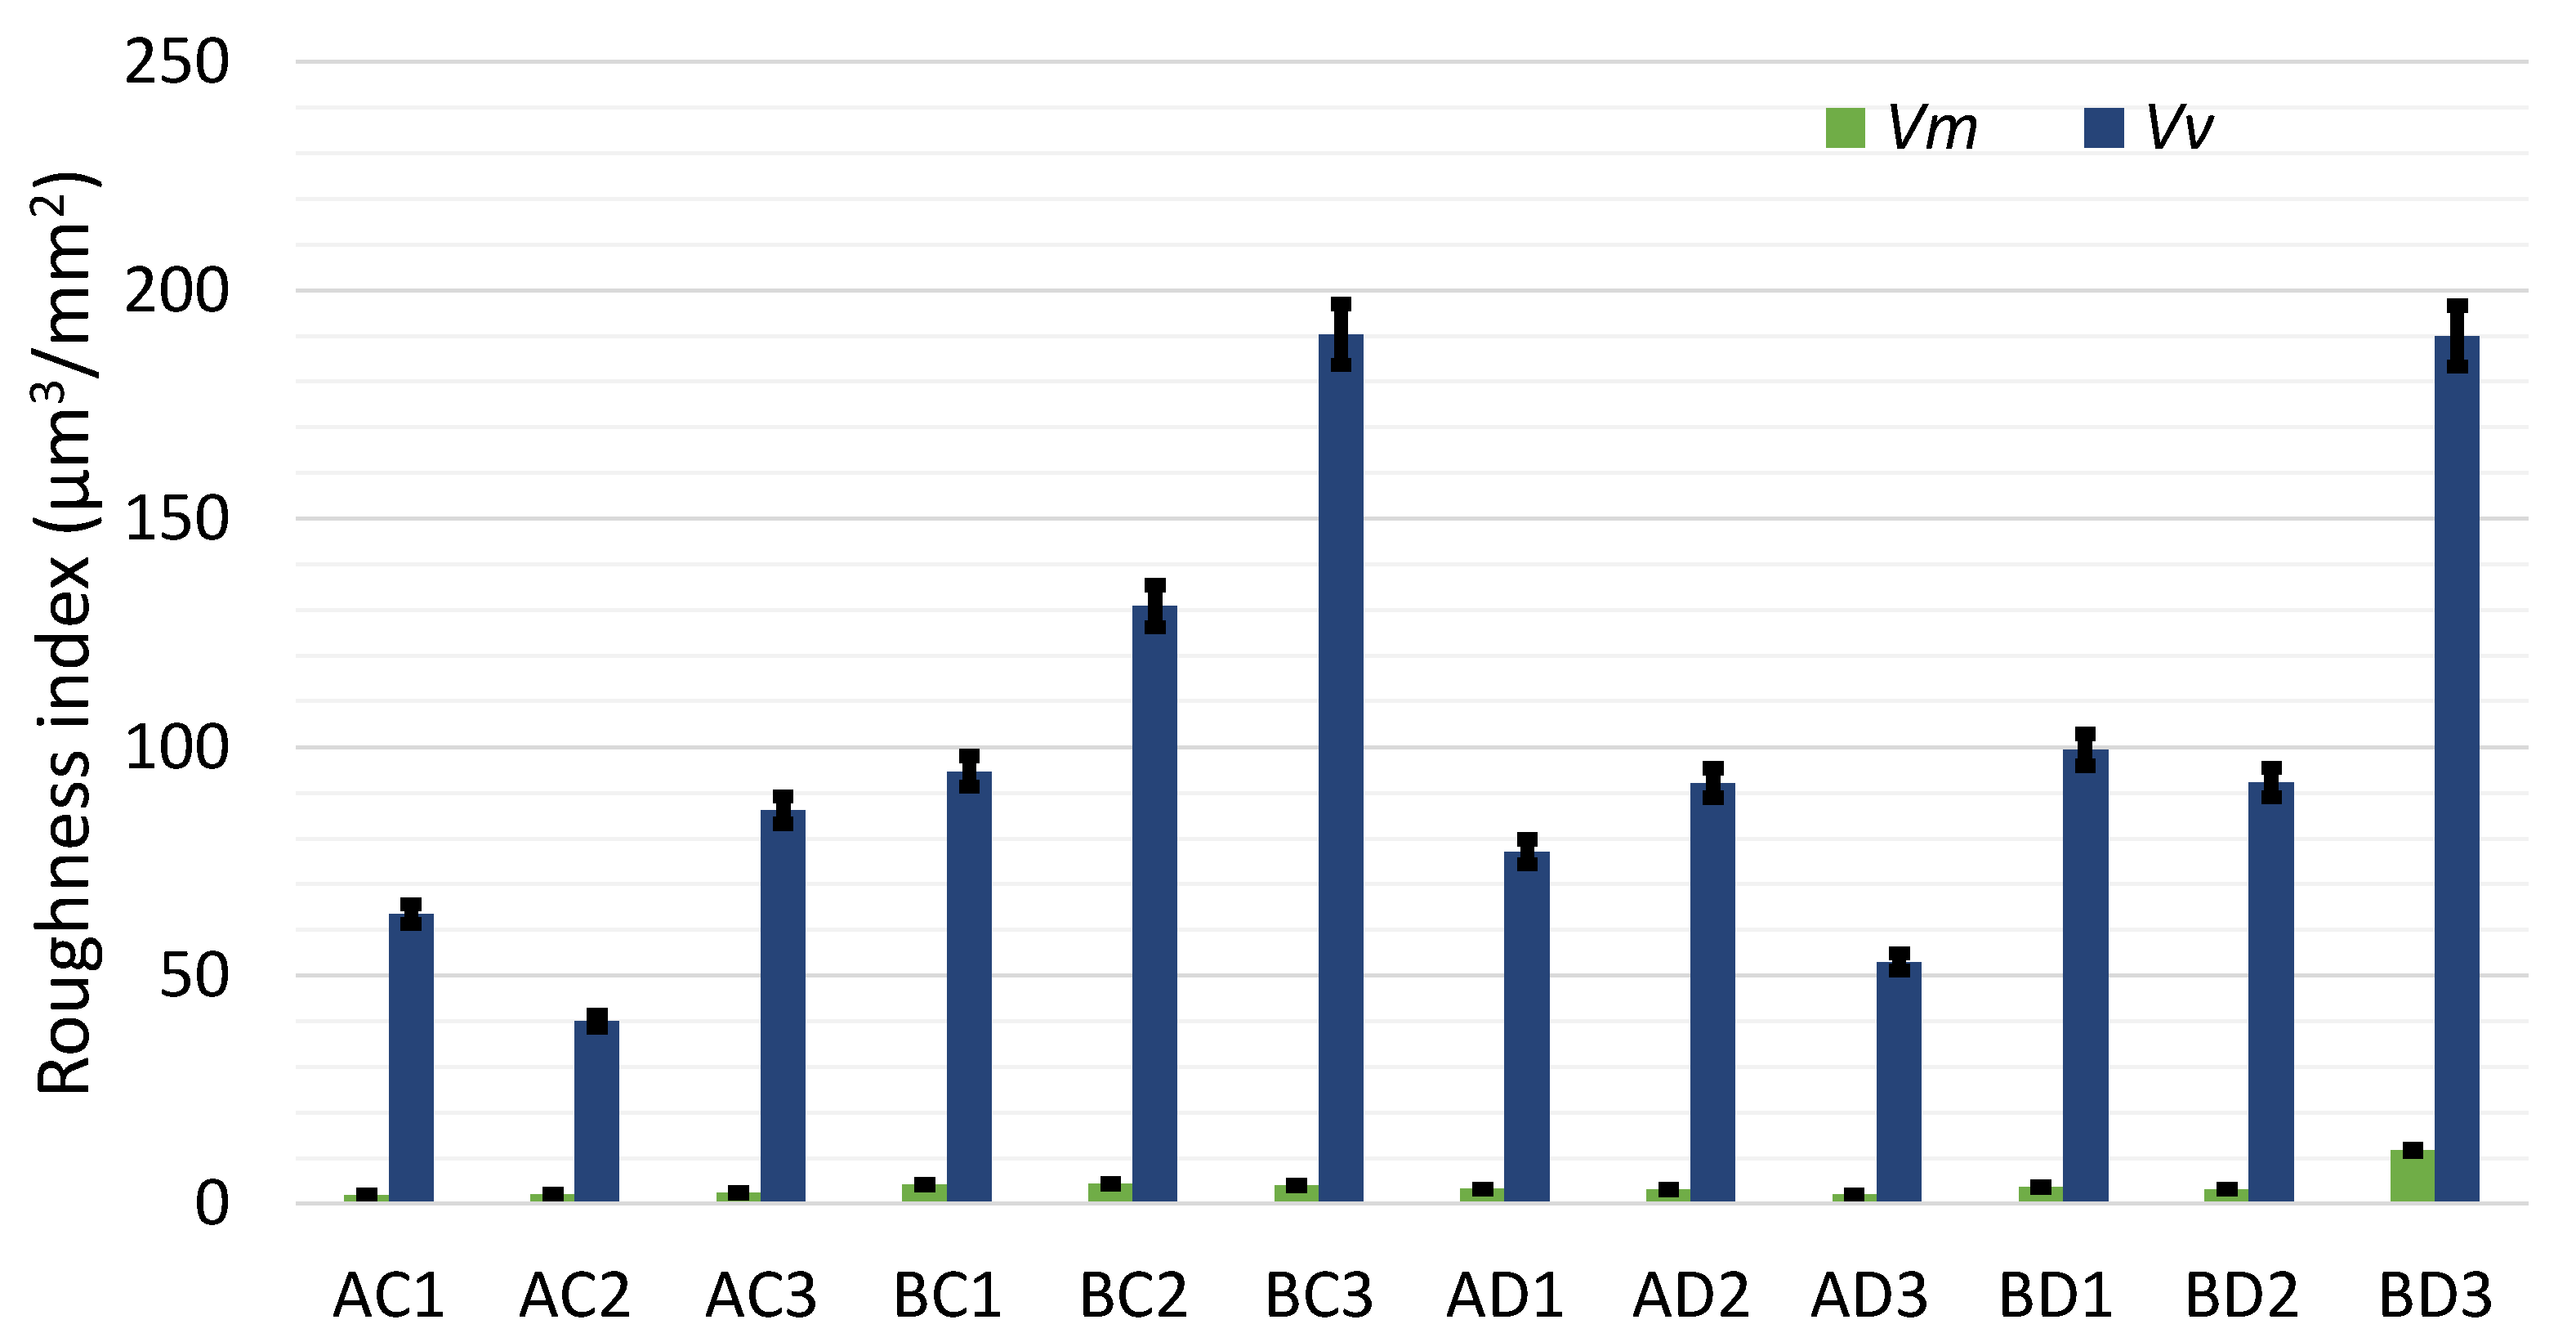
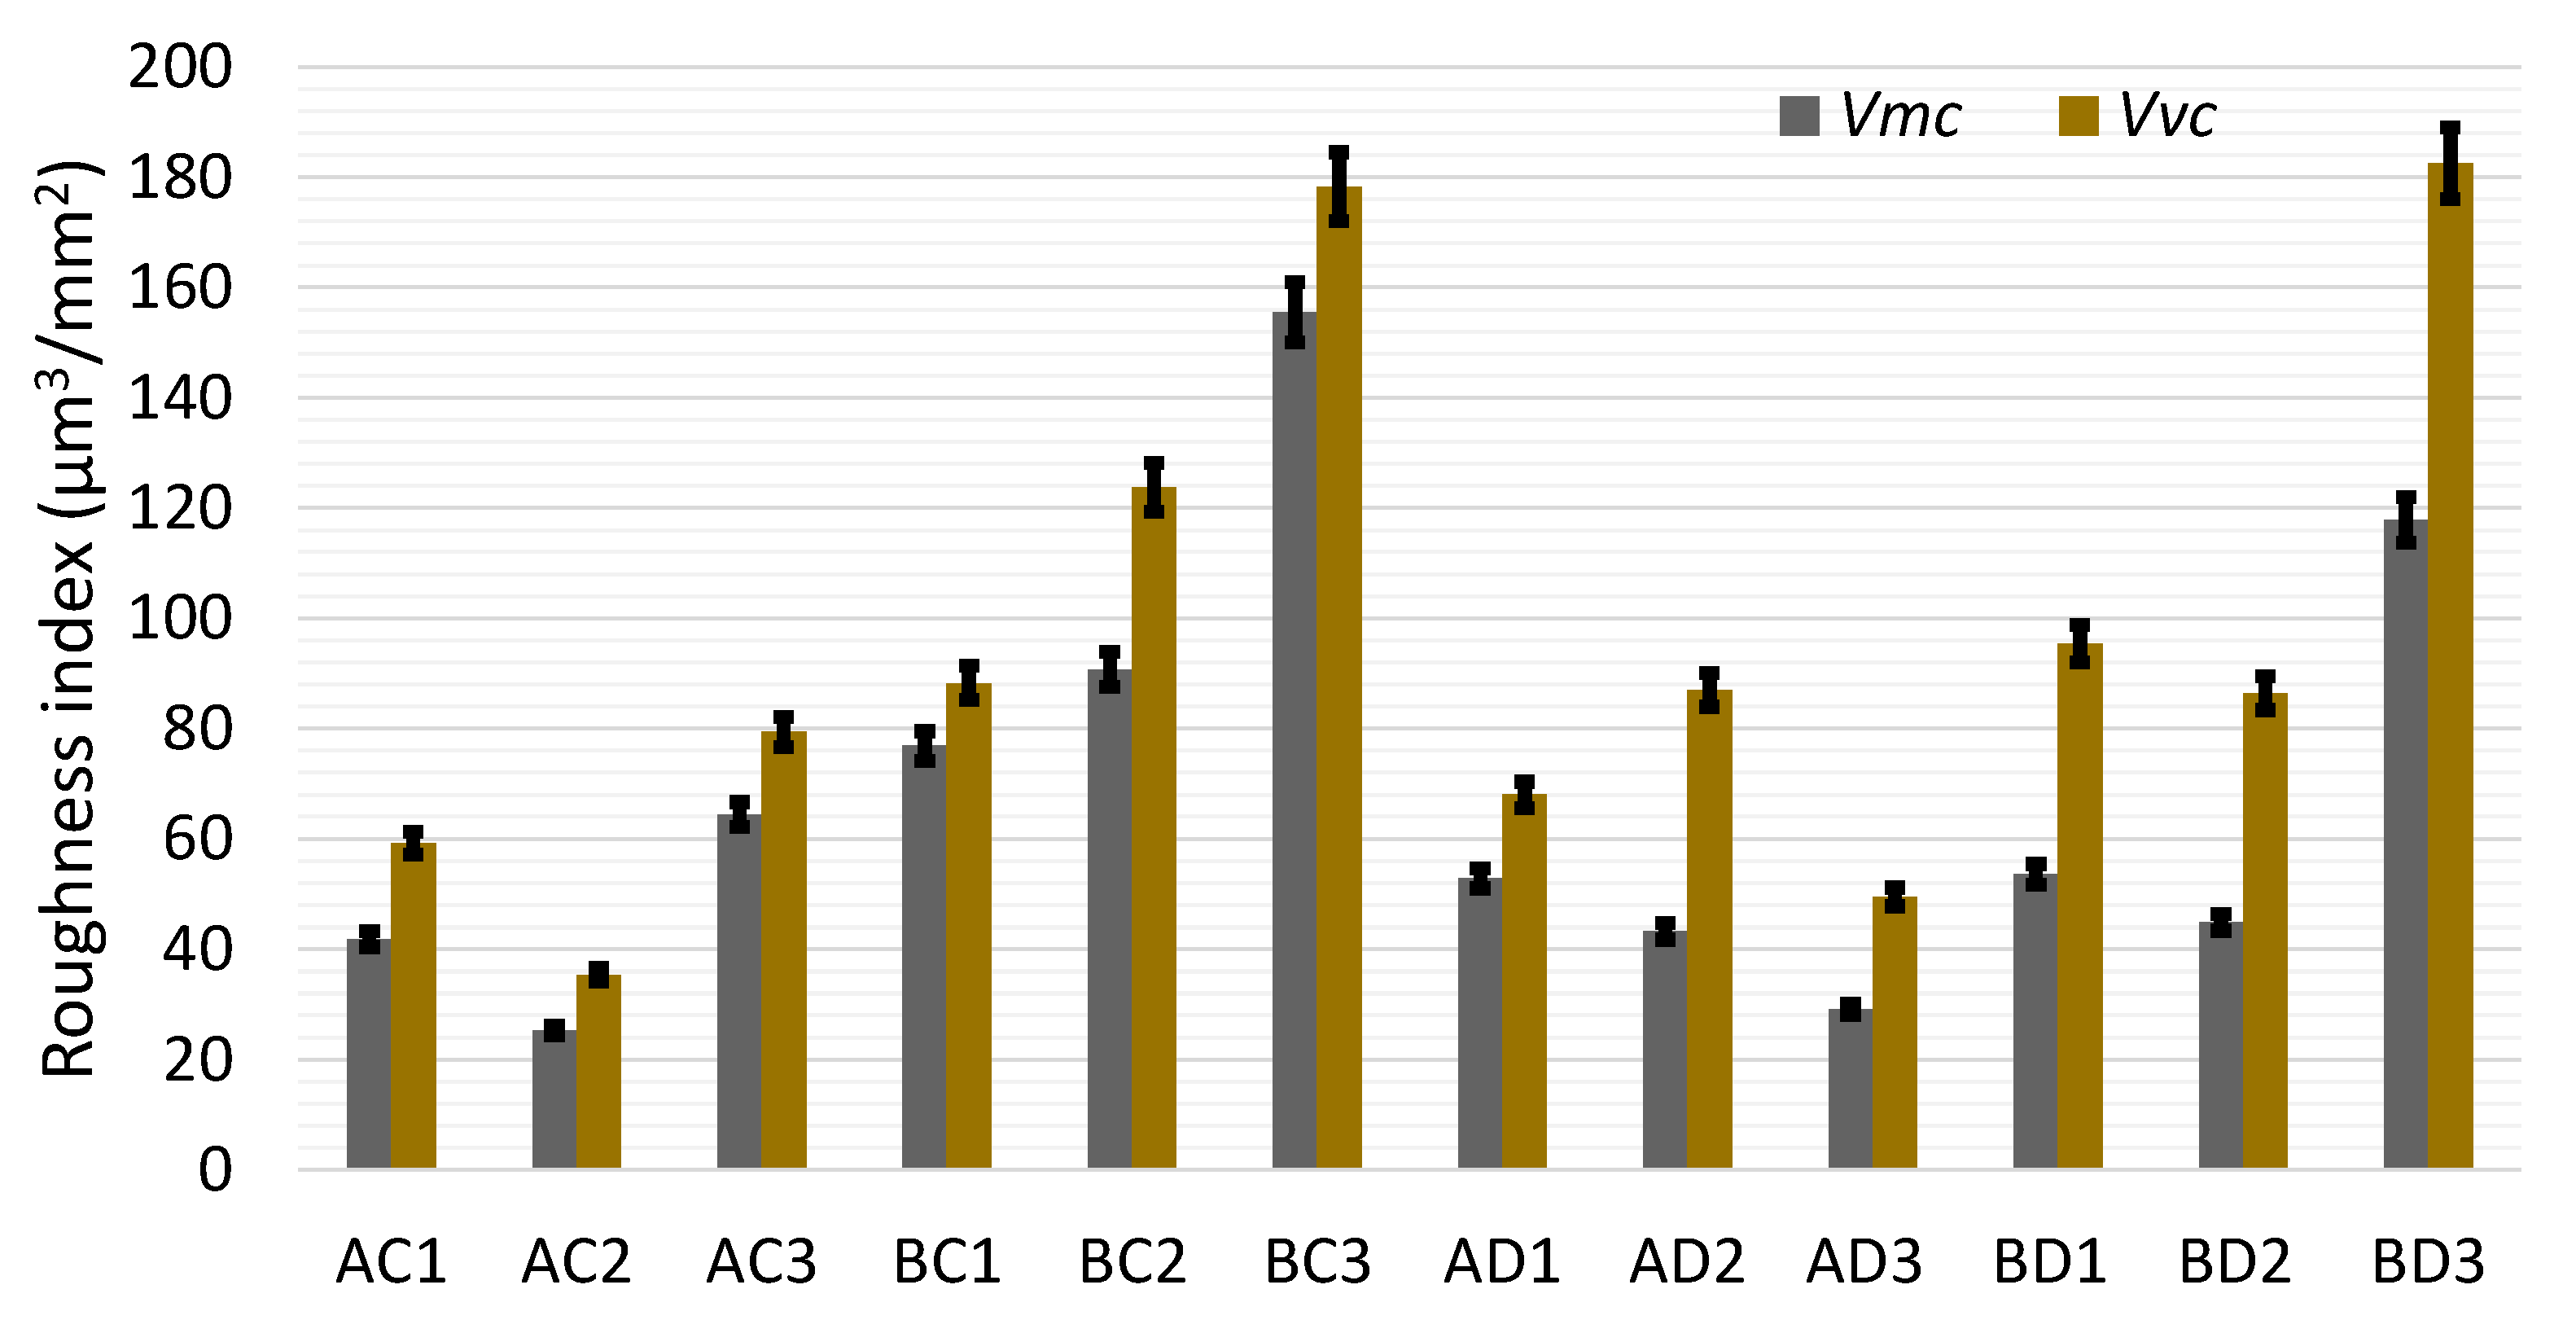
In order to gain a more detailed understanding of how SGT is formed during HPM of aluminium alloys, particular interest should be directed towards the analysis of changes in volumetric indices values based on the course of the Abbott-Firestone curve [59] (Figure 8). The values of the volumetric indices provide information on the ratio of total material volume and void volume (Figure 9). In addition, they provide knowledge of the ratio of the volume of the irregularities occupying the core (Figure 10) and the amount of material constituting the volume in the high peaks and the void volume in the deep valleys of the irregularities (Figure 11).
Due to the lack of filtration during the analysis of the recorded point clouds, the values of the indices for the total volume of surface material Vm and the volume of material in the surface peaks Vmp take on the same values.
In both cases of the realised HPM processes, surfaces with a so-called sharply vertex-like character (VvVm) were obtained (Figure 9). This meant a situation in which single high inequalities (or inequalities arranged in strips) predominated. The average void volume Vv in both cases was at a similar level and was approximately 100 μm3/mm2. In contrast, the volume of surface material Vm for the most part did not exceed 5 μm3/mm2.
By inspecting more closely the way the material was distributed in the core of the roughness (Figure 10), the process of shaping the surface, as well as its potential tribological properties, can be assessed. The irregularities within the core of the material showed less variation in the case of dry milling. After dry milling, an increase in the void volume Vvc could be detected within the material core. The average value of the Vmc/Vvc ratio for dry milling was 0.6, while for wet milling the ratio was 0.8. This effect is related to the nature of the separation and tearing of surface fragments in dry milling relative to the nature of the surface cut under reduced friction (i.e., in wet milling).
The most favourable course of the Abbott-Firestone curve was obtained for sample AC2. A surface shaped in this way should exhibit good tribological properties (especially resistance to rapidly progressive abrasive wear) after reaching the initial stage (i.e., after removal of the high peaks). The influence of kinematic–geometrical relationships in the HPM process is dominant in wet milling. This is evidenced by the increasing arrangement of volumes occupied by voids Vvv in relation to the total volume of the peak material Vmp (in proportion to changes in the values of the technological machining parameters—see Figure 11).
After dry milling at high speeds, the ratio of volumes occupied by the voids Vvv decreased with decreasing fm values. This is the opposite of what was observed in the wet experiments and at the same time provides evidence that, as the volume of the material being cut changed, the effect of tearing out the surface fragments responsible for shaping the voids decreased. The effect of reducing the material pull-out phenomenon was even more pronounced when even lower cutting speeds were used (applied to samples BD1 to BD3). When milling at lower cutting speeds, the material peaks Vmp created by the plastic deformation of the milling face became the dominant factor responsible for shaping the roughness.
In order to visualise the changes occurring on wet and dry milled surfaces, the cutting efficiency index KSx was adopted according to Equation (2):
K S x = S x C S x D 1
where SxC is the value of the selected index Sx or Vx after dry milling, and SxD is the value of the selected index Sx or Vx after wet milling.
A positive value for the KSx index indicates a situation where the value of the selected SGT after dry milling is lower compared to that after wet milling (see Table 4 in the form of a heatmap-type table). By examining the arithmetic mean values of the Ra and Sa roughness heights, a situation was obtained in four of the six experimental systems, where more favourable values were obtained after dry milling. The use of cooling worked well at maximum (high) cutting speeds and feed rates. In contrast, when comparing the maximum differences between the highest peaks at the surface and the deepest valley bottoms (i.e., the KSz index values), dry milling produced comparable or more favourable results in as many as five cases out of six.
The improvement in surface condition is primarily related to a reduction in the peak height KSp and an improvement in the ratio of material in the core of the irregularity KVmc to the volumes occupied by the voids KVv and KVvc. Milling with HPM on aluminium alloy parts leaves sharply defined marks in the form of deep grooves (resulting from the kinematic–geometrical relationship), which cannot be avoided in dry machining (see KVvv index values). Anisotropic surfaces are characterised by a texture that can be reduced somewhat by using cutting tools with honing blades (with viper-type geometry).

5. Conclusions

The following findings can be drawn from the research and analysis carried out:
It has been shown that it is possible to run the HPM process dry without deterioration of the SGT condition. It even appears that the condition of the SGT after dry milling of cast aluminium alloys can be more favourable than that after milling with coolant. The source of the high milling performance is the high feed rate and depth of cut at medium and high cutting speeds. Especially in the case of dry milling with higher cutting speeds, the variation in Ra values was lower than that in the case of wet milling. The lowest value of this index was achieved for the surface of sample AC2 (Ra = 0.18 μm for milling with vc = 1760 m/min and fm = 1000 mm/min).
A noticeable limitation of the effectiveness of dry milling is the height of surface irregularities when very high cutting speeds are used. In this situation, the surface irregularities that are shaped by the milling cutter to which the coolant is fed have a more favourable ratio of material volume to void volume. The average value of the Vmc/Vvc ratio for dry milling is 0.6, while for wet milling the ratio is 0.8. This results in surfaces with high load-bearing capacity, which are particularly desirable due to their tribological properties and potentially superior resistance to abrasive wear.
The experimental studies carried out can be used as a basis for deciding to switch off the coolant during face milling operations with multicutting tools with protective coatings. In such operations, there are good chip evacuation conditions with high volumetric cutting efficiency. With volumetric milling of the material, much of the heat is dissipated with the chip. In none of the tests carried out during this research was there a phenomenon associated with the formation and development of a build-up on the cutting surface. The forces in dry milling are slightly higher compared to those in wet milling. This effect can be explained by the geometry of the viper-type inserts used and the lack of lubrication between the cutting edge and the surface of the part. As a result, during dry milling, a state of constant elastic tension is maintained on the tool, which cannot straighten under gyroscopic forces, causing the previously shaped surface to be jammed by the blades passing behind the tool.
Studies have confirmed the possibility of reducing the adverse human and environmental impact of the HPM process for commonly performed surface milling operations. Similar studies should also be carried out for other cutting operations where chip evacuation conditions are difficult, such as contour milling or hole drilling. If the observed rule related to the favourable condition of SGT when using high cutting speeds and very high feed rates is confirmed, it will be possible to significantly reduce the negative impact of industry on humans and the environment when machining cast aluminium alloys for the automotive, aerospace or engineering sectors.

Author Contributions

Conceptualisation, S.Z. and D.G.; methodology, S.Z. and D.G.; software, S.Z.; validation, D.G. and R.G.; formal analysis, D.G. and R.G.; investigation, S.Z. and D.G.; resources, S.Z.; data curation, S.Z.; writing—original draft preparation, D.G.; writing—review and editing, S.Z., R.G. and D.G.; visualisation, D.G. and R.G.; supervision, D.G.; project administration, R.G. and D.G.; funding acquisition, D.G. All authors have read and agreed to the published version of the manuscript.

Funding

This research, carried out using research apparatus purchased as part of the project No. RPZP.01.03.00-32-0004/18, was co-financed by the European Union from the European Regional Development Fund under the Regional Operational Programme of the West Pomeranian Voivodeship 2014–2020 and co-financed by the Polish Ministry of Education and Science.

Institutional Review Board Statement

Not applicable.

Informed Consent Statement

Not applicable.

Data Availability Statement

Data are available upon request from the corresponding author.

Conflicts of Interest

Author Szymon Zgrzeblak was employed by the AE Group Poland. The remaining authors declare that the research was conducted in the absence of any commercial or financial relationships that could be construed as a potential conflict of interest.

Abbreviations

The following abbreviations are used in this paper:
HPMHigh-performance machining
MQLMinimum quantity lubrication
SGTSurface geometrical texture

Appendix A. Environmental and Human Impact of Machining

Noise is one of the most annoying factors for humans and is intrinsically linked to industrial production [64]. Cutting machines, like most technological devices, generate acoustic waves of varying intensity. The level of noise depends on the characteristics of the operation being performed and the degree of wear of individual machine components, e.g., wear of the turning screw drives. Noise affecting the operator over an extended period of time can cause a number of negative effects on their health, which include general deterioration of wellbeing, irritability, aggression, concentration problems and permanent hearing damage [65]. The way to reduce noise is to operate the machine properly, with maintenance and replacement of wearing components at appropriate intervals. Hearing protection should also be used both individually and in groups, e.g., by separating the operator with suitable partitions from the noise source.
Another very important factor with an environmental impact is the energy consumption of process machines [66]. This is particularly important in countries where energy is obtained from fossil fuels. Machine tools consume most of their energy to power auxiliary equipment, i.e., equipment designed to cool and regenerate process fluids and fans and air-conditioning systems in control cabinets, and to power drive motors responsible for implementing auxiliary movements [67]. The consumption of energy during the machining process by a machining centre is only a few percent of the total consumption. Energy consumption can be reduced by using more efficient machining centres [68] that allow different machining operations to be concentrated in a single operation [69,70].
Such machines should be programmed to guarantee the shortest machining time, maximising energy savings. Modern machine tools are also equipped with servo drives and spindles with a function to recuperate kinetic energy during deceleration of the machining process [71,72].
In the machining process, cutting fluids are the most important factor related to negative environmental and human impacts [73]. Operating a machine tool equipped with a cooling system is more expensive than operating a machine tool without such a system [74]. In order for a machine tool’s process fluid regeneration and cooling system to function properly, filter mats and filters must be periodically replaced. In addition, the coolant must be mixed in machine tools for which longer standstill periods are planned. Otherwise, bacteria will begin to multiply in the coolant, which are harmful to humans and can contribute to tools’ deterioration. On the other hand, after long periods of machine downtime, the coolant must be completely replaced and the system cleaned. The disposal of large quantities of coolant and used filters and filter mats in an industrial setting represents a significant burden on the environment [75].
A way of offsetting the negative impact of coolant on the environment is to allow dry machining. In this case, chips from the cutting zone are usually evacuated using compressed air directed into the cutting zone [76] or spot cooling using vortex tubes [77]. Recently, MQL cutting in an oil mist has become a very popular machining method [78,79]. With this method, coolant is sprayed into the cutting zone through nozzles above the tool or is fed directly through the tool core. Feeding the coolant through the tool core directly into the cutting zone facilitates chip breaking. However, the resulting aerosols, like MQL-type cooling, are hazardous to machine operators. Coolant that comes into contact with heated tools, workpieces and machine components during machining evaporates, carrying volatile substances that are hazardous to health. If they are not contained within the airtight cabin of the machine tool, they also spread in the environment outside the production halls. Operators who are exposed to oil mist can develop respiratory diseases or skin diseases [80]. A way to reduce direct operator contact with coolants is to use palletised loading systems [81].

References

  1. Podgórska, M.; Zdonek, I. Sustainable technologies supported by Project-Based Learning in the education of engineers: A case study from Poland. Energies 2022, 15, 278. [Google Scholar] [CrossRef]
  2. Krajčo, K.; Habánik, J.; Grenčíková, A. The impact of new technology on sustainable development. Inž. Ekon. Eng. Econ. 2019, 30, 41–49. [Google Scholar] [CrossRef]
  3. Nozdrzykowski, K.; Grzejda, R. Analysis of the influence of the choice of method parameters and support conditions on the evaluation of the geometric condition of large crankshafts based in roller prisms. Measurement 2025, 256, 118422. [Google Scholar] [CrossRef]
  4. Vadera, S.; Khan, S. A critical analysis of the rising global demand of plastics and its adverse impact on environmental sustainability. J. Environ. Pollut. Manag. 2021, 3, 105. [Google Scholar] [CrossRef]
  5. Diakun, J.; Grzejda, R. Product design analysis with regard to recycling and selected mechanical properties. Appl. Sci. 2025, 15, 512. [Google Scholar] [CrossRef]
  6. Mosiño, A. Producing energy in a stochastic environment: Switching from non-renewable to renewable resources. Resour. Energy Econ. 2012, 34, 413–430. [Google Scholar] [CrossRef]
  7. Opeyemi, B.M. Path to sustainable energy consumption: The possibility of substituting renewable energy for non-renewable energy. Energy 2021, 228, 120519. [Google Scholar] [CrossRef]
  8. Wang, S.; Wang, X.; Chen, S. Global value chains and carbon emission reduction in developing countries: Does industrial upgrading matter? Environ. Impact Assess. Rev. 2022, 97, 106895. [Google Scholar] [CrossRef]
  9. Yadav, D.; Singh, R.; Kumar, A.; Sarkar, B. Reduction of pollution through sustainable and flexible production by controlling by-products. J. Environ. Inform. 2022, 40, 106–124. [Google Scholar] [CrossRef]
  10. Zhao, B.; Wang, Y.; Peng, J.; Wang, X.; Ding, W.; Lei, X.; Wu, B.; Zhang, M.; Xu, J.; Zhang, L.; et al. Overcoming challenges: Advancements in cutting techniques for high strength-toughness alloys in aero-engines. Int. J. Extrem. Manuf. 2024, 6, 062012. [Google Scholar] [CrossRef]
  11. Empower Your Aluminium Machining. Available online: https://mapal.com/en-int/sectors-solutions/empower-your-aluminium-machining (accessed on 17 July 2025).
  12. Davim, J.P.; Maranhão, C.; Jackson, M.J.; Cabral, G.; Grácio, J. FEM analysis in high speed machining of aluminium alloy (Al7075-0) using polycrystalline diamond (PCD) and cemented carbide (K10) cutting tools. Int. J. Adv. Manuf. Technol. 2008, 39, 1093–1100. [Google Scholar] [CrossRef]
  13. Boing, D.; Martinez, E.N.; Norgren, S.; Hardell, J. Attrition wear in Polycrystalline Diamond cutting tools during interaction with aluminium. Wear 2025, 571, 205781. [Google Scholar] [CrossRef]
  14. Brzezinka, T.L.; Rao, J.; Chowdhury, M.; Kohlscheen, J.; Fox Rabinovich, G.S.; Veldhuis, S.C.; Endrino, J.L. Hybrid Ti-MoS2 coatings for dry machining of aluminium alloys. Coatings 2017, 7, 149. [Google Scholar] [CrossRef]
  15. OptiMill®-Tro-Inox and OptiMill®-Uni-HPC-Pocket. Available online: https://mapal.com/en-int/product-innovations-2025/optimill-product-addition (accessed on 17 July 2025).
  16. Krajewski, S.J.; Grochała, D.; Tomków, J.; Grzejda, R. Analysis of the surface stereometry of alloyed austenitic steel after fibre laser cutting using confocal microscopy. Coatings 2023, 13, 15. [Google Scholar] [CrossRef]
  17. Diniz, A.E.; de Oliveira, A.J. Optimizing the use of dry cutting in rough turning steel operations. Int. J. Mach. Tools Manuf. 2004, 44, 1061–1067. [Google Scholar] [CrossRef]
  18. List, G.; Nouari, M.; Géhin, D.; Gomez, S.; Manaud, J.P.; Le Petitcorps, Y.; Girot, F. Wear behaviour of cemented carbide tools in dry machining of aluminium alloy. Wear 2005, 259, 1177–1189. [Google Scholar] [CrossRef]
  19. Rubaiee, S.; Danish, M.; Gupta, M.K.; Ahmed, A.; Yahya, S.M.; Yildirim, M.B.; Sarikaya, M.; Korkmaz, M.E. Key initiatives to improve the machining characteristics of Inconel-718 alloy: Experimental analysis and optimization. J. Mater. Res. Technol. 2022, 21, 2704–2720. [Google Scholar] [CrossRef]
  20. Cantero, J.L.; Díaz-Álvarez, J.; Infante-Garcia, D.; Rodríguez, M.; Criado, V. High speed finish turning of Inconel 718 using PCBN tools under dry conditions. Metals 2018, 8, 192. [Google Scholar] [CrossRef]
  21. Tanabe, I.; Isobe, H. Development of a cutting fluid with abrasive for increasing a tools life during milling. J. Mach. Eng. 2024, 24, 37–49. [Google Scholar] [CrossRef]
  22. Diniz, A.E.; Micaroni, R. Cutting conditions for finish turning process aiming: The use of dry cutting. Int. J. Mach. Tools Manuf. 2002, 42, 899–904. [Google Scholar] [CrossRef]
  23. Mabrouki, T.; Girardin, F.; Asad, M.; Rigal, J.-F. Numerical and experimental study of dry cutting for an aeronautic aluminium alloy (A2024-T351). Int. J. Mach. Tools Manuf. 2008, 48, 1187–1197. [Google Scholar] [CrossRef]
  24. Su, Y.; Li, Z.; Li, L.; Wang, J.; Gao, H.; Wang, G. Cutting performance of micro-textured polycrystalline diamond tool in dry cutting. J. Manuf. Process. 2017, 27, 1–7. [Google Scholar] [CrossRef]
  25. Sugihara, T.; Singh, P.; Enomoto, T. Development of novel cutting tools with dimple textured surfaces for dry machining of aluminum alloys. Procedia Manuf. 2017, 14, 111–117. [Google Scholar] [CrossRef]
  26. Jesudass Thomas, S.; Kalaichelvan, K. Comparative study of the effect of surface texturing on cutting tool in dry cutting. Mater. Manuf. Process. 2018, 33, 683–694. [Google Scholar] [CrossRef]
  27. Ronadson, B.J.; Vijayan, K.; Sanmugam, S.; Badhirappan, G.P. Improving dry machining performance of surface modified cutting tools through combined effect of texture and TiN-WS2 coating. J. Manuf. Process. 2023, 85, 101–108. [Google Scholar]
  28. Fukui, H.; Okida, J.; Omori, N.; Moriguchi, H.; Tsuda, K. Cutting performance of DLC coated tools in dry machining aluminum alloys. Surf. Coat. Technol. 2004, 187, 70–76. [Google Scholar] [CrossRef]
  29. Dasch, J.M.; Ang, C.C.; Wong, C.A.; Waldo, R.A.; Chester, D.; Cheng, Y.T.; Powell, B.R.; Weiner, A.M.; Konca, E. The effect of free-machining elements on dry machining of B319 aluminum alloy. J. Mater. Process. Technol. 2009, 209, 4638–4644. [Google Scholar] [CrossRef]
  30. Pawanr, S.; Gupta, K. Dry machining techniques for sustainability in metal cutting: A review. Processes 2024, 12, 417. [Google Scholar] [CrossRef]
  31. Hu, W.; Du, P.; Qiu, X.; Zhao, X.; Hu, Z.; Zhang, J.; Liu, Y. Enhanced dry machinability of TC4 titanium alloy by longitudinal- bending hybrid ultrasonic vibration-assisted milling. J. Clean. Prod. 2022, 379, 134866. [Google Scholar] [CrossRef]
  32. Deswal, N.; Kant, R. Machinability and surface integrity analysis of magnesium AZ31B alloy during laser assisted turning. J. Manuf. Process. 2023, 101, 527–545. [Google Scholar] [CrossRef]
  33. Pattnaik, S.K.; Bhoi, N.K.; Padhi, S.; Sarangi, S.K. Dry machining of aluminum for proper selection of cutting tool: Tool performance and tool wear. Int. J. Adv. Manuf. Technol. 2018, 98, 55–65. [Google Scholar] [CrossRef]
  34. Sukonna, R.T.; Zaman, P.B.; Dhar, N.R. Estimation of machining responses in hard turning under dry and HPC conditions using different AI based and statistical techniques. Int. J. Interact. Des. Manuf. 2022, 16, 1705–1725. [Google Scholar] [CrossRef]
  35. Nouari, M.; List, G.; Girot, F.; Coupard, D. Experimental analysis and optimisation of tool wear in dry machining of aluminium alloys. Wear 2003, 255, 1359–1368. [Google Scholar] [CrossRef]
  36. Rivero, A.; Aramendi, G.; Herranz, S.; López de Lacalle, L.N. An experimental investigation of the effect of coatings and cutting parameters on the dry drilling performance of aluminium alloys. Int. J. Adv. Manuf. Technol. 2006, 28, 1–11. [Google Scholar] [CrossRef]
  37. Sugihara, T.; Nishimoto, Y.; Enomoto, T. On-machine tool resharpening for dry machining of aluminum alloys. Procedia CIRP 2014, 24, 68–73. [Google Scholar] [CrossRef]
  38. Sugihara, T.; Nishimoto, Y.; Enomoto, T. On-machine tool resharpening process for dry machining of aluminum alloys employing LME phenomenon. Precis. Eng. 2015, 40, 241–248. [Google Scholar] [CrossRef]
  39. Hricova, J.; Kovac, M.; Sugar, P. Experimental investigation of high speed milling of aluminium alloy. Tech. Gaz. 2014, 21, 773–777. [Google Scholar]
  40. Zaghbani, I.; Songmene, V. A force-temperature model including a constitutive law for Dry High Speed Milling of aluminium alloys. J. Mater. Process. Technol. 2009, 209, 2532–2544. [Google Scholar] [CrossRef]
  41. Salguero, J.; Batista, M.; Calamaz, M.; Girot, F.; Marcos, M. Cutting forces parametric model for the dry high speed contour milling of aerospace aluminium alloys. Procedia Eng. 2013, 63, 735–742. [Google Scholar] [CrossRef]
  42. Khettabi, R.; Nouioua, M.; Djebara, A.; Songmene, V. Effect of MQL and dry processes on the particle emission and part quality during milling of aluminum alloys. Int. J. Adv. Manuf. Technol. 2017, 92, 2593–2598. [Google Scholar] [CrossRef]
  43. Chirita, B.; Tampu, N.C.; Brabie, G.; Radu, M.C. Experimental investigation on the effects of cooling system on surface quality in high speed milling of an aluminium alloy. IOP Conf. Ser. Mater. Sci. Eng. 2016, 145, 022006. [Google Scholar] [CrossRef]
  44. Zaghbani, I.; Songmene, V.; Khettabi, R. Fine and ultrafine particle characterization and modeling in high-speed milling of 6061-T6 aluminum alloy. J. Mater. Eng. Perform. 2009, 18, 38–48. [Google Scholar] [CrossRef]
  45. Yoshimura, H.; Moriwaki, T.; Ohmae, N.; Nakai, T.; Shibasaka, T.; Kinoshita, H.; Matsui, M.; Shimizu, M. Study on near dry machining of aluminum alloys. JSME Int. J. Ser. C Mech. Syst. Mach. Elem. Manuf. 2006, 49, 83–89. [Google Scholar] [CrossRef]
  46. Arumugam, P.U.; Malshe, A.P.; Batzer, S.A. Dry machining of aluminum–silicon alloy using polished CVD diamond-coated cutting tools inserts. Surf. Coat. Technol. 2006, 200, 3399–3403. [Google Scholar] [CrossRef]
  47. Jomaa, W.; Songmene, V.; Bocher, P. Surface finish and residual stresses induced by orthogonal dry machining of AA7075-T651. Materials 2014, 7, 1603–1624. [Google Scholar] [CrossRef] [PubMed]
  48. Torres, A.; Puertas, I.; Luis, C.J. Surface roughness analysis on the dry turning of an Al-Cu alloy. Procedia Eng. 2015, 132, 537–544. [Google Scholar] [CrossRef]
  49. Okonkwo, U.C.; Okokpujie, I.P.; Sinebe, J.E.; Ezugwu, C.A.K. Comparative analysis of aluminium surface roughness in end-milling under dry and minimum quantity lubrication (MQL) conditions. Manuf. Rev. 2015, 2, 30. [Google Scholar] [CrossRef]
  50. Béjar, S.M.; Vilches, F.J.T.; Gamboa, C.B.; Hurtado, L.S. Fatigue behavior parametric analysis of dry machined UNS A97075 aluminum alloy. Metals 2020, 10, 631. [Google Scholar] [CrossRef]
  51. Korzeniewski, D.; Znojkiewicz, N. Surface texture of the milled surface of aluminum-ceramic composite. J. Mech. Sci. Technol. 2021, 35, 2879–2884. [Google Scholar] [CrossRef]
  52. Sługocka, M.; Grochała, D.; Kwiatkowski, K.; Grzejda, R.; Zmarzły, P. Study of the impact of surface topography on selected mechanical properties of adhesive joints. Coatings 2024, 14, 944. [Google Scholar] [CrossRef]
  53. Grochała, D.; Jasiewicz, M.; Filipowicz, K.; Parus, A.; Powałka, B.; Grzejda, R.; Zmarzły, P. Assessment of the functional properties of the surfaces of ductile cast iron parts. Appl. Sci. 2024, 14, 9129. [Google Scholar] [CrossRef]
  54. Govindarajan, S.; Dasari, B.P.; Jayaram, V. Effect of humidity and temperature on PVD TiAlN-coating wear. Metall. Mater. Trans. A 2025, 56, 387–399. [Google Scholar] [CrossRef]
  55. QUAKERCOOL® 7101 ALF. Available online: https://optimumoils.com/wp-content/uploads/2016/08/Quakercool-7101-ALF.TDS_-1.pdf (accessed on 23 July 2025).
  56. PN-EN ISO 25178-1; Geometrical Product Specifications (GPS), Surface Texture: Areal, Part 1: Indication of Surface Texture. Polish Committee for Standardization: Warsaw, Poland, 2016.
  57. PN-EN ISO 25178-2; Geometrical Product Specifications (GPS), Surface Texture: Areal, Part 2: Terms, Definitions and Surface Texture Parameters. Polish Committee for Standardization: Warsaw, Poland, 2022.
  58. PN-EN ISO 25178-3; Geometrical Product Specifications (GPS), Surface Texture: Areal, Part 3: Specification Operators. Polish Committee for Standardization: Warsaw, Poland, 2012.
  59. Macek, W. Correlation between fractal dimension and areal surface parameters for fracture analysis after bending-torsion fatigue. Metals 2021, 11, 1790. [Google Scholar] [CrossRef]
  60. Grochała, D.; Grzejda, R.; Parus, A.; Berczyński, S. The wavelet transform for feature extraction and surface roughness evaluation after micromachining. Coatings 2024, 14, 210. [Google Scholar] [CrossRef]
  61. Franco, L.A.; Sinatora, A. 3D surface parameters (ISO 25178-2): Actual meaning of Spk and its relationship to Vmp. Precis. Eng. 2015, 40, 106–111. [Google Scholar] [CrossRef]
  62. Podulka, P.; Macek, W.; Rozumek, D.; Żak, K.; Branco, R. Topography measurement methods evaluation for entire bending-fatigued fracture surfaces of specimens obtained by explosive welding. Measurement 2024, 224, 113853. [Google Scholar] [CrossRef]
  63. Ochal, A.; Grochała, D.; Grzejda, R.; Kochmańska, A.E. Investigations on changes in the surface geometrical texture caused by the use of corrosion product removers. Coatings 2025, 15, 539. [Google Scholar] [CrossRef]
  64. Qutubuddin, S.M.; Hebbal, S.S.; Kumar, A.C.S. A review on effect of industrial noise on the performance of worker and productivity. Int. Rev. Appl. Eng. Res. 2012, 2, 43–54. [Google Scholar]
  65. Eleftheriou, P.C. Industrial noise and its effects on human hearing. Appl. Acoust. 2002, 63, 35–42. [Google Scholar] [CrossRef]
  66. Dietmair, A.; Verl, A. Energy Consumption Modeling and Optimization for Production Machines. In Proceedings of the 2008 IEEE International Conference on Sustainable Energy Technologies, Singapore, 24–27 November 2008; pp. 574–579. [Google Scholar]
  67. Bi, Z.M.; Wang, L. Energy modeling of machine tools for optimization of machine setups. IEEE Trans. Autom. Sci. Eng. 2012, 9, 607–613. [Google Scholar] [CrossRef]
  68. 5-Axis Machining Centres F 10000–16000. Available online: https://www.heller.biz/en/machines-and-solutions/5-axis-machining-centres-f/10000-16000 (accessed on 16 July 2025).
  69. Grudzień, J.; Grochała, D.; Grzejda, R.; Kochmański, P. Testing the effectiveness of hybrid milling and surface burnishing in improving the wear resistance of machine parts made of structural steel. Lubricants 2024, 12, 458. [Google Scholar] [CrossRef]
  70. Grochała, D.; Grzejda, R.; Józwik, J.; Siemiątkowski, Z. Improving the degree of surface isotropy of parts manufactured using hybrid machining processes. Coatings 2025, 15, 461. [Google Scholar] [CrossRef]
  71. Diaz, N.; Helu, M.; Jarvis, A.; Tönissen, S.; Dornfeld, D.; Schlosser, R. Strategies for Minimum Energy Operation for Precision Machining; Laboratory for Manufacturing and Sustainability, University of California: Berkeley, CA, USA, 2009. [Google Scholar]
  72. Aspects of Energy Efficiency in Machine Tools. Available online: https://www.heidenhain.us/wp-content/uploads/25-AspectsofEnergyEfficiencyinMT.pdf (accessed on 16 July 2025).
  73. Alsayyed, B.; Hamdan, M.O.; Aldajah, S. Vortex Tube Impact on Cooling Milling Machining. In Proceedings of the ASME 2012 International Mechanical Engineering Congress and Exposition, Houston, TX, USA, 9–15 November 2012; pp. 773–776. [Google Scholar]
  74. Djebara, A.; Jomaa, W.; Bahloul, A.; Songmene, V. Dust Emission During Dry Machining of Aeronautic Aluminum Alloys. In Proceedings of the 1st International Conference on Aeronautics Sciences (ICAS), Oran, Algeria, 27–28 May 2013. [Google Scholar]
  75. Celent, L.; Bajić, D.; Jozić, S.; Mladineo, M. Hard milling process based on compressed cold air-cooling using vortex tube for sustainable and smart manufacturing. Machines 2023, 11, 264. [Google Scholar] [CrossRef]
  76. Stachurski, W.; Sawicki, J.; Krupanek, K.; Nadolny, K. A model and its experiment using compressed cold air to clean the active surface of a grinding wheel during sharping of a hob cutter. Int. J. Adv. Manuf. Technol. 2022, 122, 911–931. [Google Scholar] [CrossRef]
  77. Swain, S.; Patra, S.K.; Roul, M.K.; Sahoo, L.K. A short review on cooling process using compressed cold air by vortex tube in machining. Mater. Today Proc. 2022, 64, 382–389. [Google Scholar] [CrossRef]
  78. Maruda, R.W.; Wojciechowski, S.; Szczotkarz, N.; Legutko, S.; Mia, M.; Gupta, M.K.; Nieslony, P.; Krolczyk, G.M. Metrological analysis of surface quality aspects in minimum quantity cooling lubrication. Measurement 2021, 171, 108847. [Google Scholar] [CrossRef]
  79. Lisowicz, J.; Krupa, K.; Leksycki, L.; Rusinek, R.; Wojciechowski, S. Analysis of tool wear in finish turning of titanium alloy Ti-6Al-4V under minimum quantity lubrication conditions observed with recurrence quantification analysis. Materials 2025, 18, 79. [Google Scholar] [CrossRef]
  80. Semanová, P.; Kučera, M. Health effects from occupational exposure to metalworking fluid mist. Key Eng. Mater. 2013, 581, 112–118. [Google Scholar]
  81. The F 8000 High-Performance Machining Centre. Available online: https://www.heller.biz/en/news/the-f-8000-high-performance-machining-centre (accessed on 17 July 2025).
Figure 1. Test part: (a) Excess material which was cut during the tests, marked in red. (b) A section of the area where the SGT measurements were carried out, marked in yellow.
Coatings 15 00971 g001
Figure 2. Experimental test bench: (a) Sandvik CoroMill 390 face milling cutter (Sandvik Group, Stockholm, Sweden) mounted in horizontal spindle. (b) Heller H2000 machining centre (Heller Holding SE & Co., Nürtingen, Germany).
Coatings 15 00971 g002
Figure 3. Views of the surfaces of samples machined with coolant in the following cases: (a) AC1 (vc = 1760 m/min; fm = 2000 mm/min); (b) AC2 (vc = 1760 m/min; fm = 1000 mm/min); (c) AC3 (vc = 1760 m/min; fm = 500 mm/min); (d) BC1 (vc =1130 m/min; fm = 1500 mm/min).
Coatings 15 00971 g003
Figure 4. Views of the surfaces of samples machined with coolant in the following cases: (a) BC2 (vc =1130 m/min; fm = 1000 mm/min); (b) BC3 (vc = 1130 m/min; fm = 500 mm/min).
Coatings 15 00971 g004
Figure 5. Views of the surfaces of samples machined without coolant in the following cases: (a) AD1 (vc = 1760 m/min; fm = 2000 mm/min); (b) AD2 (vc = 1760 m/min; fm = 1000 mm/min); (c) AD3 (vc = 1760 m/min; fm = 500 mm/min); (d) BD1 (vc =1130 m/min; fm = 1500 mm/min); (e) BD2 (vc =1130 m/min; fm = 1000 mm/min); (f) BD3 (vc = 1130 m/min; fm = 500 mm/min).
Coatings 15 00971 g005
Figure 6. Ra values of 2D roughness profiles and Sa values of 3D surfaces obtained during experimental tests.
Coatings 15 00971 g006
Figure 7. Surface indices Sz, Sp and Sv after HPM.
Coatings 15 00971 g007
Figure 8. Abbott-Firestone curve for an example surface.
Coatings 15 00971 g008
Figure 9. Surface indices Vm and Vv after HPM.
Coatings 15 00971 g009
Figure 10. Surface indices Vmc and Vvc after HPM.
Coatings 15 00971 g010
Figure 11. Surface indices Vmp and Vvv after HPM.
Coatings 15 00971 g011
Table 1. Chemical composition of EN AC-AL Si9Cu3(Fe) aluminium alloy.
ComponentSiFeCuMnMgCrNiZnPbSnTiOther
Percentage8 ÷ 110.6 ÷ 1.12 ÷ 40.550.15 ÷ 0.550.150.551.20.290.150.200.25
Table 2. Adopted experimental plan.
Cutting Speed vc (m/min)1760113017601130
SampleAC1AC2AC3BC1BC2BC3AD1AD2AD3 BD1 BD2 BD3
Cutter Feed fm (mm/min)20001000500150010005002000100050015001000500
Feed per Blade fb (mm/blade)0.040.020.010.040.030.010.040.020.010.040.030.01
Table 3. Selected SGT indices determined during this study.
SampleAC1AC2AC3BC1BC2BC3AD1AD2AD3 BD1 BD2 BD3
Ra  (μm)0.330.180.540.510.761.160.370.410.260.440.381.03
Sa (μm)0.370.250.550.620.791.230.460.420.280.530.431.20
Sz  (μm)7.729.107.808.557.4110.77.726.054.197.204.7415.5
Sp  (μm)4.625.724.555.624.266.084.053.342.454.122.319.72
Sv  (μm)3.103.383.252.933.154.603.672.711.733.082.445.81
Vm  (μm3/mm2)2.002.202.404.204.404.003.303.102.003.703.2011.7
Vv  (μm3/mm2)63.540.086.194.713119077.192.152.999.492.2190
Vmp  (μm3/mm2)2.002.202.404.204.404.003.303.102.003.703.2011.7
Vmc  (μm3/mm2)41.825.364.476.990.715652.843.329.153.644.9118
Vvc  (μm3/mm2)59.235.479.488.312417868.087.049.595.486.5183
Vvv  (μm3/mm2)4.24.76.76.47.0129.15.13.54.05.77.3
Table 4. The values of the KSx index in the form of a heatmap-type table 1.
Indexvc = 1760 m/minvc = 1130 m/min
fm (mm/min)fm (mm/min)
2000100050015001000500
KRa−0.11−0.571.020.160.970.12
KSa−0.20−0.420.990.160.850.02
KSz0.000.500.860.190.56−0.31
KSp0.140.710.850.370.85−0.37
KSv−0.160.250.88−0.050.29−0.21
KVv−0.18−0.570.63−0.050.420.00
KVmp−0.40−0.300.190.160.38−0.66
KVmc−0.21−0.421.210.431.020.32
KVvc−0.13−0.590.60−0.070.43−0.02
KVvv−0.53−0.090.950.610.230.64
1 Explanation: A heatmap is a data visualisation technique that uses a colour gradient to represent the magnitude of values in a data set. It is a way of visually representing data in a two-dimensional space, allowing for quick identification of trends and areas of interest. The colours used in the map range from cool (for high values) to warm (for low values), making it easier to spot trends and outliers.
Disclaimer/Publisher’s Note: The statements, opinions and data contained in all publications are solely those of the individual author(s) and contributor(s) and not of MDPI and/or the editor(s). MDPI and/or the editor(s) disclaim responsibility for any injury to people or property resulting from any ideas, methods, instructions or products referred to in the content.