Article

SEM Image Segmentation Method for Copper Microstructures Based on Enhanced U-Net Modeling

1
School of Railway Transportation, Shanghai Institute of Technology, Shanghai 201418, China
2
College of Information Technology, Jilin Agricultural University, Changchun 130118, China
3
Center for Advanced Electronic Materials and Devices, Shanghai Jiao Tong University, Shanghai 200241, China
*
Authors to whom correspondence should be addressed.
Coatings 2025, 15(8), 969; https://doi.org/10.3390/coatings15080969
Submission received: 13 July 2025 / Revised: 30 July 2025 / Accepted: 8 August 2025 / Published: 20 August 2025
(This article belongs to the Section Surface Characterization, Deposition and Modification)

Abstract

Grain boundary segmentation in scanning electron microscope (SEM) images of pure copper presents substantial challenges for traditional image processing methods, including constrained segmentation precision and difficulties in identifying elongated grain boundaries and intricate topological structures. To overcome these constraints, this research introduces a comprehensive framework that integrates dataset development, advanced data augmentation, and model optimization to achieve precise grain boundary segmentation. This work proposes three principal innovations. First, a meticulously curated small-scale dataset, combined with a sophisticated adaptive data augmentation strategy, addresses data scarcity and ensures high-quality, robust training data. Second, the U-Net model was refined by incorporating a self-attention mechanism, markedly enhancing its capability to capture global contextual information and accurately detect complex grain boundary features. Third, an optimized stratified K-fold cross-validation method was implemented to ensure equitable data partitioning and reduce overfitting, thereby strengthening the model’s generalization capability. Experimental results demonstrate that the proposed framework delivers exceptional performance on the validation dataset, achieving a global accuracy of 0.96, a Dice coefficient of 0.91, and a mean Intersection over Union (mIoU) of 0.85. These metrics underscore significant advancements in grain boundary segmentation precision for polycrystalline metal systems. The framework validates the power of deep learning in microstructural characterization and establishes a reliable computational tool for quantitative metallographic analysis. It is well-positioned to extend to the microstructural analysis of a broad range of heterogeneous materials, enabling deeper insights into microstructure–property relationships in materials engineering.

1. Introduction

Metallography, a pivotal discipline in materials science, investigates the microstructure of metals and alloys to elucidate their relationships with mechanical properties, such as strength, ductility, hardness, and corrosion resistance [1]. This field provides critical insights into how grain size, shape, phase distribution, and boundary characteristics influence material performance under diverse service conditions. Scanning electron microscopy (SEM) is a cornerstone technique, delivering high-resolution morphological and compositional data through electron–sample interactions, enabling precise characterization of microstructural features [2,3].
Grain and grain boundary segmentation is a crucial step in metallographic analysis, enabling quantitative correlations between microstructure and material properties. Accurate segmentation facilitates measurements of grain size, phase fractions, and boundary networks, which are essential for predicting mechanical behavior and optimizing material properties. Accurate grain boundary segmentation in pure copper is critical for optimizing surface properties in coatings, where grain size and boundary networks influence corrosion resistance, adhesion, and mechanical performance. This research addresses the need for precise microstructural characterization to support the design of advanced copper-based coatings for applications in electronics and energy sectors. However, segmenting complex microstructures is challenging due to low contrast, noise interference, and artifacts from sample preparation. These issues are particularly pronounced in pure copper, which exhibit narrow grain boundaries and twinning phenomena that complicate segmentation efforts [4]. Moreover, the scarcity of metallographic image datasets for pure copper and the inherent class imbalance between grain and grain boundary pixels limit the effectiveness of conventional image processing techniques [5]. Unlike steels and aluminum alloys, which have been extensively studied, pure copper has received less attention in segmentation research, underscoring the need for specialized approaches.
The proposed pipeline focuses on grain boundary segmentation in pure copper surfaces, using electrolytic tough pitch copper as the experimental material to represent copper-based systems, as detailed in prior work. By integrating data augmentation to address data scarcity, stratified K-fold cross-validation to balance class distributions, and a self-attention mechanism to model complex grain and twinning structures, the approach aims to enhance segmentation accuracy. This framework seeks to provide a robust tool for microstructural analysis, advancing the understanding of pure copper microstructures and their mechanical properties to support the development of high-performance materials, particularly for advanced copper-based coatings in electronics and energy applications.

2. Related Work

Microstructure segmentation methods span traditional image processing techniques and advanced deep learning approaches, with their applicability determined by the microstructural characteristics of the material under study. Conventional methods, such as thresholding, edge detection, and region growing, have been widely employed. For instance, in carbon steels (e.g., AISI 1008/1020), preparation artifacts often result in faded grain boundaries, rendering thresholding ineffective. The marker-controlled watershed method, enhanced by ultimate opening operations, addresses this by identifying grain cores and reconstructing boundaries from internal features [4]. In aluminum alloys (e.g., 7050 alloy) with discontinuous grain boundaries, fuzzy logic edge detection leverages the statistical property that grain boundary pixels are darker and sparse, using morphological operations to connect fractured boundaries [6]. For titanium alloys (e.g., Ti6Al4V), which exhibit grayscale inversion in optical and SEM images due to their multiphase structure, gradient-direction-driven watershed transforms separate phase boundaries by analyzing the dominant orientation of lamellar colonies [7].
Traditional methods, however, struggle with complex microstructures, such as those in ultra-high carbon steels or additively manufactured alloys, where deep learning approaches have gained prominence due to their robust feature extraction and generalization capabilities [8]. Convolutional Neural Networks (CNNs) with convolutional layers replacing fully connected layers, combined with majority voting strategies, have achieved precise phase region segmentation in steel metallographic images [9]. The U-Net model, an extension of Fully Convolutional Neural Networks (FCNNs), utilizes a symmetric encoder–decoder architecture with multi-level skip connections to preserve fine details, making it effective for small-target segmentation in data-constrained scenarios. For example, U-Net integrated with EBSD-derived grain boundary and orientation data has identified topological features in lath bainite within low-carbon complex-phase (CP) steel [10]. Comparisons of SegNet and U-Net for duplex steel segmentation have demonstrated U-Net’s superior accuracy [11]. In multiphase steel, U-Net trained on optical microscopy, SEM, and EBSD data achieved 90% accuracy in pearlite segmentation [12]. Further improvements include optimizing U-Net with a weighted loss function to prioritize topological information, enhancing grain boundary detection [13].
Despite these advances, pure copper presents distinct challenges due to its unique grain boundary morphologies and twinning phenomena, compounded by limited datasets and class imbalances [14,15]. Existing research primarily focuses on steels and aluminum alloys, leaving a gap in tailored solutions for pure copper segmentation. To address this, we propose a pipeline that leverages data augmentation to mitigate data scarcity, stratified K-fold cross-validation to balance class distributions, and a self-attention mechanism to model complex grain and twinning structures, aiming to deliver accurate segmentation for pure copper microstructural analysis.

3. Materials

3.1. Material Preparation

To prepare a copper sheet for scanning electron microscopy (SEM) analysis, a representative sample is selected and precisely cut to the specified dimensions using a precision cutting tool to ensure a flat, uniform surface. The sample is then subjected to a series of sequential polishing steps to eliminate surface scratches and irregularities, achieving a highly smooth finish. Following polishing, the sample is cleaned in an ultrasonic bath using ethanol to remove all residual polishing compounds and surface contaminants, ensuring a contaminant-free surface. The cleaned sample is subsequently dried with a stream of clean, dry air to eliminate any water and solvent residues. Finally, the dried copper sheet is firmly mounted onto the SEM sample holder to prevent movement during imaging. This rigorous preparation procedure is essential to achieve high-resolution, accurate imaging in the scanning electron microscope.

3.2. Dataset

3.2.1. Dataset Description

The research focuses on segmenting grain boundaries in microstructural images of pure copper surfaces using a deep learning-based approach (U-Net), with electrolytic tough pitch copper selected as the experimental material to represent copper-based systems. The image dataset was acquired at the laboratory of Carl Zeiss (Shanghai) Management Co., Ltd., located in the Shanghai Free Trade Pilot Zone, using a ZEISS GeminiSEM 300 Field Emission Scanning Electron Microscope (FESEM) equipped with a backscattered electron (BSE) detector. BSE imaging was chosen for its sensitivity to variations in mean atomic number, which, in pure copper, reveals subtle differences in crystallographic orientation and trace impurity distributions, as indicated by grayscale variations in the images (see Figure 1). These variations effectively delineate grain boundaries and morphologies in pure copper, showcasing grains of diverse sizes and shapes formed during grain growth in solid-state cooling, with excellent internal metal continuity and uniform structure. The use of BSE imaging provides robust contrast for grain boundary detection, making it well-suited for deep learning-based segmentation compared to secondary electron (SE) imaging, which emphasizes surface morphology, or forescattered electron imaging, which is better suited for crystallographic orientation analysis via EBSD.
To ensure dataset consistency, all BSE images were captured under identical imaging conditions: an accelerating voltage of 1 kV, a working distance of 4.9 mm, a magnification of 1000×, and fixed contrast and brightness settings optimized for image clarity. A calibration plate was positioned on the sample stage to ensure accurate imaging parameters. The images have a resolution of 2048 × 1536 pixels with a pixel size of 55.82 nm. The dataset comprises 92 original images, each manually segmented and labeled to generate corresponding grain boundary mask images, which serve as ground truth for model training and evaluation. The limited dataset size, due to the high cost and time-intensive nature of SEM image acquisition, increases the risk of model overfitting and constrains generalization. These challenges are addressed through data augmentation, as described in the following subsection.

3.2.2. Dataset Augmentation

To address the issues of a small dataset (92 images) and class imbalance, while mitigating the risk of overfitting due to limited data, this study employs data augmentation techniques to enhance the diversity of the training dataset and improve model generalization [16]. Unlike natural images, which exhibit rich colors and dynamic range, scanning electron microscope (SEM) images are generated through the interaction of an electron beam with the material’s surface, producing high-resolution, high-contrast grayscale images that reveal intricate microstructural details. Consequently, augmentation of SEM images requires a conservative approach to preserve critical features (e.g., grain boundary morphology) and avoid introducing artifacts that may compromise the accuracy of scientific analysis. Excessive or inappropriate augmentation, such as extreme geometric transformations or blurring, may distort key details and hinder the model’s ability to accurately learn sample characteristics.
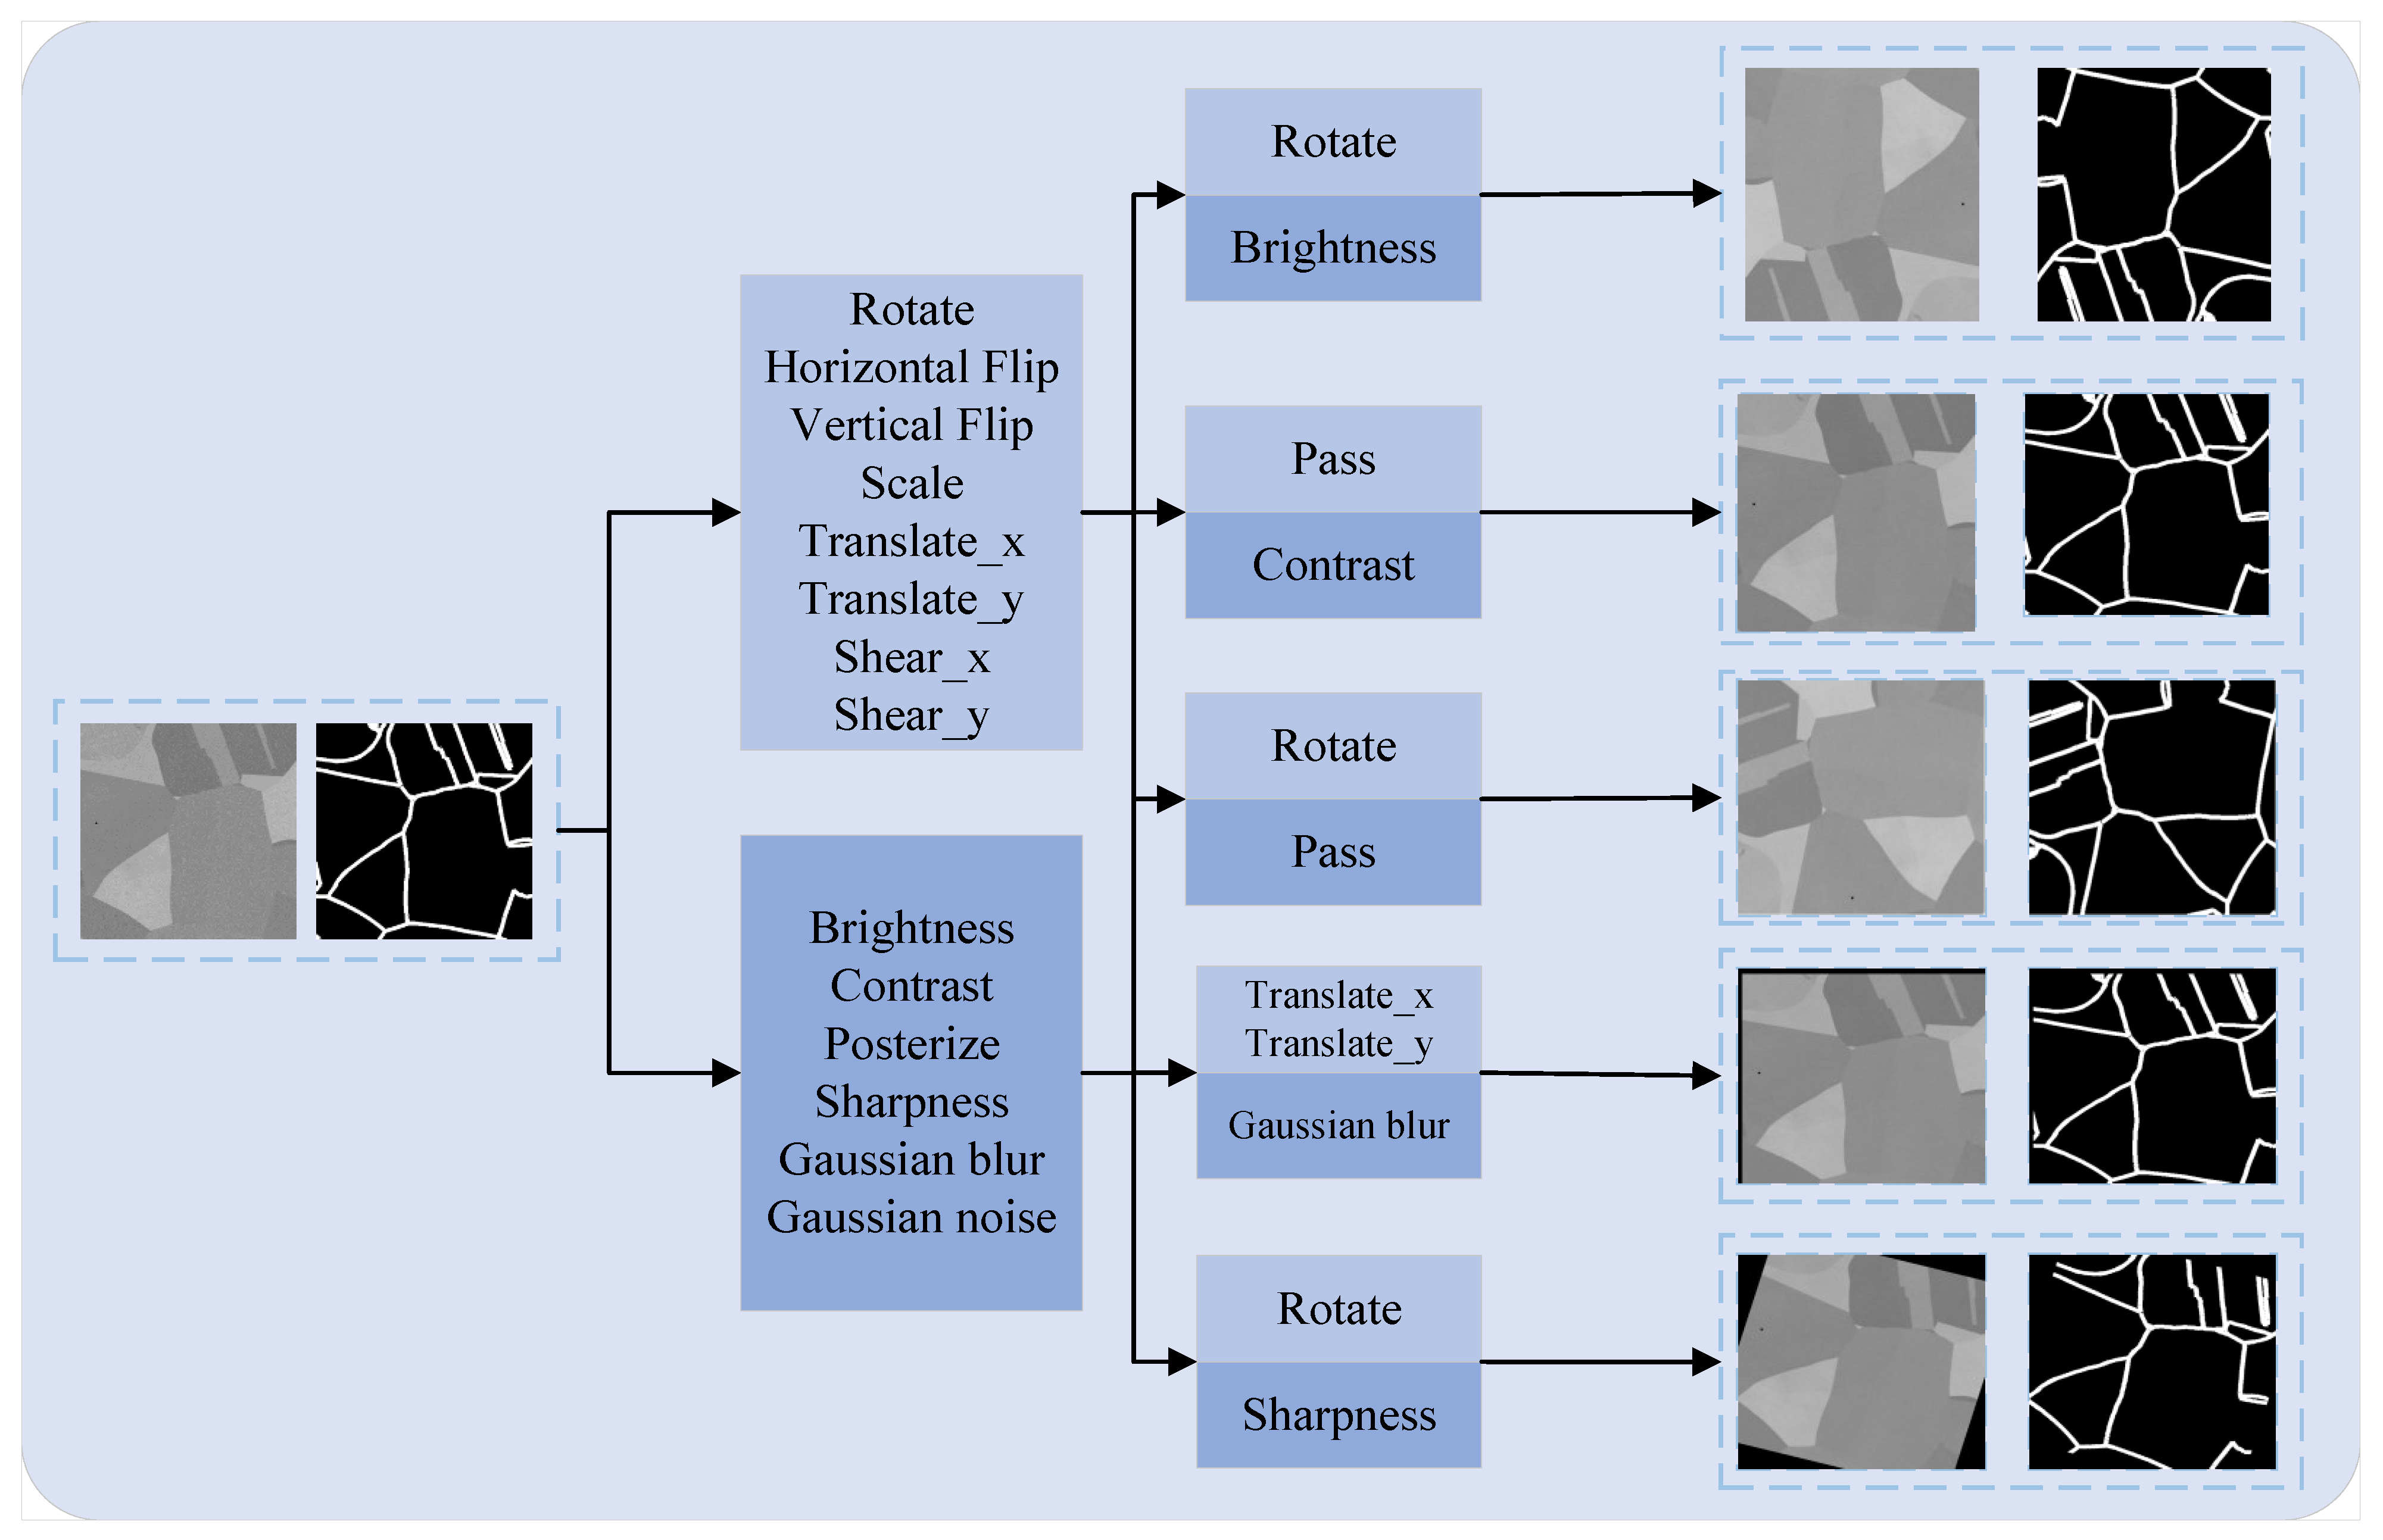
This study adopts the MedAugment method, originally designed for medical imaging and adapted for SEM images [17]. MedAugment employs a novel sampling strategy, selecting a limited set of operations from pixel and spatial augmentation spaces, combined with hyperparameter mapping to achieve moderate augmentation, as shown in Figure 2. This method preserves key SEM image features while expanding the dataset from 92 to 460 images. The augmented dataset is divided into a training set (368 images) and a test set (92 images) at an 8:2 ratio. The dataset production workflow, including image acquisition, labeling, and augmentation, is illustrated in Figure 1.

4. Methods

4.1. Preventing Overfitting

Data augmentation enhances dataset diversity to mitigate overfitting risks due to a limited dataset size, but augmented data may lead to overfitting specific transformation patterns. To address this issue, this study employs an improved stratified cross-validation method and a tailored learning rate scheduling strategy to ensure model robustness and generalization [18].
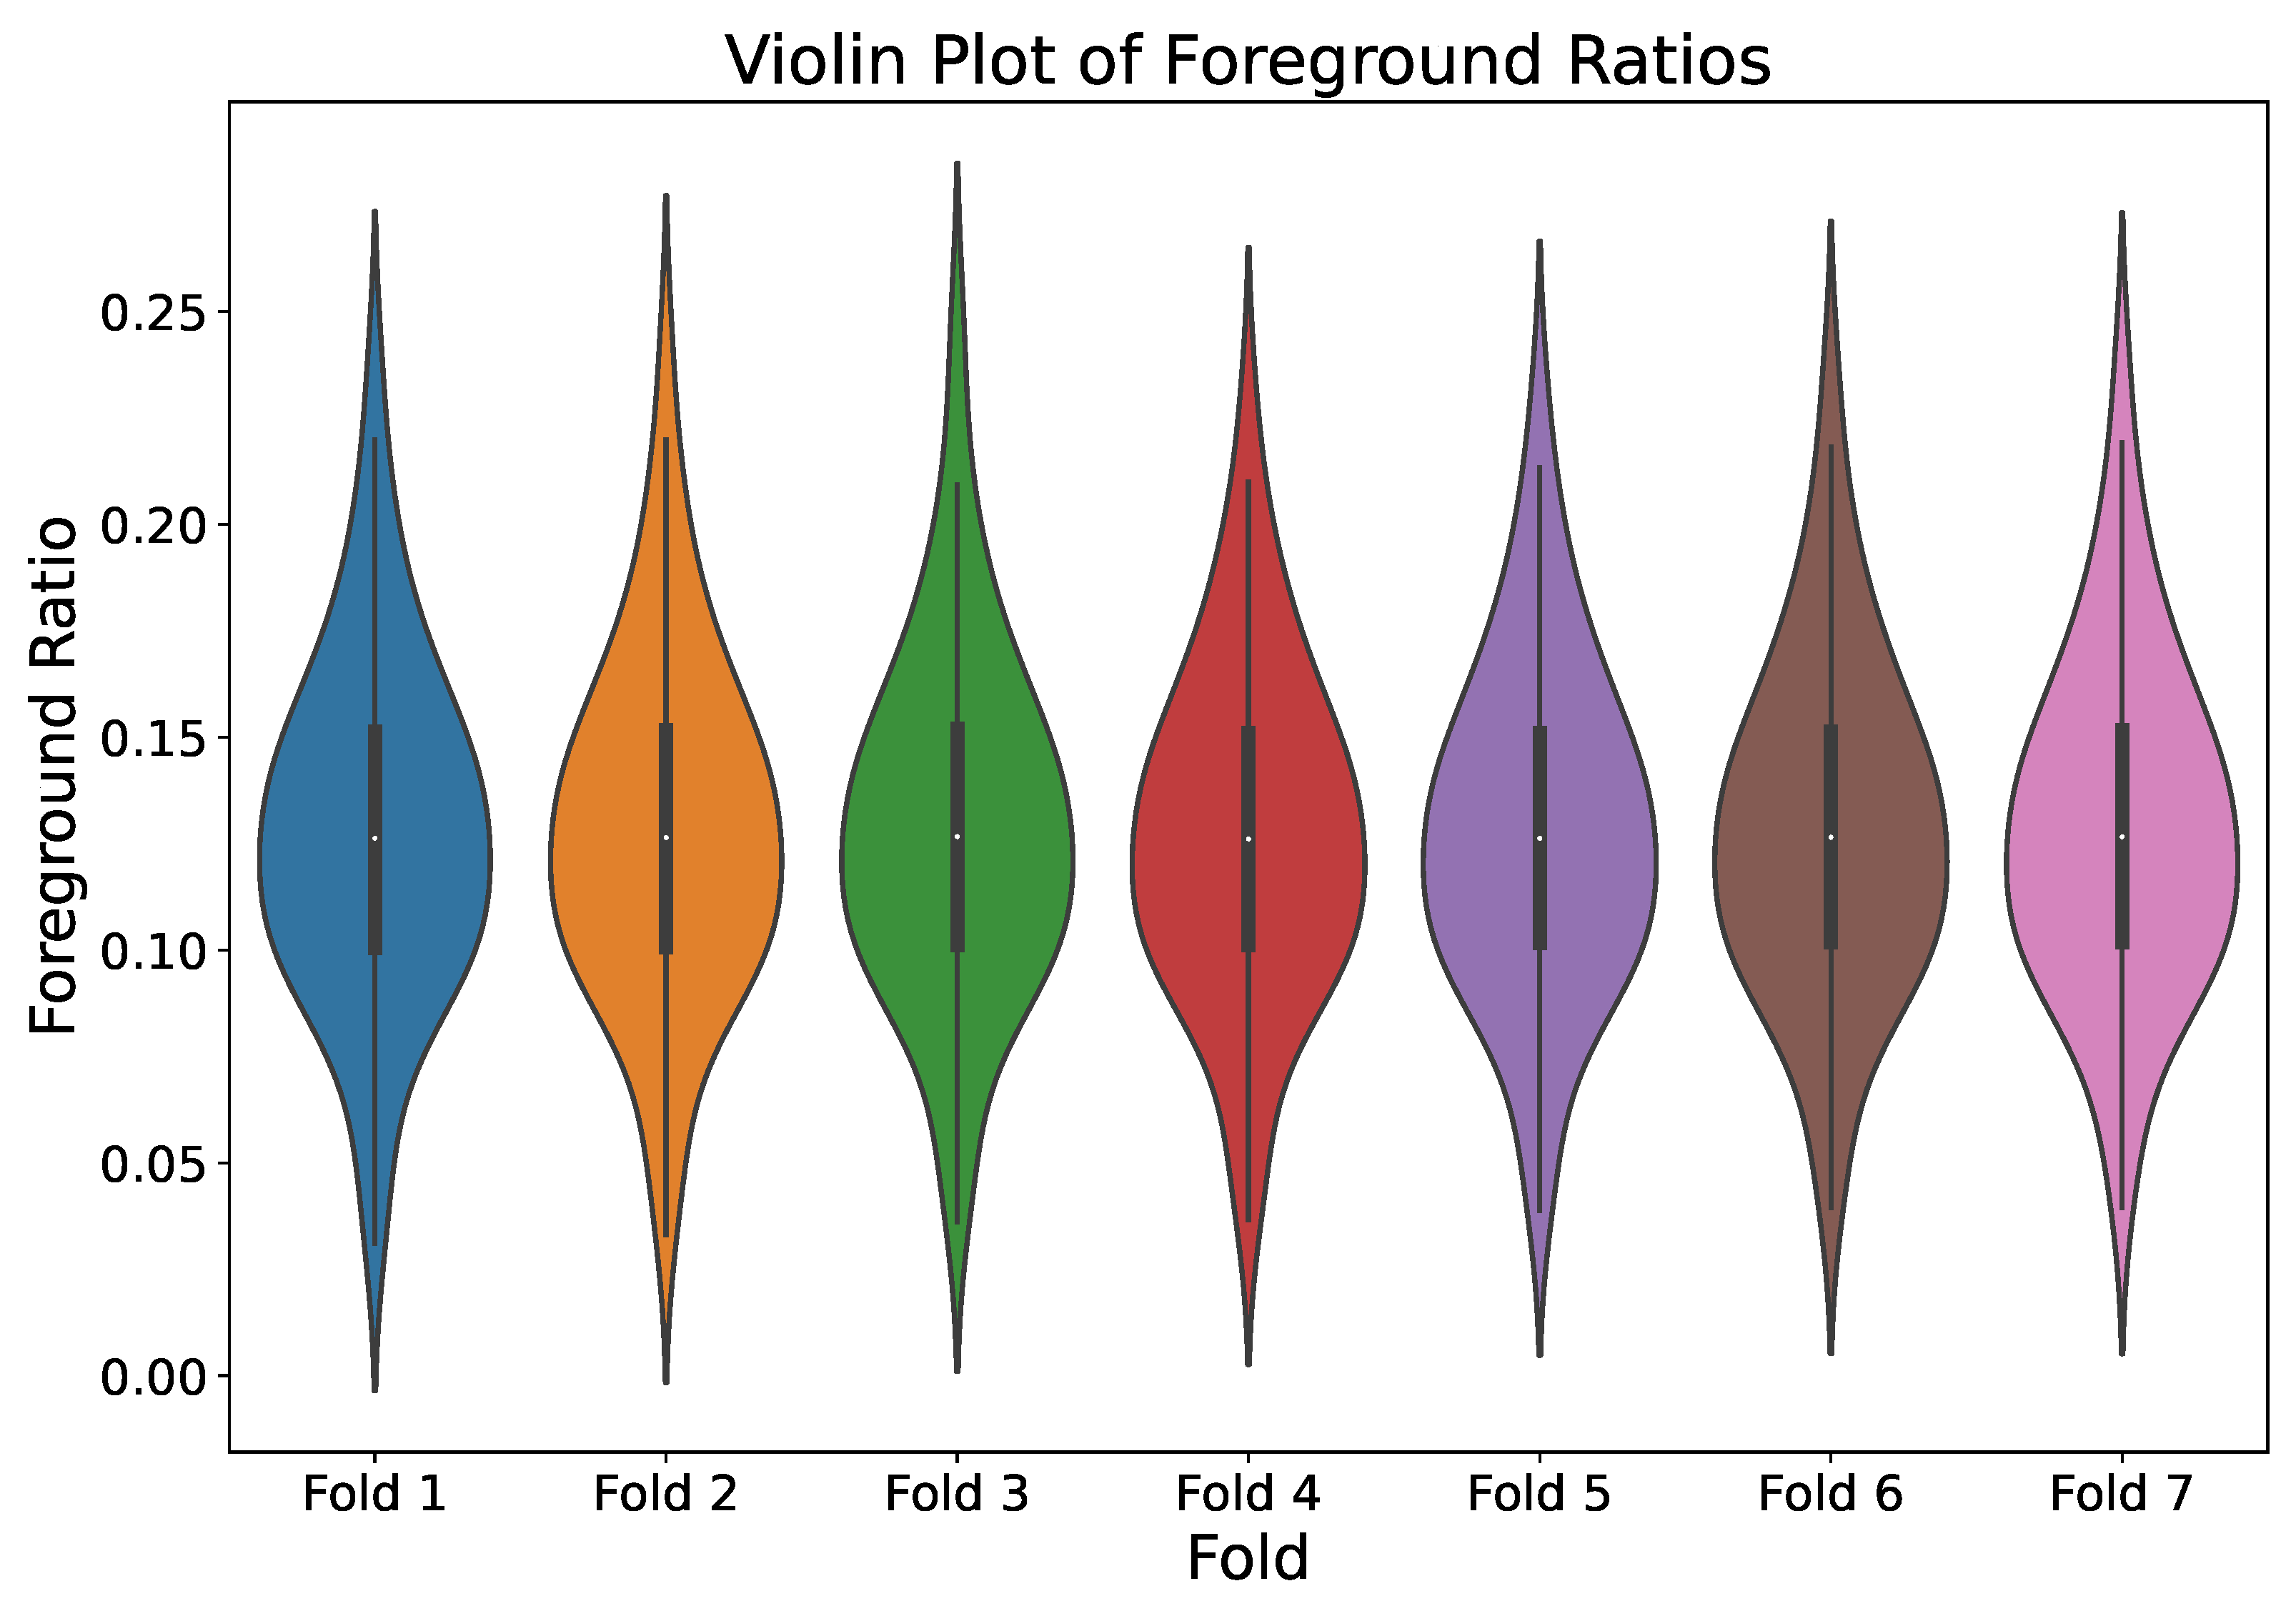
The improved stratified cross-validation method partitions the dataset into three non-overlapping folds (K = 3). Each iteration uses two folds as the training set and one fold as the validation set, repeated three times to ensure each fold serves as the validation set once. Validation results are averaged to robustly assess model performance, as shown in Figure 3. The process begins by computing the foreground pixel ratio for each labeled image, sorting images by this ratio, and dividing the dataset into equal-sized intervals. Stratified sampling assigns discrete labels to images within each interval, ensuring uniform distribution of foreground ratios across folds. This approach, effective for imbalanced datasets, maintains consistent category proportions and reduces bias from foreground-background disparities. The model is trained on each fold’s training set and evaluated on its validation set, with performance metrics (e.g., Dice coefficient and Intersection over Union (IoU)) aggregated across folds. The histogram of foreground ratios in Figure 4 confirms the balanced distribution achieved through stratified cross-validation.
To further prevent overfitting, the training process employs a learning rate schedule with a warm-up and decay strategy. High initial learning rates may cause parameter oscillations, impeding convergence. This study uses a warm-up phase to gradually increase the learning rate over the first five epochs to accelerate optimization, followed by a decay phase for precise parameter tuning. The poly learning rate adjustment, derived from DeepLab-v2 [19], balances convergence speed and training stability, optimizing efficiently for small-scale datasets. The learning rate is defined as
lr = 1 x warmup_epochs × num_step ( epochs warmup_epochs ) × num_step 0.9
where x is the current step, warmup_epochs is the number of warm-up epochs (set to 5 in this study), num_step is the number of steps per epoch, and epochs is the total number of epochs. This learning rate adjustment method effectively balances convergence speed and training stability, enhancing model performance and generalization capability.

4.2. Model Introduction and Improvement

U-Net is a classic deep learning model initially developed for medical image segmentation [20]. Its encoder–decoder architecture with skip connections effectively integrates multi-scale features, preserving high-resolution details and making it suitable for high-precision segmentation tasks [21]. However, U-Net relies on convolutional operations, which are constrained by local receptive fields and struggle to capture long-range dependencies, resulting in limited accuracy for segmenting complex structures. To address these limitations, variants such as TransUNet [22] and Attention U-Net [23] have been proposed. TransUNet incorporates a Transformer module at the bottleneck layer to capture global spatial relationships, but its ResNet + Transformer encoder architecture is computationally intensive, requiring substantial data and limiting its applicability to small datasets. Attention U-Net introduces attention gates in skip connections to dynamically weight features, suppressing background noise and enhancing multi-scale target segmentation accuracy. However, its attention mechanism, based on local convolutions, struggles to fully model global context, constraining its performance in complex grain boundary segmentation.
To overcome these challenges, the present study introduces CUNet (Copper U-Net), a U-Net variant optimized for segmentation of pure copper SEM images. CUNet embeds a lightweight self-attention mechanism in the encoder, balancing global context modeling with computational efficiency through channel reduction and residual connections. In contrast to TransUNet, which applies a Transformer at the low-resolution bottleneck layer (32 × 32), CUNet employs self-attention at a higher resolution (64 × 64), preserving fine-grained spatial details, reducing computational complexity, and adapting to small datasets while significantly improving segmentation accuracy for slender or blurry grain boundaries.
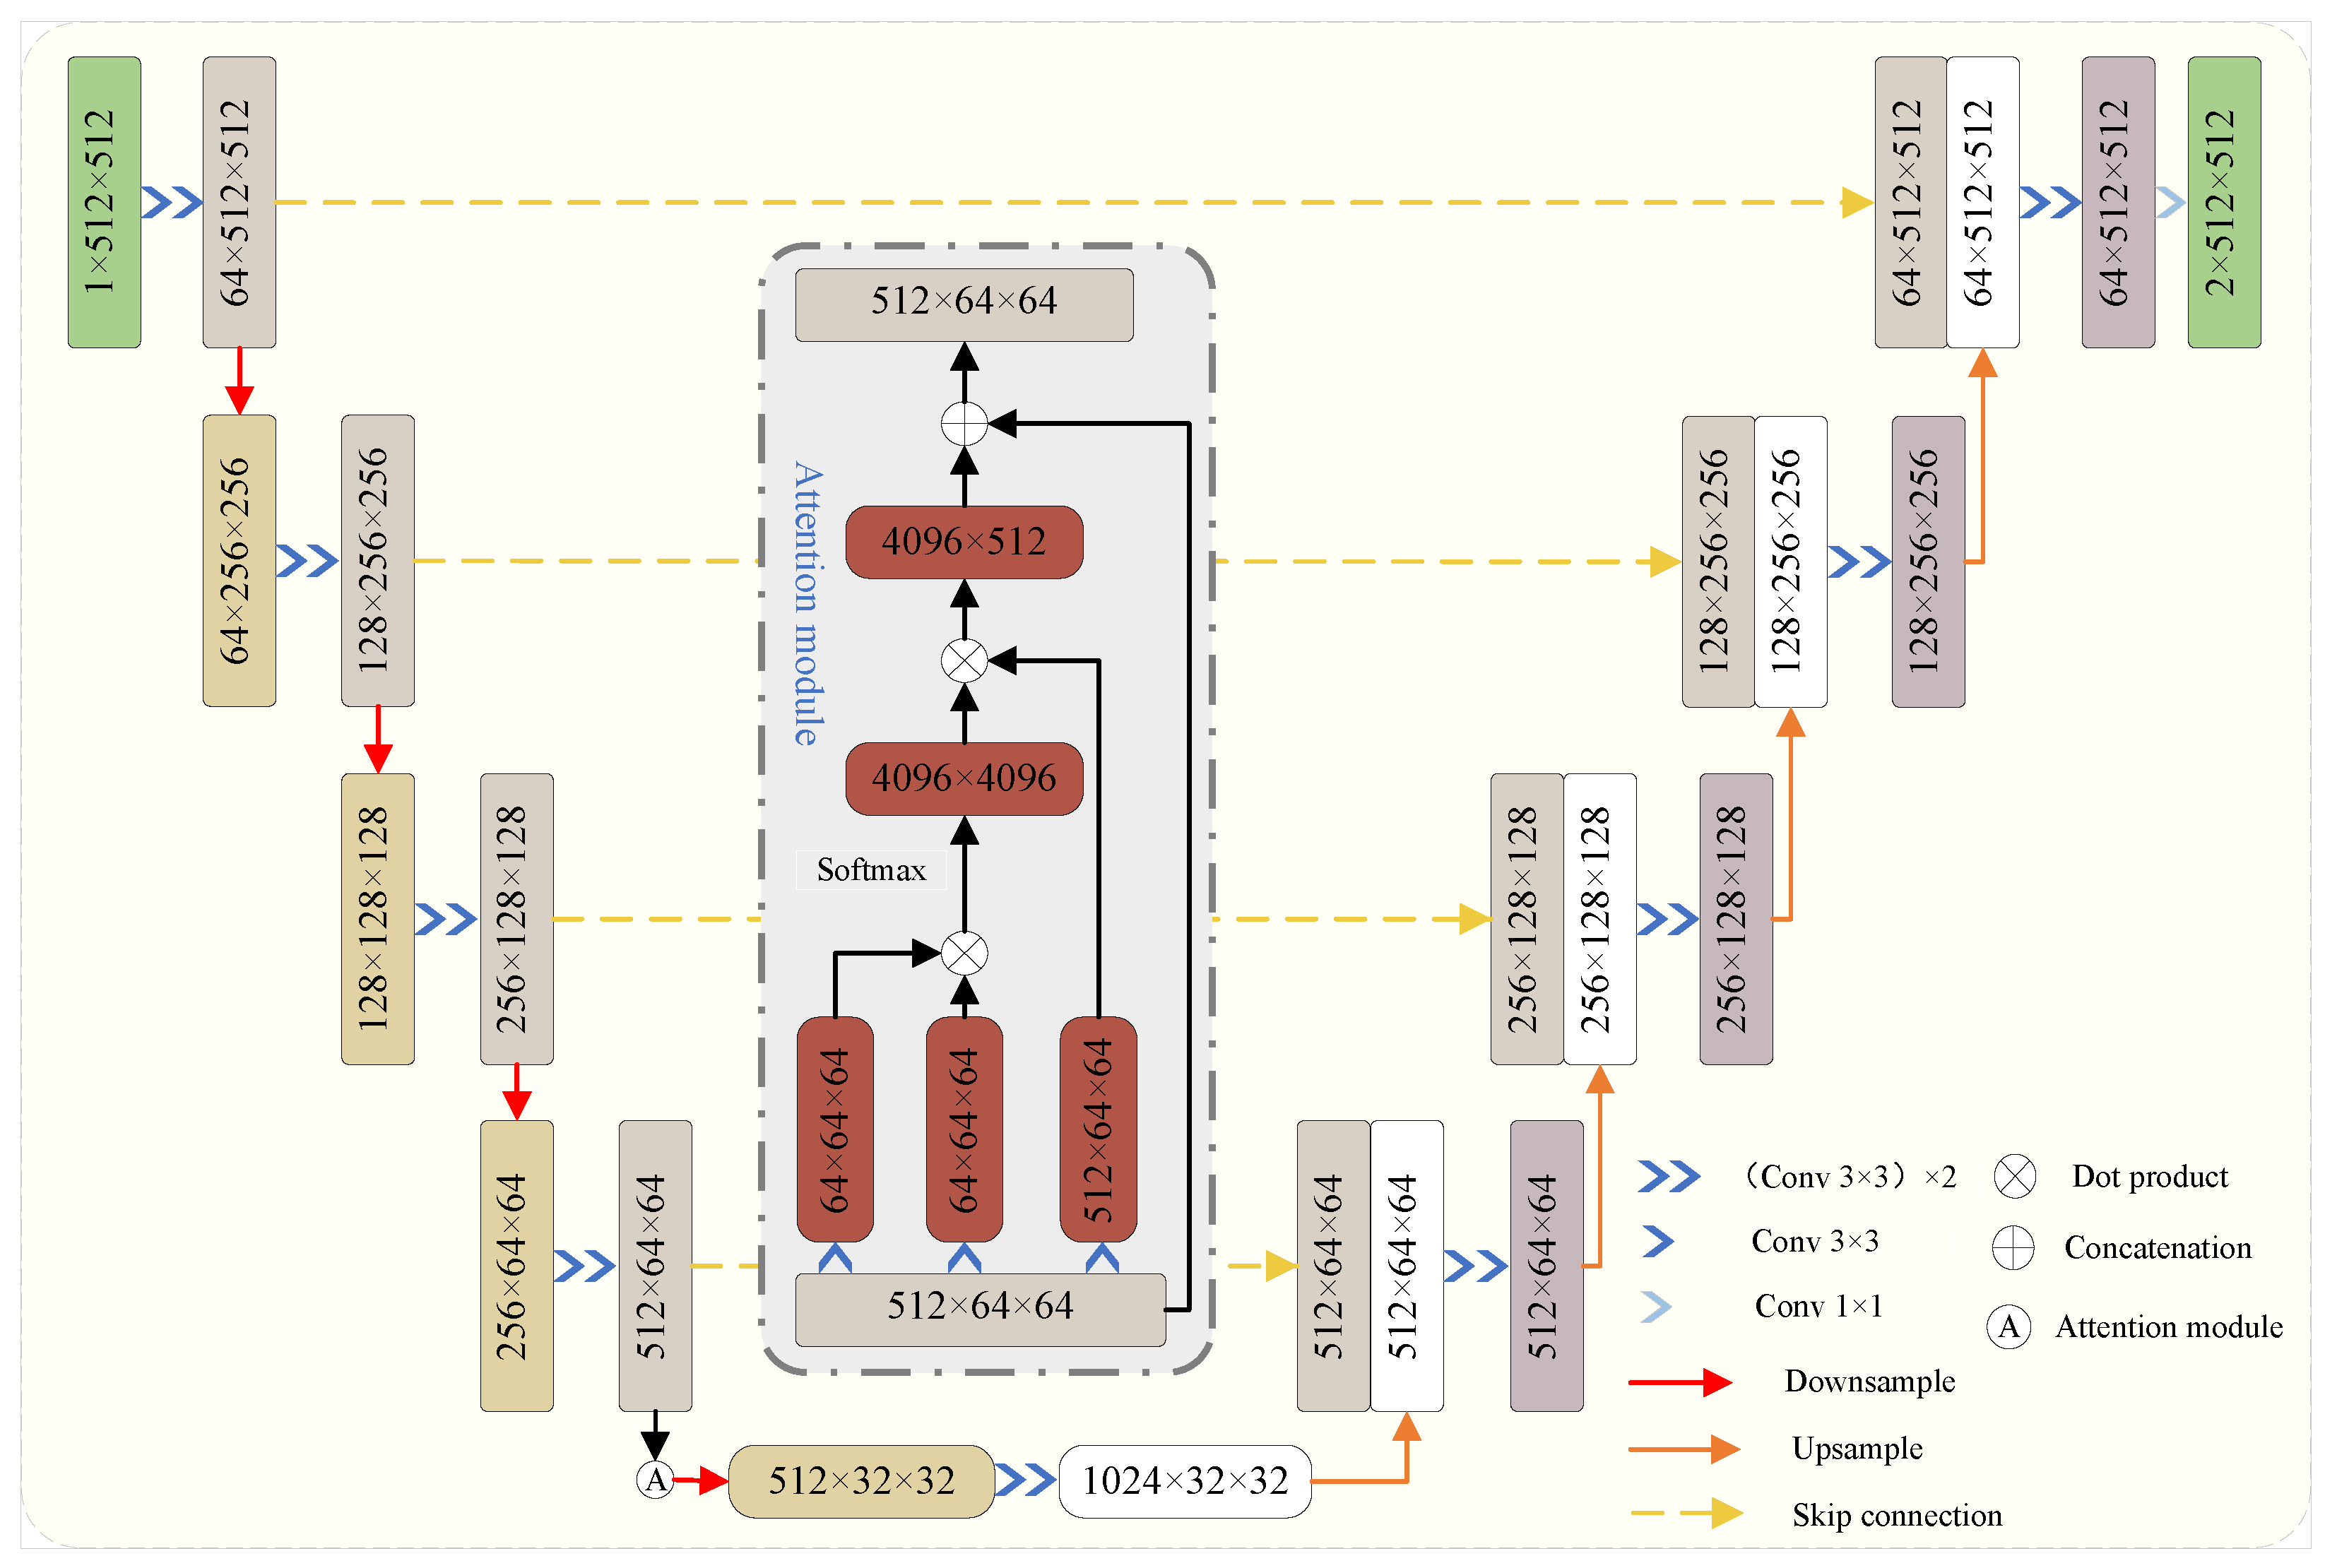
As illustrated in Figure 5, CUNet builds upon the U-Net framework by integrating a lightweight self-attention mechanism in the encoder. Input feature maps are mapped to Query, Key, and Value spaces via convolutional operations, addressing the limitations of traditional convolutions. To reduce computational complexity, the channel dimensions of Query and Key are reduced to C 8 , while Value retains the original channel dimension C. The dot product of Query and Key generates an attention matrix, normalized by a scaling factor d k (where d k = C 8 ) to stabilize gradients, followed by a Softmax function to produce the attention weight matrix. This matrix is multiplied with Value to generate weighted features, reshaped to B × C × H × W . A learnable parameter γ weights the attention output, which is combined with the input features via a residual connection, enhancing training stability and preserving input feature information.
CUNet applies the self-attention mechanism [24] at the higher-resolution stage (64 × 64) of the encoder, preserving fine-grained spatial details critical for segmenting slender or blurry grain boundaries in pure copper SEM images. Channel reduction further mitigates the quadratic complexity of the self-attention mechanism, ensuring computational efficiency. CUNet retains U-Net’s skip connections, fusing low-level features from the encoder with high-level semantic features in the decoder to preserve high-resolution details, which is essential for accurately delineating fine grain boundaries in metallographic segmentation.
Through channel reduction and residual connections, CUNet significantly reduces model parameters and computational overhead, making it well-suited for small datasets. This design minimizes the risk of overfitting, enabling robust performance in data-limited scenarios.
Compared to other context modeling approaches, CUNet’s self-attention mechanism outperforms the Squeeze-and-Excitation (SE) module, which only recalibrates channels, the Convolutional Block Attention Module (CBAM), which is limited by local receptive fields, and the Pyramid Scene Parsing Network (PSPNet), which relies on fixed-scale operations. CUNet demonstrates superior robustness and accuracy in segmenting slender or blurry grain boundaries. By integrating U-Net’s skip connections to preserve high-resolution features and adapting to small datasets, CUNet provides an efficient and robust solution for segmenting complex metallographic topological structures.

4.3. Evaluation Criteria and Computational Resources

The loss function quantifies the discrepancy between model predictions and true labels, guiding parameter optimization in deep learning to enhance prediction accuracy. The present work adopts the Dice coefficient as the training loss function. Model performance on the validation set is assessed using Global Correct, Dice coefficient, and Mean Intersection over Union (MIoU), defined below.
Model validation involves comparing segmentation results with ground truth to construct a confusion matrix, comprising true positives (TPs), false positives (FPs), true negatives (TNs), and false negatives (FNs), as shown in Table 1. A TP denotes pixels correctly predicted as boundaries, an FP indicates pixels incorrectly predicted as boundaries, a TN represents pixels correctly predicted as non-boundaries, and an FN signifies pixels incorrectly predicted as non-boundaries. These metrics underpin the evaluation of segmentation performance.
Global Correct is a simple metric used to measure the overall prediction performance of a model. It calculates the total number of pixels or samples correctly predicted by the model over the entire dataset. In layman’s terms, Global Correct is the number of all correctly predicted pixels or samples as a percentage of the total number of pixels or samples. Global Correct is a simple and intuitive metric that is suitable for an initial assessment of the model’s overall performance.
G l o b a l C o r r e c t = c = 0 C T P + T N T P + T N + F P + F N
Dice is a measure of the similarity between two sets, particularly useful in image segmentation tasks. It performs well with small samples and unbalanced datasets because it places greater emphasis on the overlap region. A higher Dice coefficient indicates a closer match between the two segmentation results (e.g., algorithmic segmentation and manual labeling), signifying a larger overlap and thus better segmentation performance.
Dice = c = 0 C 2 T P 2 T P + F P + F N
MIoU is a commonly used metric for evaluating image segmentation models, particularly for multi-category segmentation tasks. IoU is the ratio of the intersection to the union of the predicted and actual regions. mIoU is the average of the IoUs across all categories, reflecting the model’s overall performance. mIoU values range from 0 to 1, with 1 indicating perfect segmentation results.
MIoU = 1 C + 1 c = 0 C T P F N + F P + T P
All programming code for this study was developed using the PyTorch2.3.0 deep learning framework, which is widely favored for its powerful flexibility, ease of use, and extensive community support. The model training was conducted on a Lenovo (ThinkStation) P920 tower graphics workstation, equipped with two Intel Platinum 8260 CPUs, totaling 48 cores and 96 threads, and an NVIDIA RTX A4000 GPU with 6144 CUDA cores. These experimental conditions provided robust support for the research presented in this paper.

5. Experimental Results and Discussion

5.1. Quantitative Analysis

In order to assess the performance of the CUNet model in segmenting pure copper scanning electron microscope (SEM) images, a quantitative analysis was conducted on the model’s performance using both the training and validation datasets. The objective was to verify the model’s effectiveness and stability.
During the training of the deep learning U-Net model, the overall training process was controlled through several pre-defined hyperparameter configurations. Adjusting these hyperparameters optimizes the model’s performance metrics, enhancing its generalization and predictive capabilities. These parameters have a significant impact on both the model’s performance and the training process. Table 2 lists the hyperparameter configurations that yielded the best performance during the training.
During the model training process, the training and validation losses for each epoch were recorded to monitor the model’s convergence and potential overfitting. As shown in Figure 6a, both the training and validation losses decreased rapidly during the initial stages, stabilizing after approximately 20 epochs, which indicates good convergence of the model. This can be attributed to the use of a progressively adjusted learning rate strategy, as depicted in Figure 6b. This strategy ensures rapid convergence during the early stages of training and mitigates the risk of overfitting in the later stages through fine-tuned weight adjustments.
Global accuracy, Dice coefficient, and mIoU metrics were calculated for each epoch on the validation set. These metrics are presented in Figure 6c. As training progressed, all metrics converged, with global accuracy stabilizing at 0.961, Dice coefficient at 0.909, and mIoU at 0.842. These results indicate that the CUNet model exhibits generalization and stability in the pure copper SEM image segmentation task.
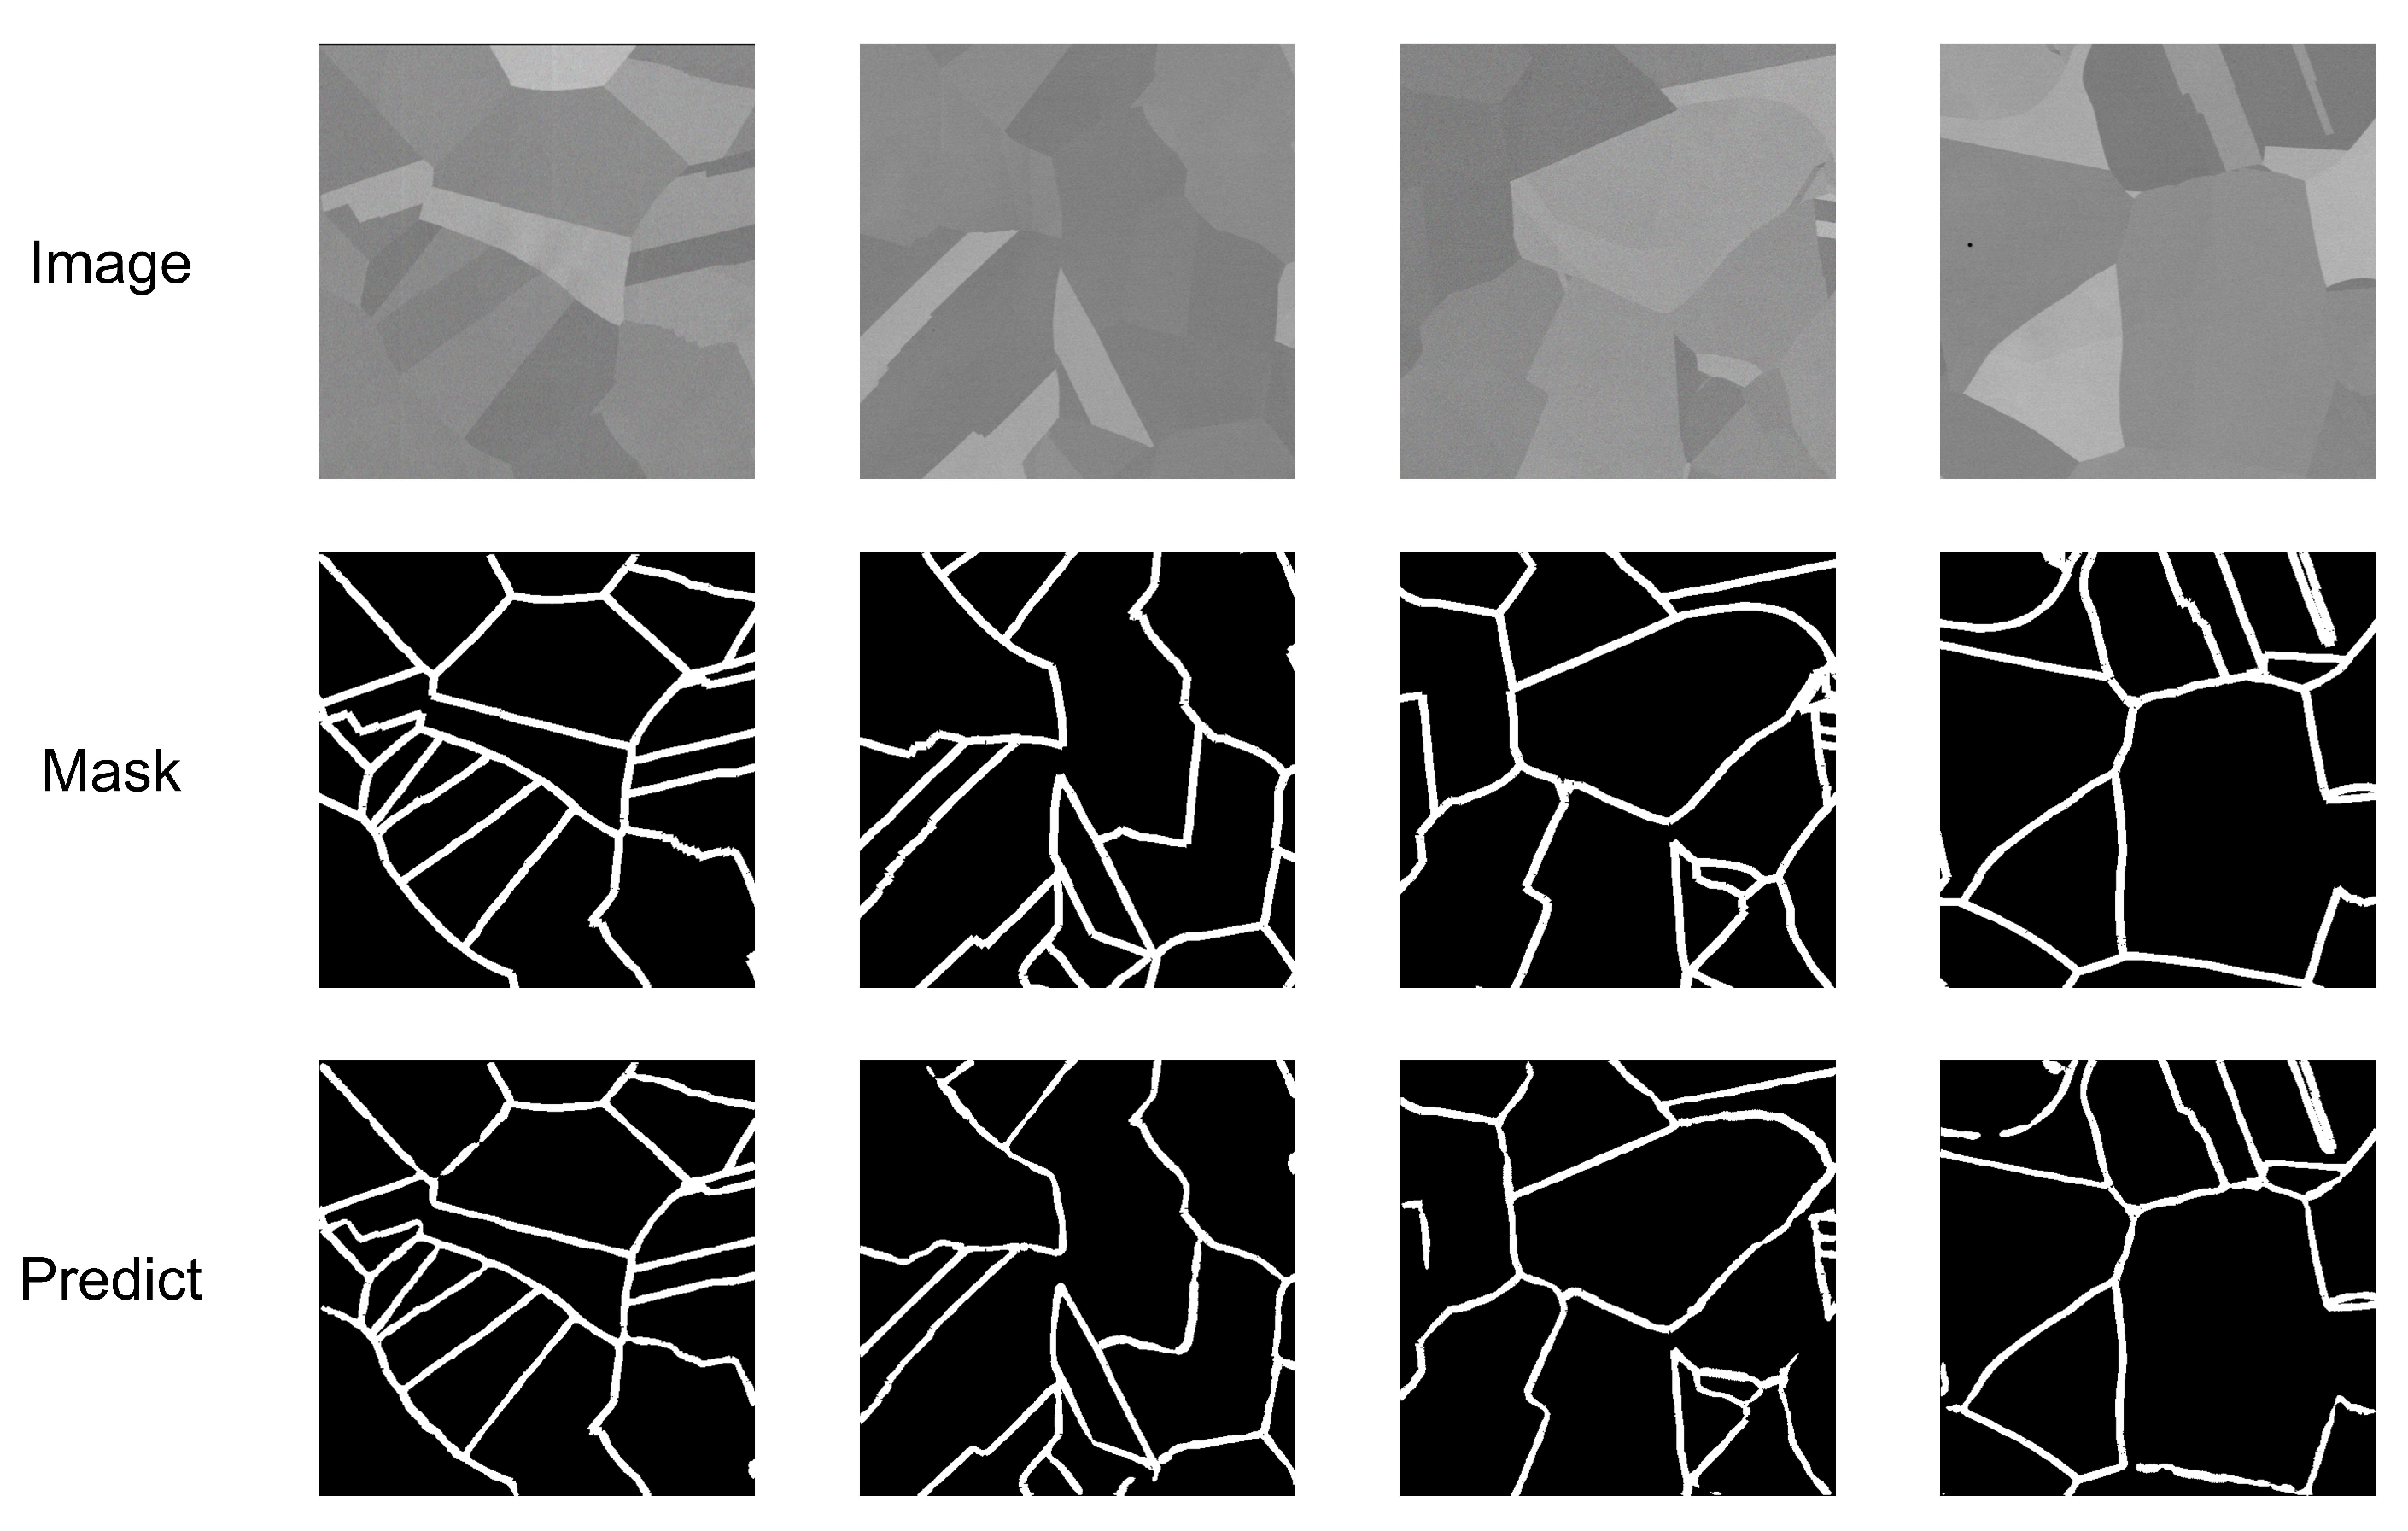
To visually demonstrate the performance of the pure copper SEM image segmentation method based on the CUNet model, model predictions were performed on multiple sets of pure copper sample slice images. Figure 7 presents several original SEM images, their corresponding segmentation ground truth masks, and the model’s prediction results.

5.2. Qualitative Analysis

The CUNet model has been optimized in the feature extraction and fusion stages, enhancing its ability to identify the boundaries of the microstructure in pure copper. In Figure 7, the predicted masks closely align with the ground truth masks. The model is able to accurately segment complex contours and fine boundaries, effectively capturing the boundary information of different phases and structures in the pure copper SEM images. Notably, the model excels in maintaining boundary continuity, which demonstrates the effectiveness and superiority of the CUNet model in handling complex image segmentation tasks.

5.3. Ablation Experiment

Ablation experiments were conducted to evaluate the impact of various components on the performance of the CUnet. The study focused on two primary aspects: (1) the MedAugment data augmentation module applied prior to training and the stratified cross-validation module employed during training, and (2) the self-attention mechanism module integrated at different encoder layers within the model architecture.
Table 3 presents the results of the ablation study in the validation dataset, evaluating the contributions of MedAugment and stratified cross-validation to the performance of U-Net in grain boundary segmentation. MedAugment improves global precision by 1. 42%, the Dice coefficient by 1. 16%, and mIoU by 1.00%, enhancing segmentation stability through a balanced data distribution. Similarly, stratified cross-validation increases global accuracy to 0.9140, Dice coefficient to 0.8812, and mIoU to 0.8381, demonstrating improved model robustness via effective data partitioning.
Ablation experiments evaluated the impact of the placement of the self-attention mechanism within the encoder layers of the U-Net model, as shown in Table 4. Positioning the self-attention mechanism at lower encoder layers reduced training time due to smaller feature map sizes and lower computational complexity. The CUNet with the self-attention mechanism at the fourth encoder layer achieved the highest performance, with a training time of 1 h 31 min and 13.0 FPS. Conversely, applying the mechanism across all layers (Improved U-Net5) reduced performance and increased training time to 4 h 46 min with 7.0 FPS.
The CUNet outperforms other alternatives by balancing computational efficiency and global context modeling for SEM image segmentation. This configuration optimizes the accuracy of segmentation while maintaining the actual training time, demonstrating its superiority over competing architectures.
These findings underscore the importance of optimizing the placement of the self-attention mechanism to achieve an effective trade-off between model performance and computational efficiency, with CUNet demonstrating a particularly effective configuration for high-accuracy segmentation tasks.

5.4. Comparison Results with Other Methodological Methods

To evaluate the performance of the proposed CUNet model for pure copper SEM image segmentation, we conducted comparative experiments with established algorithms. Traditional methods, including the Canny edge detection algorithm [25] and the watershed algorithm based on topological region division [26], were selected due to their widespread use in metallographic segmentation. MIPAR software, a standard tool in materials science image analysis, was included as a benchmark. For deep learning approaches, we tested semantic segmentation models, including U-Net, U-Net++, DeepLabV3+, SAM, SegNet, Attention U-Net, TransUNet, and Mask R-CNN. This study focuses on grain boundary segmentation in pure copper SEM images, which exhibit continuous, irregular, and interconnected patterns, necessitating a semantic segmentation approach. Although Mask R-CNN, designed for instance segmentation with object detection and pixel-level masks, faces challenges with continuous grain boundaries and requires extensive training data, it was included for a comprehensive comparison. Attention U-Net employs attention gates to enhance feature weighting, while TransUNet leverages Transformer modules to capture global dependencies, both serving as advanced baselines. Additionally, U-Net variants with attention mechanisms (U-Net+SE, U-Net+CBAM, U-Net+PAN) were evaluated to highlight the superior performance of the CUNet model.
As shown in Table 5, the CUNet model achieves the highest performance across three metrics: a global accuracy of 0.9589, a Dice coefficient of 0.9108, and an mIoU of 0.8415, surpassing the baseline U-Net by 5.67%, 6.42%, and 4.53%, respectively. These results demonstrate CUNet’s significant improvement in accurately segmenting pure copper microstructures.
In contrast, traditional methods like the Canny and watershed algorithms exhibit poor performance. Deep learning models, including U-Net and its variants, outperform traditional methods but fall short of CUNet’s results, underscoring the advantages of deep learning for image segmentation tasks. The performance of the MIPAR algorithm lies between that of traditional and deep learning methods.
To validate the statistical reliability of the results, Table 6 presents the 95% confidence interval (CI) widths for all models under 3-fold cross-validation. CUNet exhibits the narrowest CI widths, indicating superior stability across data splits compared to other deep learning models, such as U-Net, SAM, and TransUNet. Traditional methods show significant performance variability, underscoring their limitations in complex SEM image segmentation. MIPAR outperforms traditional methods but has wider CI widths, reflecting lower stability than deep learning models. CUNet’s robustness stems from its high-resolution self-attention mechanism, which preserves fine-grained spatial details critical for segmenting slender or low-contrast grain boundaries. In contrast, U-Net and its variants are limited by local receptive fields, hindering their ability to capture the global topological structure of grain boundaries.
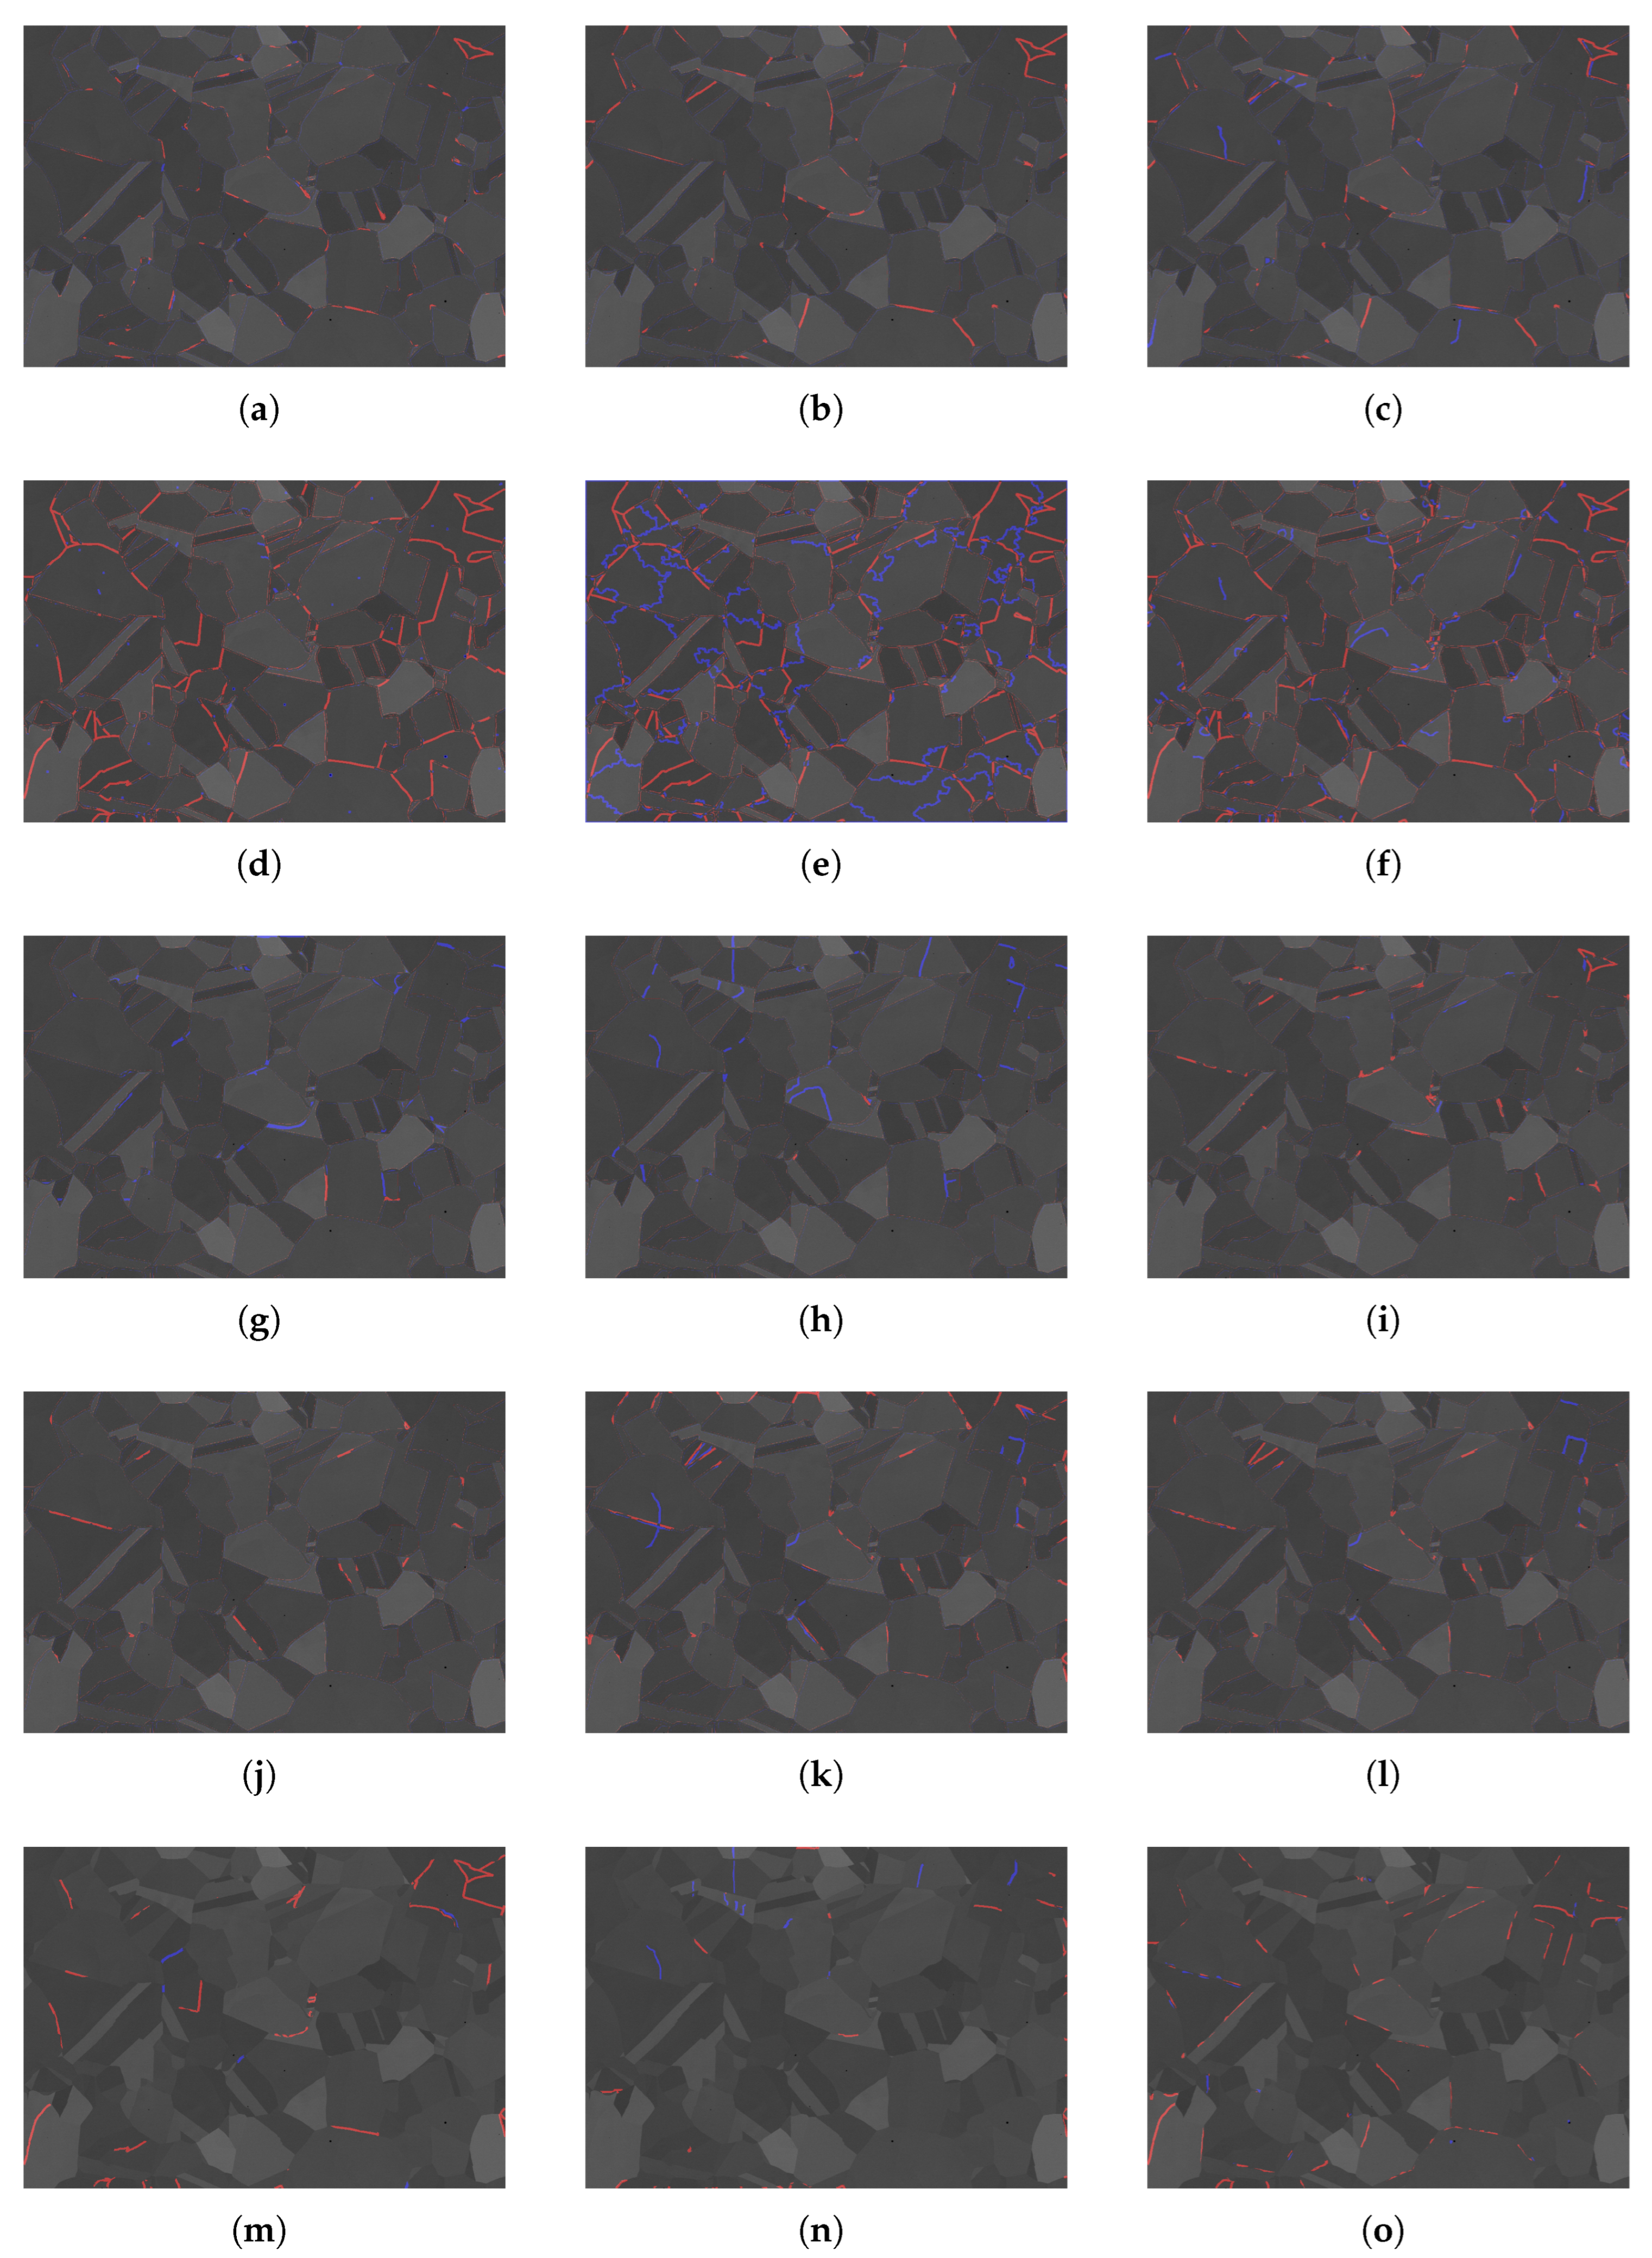
To thoroughly evaluate the performance of models in grain boundary segmentation for pure copper SEM images, grain boundary segmentation error maps (Figure 8) were generated through a pixel-wise comparison of predicted masks with ground truth annotations. Red lines denote over-segmentation, where non-boundary pixels, such as internal grain textures or impurities, are erroneously classified as boundaries. Blue lines signify under-segmentation, where true boundaries, including low-contrast or slender edges, are undetected. These error maps provide a visual representation of model failure modes, complementing quantitative performance metrics.
As an enhanced version of U-Net, CUNet significantly outperforms it in grain boundary segmentation, excelling in suppressing over-segmentation and detecting weak edges. U-Net’s error map (Figure 8b) shows dense, fragmented red lines across grain interiors and “spikes” near boundaries, indicating severe over-segmentation; discontinuous blue lines concentrate at low-contrast boundaries and slender grain edges, reflecting substantial under-segmentation. In contrast, CUNet’s error map (Figure 8a) exhibits sparse red lines limited to boundary vicinities, with no false boundaries in grain interiors, and minimal blue lines, appearing only as slight gaps in extremely low-contrast regions, with slender boundaries fully captured. This superiority stems from CUNet’s high-resolution ( 64 × 64 ) self-attention mechanism, combined with channel reduction ( C / 8 ) and residual connections, which effectively captures global context to suppress over-segmentation while preserving fine details, surpassing U-Net.
Traditional methods, reliant on local gradients without global semantic modeling, produce dense, grid-like red lines, erroneously splitting grains, and scattered blue lines, missing most true boundaries, resulting in poor performance. U-Net variants employ attention mechanisms to mitigate texture interference and edge misses, exhibiting fewer red and blue lines than U-Net, but their constrained receptive fields limit global structure capture, yielding moderate performance. Transformer-based models significantly reduce red lines through global self-attention, effectively suppressing over-segmentation, but low-resolution processing increases blue lines compared to CUNet, compromising slender boundary detection. In contrast, CUNet’s high-resolution self-attention mechanism markedly reduces over-segmentation while preserving fine boundary details, achieving precise grain boundary segmentation. Its lightweight design and global modeling capability make it exceptional for complex grain boundary segmentation, offering an efficient solution for materials science image analysis.

6. Conclusions

The proposed research addresses the challenges of achieving high accuracy and efficiency in segmenting complex grain boundaries in scanning electron microscope (SEM) images of pure copper through the development and validation of CUNet, an optimized deep learning framework. To overcome the limitations posed by small-sample datasets and mitigate overfitting risks, a tailored MedAugment data augmentation strategy was developed, specifically designed to preserve the textural and morphological intricacies of metallographic images. This approach significantly enhances the diversity of training samples, generating a robust pool of high-fidelity data. Complementing this, an enhanced stratified K-fold cross-validation methodology ensures balanced and representative data partitioning, substantially reducing overfitting tendencies and strengthening the reliability and generalization of model evaluation. These data-centric advancements collectively provide a robust foundation for effective model training under constrained data conditions.
To improve the precision of grain boundary feature identification, CUNet integrates a lightweight self-attention mechanism into the U-Net architecture. Positioned at the high-resolution (64 × 64) encoder stage, this mechanism establishes long-range pixel dependencies, expanding the effective receptive field and enabling precise delineation of complex microstructural features, such as slender, blurred, or low-contrast grain boundaries. The synergistic integration of these innovations yields exceptional performance on a rigorous validation set, achieving a global accuracy of 0.96, a Dice coefficient of 0.90, and a mean Intersection over Union (mIoU) of 0.85, surpassing the baseline U-Net by approximately 5.67.
While validated on pure copper, the CUNet framework is adaptable to other materials, such as ceramics or multiphase alloys (e.g., stainless steels, titanium alloys), through transfer learning. By fine-tuning the model on datasets with varied grain boundary structures or chemical compositions, CUNet can support microstructural analysis in diverse coating applications, including wear-resistant ceramic coatings or corrosion-resistant alloy films. The combined efficacy of tailored data augmentation, stratified cross-validation, and the self-attention-enhanced U-Net architecture effectively addresses the challenges of small-sample learning, model generalization, and intricate feature recognition. This framework establishes a robust computational pathway for advancing deep learning applications in quantitative microstructural analysis within materials science. The insights derived from training CUNet on pure copper, particularly its nuanced understanding of microstructural features, provide a valuable foundation for transfer learning, enabling efficient adaptation to diverse materials or microstructure types with reduced data and computational demands.
Despite its advancements, the framework has limitations that suggest further research:
1.
Diverse Material Applications: Validated on pure copper, CUNet could be extended to ceramics or composites by adapting data augmentation and leveraging transfer learning to accommodate varied microstructures.
2.
Computational Efficiency: Training (1 h 31 min) and inference (13.0 FPS) times limit real-time use. Model pruning or quantization could enhance efficiency while maintaining accuracy.
3.
Model Interpretability: The self-attention mechanism’s opacity could be addressed using explainable AI techniques, such as attention visualization, to enhance trust in materials science applications.

Author Contributions

Conceptualization, M.Y. and Y.W.; Methodology, S.Y.; Project administration, M.Y. and Y.W.; Resources, M.Y.; Software, S.Y. and J.Z.; Visualization, S.Y. and J.Z.; Writing—original draft, S.Y.; Formal analysis, Z.C.; Writing—review and editing, M.Y. All authors have read and agreed to the published version of the manuscript.

Funding

This work was supported by Jilin Agricultural University (Grant No. 202020084) through the project “Development of artificial intelligence recognition and automatic imaging system for scanning electron microscope”.

Data Availability Statement

The data presented in this study are available on request from the corresponding author.

Conflicts of Interest

The authors declare that they have no known competing financial interests or personal relationships that could have appeared to influence the work reported in this paper.

References

  1. Rusanovsky, M.; Beeri, O.; Oren, G. An End-to-End Computer Vision Methodology for Quantitative Metallography. Sci. Rep. 2022, 12, 4776. [Google Scholar] [CrossRef]
  2. Ragone, M.; Shahabazian-Yassar, R.; Mashayek, F.; Yurkiv, V. Deep Learning Modeling in Microscopy Imaging: A Review of Materials Science Applications. Prog. Mater. Sci. 2023, 138, 101165. [Google Scholar] [CrossRef]
  3. Luo, Y.X.; Dong, Y.L.; Yang, F.Q.; Lu, X.Y. Ultraviolet Single-Camera Stereo-Digital Image Correlation for Deformation Measurement up to 2600 °C. Exp. Mech. 2024, 64, 1343–1355. [Google Scholar] [CrossRef]
  4. Paredes-Orta, C.A.; Mendiola-Santibañez, J.D.; Manriquez-Guerrero, F.; Terol-Villalobos, I.R. Method for Grain Size Determination in Carbon Steels Based on the Ultimate Opening. Measurement 2019, 133, 193–207. [Google Scholar] [CrossRef]
  5. Shah, A.; Schiller, J.A.; Ramos, I.; Serrano, J.; Adams, D.K.; Tawfick, S.; Ertekin, E. Automated Image Segmentation of Scanning Electron Microscopy Images of Graphene Using U-Net Neural Network. Mater. Today Commun. 2023, 35, 106127. [Google Scholar] [CrossRef]
  6. Zhang, L.; Xu, Z.; Wei, S.; Ren, X.; Wang, M. Grain size automatic determination for 7050 Al alloy based on a fuzzy logic method. Rare Met. Mater. Eng. 2016, 45, 548–554. [Google Scholar] [CrossRef]
  7. Campbell, A.; Murray, P.; Yakushina, E.; Marshall, S.; Ion, W. New methods for automatic quantification of microstructural features using digital image processing. Mater. Des. 2018, 141, 395–406. [Google Scholar] [CrossRef]
  8. Shen, C.; Wang, C.; Wei, X.; Li, Y.; van der Zwaag, S.; Xu, W. Physical Metallurgy-Guided Machine Learning and Artificial Intelligent Design of Ultrahigh-Strength Stainless Steel. Acta Mater. 2019, 179, 201–214. [Google Scholar] [CrossRef]
  9. Azimi, S.M.; Britz, D.; Engstler, M.; Fritz, M.; Mücklich, F. Advanced steel microstructural classification by deep learning methods. Sci. Rep. 2018, 8, 2128. [Google Scholar] [CrossRef]
  10. Goetz, A.; Durmaz, A.R.; Müller, M.; Thomas, A.; Britz, D.; Kerfriden, P.; Eberl, C. Addressing materials’ microstructure diversity using transfer learning. npj Comput. Mater. 2022, 8, 27. [Google Scholar] [CrossRef]
  11. Ajioka, F.; Wang, Z.L.; Ogawa, T.; Adachi, Y. Development of high accuracy segmentation model for microstructure of steel by deep learning. ISIJ Int. 2020, 60, 954–959. [Google Scholar] [CrossRef]
  12. Durmaz, A.R.; Müller, M.; Lei, B.; Thomas, A.; Britz, D.; Holm, E.A.; Gumbsch, P.; Mücklich, F.; Gumbsch, P. A deep learning approach for complex microstructure inference. Nat. Commun. 2021, 12, 6272. [Google Scholar] [CrossRef] [PubMed]
  13. Liu, W.; Chen, J.H.; Liu, C.N.; Ban, X.J.; Ma, B.Y.; Wang, H.; Xue, W.; Guo, Y. Boundary learning by using weighted propagation in convolution network. J. Comput. Sci. 2022, 62, 101709. [Google Scholar] [CrossRef]
  14. Zhu, X.; Zhu, Y.; Kang, C.; Liu, M.; Yao, Q.; Zhang, P.; Huang, G.; Qian, L.; Zhang, Z.; Yao, Z. Research on automatic identification and rating of ferrite–pearlite grain boundaries based on deep learning. Materials 2023, 16, 1974. [Google Scholar] [CrossRef]
  15. Wittwer, M.; Gaskey, B.; Seita, M. An Automated and Unbiased Grain Segmentation Method Based on Directional Reflectance Microscopy. Mater. Charact. 2021, 174, 110978. [Google Scholar] [CrossRef]
  16. Shorten, C.; Khoshgoftaar, T.M. A Survey on Image Data Augmentation for Deep Learning. J. Big Data 2019, 6, 60. [Google Scholar] [CrossRef]
  17. Liu, Z.; Lv, Q.; Li, Y.; Yang, Z.; Shen, L. MedAugment: Universal Automatic Data Augmentation Plug-in for Medical Image Analysis. arXiv 2023, arXiv:2306.17466. [Google Scholar]
  18. Gholamiangonabadi, D.; Kiselov, N.; Grolinger, K. Deep Neural Networks for Human Activity Recognition with Wearable Sensors: Leave-One-Subject-Out Cross-Validation for Model Selection. IEEE Access 2020, 8, 133982–133994. [Google Scholar] [CrossRef]
  19. Chen, L.-C.; Papandreou, G.; Kokkinos, I.; Murphy, K.; Yuille, A.L. DeepLab: Semantic Image Segmentation with Deep Convolutional Nets, Atrous Convolution, and Fully Connected CRFs. IEEE Trans. Pattern Anal. Mach. Intell. 2017, 40, 834–848. [Google Scholar] [CrossRef] [PubMed]
  20. Ronneberger, O.; Fischer, P.; Brox, T. U-Net: Convolutional Networks for Biomedical Image Segmentation. In Medical Image Computing and Computer-Assisted Intervention—MICCAI 2015; Navab, N., Hornegger, J., Wells, W., Frangi, A., Eds.; Springer: Cham, Switzerland, 2015; pp. 234–241. [Google Scholar]
  21. Siddique, N.; Paheding, S.; Elkin, C.P.; Devabhaktuni, V. U-Net and Its Variants for Medical Image Segmentation: A Review of Theory and Applications. IEEE Access 2021, 9, 82031–82057. [Google Scholar] [CrossRef]
  22. Chen, J.; Lu, Y.; Yu, Q.; Luo, X.; Adeli, E.; Wang, Y.; Lu, L.; Yuille, A.L.; Zhou, Y. TransUNet: Transformers Make Strong Encoders for Medical Image Segmentation. arXiv 2021, arXiv:2102.04306. [Google Scholar]
  23. Oktay, O.; Schlemper, J.; Folgoc, L.L.; Lee, M.; Heinrich, M.; Misawa, K.; Mori, K.; McDonagh, S.; Hammerla, N.Y.; Kainz, B.; et al. Attention U-Net: Learning Where to Look for the Pancreas. arXiv 2018, arXiv:1804.03999. [Google Scholar]
  24. Vaswani, A.; Shazeer, N.; Parmar, N.; Uszkoreit, J.; Jones, L.; Gomez, A.N.; Kaiser, L.; Polosukhin, I. Attention Is All You Need. Adv. Neural Inf. Process. Syst. 2017, 30, 5998–6008. [Google Scholar]
  25. Wang, H.; Xu, X.; Liu, Y.; Lu, D.; Liang, B.; Tang, Y. Real-time defect detection for metal components: A fusion of enhanced Canny–Devernay and YOLOv6 algorithms. Appl. Sci. 2023, 13, 6898. [Google Scholar] [CrossRef]
  26. Luengo, J.; Moreno, R.; Sevillano, I.; Charte, D.; Peláez-Vegas, A.; Fernández-Moreno, M.; Mesejo, P.; Herrera, F. A tutorial on the segmentation of metallographic images: Taxonomy, new MetalDAM dataset, deep learning-based ensemble model, experimental analysis and challenges. Inf. Fusion 2022, 78, 232–253. [Google Scholar] [CrossRef]
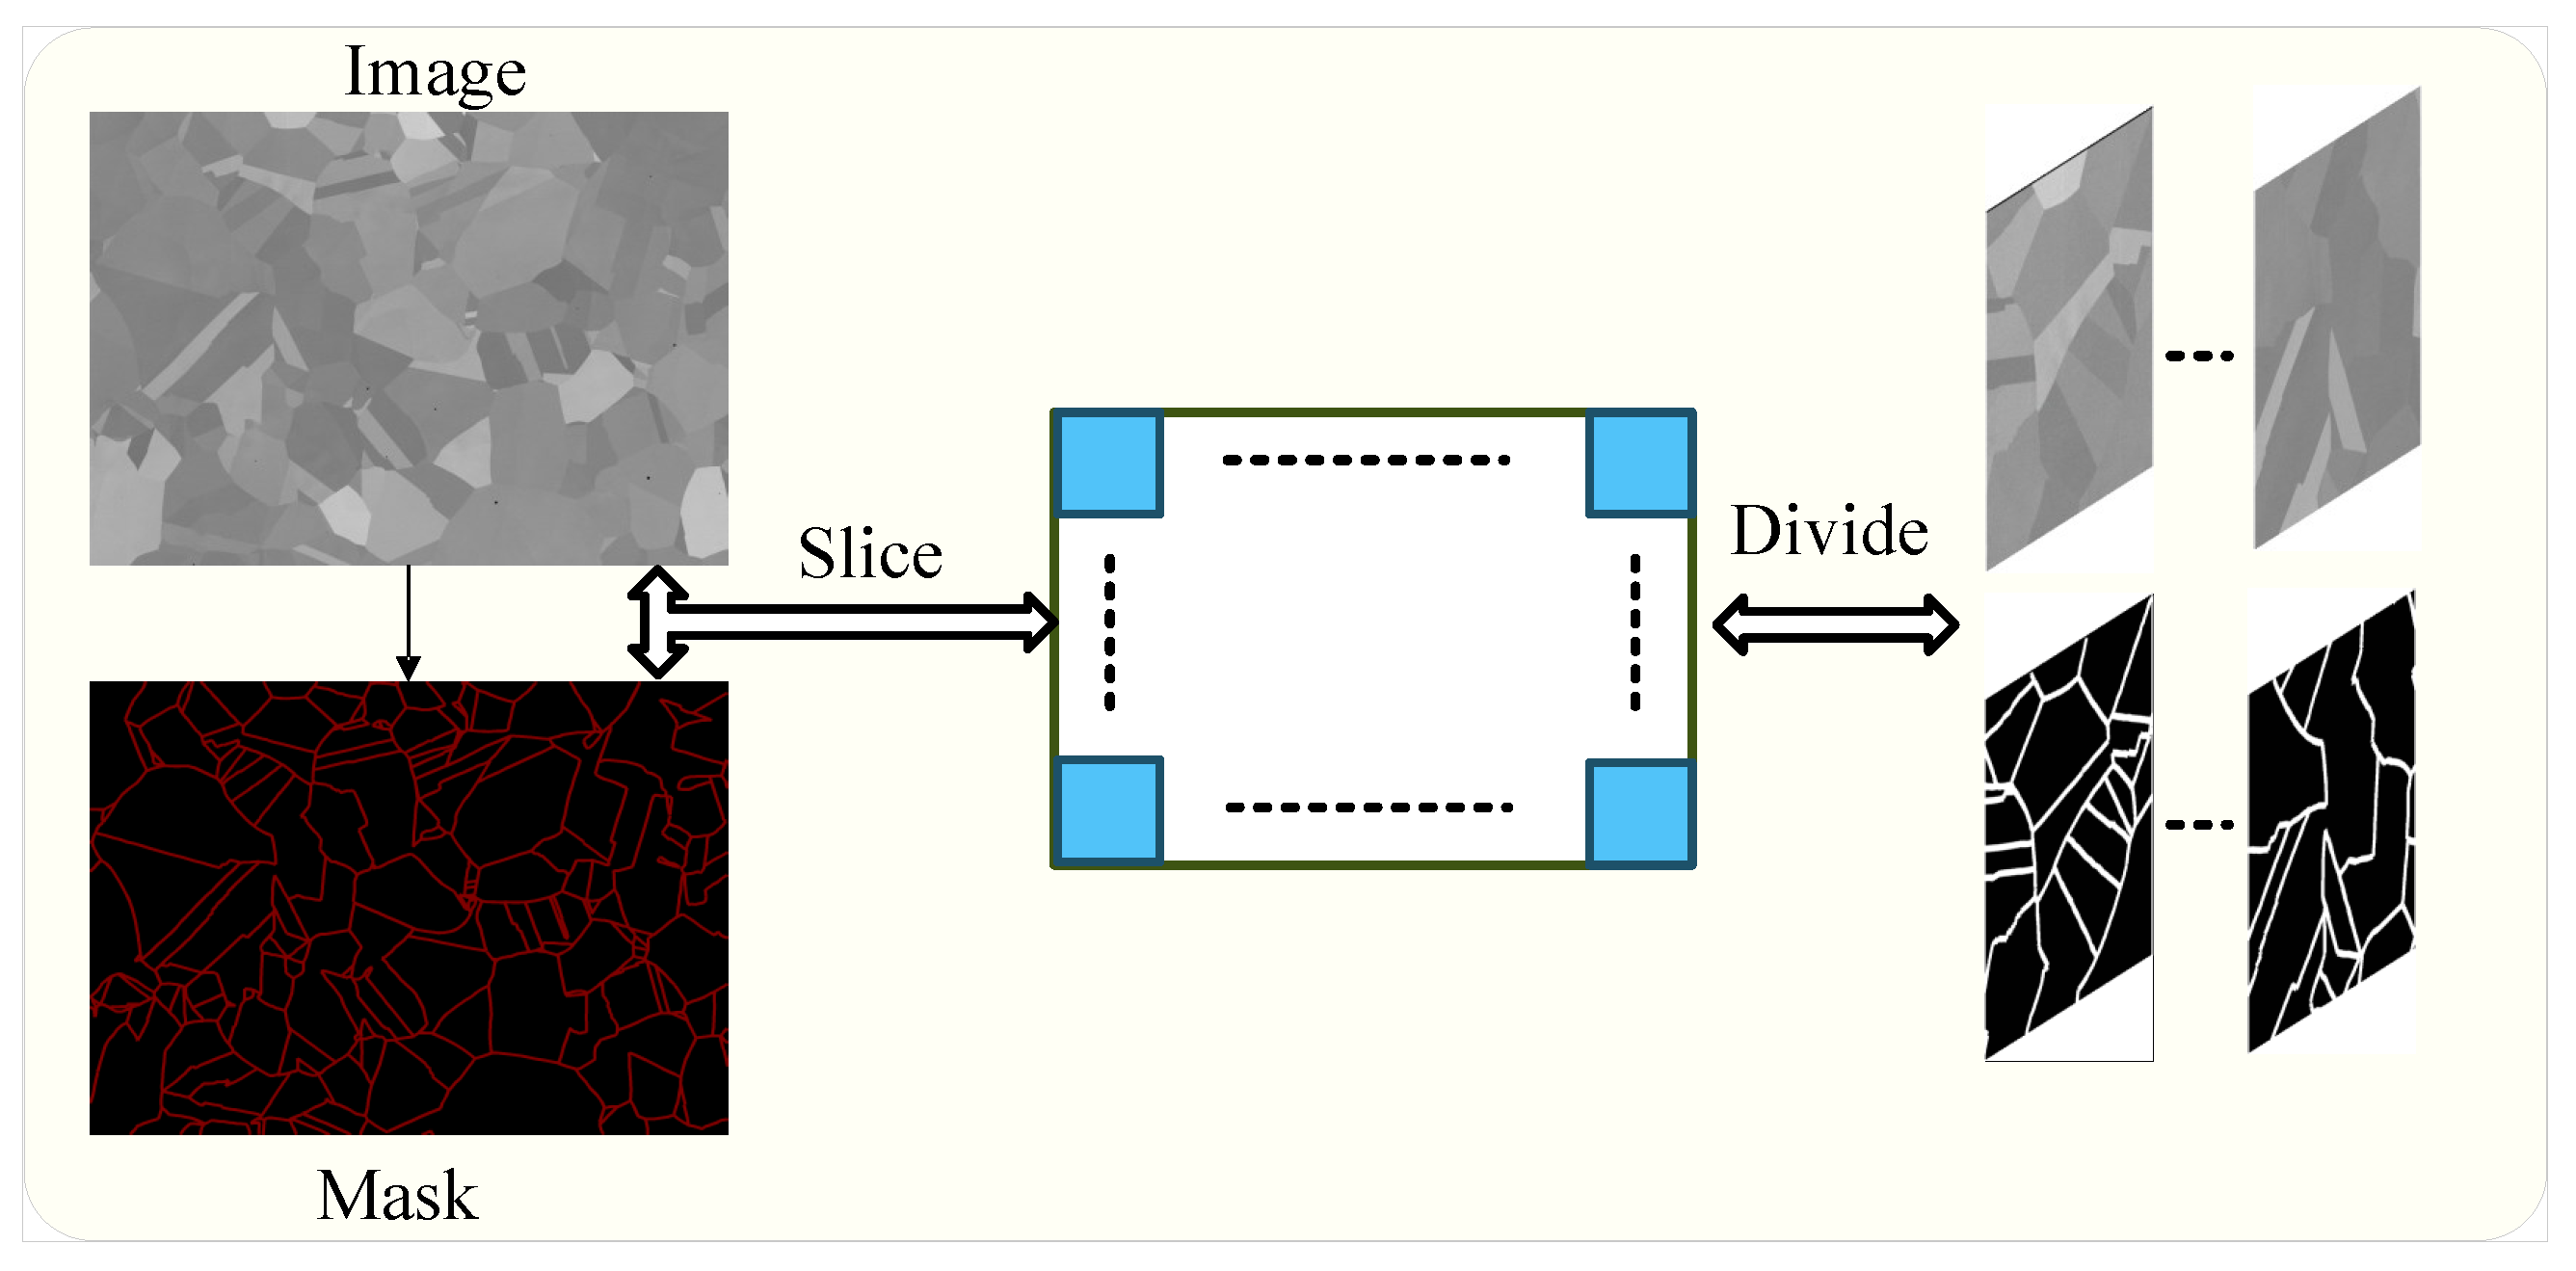
Figure 1. Pure copper SEM image dataset production flowchart.
Coatings 15 00969 g001
Figure 2. Schematic diagram of data augmentation algorithm: Randomly sampling a finite number of data augmentation operations from two mapping spaces and applying them to images.
Coatings 15 00969 g002
Figure 3. Flowchart of the improved stratified cross-validation approach.
Coatings 15 00969 g003
Figure 4. Frequency histogram of each folded foreground proportion after improved stratified cross-validation.
Coatings 15 00969 g004
Figure 5. CUNet enhances U-Net by integrating a lightweight self-attention mechanism in the encoder at 64 × 64 resolution. Input features are mapped to Query, Key, and Value via convolutions, with Query and Key channels reduced to C 8 for efficiency. Attention weights, derived from scaled dot-product and Softmax, modulate Value features, reshaped to B × C × H × W . A learnable parameter γ and residual connection ensure training stability and preserve spatial details. Skip connections merge multi-level encoder–decoder features, enabling precise segmentation of fine grain boundaries in pure copper SEM images.
Coatings 15 00969 g005
Figure 6. Model training and validation curves for each indicator. (a) The loss curve of the model during training and validation. (b) The adjustment of learning rate of the model during training. (c) Performance curves of various evaluation indicators in the validation time set of the model.
Coatings 15 00969 g006
Figure 7. A comparison between the original images, their corresponding ground truth masks, and the predicted masks from a segmentation model. The top row displays the original images. The middle row shows the ground truth masks, which highlight the boundaries within the images. The bottom row depicts the predicted masks generated by the segmentation model.
Coatings 15 00969 g007
Figure 8. Error maps for grain boundary segmentation across different methods: (a) CUNet, (b) U-Net, (c) U-Net++, (d) Canny, (e) Watershed, (f) Mipar, (g) DeepLabV3+, (h) SAM, (i) Segnet, (j) UNet + CBAM, (k) UNet + PAN, (l) UNet + SE, (m) MaskRCNN, (n) AttentionUnet, and (o) TransUnet. Where the red line indicates oversegmentation, where non-boundary pixels, such as internal textures or impurities, are misclassified as boundaries. The blue line indicates undersegmentation, that is, the inability to detect true boundaries, including low-contrast or elongated edges.
Coatings 15 00969 g008
Table 1. Confusion matrix.
True ValuePredicted Positive ClassPredicted Negative Class
Positive Class LabelTPFN
Negative Class LabelFPTN
Table 2. Hyperparameter list.
Batch SizeEpochsLearning RateOptimizerMomentumWeight Decay
121000.001SGD0.91 × 10−4
Table 3. Table of ablation experiments with improved cross-validation module.
MethodEvaluationDataset Score
Without MedAugmentGlobal Correct0.9074
Dice0.8558
MIoU0.8370
With MedAugmentGlobal Correct0.9202
Dice0.8657
MIoU0.8481
Without Stratified Cross-ValidationGlobal Correct0.9074
Dice0.8558
MIoU0.8370
With Stratified Cross-ValidationGlobal Correct0.9140
Dice0.8812
MIoU0.8381
Table 4. Performance comparison of self-attention mechanisms at different encoder layers.
ModelEncoder LayerGlobal CorrectDiceMIoUTimeFPS
U-Net 0.90740.85580.83701 h 26 min14.0
Improved U-Net1 0.89620.85610.80842 h 16 min10.5
Improved U-Net2 0.89830.85520.81931 h 51 min11.5
Improved U-Net3 0.90490.85710.82311 h 44 min12.0
CUNet 0.93410.87830.84171 h 31 min13.0
Improved U-Net50.86680.83740.81084 h 46 min7.0
Table 5. Performance comparison of image segmentation models, including the CUNet.
MethodsGlobal CorrectDicemIoU
CUNet (Ours)0.95890.91080.8415
U-Net0.90740.85580.8050
U-Net++0.92470.86920.8250
Canny0.51240.45510.4000
Watershed0.34250.61570.5500
Mipar0.76290.79610.7800
DeepLabV3+0.89070.88350.8200
SAM0.90170.90430.8350
Segnet0.83990.80110.7900
U-Net+SE0.89180.86720.8100
U-Net+CBAM0.91140.88640.8300
U-Net+PAN0.81570.85360.8000
Mask-RCNN0.89510.87130.8147
AttentionUnet0.92000.88430.8316
TransUnet0.93000.89180.8287
Table 6. The 95% confidence interval widths for image segmentation models, including the CUNet.
MethodsGlobal Correct CI WidthDice CI WidthmIoU CI Width
CUNet (Ours)0.01240.01480.0178
U-Net0.02880.03060.0330
U-Net++0.02360.02620.0280
Canny0.05560.05940.0638
Watershed0.07280.05760.0594
Mipar0.04500.04280.0450
DeepLabV3+0.03060.02880.0306
SAM0.02800.02620.0280
Segnet0.03840.04000.0384
U-Net+SE0.02880.03060.0306
U-Net+CBAM0.02620.02800.0280
U-Net+PAN0.04000.03840.0384
Mask-RCNN0.02880.02880.0306
AttentionUnet0.02360.02620.0262
TransUnet0.02200.02360.0236
Disclaimer/Publisher’s Note: The statements, opinions and data contained in all publications are solely those of the individual author(s) and contributor(s) and not of MDPI and/or the editor(s). MDPI and/or the editor(s) disclaim responsibility for any injury to people or property resulting from any ideas, methods, instructions or products referred to in the content.