Article

Tailoring Tribological Properties and Corrosion Resistance of Self-Lubricating Ti-Mo-N Coatings Prepared by Arc Depositions

1
School of Materials Science and Engineering, Xi’an Shiyou University, Xi’an 710065, China
2
Xi’an Rare Metal Materials Institute Co., Ltd., Xi’an 710016, China
*
Authors to whom correspondence should be addressed.
Coatings 2025, 15(8), 956; https://doi.org/10.3390/coatings15080956 (registering DOI)
Submission received: 15 July 2025 / Revised: 12 August 2025 / Accepted: 14 August 2025 / Published: 16 August 2025

Abstract

Ti-Mo-N coatings were deposited on GCr15 bearing steel using arc ion plating. The effect of deposition bias on the coating microstructure, mechanical properties, tribological behavior, and electrochemical corrosion resistance was systematically investigated. The coating prepared at −120 V bias showed optimal overall performance. It achieved the lowest friction coefficient (0.308) and lowest wear rate (1.99 × 10⁻⁶ mm3/N·m). The significant improvement in tribological performance is attributed to the lubricating phase formed during the friction process. XPS analysis confirmed the layered MoO3 formation within the wear scar. Deposition bias also significantly influenced the coating texture. At −120 V, the coating exhibited the strongest (111) crystal plane preferred orientation. This texture strongly correlated with performance enhancement. Regarding electrochemical corrosion, the −120 V coating displayed the lowest corrosion current density (3.62 × 10⁻⁹ A/cm2) and best corrosion resistance. Its corrosion morphology showed no obvious pitting, grooves, or other damage features. The results demonstrate the critical role of deposition bias in tailoring Ti-Mo-N coating properties. This research provides essential experimental support and a theoretical basis for designing wear- and corrosion-resistant protective coatings on bearing steel.

1. Introduction

Bearing steels are critical materials for mechanical components and mold manufacturing due to their excellent strength–toughness combination and superior mechanical properties [1]. However, their inherent limitations, particularly their inadequate surface hardness and wear resistance, predispose them to premature failure under tribological loading, significantly limiting service life [2,3,4]. Research indicates that for bearing materials, friction and wear constitute the predominant failure mechanism, characterized by a complex degradation process governed by multiple factors [5]. To enhance the tribological performance of metallic components, researchers have pursued various strategies in recent years, primarily surface strengthening techniques [6] and protective coatings [7,8]. Among these, protective coatings—especially transition metal nitride coatings deposited via physical vapor deposition (PVD)—have garnered significant attention for enhancing surface durability [9,10].
Titanium nitride (TiN) films are widely used in industry. Their B1-type sodium chloride crystal structure provides high hardness, excellent corrosion resistance, and chemical stability [11]. However, single TiN coatings exhibit limitations in tribological performance. Alloying strategies overcome this deficiency. Adding molybdenum (Mo) significantly enhances performance. Mo addition effectively reduces the friction coefficient (COF) at both room and elevated temperatures. It also improves wear resistance. Wang [12] prepared Ti-Mo-N coatings via magnetron sputtering. These coatings showed higher hardness than Mo-N coatings. Their average friction coefficient reached 0.35. Zhou et al. [13] used first-principles calculations to predict properties. Ti-Mo-N should possess both high hardness and toughness. Mo doping enhances grain boundary (GB) plasticity, potentially delaying intergranular cracking. Abdulrahman et al. [14] further identified an optimal composition. Approximately 18 at.% Mo enables Ti-Mo-N coatings to achieve an optimal combination. This includes high hardness, high modulus, low wear rate, and low friction coefficient. Collectively, these studies confirm Ti-Mo-N coatings successfully combine TiN’s high hardness with Mo’s lubrication characteristics. The Ti-Mo synergy achieves balanced hardness–toughness and excellent tribological performance.
TiN-based coatings are currently fabricated using various techniques. These include magnetron sputtering, arc ion plating (AIP), chemical vapor deposition (CVD), and thermal spraying [15,16,17]. Among these methods, AIP shows significant promise. It offers high ionization rates and straightforward parameter control [18]. However, AIP faces inherent challenges. Coatings tend to develop growth defects such as pores, droplets, and microcracks. These defects seriously degrade the mechanical integrity and wear resistance. Increasing the substrate bias voltage effectively optimizes AIP coatings. It refines grains and enhances mechanical properties. Nevertheless, key research gaps remain. Systematic studies are lacking on the bias voltage effects across different voltages for Ti-Mo-N coatings. The optimal process window requires deeper exploration [19,20,21]. TiN-based coating properties strongly depend on crystallographic texture, particularly the (111) orientation [22]. However, bias-controlled texture evolution in Ti-Mo-N coatings is poorly understood. The impact of texture strength on comprehensive performance needs clarification. Additionally, overcoming AIP defects while simultaneously optimizing texture remains challenging. Achieving specific strong textures and their performance advantages requires further investigation.
Based on the aforementioned research gaps, this study aims to systematically investigate the regulatory laws of base bias on the microstructure evolution and properties of Ti-Mo-N coatings, with the intention of deepening the understanding of the relationship between process, structure, and performance and optimizing the deposition process. Specifically, the Ti-Mo-N coating is deposited on the GCr15 bearing steel substrate using the arc ion plating (AIP) technique. By systematically adjusting the base bias parameters, the fine regulatory effect of bias on the texture strength of the coating is mainly explored, and the correlation between the bias parameters and the evolution of texture strength is quantitatively associated. This study not only focuses on the texture type but also concentrates on the quantitative characterization of texture strength, deeply analyzing the microscopic structural characteristics, mechanical properties, and corrosion resistance of the coating under different texture strengths. Ultimately, it aims to clarify the mechanism of achieving the synergistic optimization of texture formation and defect suppression through the precise regulation of bias parameters, thereby preparing Ti-Mo-N coatings with high hardness, excellent wear resistance, and good corrosion resistance, providing new scientific basis and experimental support for overcoming the inherent limitations of AIP technology and improving the comprehensive service performance of the coatings.

2. Experimental Section

2.1. Equipment and Experimental Materials

The experiments utilized a multi-functional coating deposition system (MA1210-2450, Dalian Jin Tai Zhengxin Technology Co., Ltd., Dalian, China), schematically illustrated in Figure 1. The system consists of a vacuum chamber, vacuum system, cooling system, and control system. The vacuum chamber is equipped with cathodic arc sources. The vacuum system comprises a mechanical rotary vane pump, a Roots blower, and a turbomolecular pump. The cooling system employs external water circulation to maintain the chamber temperature. The control system regulates the cathodic arc ignition, substrate bias voltage magnitude, chamber temperature, workpiece carousel rotation and revolution rates, and process gas flow rates. In this study, GCr15 bearing steel (composition: 0.95%–1.05% carbon, 1.40%–1.65% chromium, 0.25%–0.45% manganese, 0.15%–0.35% silicon, ≤0.020% sulfur, ≤0.025% phosphorus, ≤0.0010% oxygen) (from Dalian Special Steel Co., Ltd., Northeast Special Steel Group, Dalian, China) was used as the substrate. All samples were polished successively with silicon carbide (SiC) grinding papers of grit sizes #240, #400, #600, #800, and #1000 to ensure good surface finish. The polished samples were then ultrasonically cleaned in ethanol to remove contaminants and dried with high-pressure nitrogen. Process gases were high-purity argon (Ar, 99.999%, Xi’an Xilian Special Gas Technology Co., Ltd., Xi’an, China) and nitrogen (N2, 99.999%, Xi’an Xilian Special Gas Technology Co., Ltd., Xi’an, China). Target materials included a pure titanium (Ti, >99.9 wt.%, Antai Technology Co., Ltd., Beijing, China) target and a titanium–molybdenum (Ti-Mo, >99.9 wt.%, Antai Technology Co., Ltd., Beijing, China) alloy target with a molybdenum (Mo) atomic fraction of 15 at.%.

2.2. Coating Preparation

The GCr15 bearing steel substrates were ultrasonically cleaned in anhydrous ethanol and acetone for 30 min, followed by drying. The dried substrates were then suspended on the workpiece carousel within the deposition chamber. The coating deposition process comprised two distinct stages: high-energy argon ion cleaning and coating deposition. First, the chamber pressure was reduced below 5.0 × 10⁻³ Pa, and the temperature was maintained at approximately 300 °C. Argon gas was then introduced into the chamber at a flow rate of 1500 sccm, establishing a working pressure of 1.0 Pa. Glow discharge cleaning was performed for 30 min under a substrate bias voltage of −700 V with a 70% duty cycle. Following the cleaning stage, the relevant arc sources were sequentially activated to deposit the coatings. A titanium (Ti) bonding layer was deposited first, followed by a titanium nitride (TiN) interlayer. Finally, the titanium–molybdenum–nitride (Ti-Mo-N) coating was deposited. The specific experimental parameters for each deposition stage are detailed in Table 1.

2.3. Coating Characterization

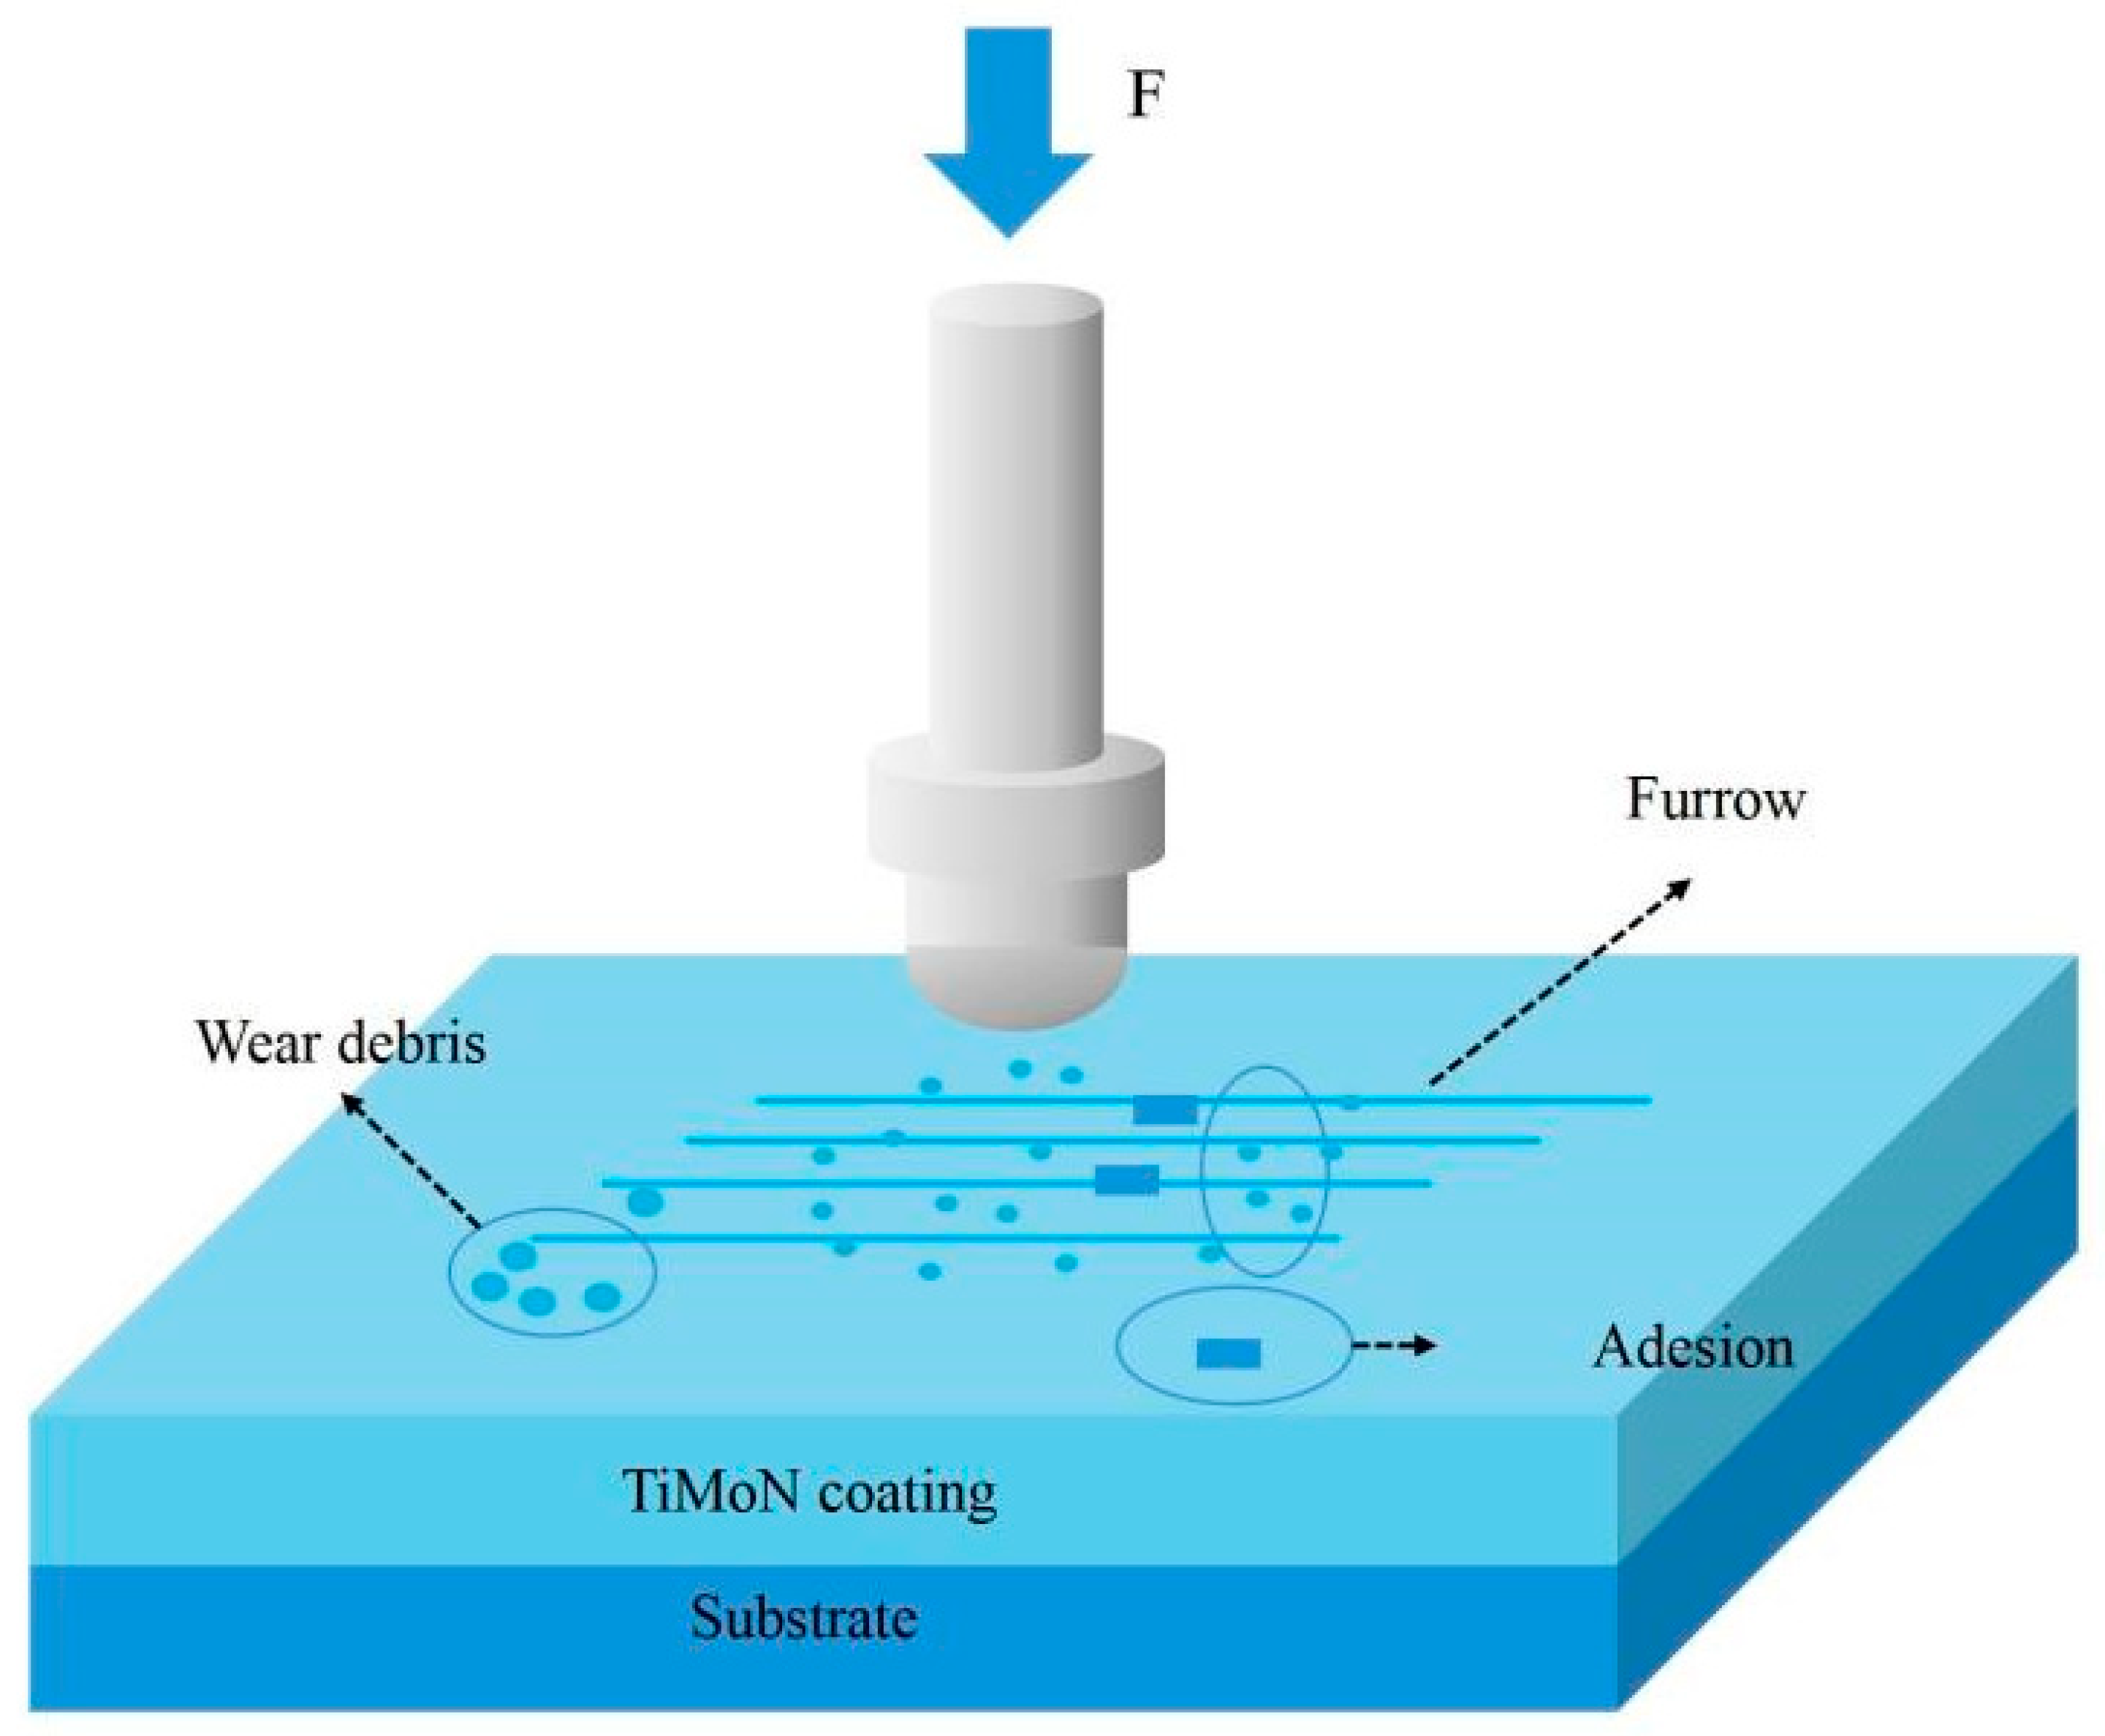
The surface and cross-sectional morphology of the coating were studied using a scanning electron microscope (Zeiss Supra 55, Shanghai Ouobo Tong Instrument Co., Ltd., Jena, Germany). The body composition of the membrane was detected using an SEM-based Inca Energy Dispersion Spectrometer (EDS) with an XMAX detector (Oxford Instruments, Oxford Instrument Technology Co., Ltd., London, UK). The measuring film thickness was observed using SEM. X-ray diffraction (XRD, Rigaku Smartlab 9 KW, Tokyo, Japan) tests were performed at 40 kV and 40 mA using Cu Kα radiation (λ = 0.15418 nm). The scanning angle range is 10° to 90°, the scanning rate is 10°/min, and the step length is 0.02°. X-ray photoelectron energy. The hardness was measured using a Vickers hardness meter (HVS-1000, Laizhou Wenhui Instrument Technology Co., Ltd., Laizhou, China) with a loading time of 20 s and a loading force of 50 g. For each sample, at least 5 effective measurements were performed at different locations on the coating surface, and the average of the standard deviation was reported. Using a Vickers hardness meter, the load-bearing capacity and toughness of the coating were evaluated under the conditions of a loading time of 20 s and a loading force of 300 g. The wear resistance and toughness of the Ti-Mo-N coating (sample size: 20 mm × 20 mm × 2 mm) under different biases were tested using a reciprocating wear tester (MFT-4000, Lanzhou Huahui Instrument Technology Co., Ltd., Lanzhou, China) in a constant temperature environment (approximately 20 °C, relative humidity approximately 30%). The schematic diagram of the experimental principle is shown in Figure 2. The test load was 10 N, and the friction pair used was an Al2O3 ball with a radius of 6 mm. The sliding speed was set at 200 mm/min, the sliding time was 90 min, and the wear trace length was 5 mm. The wear rate formula is as follows:
W = (S × L)/(F × D)
Among them, S represents the cross-sectional area of the wear marks (in mm2), L represents the length of the wear marks (in mm), F represents the normal load (in N), and D represents the wear distance (in m). Through surface profile measurement, four profiles were obtained at different positions on each wear mark, and the average cross-sectional area of the wear marks was measured. The wear marks were observed using a scanning electron microscope to determine the wear mechanism. The chemical state of the coating surface composition after the friction and wear test was analyzed using X-ray photoelectron spectroscopy (Nexsa, Thermo Fisher, Waltham, MA, USA). Using Al Kα radiation (hν = 1486.6 eV) as the excitation source, with a spot size of 500 μm, the base pressure of the analysis chamber was reduced to less than 1.0 × 10⁻⁷ Pa. Before measurement, the coating surface was sputtered with 1000 eV Ar+ ions at an incident angle of 55° for 5 min to remove the surface-adsorbed contaminants.

3. Results and Discussion

3.1. Surface and Cross-Sectional Morphology

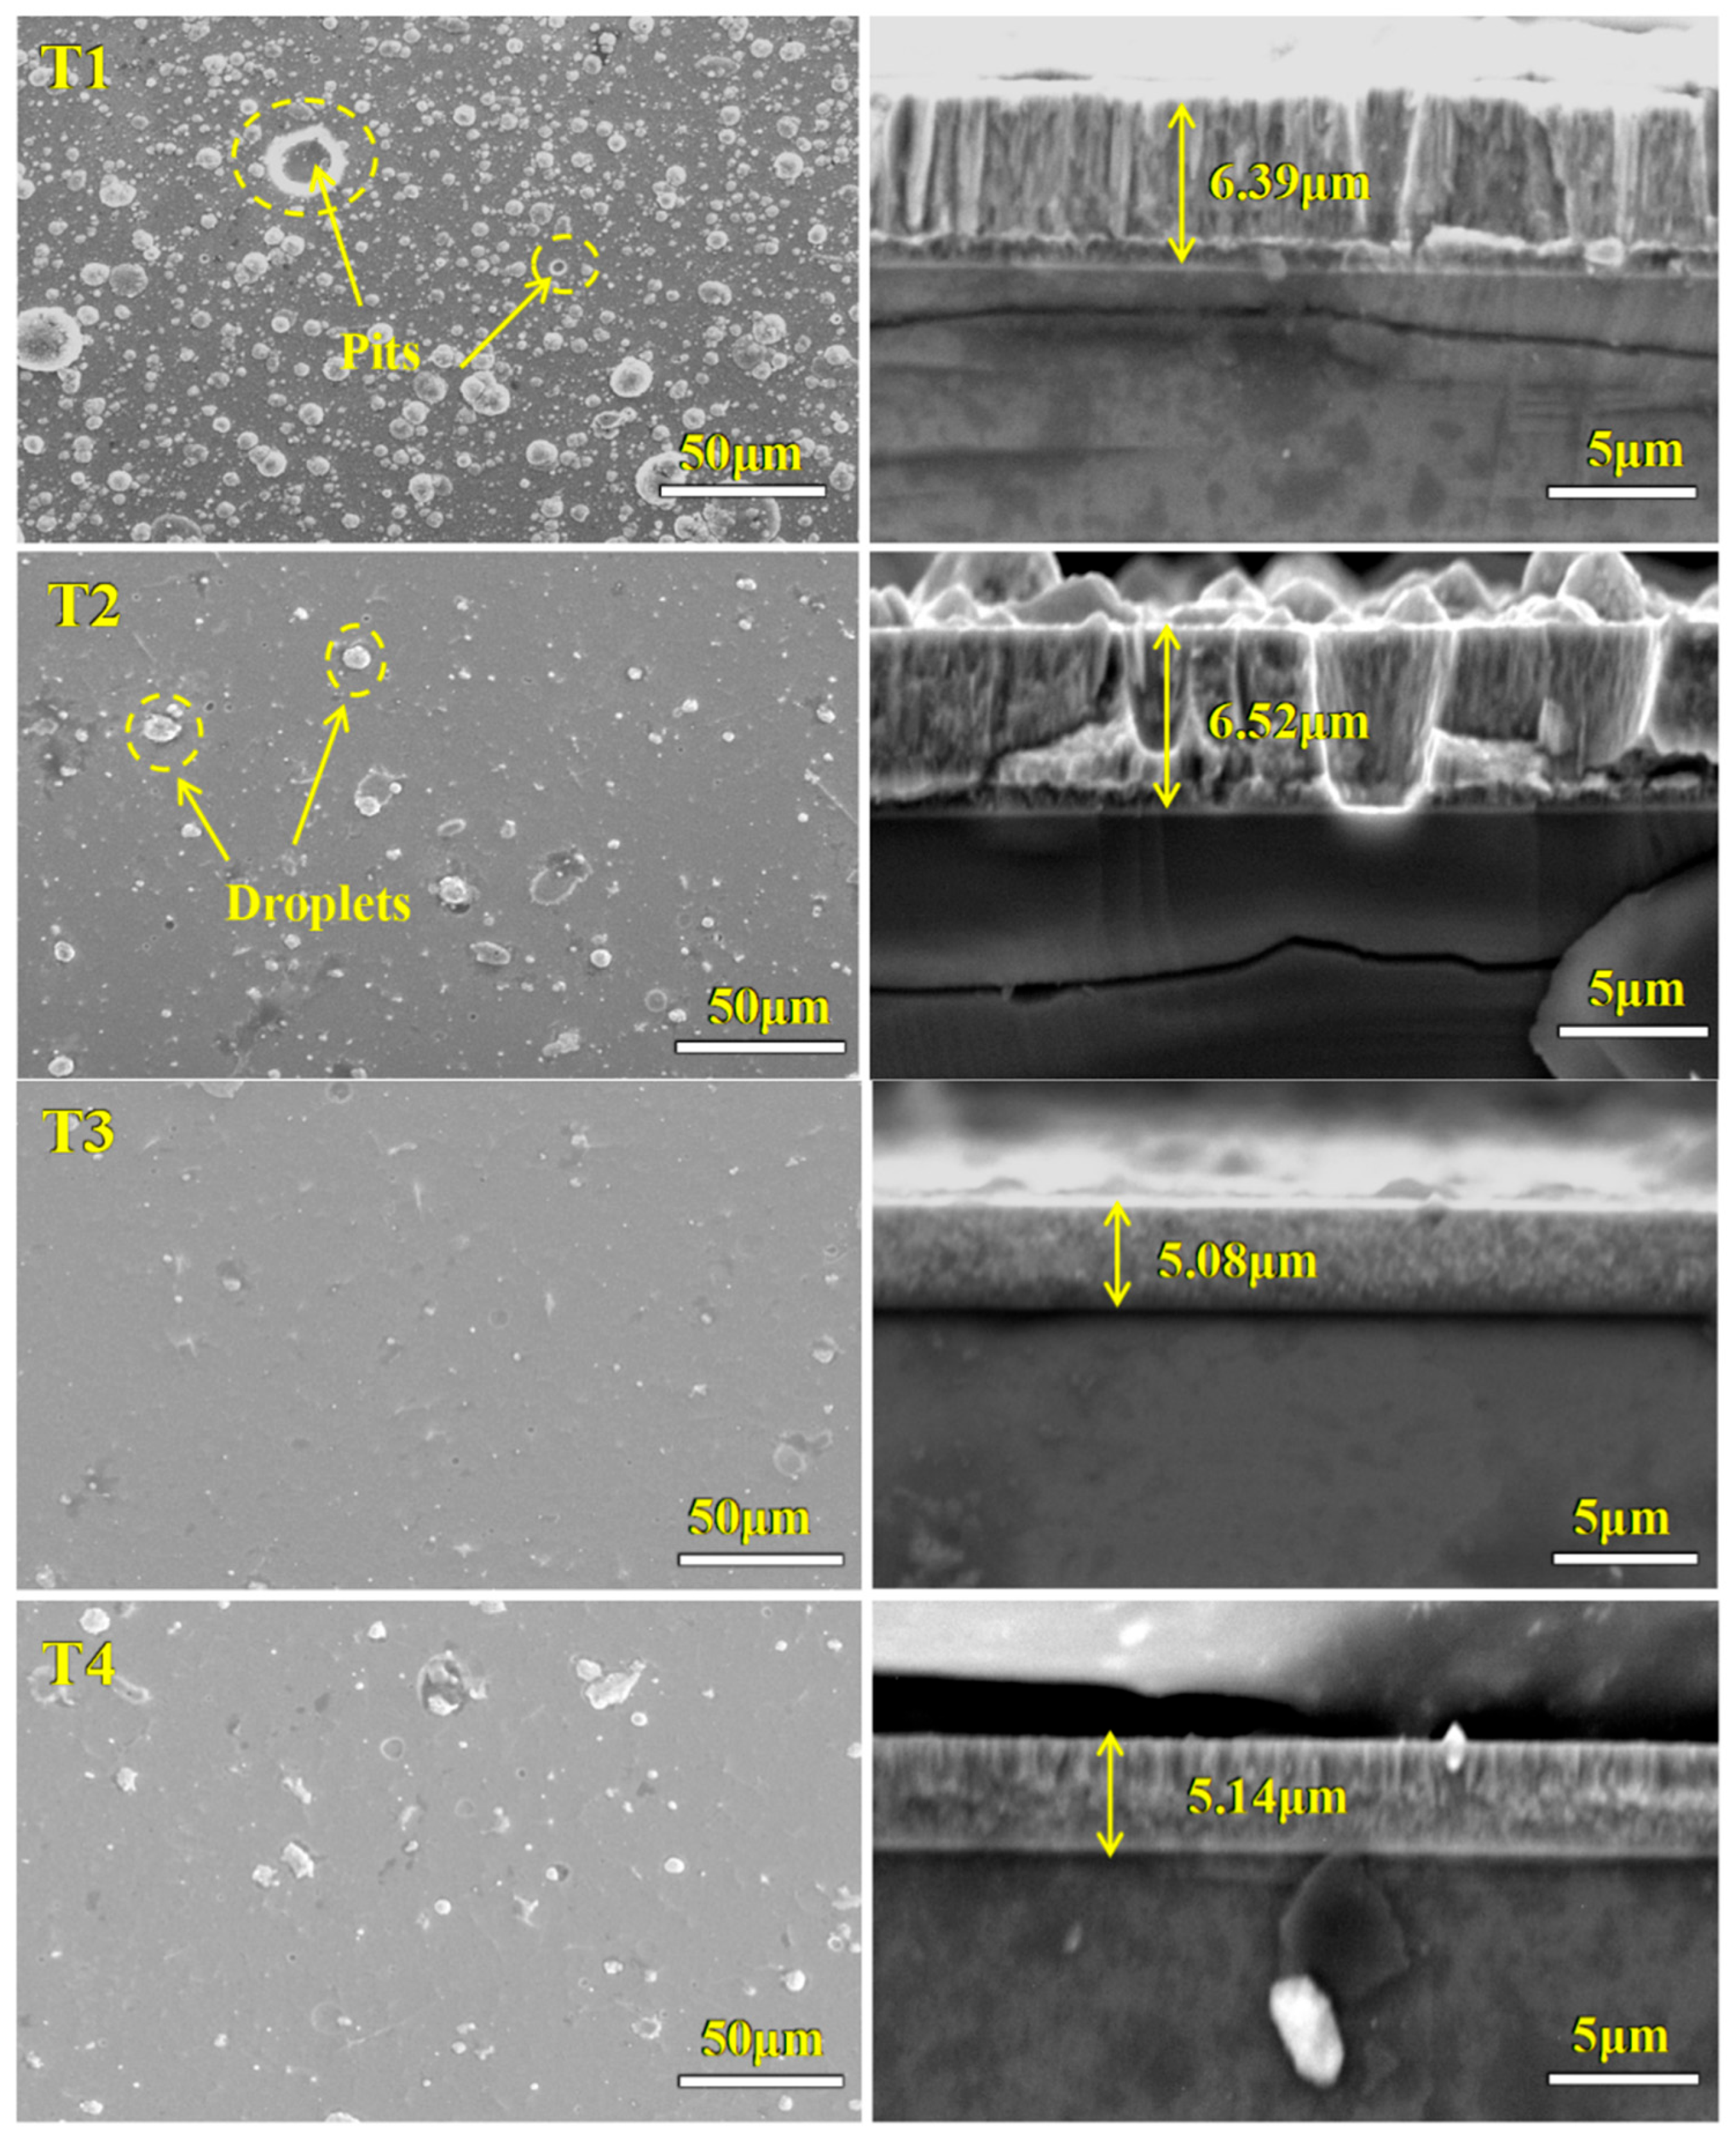
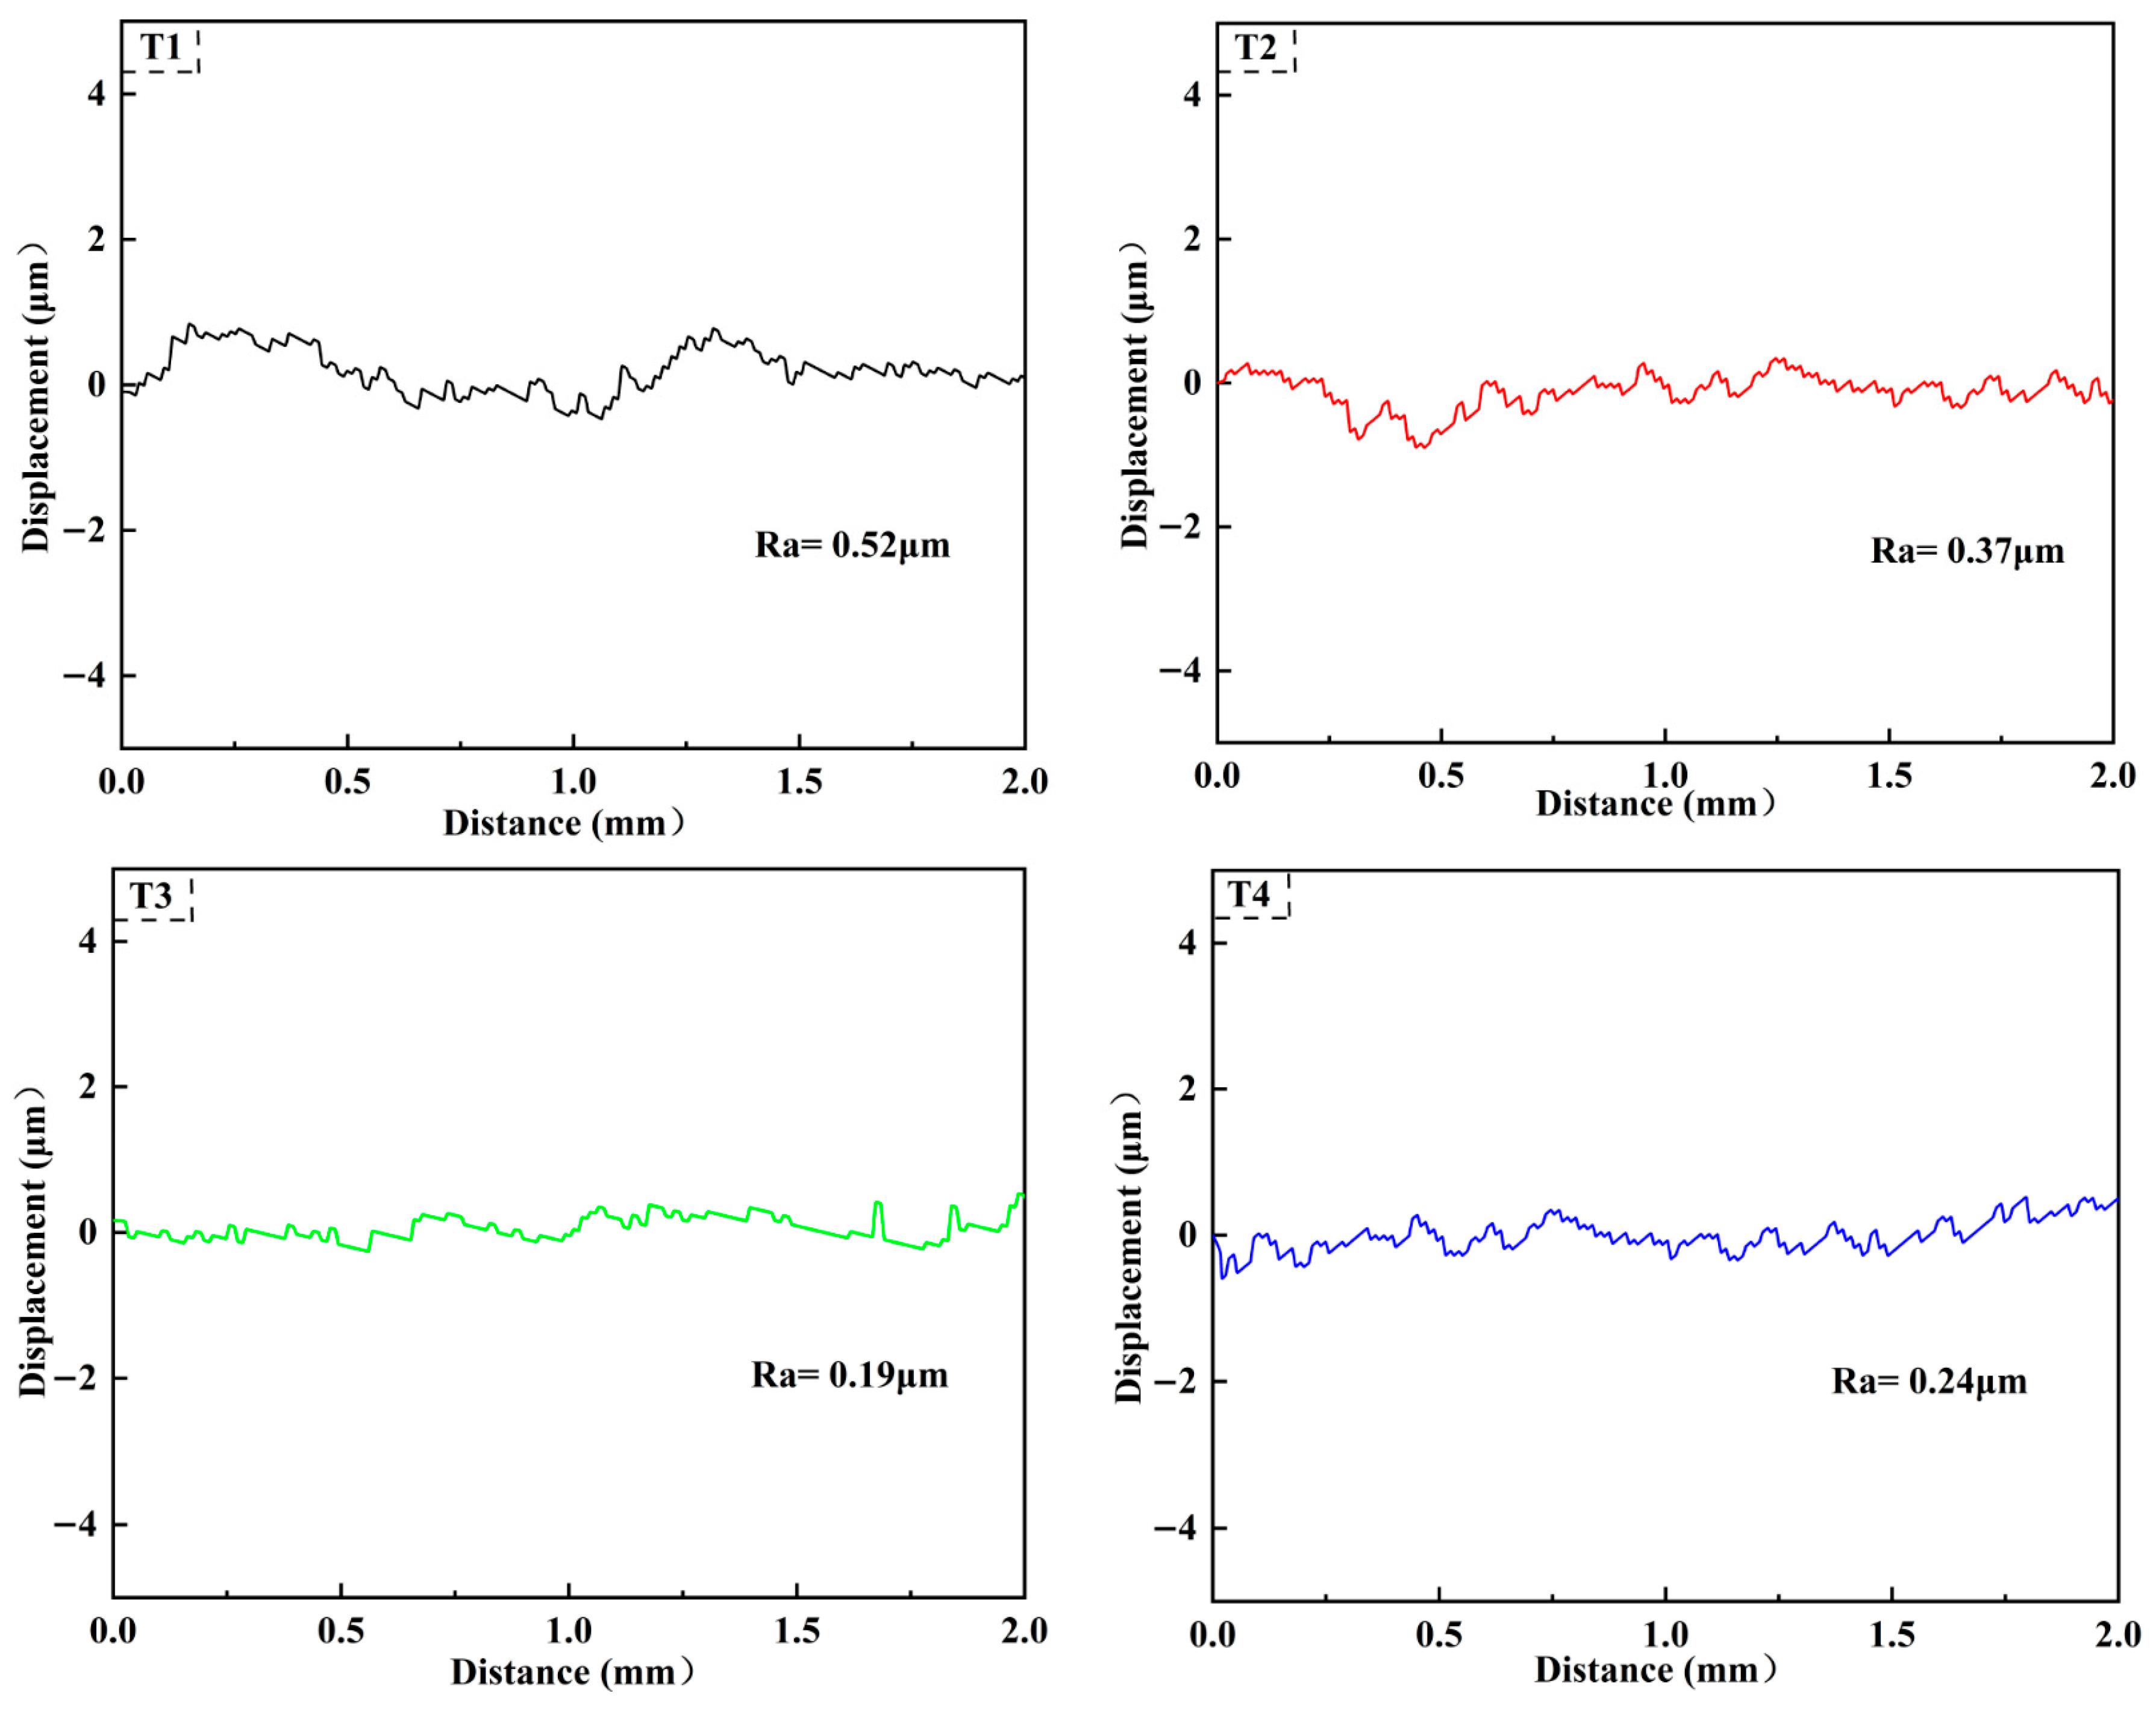
Figure 3 shows the surface morphology, cross-sectional morphology, and thickness variation of the Ti-Mo-N coating under different bias voltages. Macroscopically, coatings exhibit characteristic arc ion plating (AIP) macroparticles–molten target ejecta from cathode spot melting under extreme current densities [24]. Increasing the bias from −60 V to −90 V substantially reduces the large macroparticle density due to intensified target–substrate electric fields, which accelerate incident ions to sputter weakly adhered particles and eliminate pores, enhancing densification [25]. The surface roughness test results (Figure 4) further quantified this trend: when the bias voltage was −60 V, −90 V, −120 V, and −150 V, the corresponding arithmetic mean roughness (Ra) was 0.52 μm, 0.37 μm, 0.19 μm, and 0.24 μm respectively. This indicates that moderately increasing the bias voltage to −120 V can effectively suppress large particle defects and promote the densification of deposited particles, significantly optimizing the surface morphology and achieving the lowest roughness (Ra = 0.19 μm); however, an excessively high bias voltage (−150 V) due to excessive ion bombardment energy causes intense secondary sputtering, resulting in the formation of a large number of randomly distributed re-deposited fine particles on the surface, causing the roughness to rise to 0.24 μm and deteriorating the coating integrity. Although macroparticle elimination remains fundamentally challenging in AIP, high-bias conditions (−90 V to −120 V) markedly reduce the particulate density versus low-bias (−60 V) deposition. The coating thickness monotonically decreases with increasing bias, declining from 6.39 μm (−60 V) to 4.96 μm (−150 V). Cross-sectionally, low-bias (−60 V) coatings develop columnar microstructures attributed to near-floating potentials where insufficient ion acceleration yields porous growth with intercolumnar voids [26]. This columnar morphology persists at −90 V but with reduced intercolumnar spacing and enhanced densification. Higher biases promote adatom mobility that annihilates grain growth defects, dissolving columnar structures to form dense near-equiaxed microstructures with peak densification [27]. At −150 V, however, secondary sputtering slightly reduces the density. Critically, the elimination of columnar morphology is structurally advantageous as such features inherently propagate defects and cracks, with their suppression significantly enhancing mechanical performance.

3.2. Components and Phase Structure

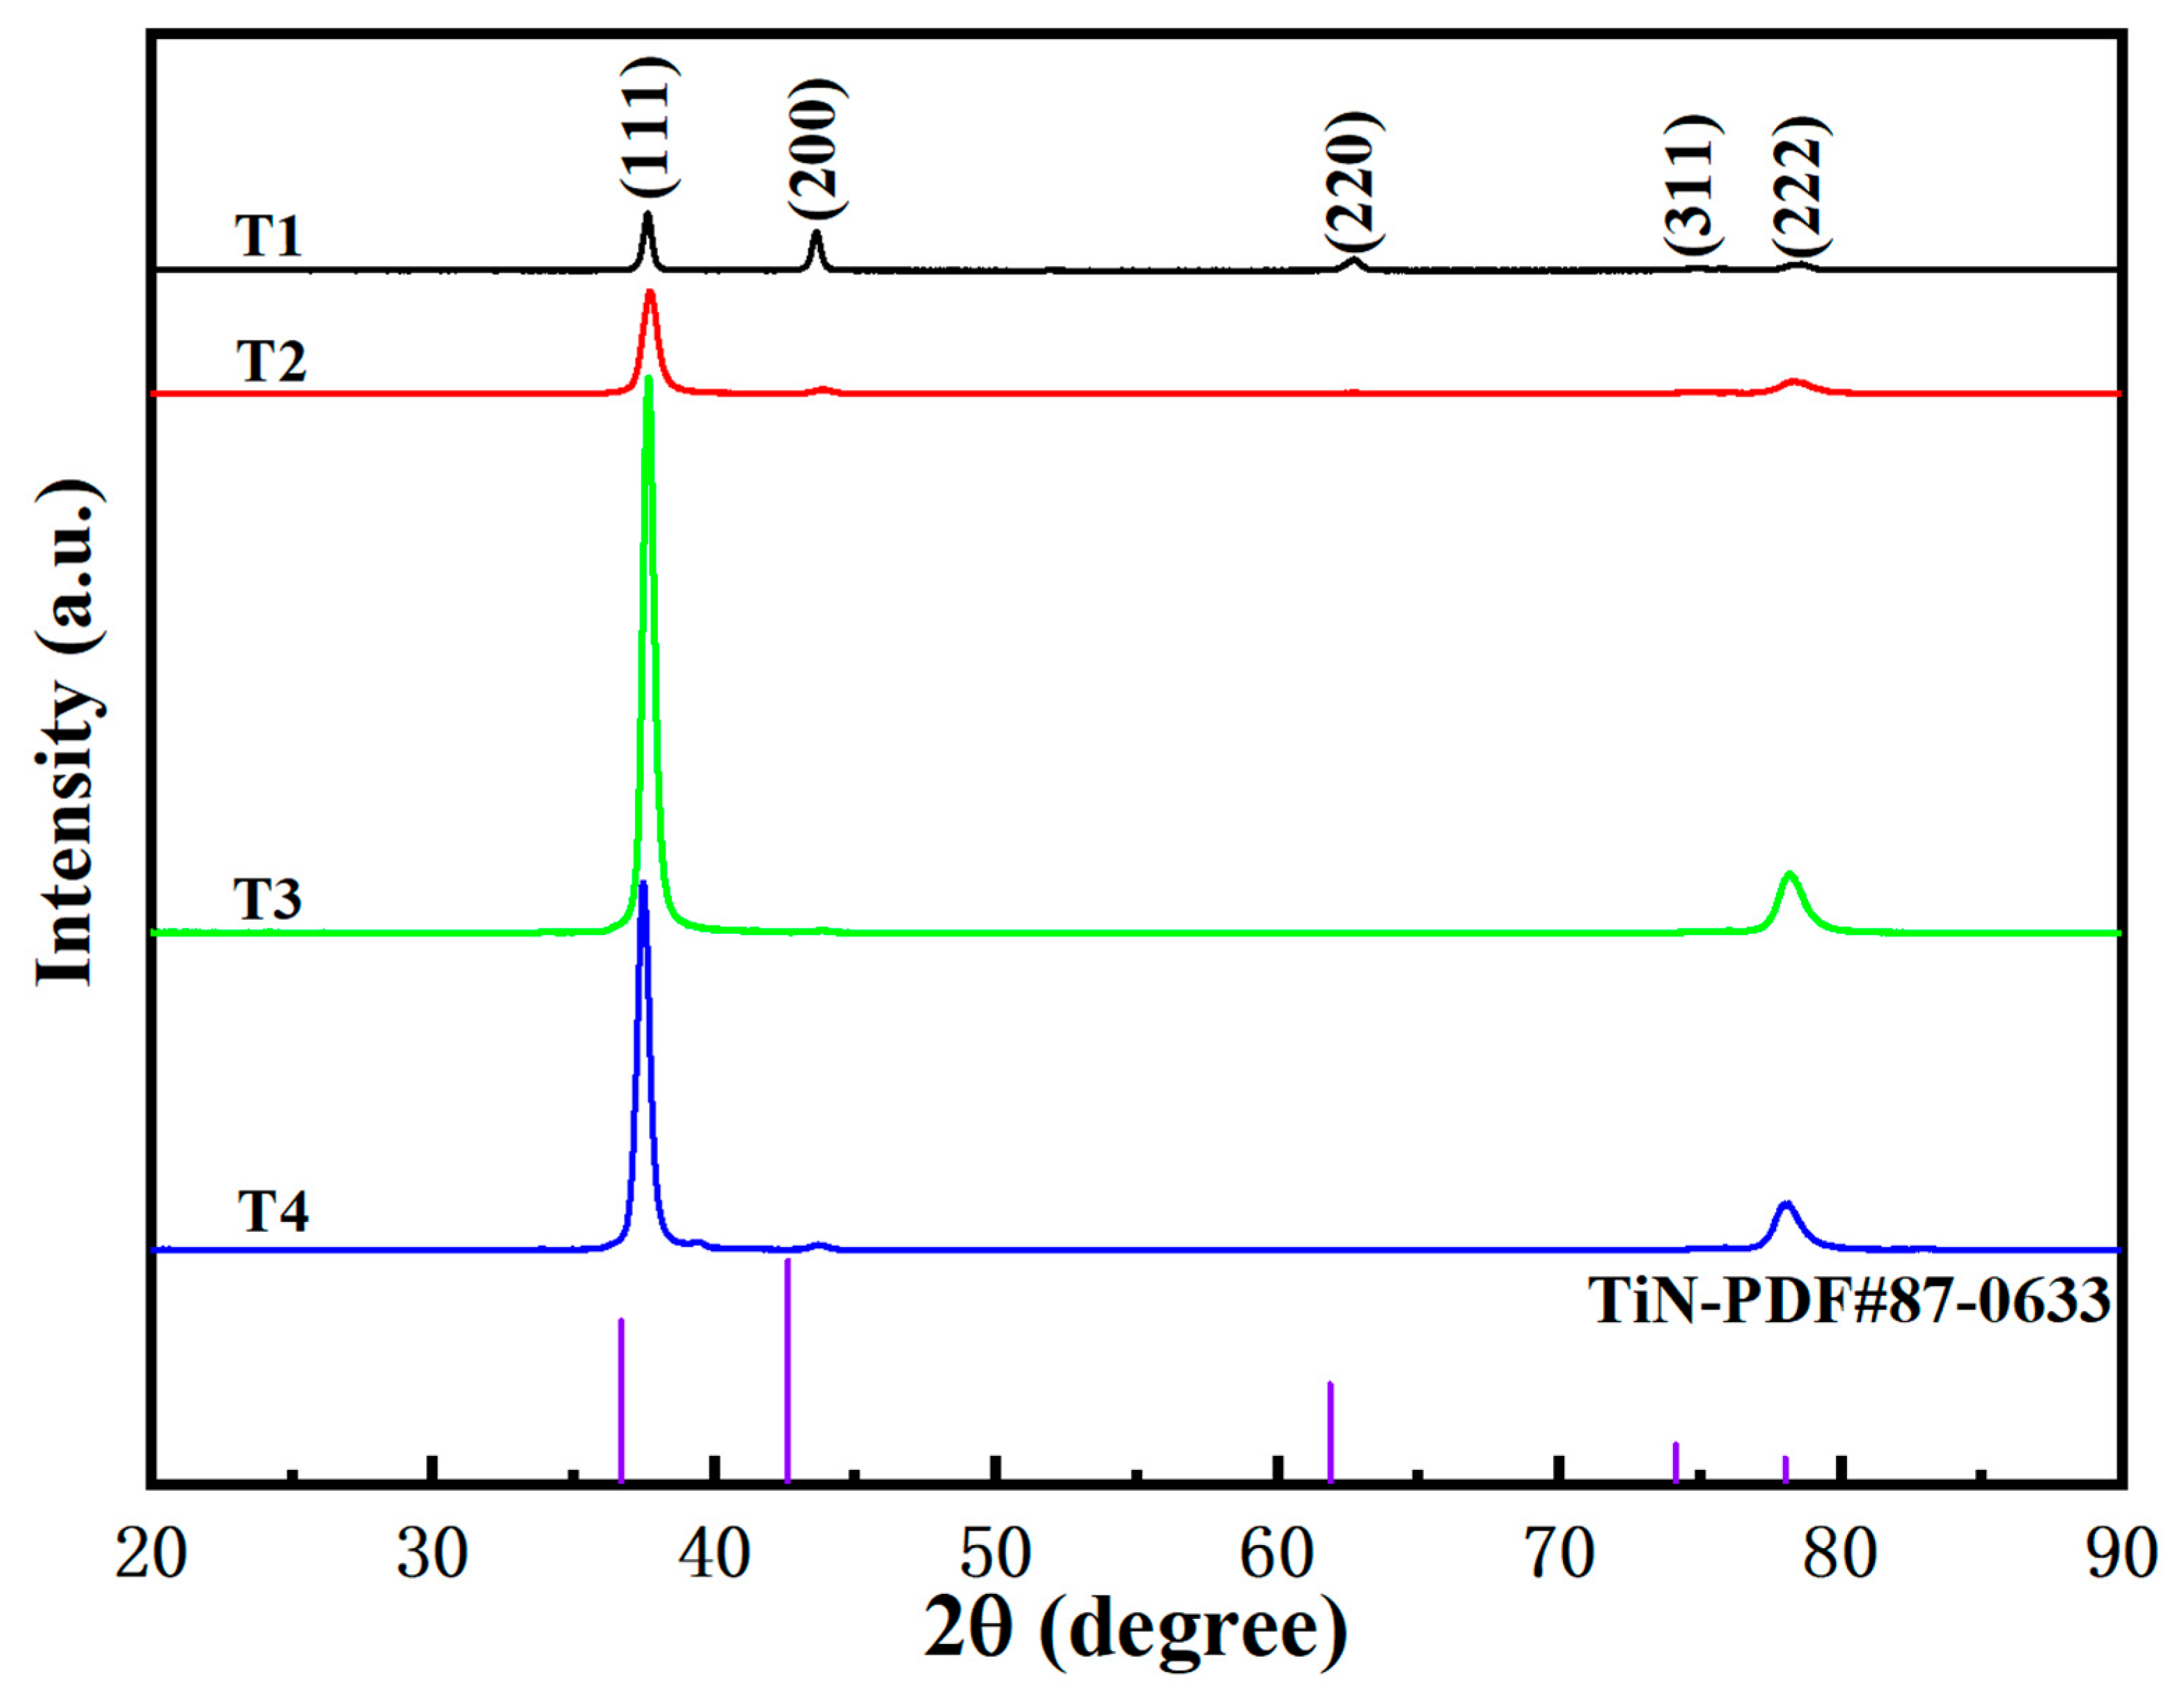
The chemical elemental composition of Ti-Mo-N coatings under different bias pressures was determined by EDS, and the results are shown in Table 2 below. There is no significant fluctuation in the elemental changes under different bias pressures. The elemental content of molybdenum (Mo) in the coatings was found to be lower than 0.15, which was attributed to the dissociation of the coatings. Zhao [13] also identified this phenomenon in his study, and the relative Mo ratios of all the samples were found to be less than the nominal 8%, which was attributed to the larger weight of Mo atoms, which have a larger vertical deflection, and thus, less Mo atoms reach the substrate, resulting in angular loss. Furthermore, titanium has a lower melting point and is more readily fused by electric arc. In comparison with molybdenum, titanium melts more easily. Consequently, when the target surface is excited, the sputtering of Ti is more active than that of Mo, resulting in a change in the Ti/Mo ratio in the resulting coating. As illustrated in Figure 5, the XRD patterns of Ti-Mo-N coatings vary with differing bias pressures. The results demonstrate that the prepared coatings exhibit a typical B1-NaCl structure with optimal crystallinity, and all of them demonstrate preferential growth along the (111) crystal plane. This phenomenon is attributed to the fact that the bias pressure can enhance the sputtering effect and increase the potential energy of atomic migration and diffusion, thereby forming the plane with the most tightly packed atomic arrangement. Concurrently, the (111) crystal plane exhibits the lowest strain energy. As the internal stress accumulates with an increase in bias, the coating exhibits growth in this direction, driven by the principle of energy minimization to reduce the internal stress. When Mo atoms replace Ti in the lattice, local lattice distortion occurs. This distortion hinders the movement of dislocations, which is the core mechanism of solid solution strengthening. When dislocations slide through the distorted lattice regions, they require greater force to pass through, thereby enhancing the hardness and strength of the material. Although the substitution of a single atom has a very small effect, a large number of substitutional atoms will cause a slight change in the average size of the entire unit cell. These changes can also be verified by the shift and broadening of the diffraction peak positions. The displacement and broadening of the diffraction peaks in the XRD spectrum can be used to determine that the lattice has undergone distortion. Additionally, no Mo-related diffraction peaks were detected in the XRD spectrum, indicating that Mo did not precipitate as an independent second phase. This further confirms that Mo exists in a solid solution form and affects the crystal structure of TiN.
The preferred orientation of the coating is determined based on the peak strength value, and the texture coefficient of the coating is calculated using the Texture Coefficient formula. The calculation formula is as follows [28]:
T C ( h k l ) = I ( h k l ) / I 0 ( h k l ) ( 1 / n ) I ( h k l ) / I 0 ( h k l )
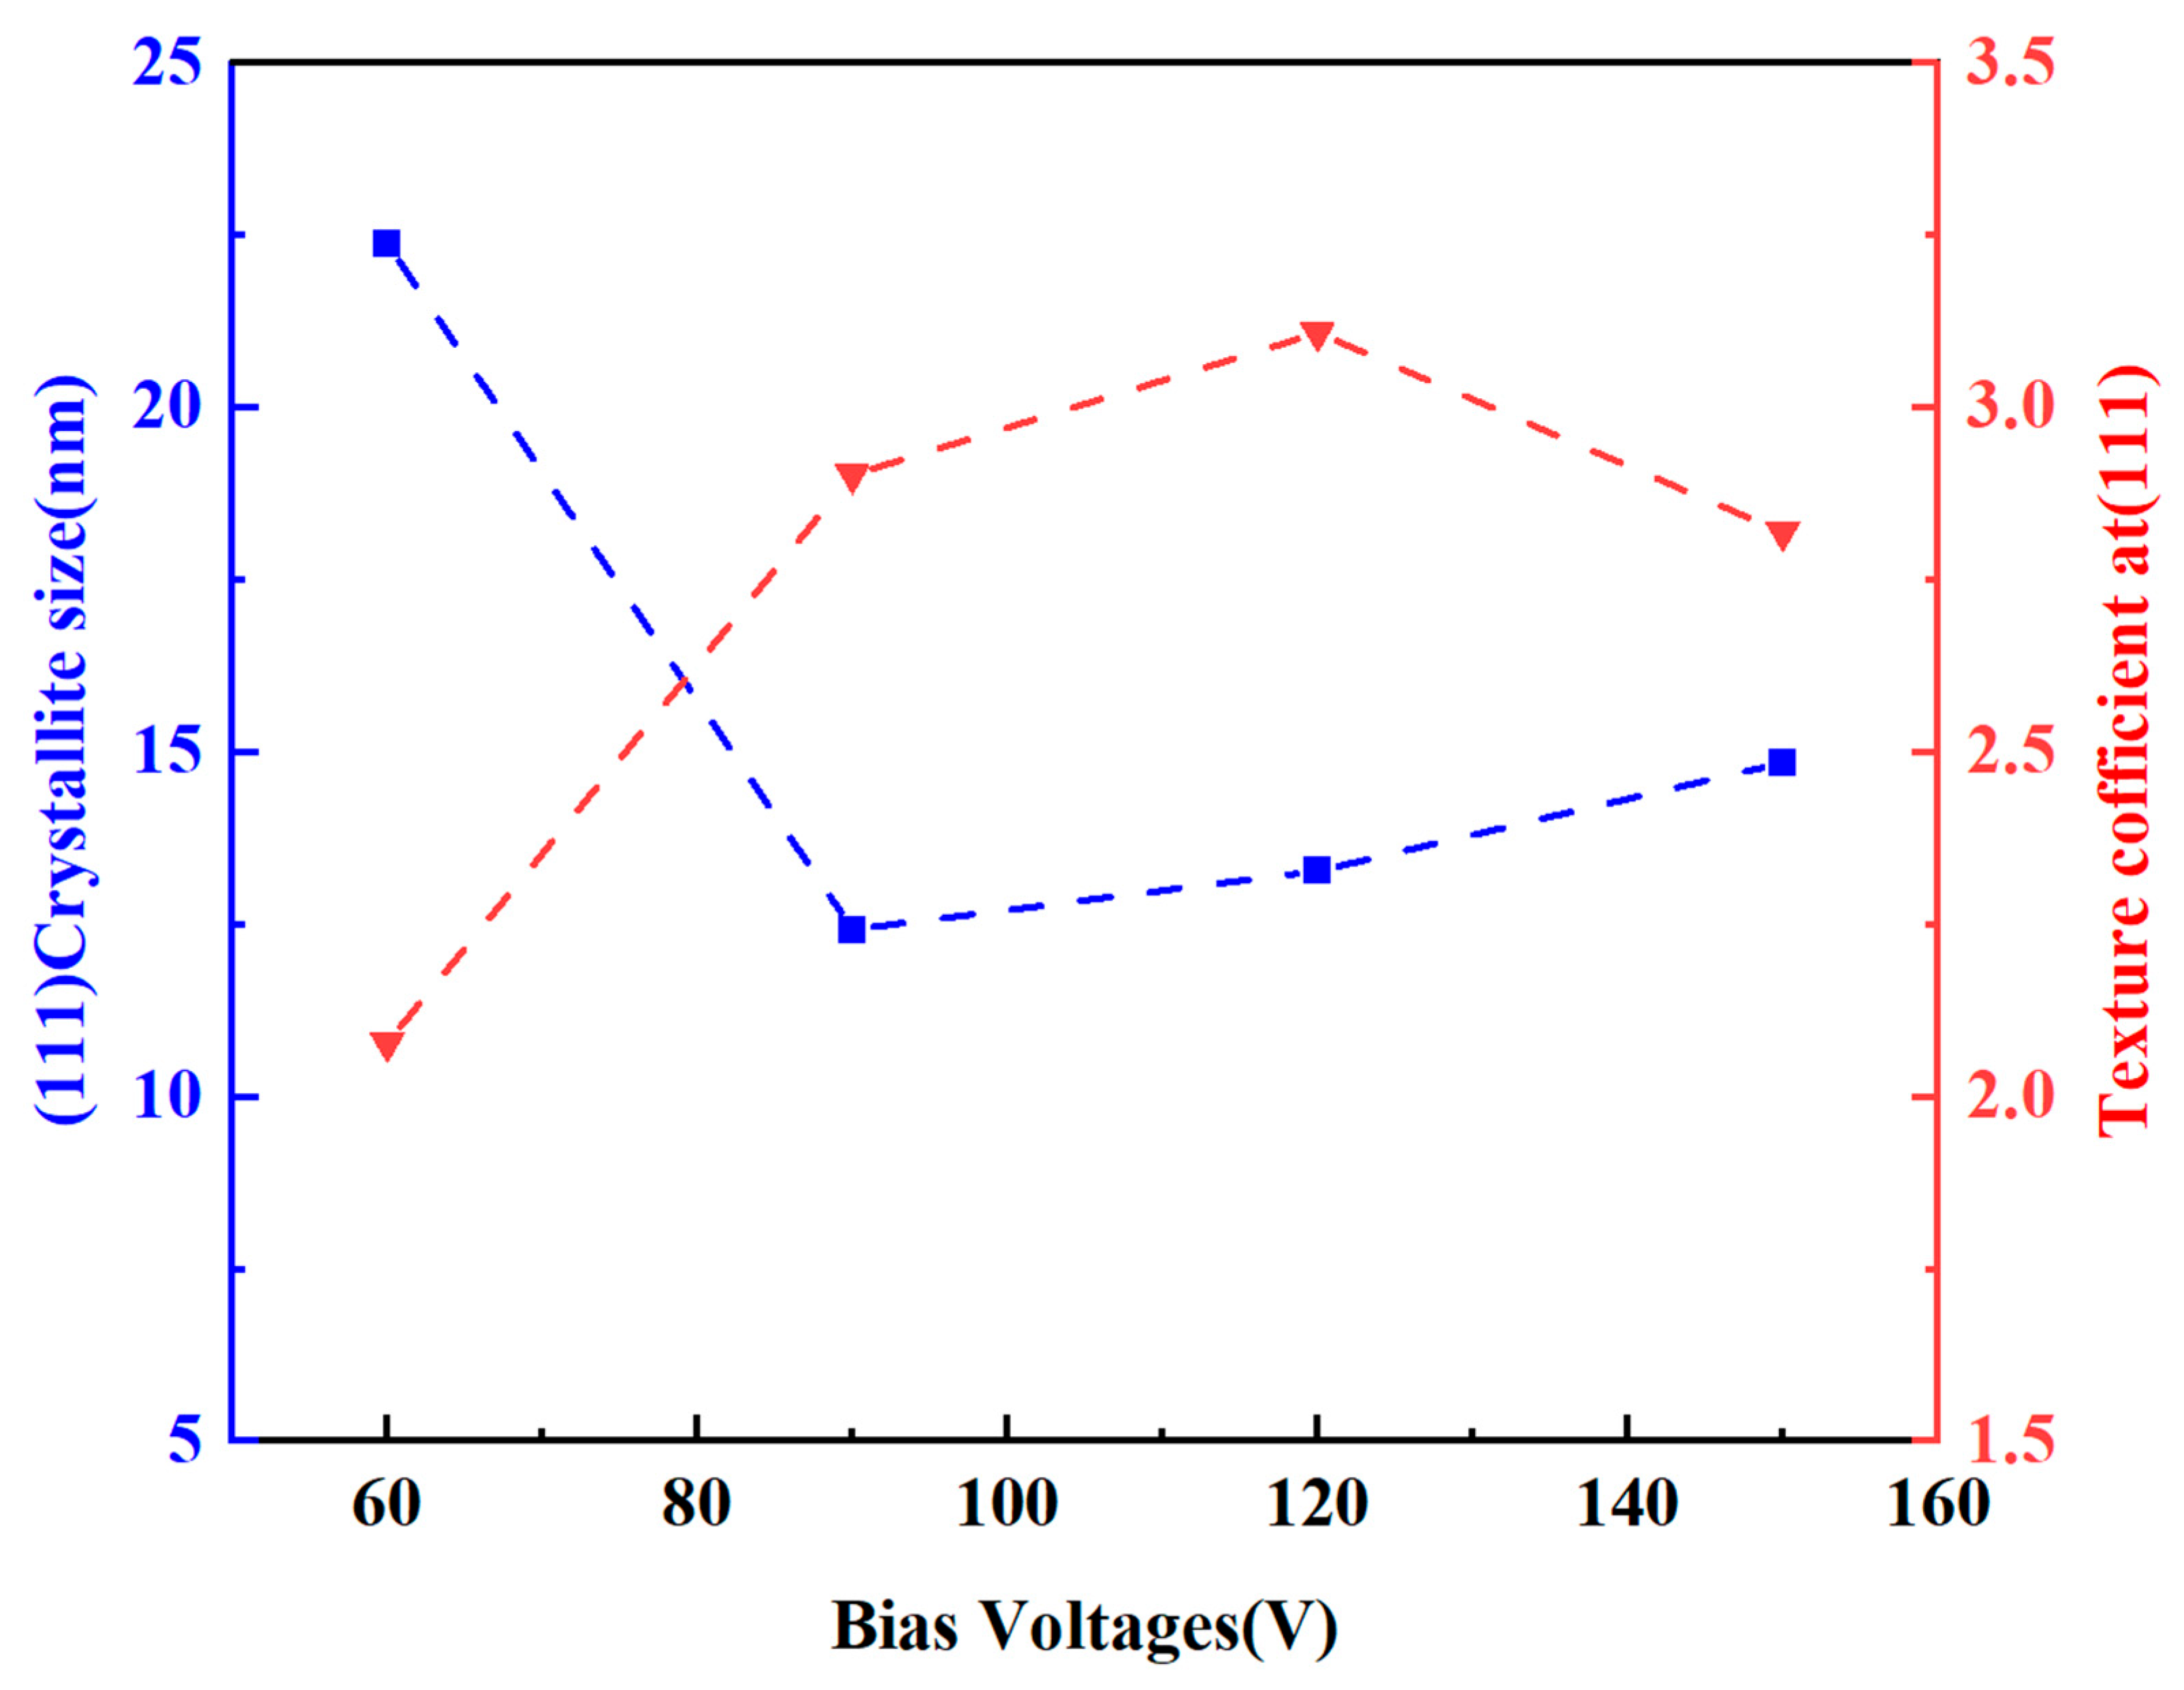
where I(hkl) is the actual diffraction peak intensity of the (hkl) facet in the coating; I0(hkl) is the crystallographic diffraction intensity of the standard (hkl) facet accessed via the PDF diffraction card; and n is the number of XRD diffraction peaks. When TC(hkl) > 1, it indicates that the preferentially oriented crystal face of the coating is the (hkl) face, and when TC(hkl) < 1, it indicates that the (hkl) face is not preferentially oriented. The grain size of the TiN (111) face was calculated simultaneously by the Scherrer formula, and the results are shown in Figure 6. The weaving coefficients of the TiN (111) crystal faces of all the samples are greater than 1, indicating that the Ti-Mo-N coatings are optimally oriented to TiN (111) crystal faces under different bias conditions. With the increase in bias voltage, the weaving coefficient first increases and then decreases. When the bias voltage is −120 V, the fabrication coefficient reaches the maximum value. This is consistent with the trend of the diffraction peak intensity in XRD analysis. At a lower bias voltage, the migration and diffusion ability of atoms is limited, and it is difficult to form a highly organized structure. With the increase in bias pressure, the atoms are more likely to aggregate and grow on the (111) crystal surface, which leads to the enhancement of the weave strength. The texture has an important effect on the properties of the coating, and a stronger texture causes the coating to exhibit anisotropy in some directions.

3.3. Mechanical Properties

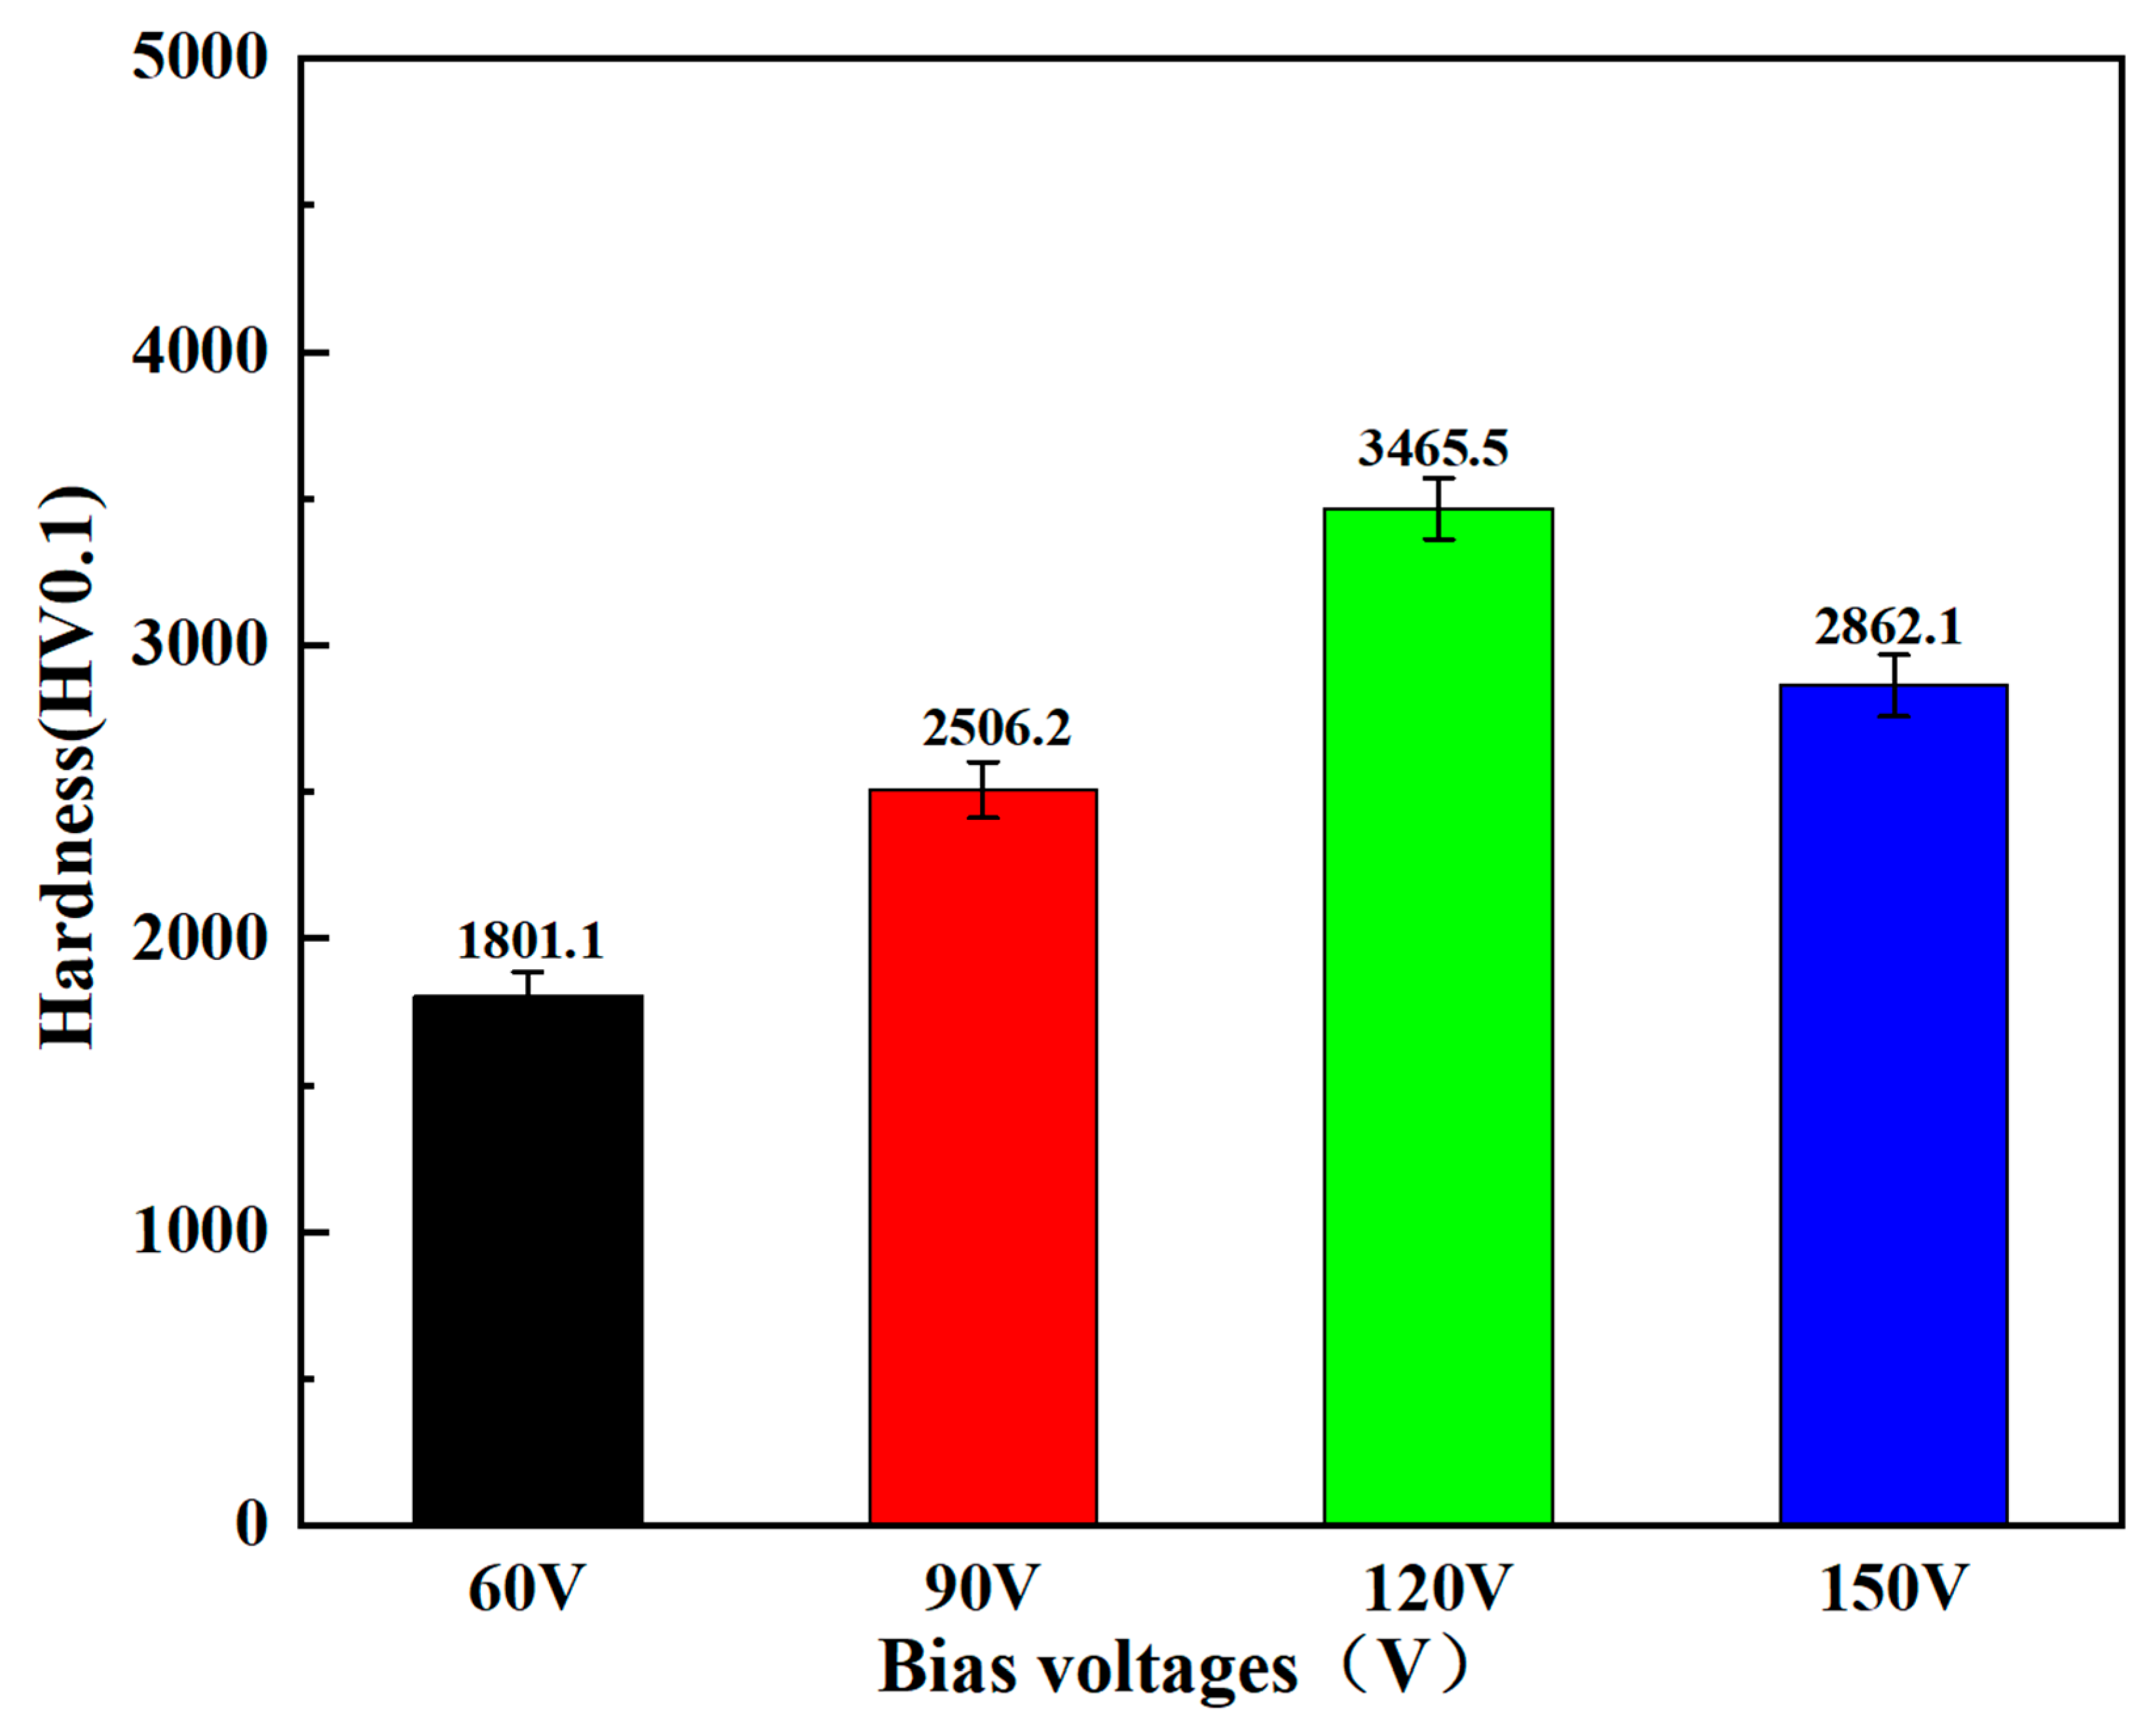
Figure 7 shows the influence of base bias voltage on the Vickers hardness of the Ti-Mo-N coating. The hardness values of specimens T1 to T4 are 1801.1 HV (−60 V), 2506.2 HV (−90 V), 3465.5 HV (−120 V), and 2862.1 HV (−150 V), respectively. The trend of coating hardness change is significantly positively correlated with the strength of the TiN (111) texture. The peak hardness (−120 V) corresponds to the strongest preferred orientation strength of the TiN (111) crystal plane. This phenomenon is consistent with the finding in reference [29], and its physical root lies in the inhibitory effect of the TiN (111) texture on the activation of slip systems: when the external load is perpendicular to the (111) crystal plane, the shear stress of all potential slip systems approaches zero, causing dislocations to be difficult to initiate slip, thereby significantly enhancing the plastic deformation resistance of the material. According to the grain size data of TiN (111) crystal planes under different bias voltages shown in Figure 6 (−60 V: 22.37 nm; −90 V: 12.42 nm; −120 V: 13.27 nm; −150 V: 14.84 nm), the grain sizes do not show significant differences under −90 V, −120 V, and −150 V bias voltages, and their contribution to the change in coating hardness is relatively weak. Therefore, the strength of the TiN (111) crystal plane texture is the dominant factor regulating the evolution of coating hardness.
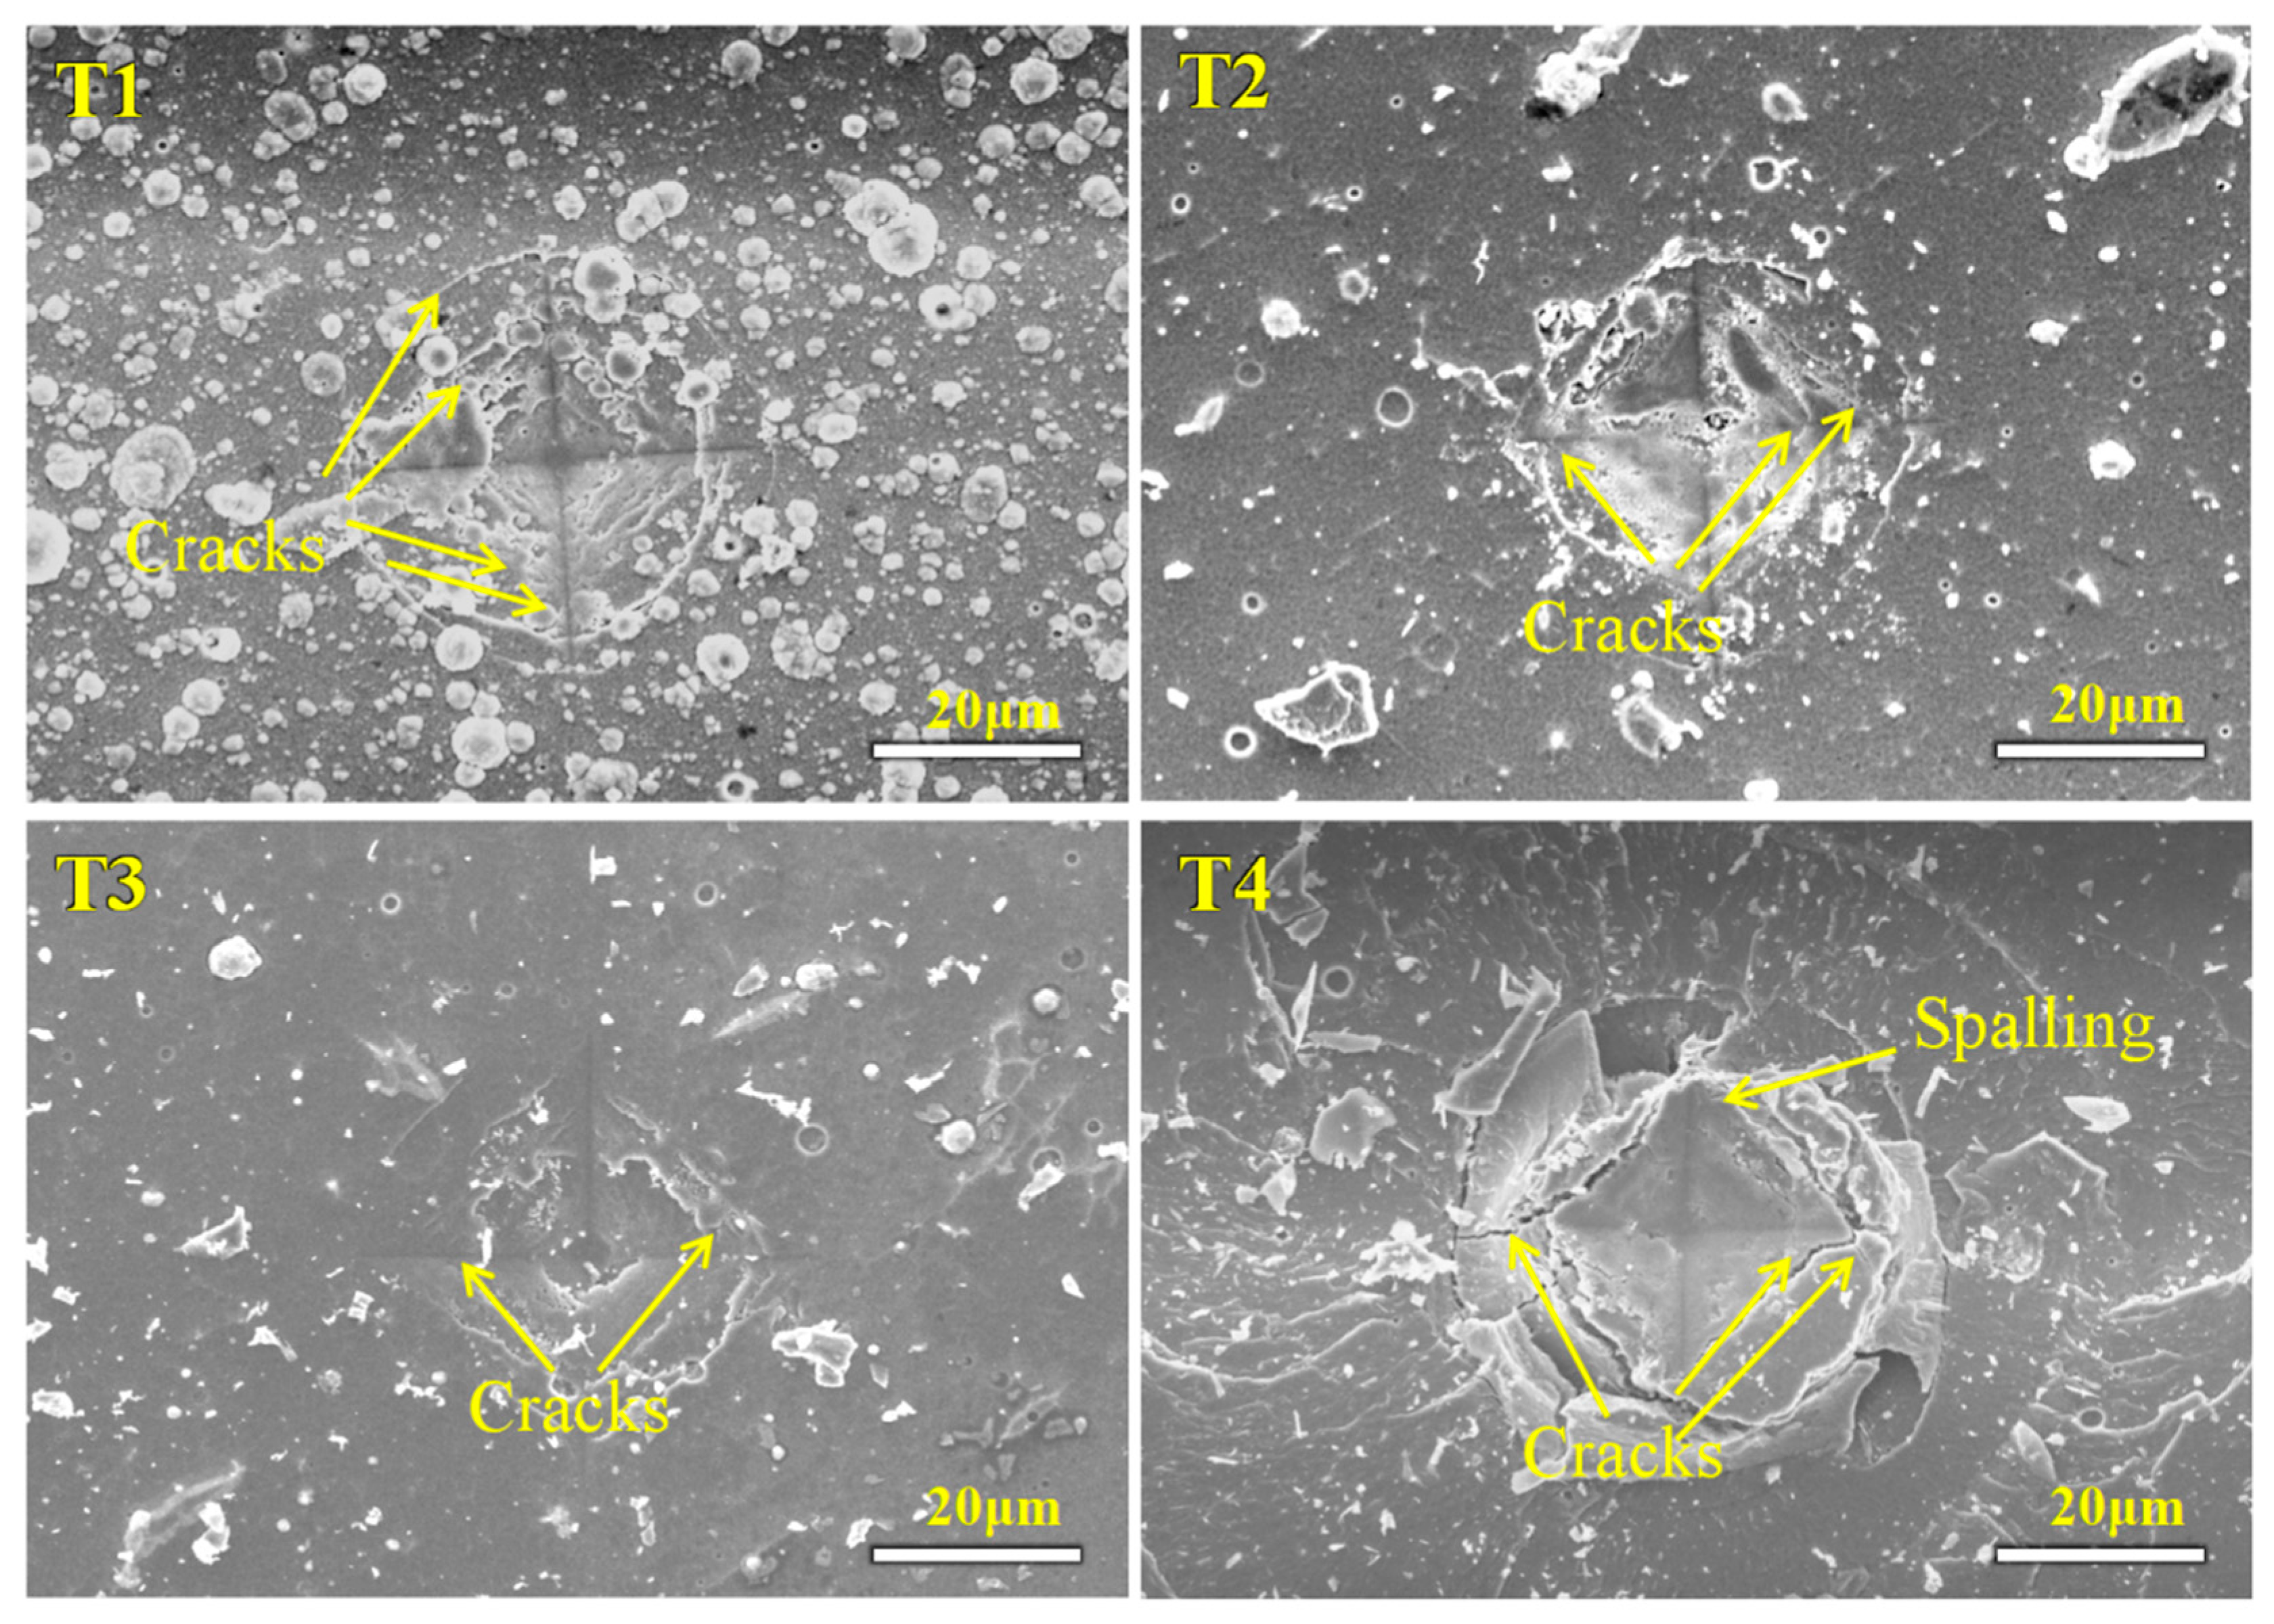
The indentation characteristics produced by the durometer can be indicative of the coating’s fracture toughness and load carrying capacity. As demonstrated in Figure 8, the indentation characteristics of the samples T1 to T4, as tested by Vickers, exhibit significant variation. It is evident that under identical conditions, there is a substantial disparity in the indentation morphology of the coatings. The T1 and T4 samples demonstrate a rough cracking pattern, which is indicative of inadequate fracture toughness. The fracture was more severe in the T4 sample, which was due to significant coating peeling around the crack. However, both the T2 and T3 samples exhibited shallower cracks surrounding the indentation and demonstrated adequate fracture toughness, with T3 demonstrating superior performance compared to T2 due to a reduced crack area. The trend of the indentation characteristics is consistent with the hardness test results, and the T3 sample has the optimum fracture toughness and load carrying capacity.

3.4. Tribological Properties

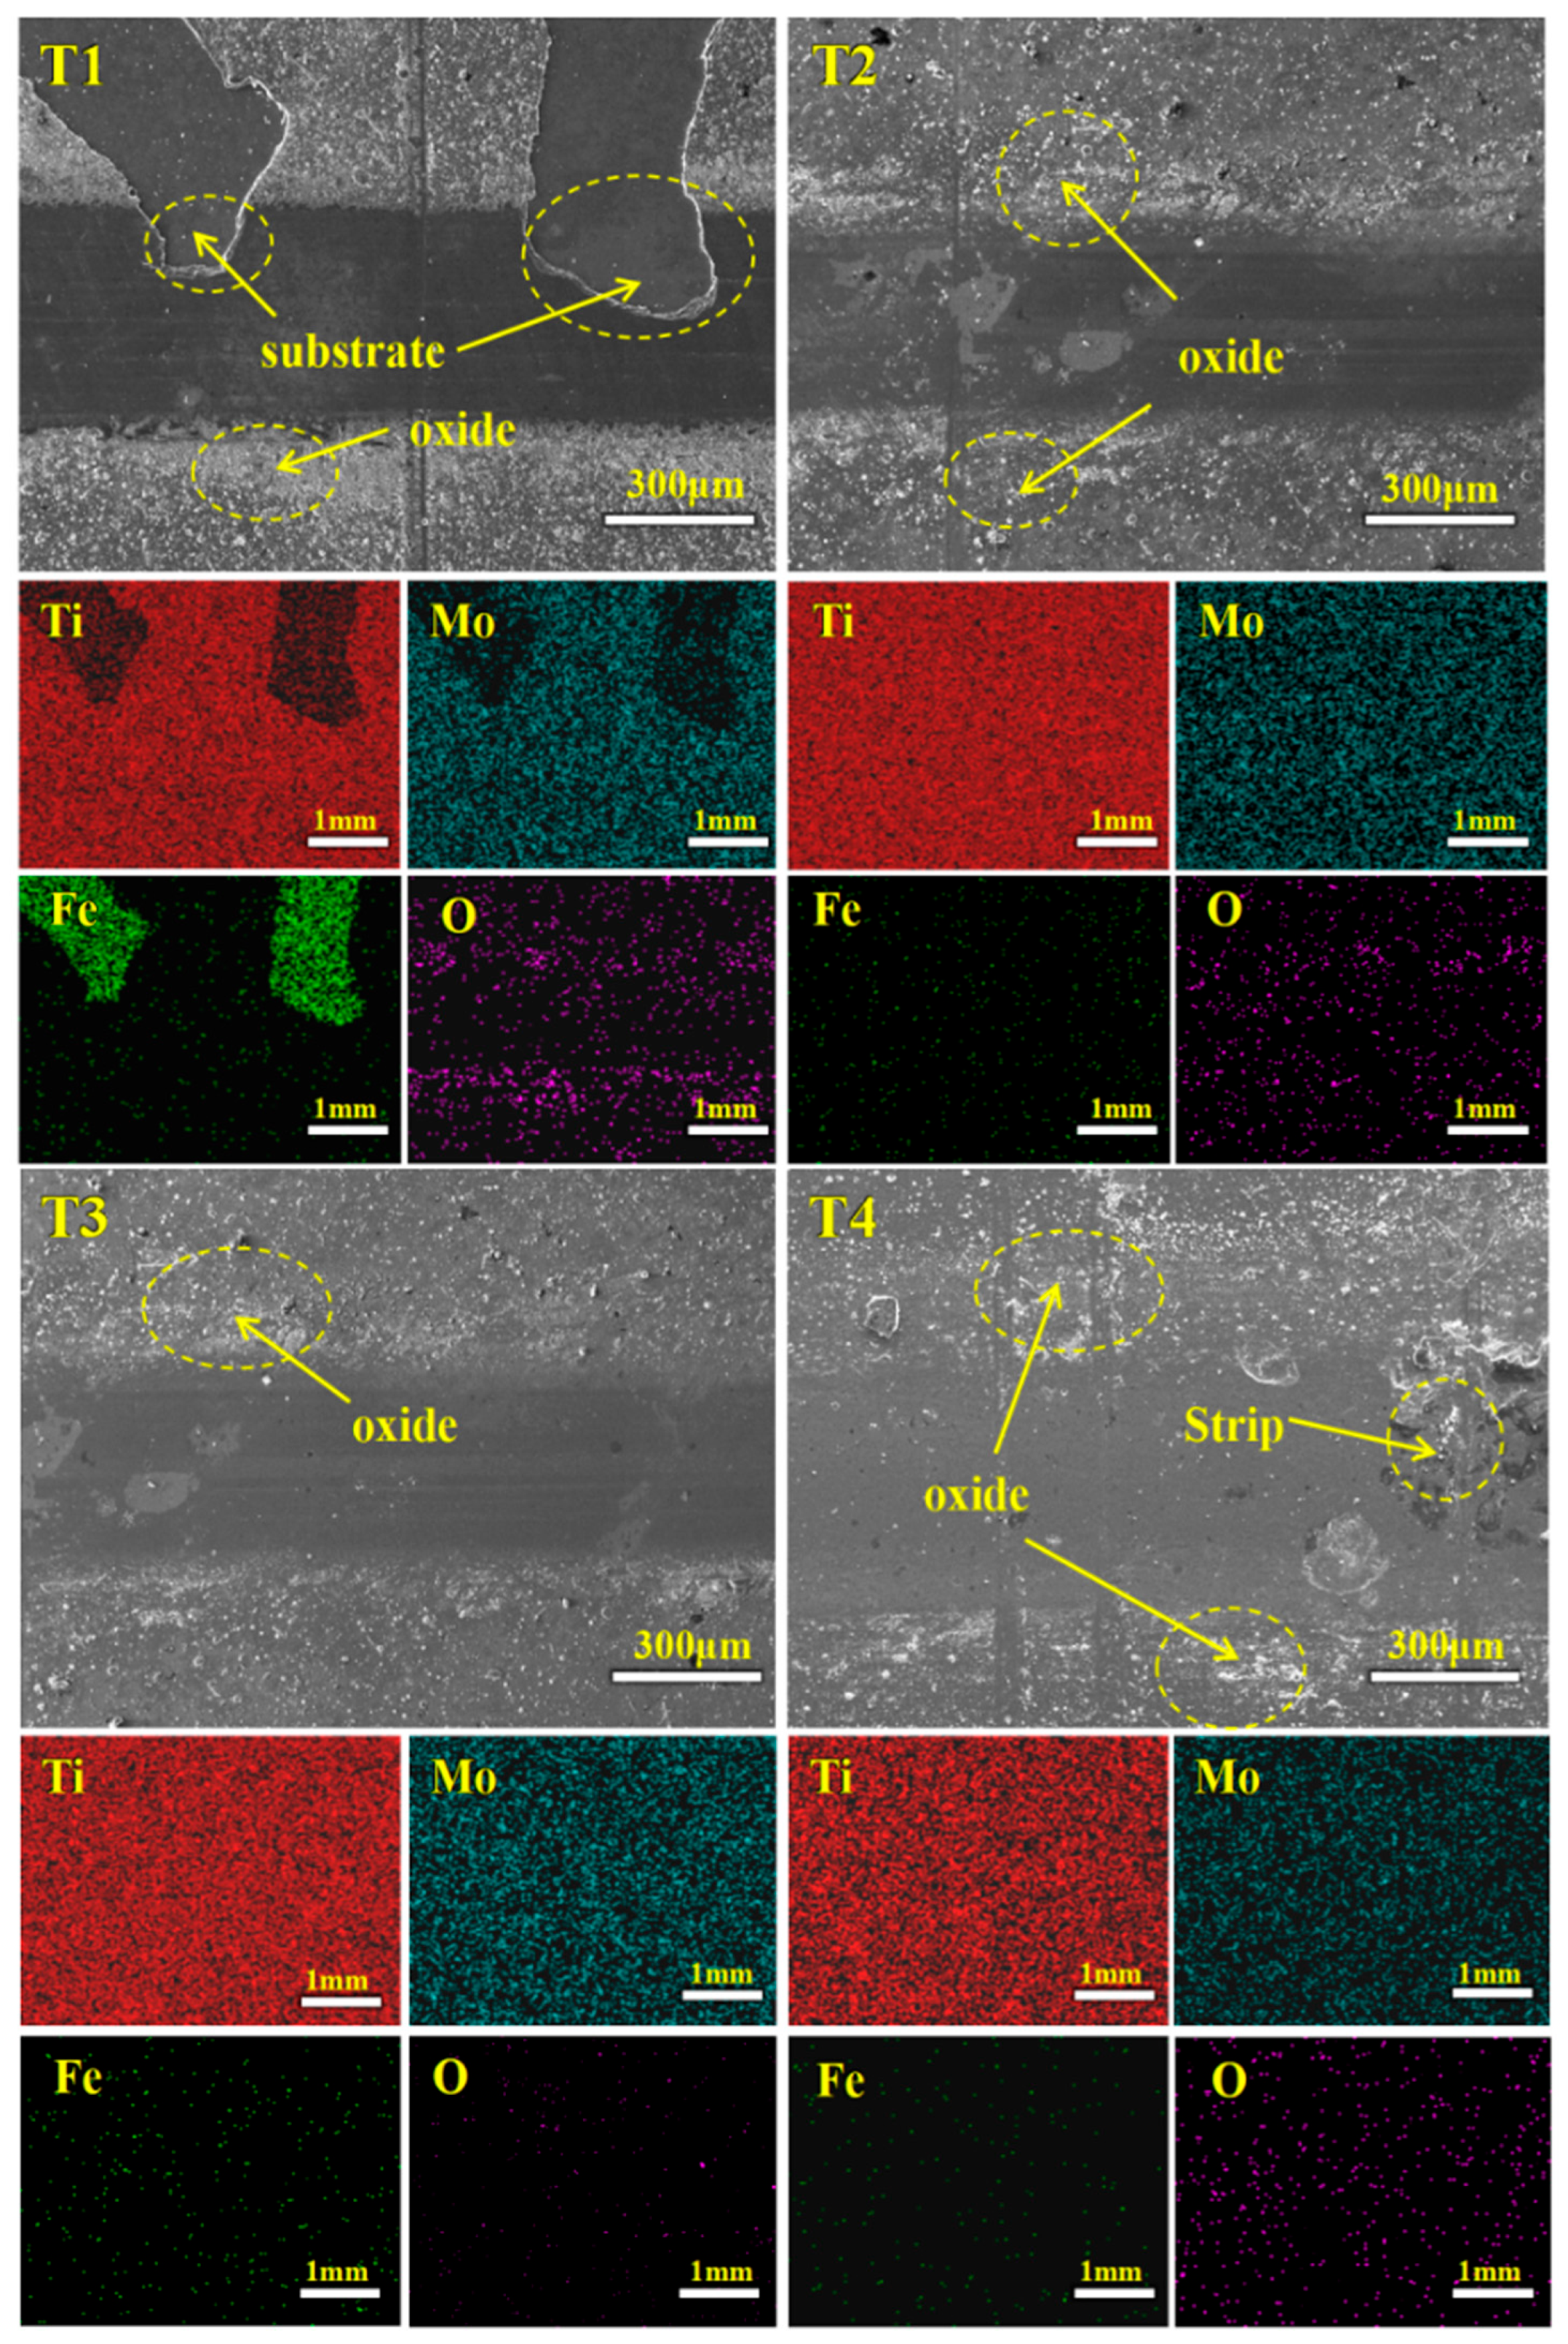
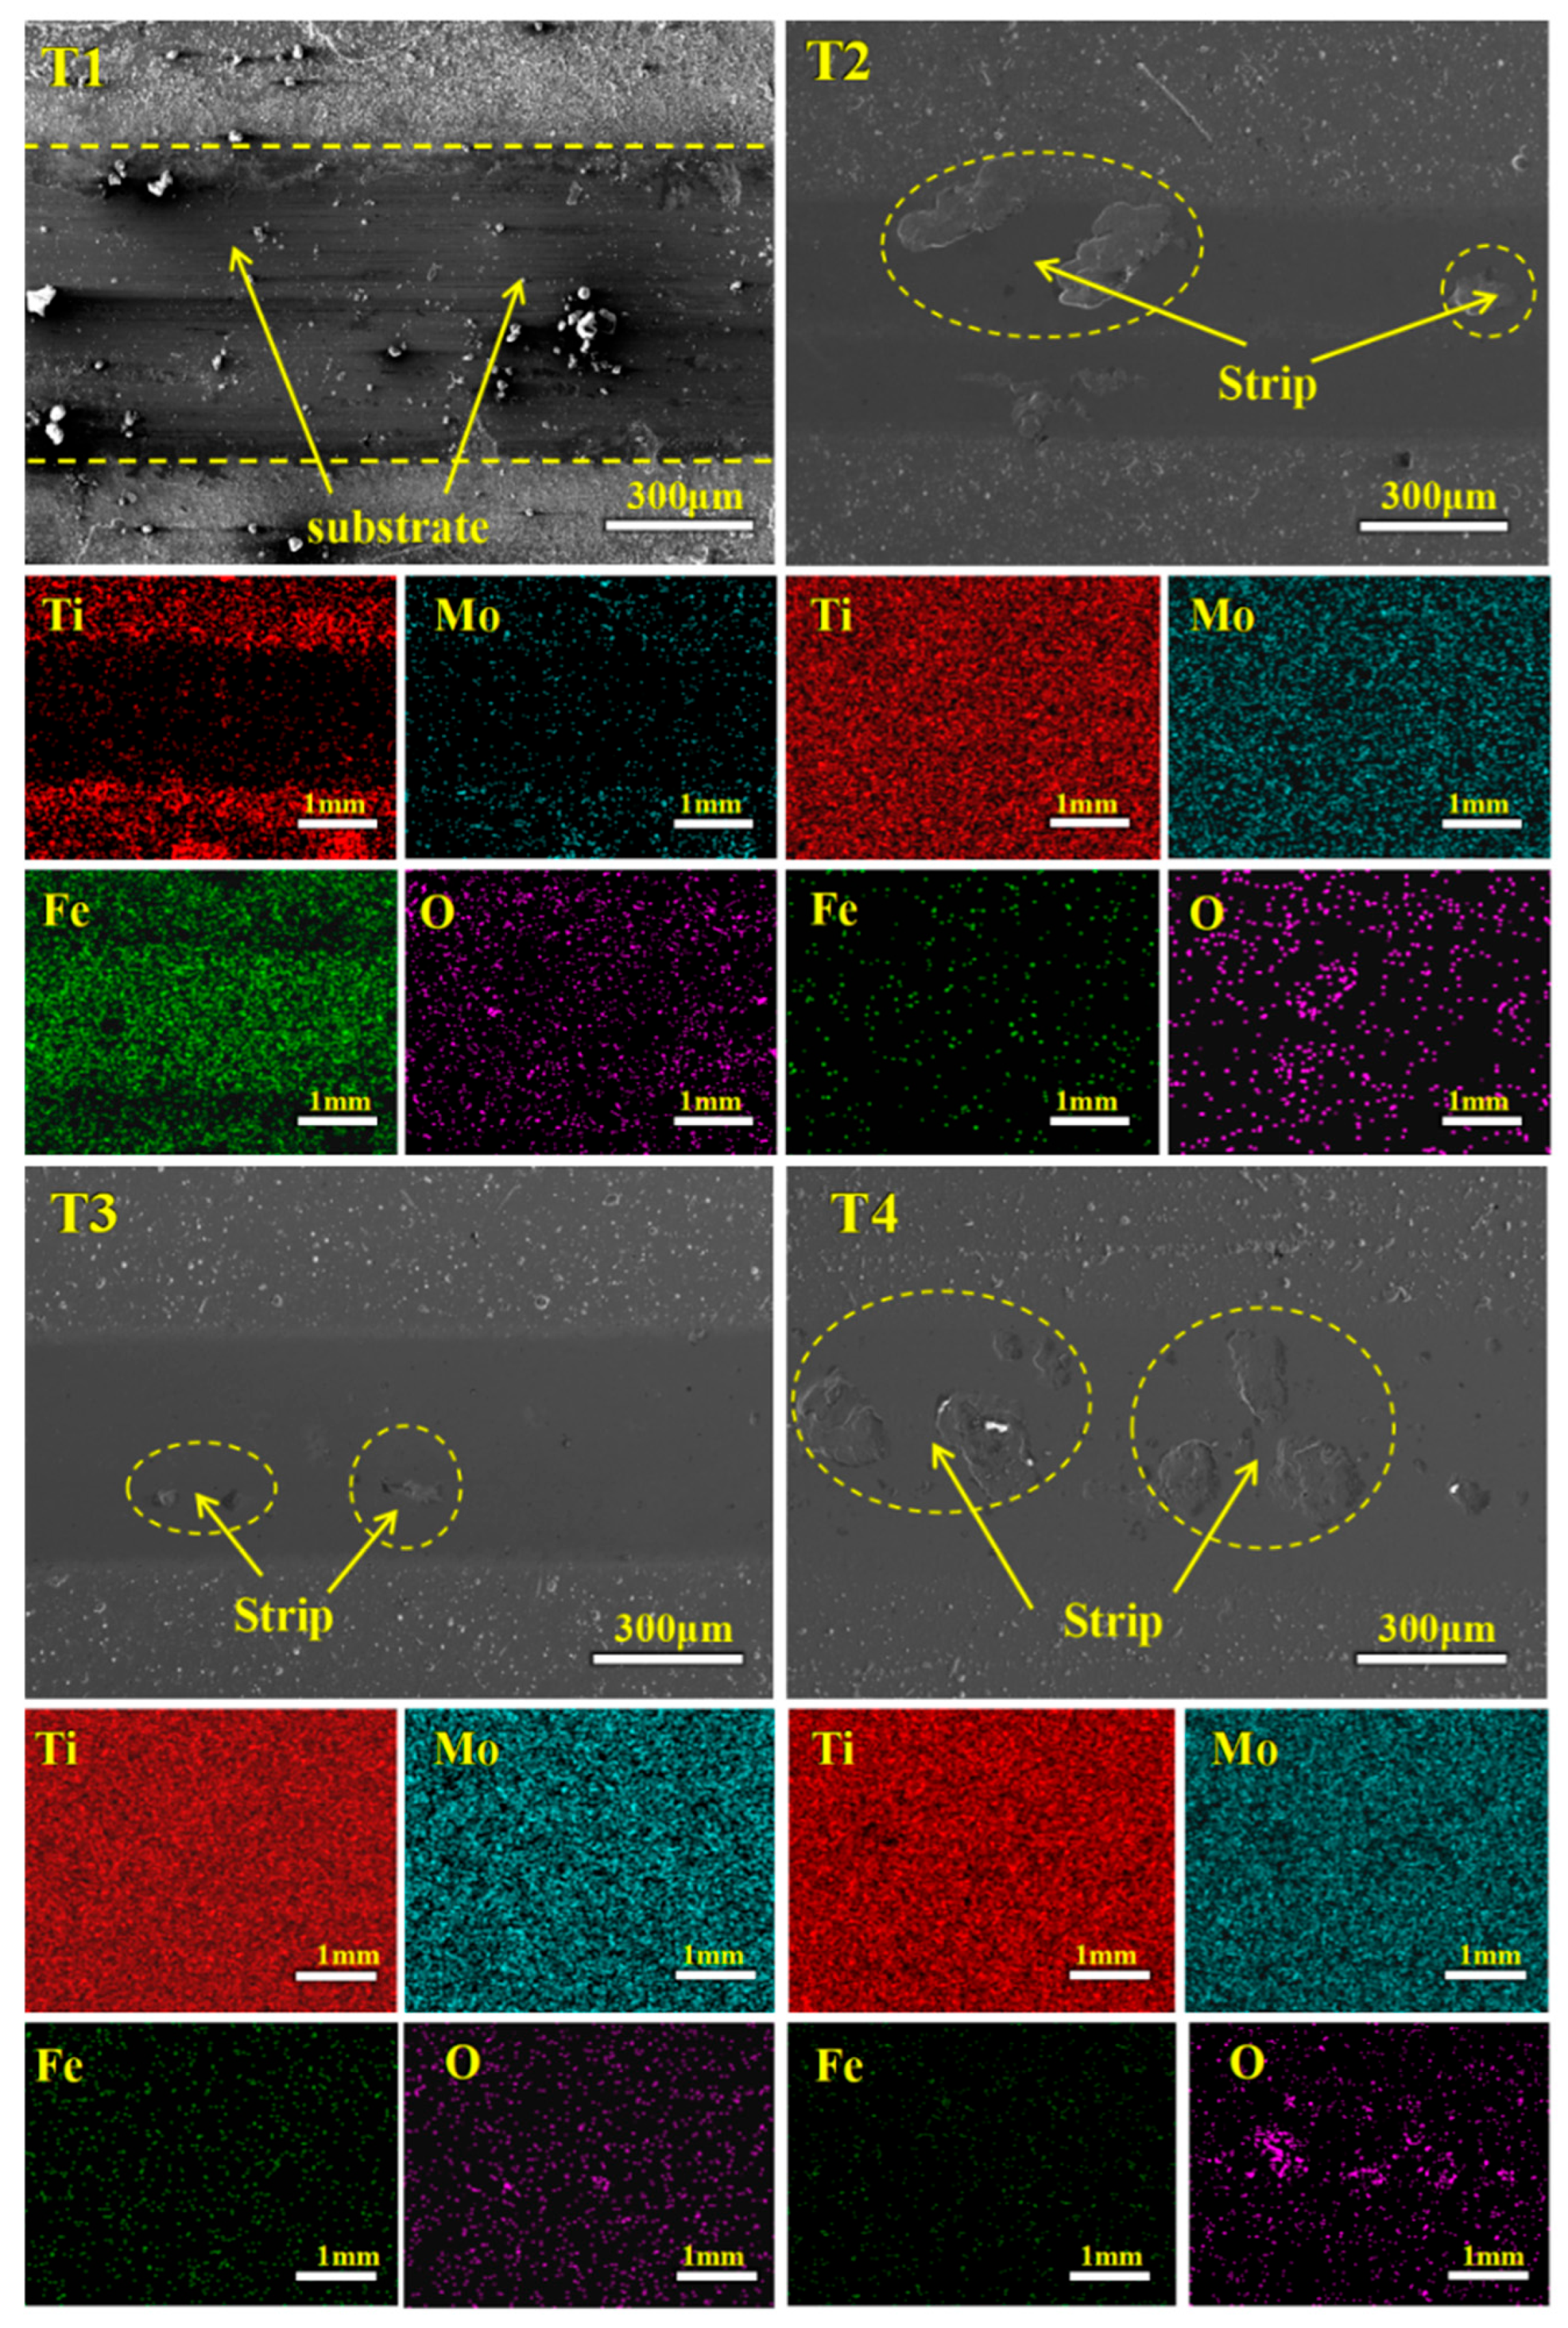
Figure 9 presents the wear track morphology and corresponding EDS analysis of coatings under dry sliding conditions, examining the influence of substrate bias voltage on the surface damage mechanisms. EDS analysis revealed significant oxygen enrichment along the wear track peripheries in all specimens, confirming oxidative wear. Samples T1 and T2 exhibited more pronounced oxygen accumulation, indicating greater oxidative susceptibility. T1 specifically demonstrated parallel surface cracking from friction-induced plastic deformation, leading to lamellar delamination. Lower bias voltage specimens manifested inadequate cohesive strength due to reduced residual stress, resulting in localized spalling under sliding stresses. This combination establishes T1’s dominant wear mechanism as synergistic abrasive–oxidative wear. Although oxidative wear affected T2 and T3, neither showed catastrophic failure, with T3 exhibiting shallower tracks and smoother surfaces than T2. However, it should be noted that the improvement in wear resistance is not a monotonically increasing relationship with the bias voltage. Although the wear resistance of samples T1 to T3 continuously improved as the bias voltage increased, significant performance degradation was observed at a higher bias voltage (T4), with the worn surface showing obvious cracks and peeling pits. This performance transition indicates the existence of an optimal bias voltage range (approximately corresponding to the T3 level), beyond which further increases in the bias voltage will lead to a decrease in the coating’s wear resistance. This degradation phenomenon is mainly attributed to the excessive enhancement of the re-sputtering effect at high bias voltages and the aggravation of inherent deposition defects. Specifically, intense ion bombardment (high bias voltage) is beneficial for coating densification within a moderate range (as shown in T1–T3), but excessive ion energy will induce significant lattice damage and residual stress accumulation and exacerbate the adverse effects of intrinsic defects (such as columnar grain boundaries, micro-holes), ultimately causing brittle cracking and peeling failure of the coating.
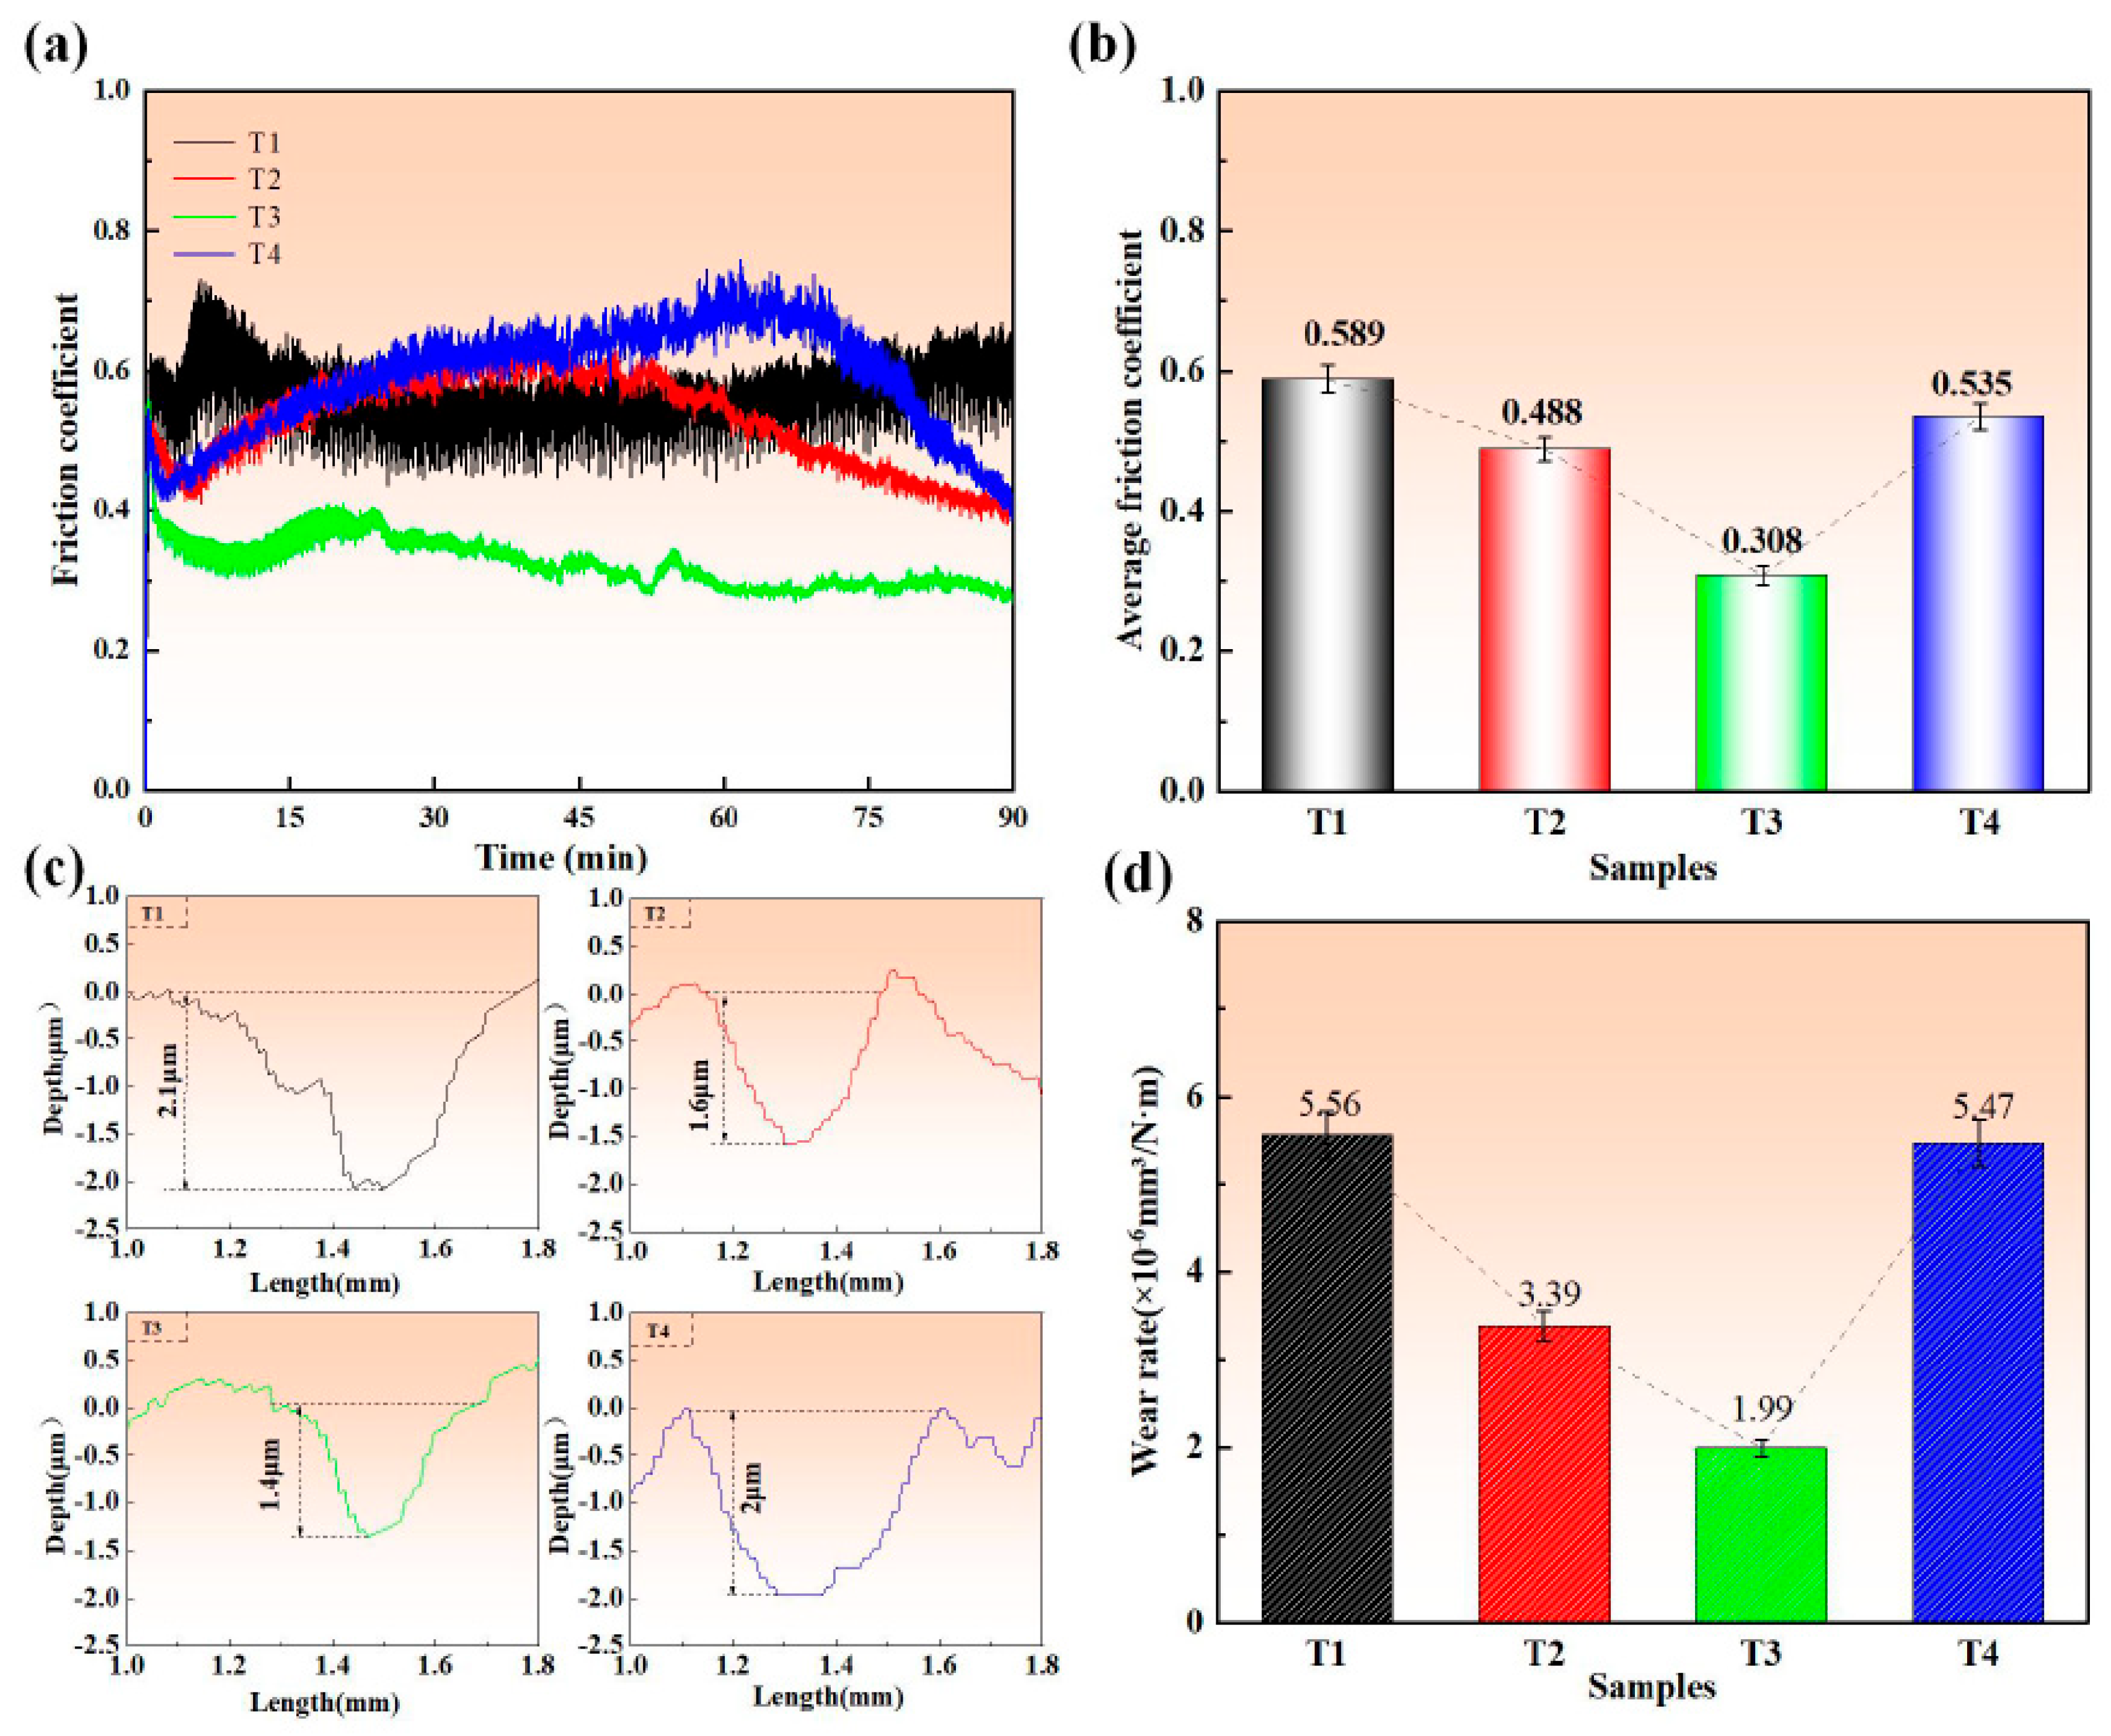
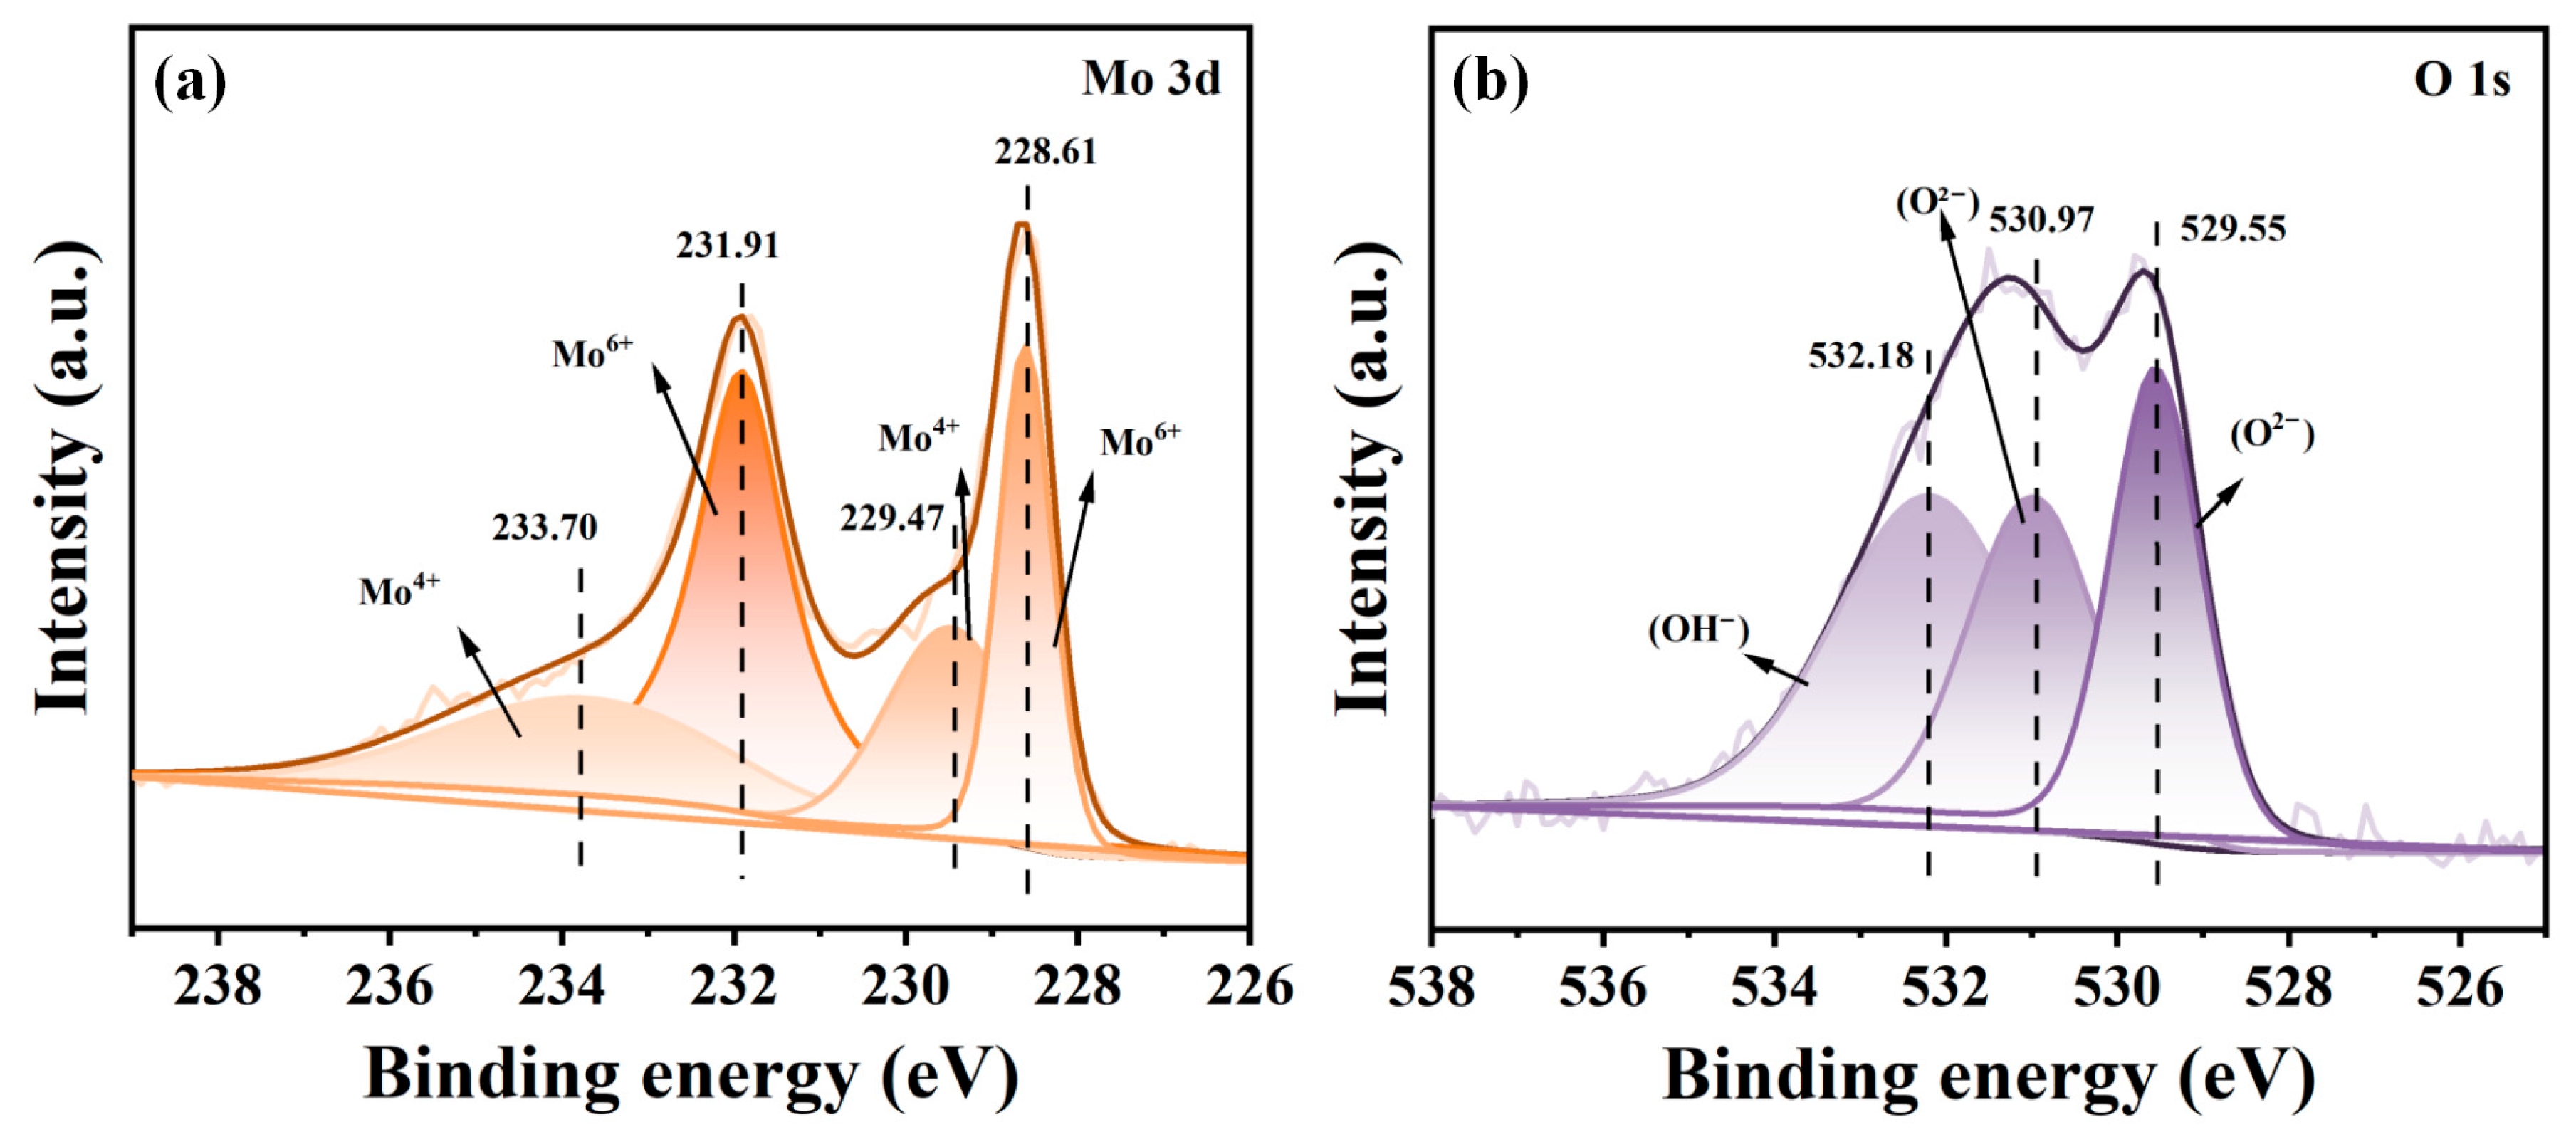
Figure 10a,b shows the friction coefficient (COF) of the coating under dry friction. In the initial stage of wear, due to the unevenness of the coating surface, the friction coefficient rises rapidly. As the wear process progresses, the contact area increases and the pressure decreases, gradually smoothing the coating surface, indicating that a certain degree of dynamic balance has been achieved between the coating and the mating part. The friction coefficient gradually stabilizes. This process is merely a transitional period of relatively stable surface state after a severe wear [30]. The friction coefficients of samples T2, T3, and T4 exhibit significant fluctuations after experiencing a stable period. This phenomenon is attributed to the fact that the wear debris generated continuously fails to be effectively discharged from the friction contact area. Hard wear debris embeds in the coating under the load to form “grains”, which accumulate at the edge of the contact area and hinder sliding, thereby increasing the friction resistance. The accumulated wear debris, under repeated friction loads, is compacted, flattened, and forms a relatively uniform and dense “third body” layer in the contact area [31]. The formation of the wear debris layer reduces the direct contact between the coating and the mating part. After a period of time, a uniform and well-adhered transfer film forms on the surface of the mating part, significantly reducing the friction coefficient. Figure 10c,d depicts the wear morphology and wear rates. T3 exhibits the shallowest wear tracks (Figure 10c), indicating superior wear resistance. The corresponding wear rates (Figure 8) are 5.56 × 10⁻⁶ (T1), 3.39 × 10⁻⁶ (T2), 1.99 × 10⁻⁶ (T3), and 5.47 × 10⁻⁶ mm3/N·m (T4). Wear resistance depends on the hardness–toughness balance: T1/T4’s low toughness promotes brittle fracture, generating abrasive particles that accelerate wear. Additionally, the (111) preferred orientation enhances wear resistance due to its densely packed atomic arrangement, enabling better load distribution and smoother surfaces during friction. This aligns with the findings of Raaif et al. [32] confirming the significantly improved wear/friction performance in TiN with face-centered cubic (111) orientation. To clarify the specific oxidation products formed during the friction experiment, X-ray photoelectron spectroscopy (XPS) was used to characterize the scratch area of the T3 sample (Figure 11). The Mo 3d spectrum (Figure 11a) shows that the binding energy peaks at approximately 228.6 eV and 231.9 eV belong to MoO3, while the peaks at approximately 229.5 eV and 233.7 eV correspond to MoO2 [33]. The study by Q. Yang [34] et al. demonstrated that the Ti-Mo-N coating undergoes a frictional oxidation reaction during the friction process, generating MoO3. This MoO3 is considered to have a lubricating effect due to its layered crystal structure. Importantly, the Ti-Mo-N coating substrate located beneath the scratch transfer layer during the friction process can continuously provide Mo elements to the friction interface, thereby compensating for the MoO3 lubricating phase consumed due to wear. The O 1s spectrum (Figure 11b) shows that the peaks at approximately 529.6 eV and 531.0 eV belong to O2− ions in the metal oxides. Among them, the peak at 529.6 eV corresponds to TiO2 [35], while the peak at 531.0 eV is consistent with the characteristic peak position of MoO3 [36]. The XPS results of this study clearly detected the presence of MoO3 and TiO2 and other oxidation products at the friction interface. Combined with the previously mentioned layered MoO3 provided by the frictional oxidation and maintained by the coating substrate through the continuous supply of Mo, this can reasonably explain the significant reduction in the friction coefficient of the Ti-Mo-N coating observed. This process demonstrates the inherent ability of the coating material to achieve a continuous lubrication effect during the friction process.
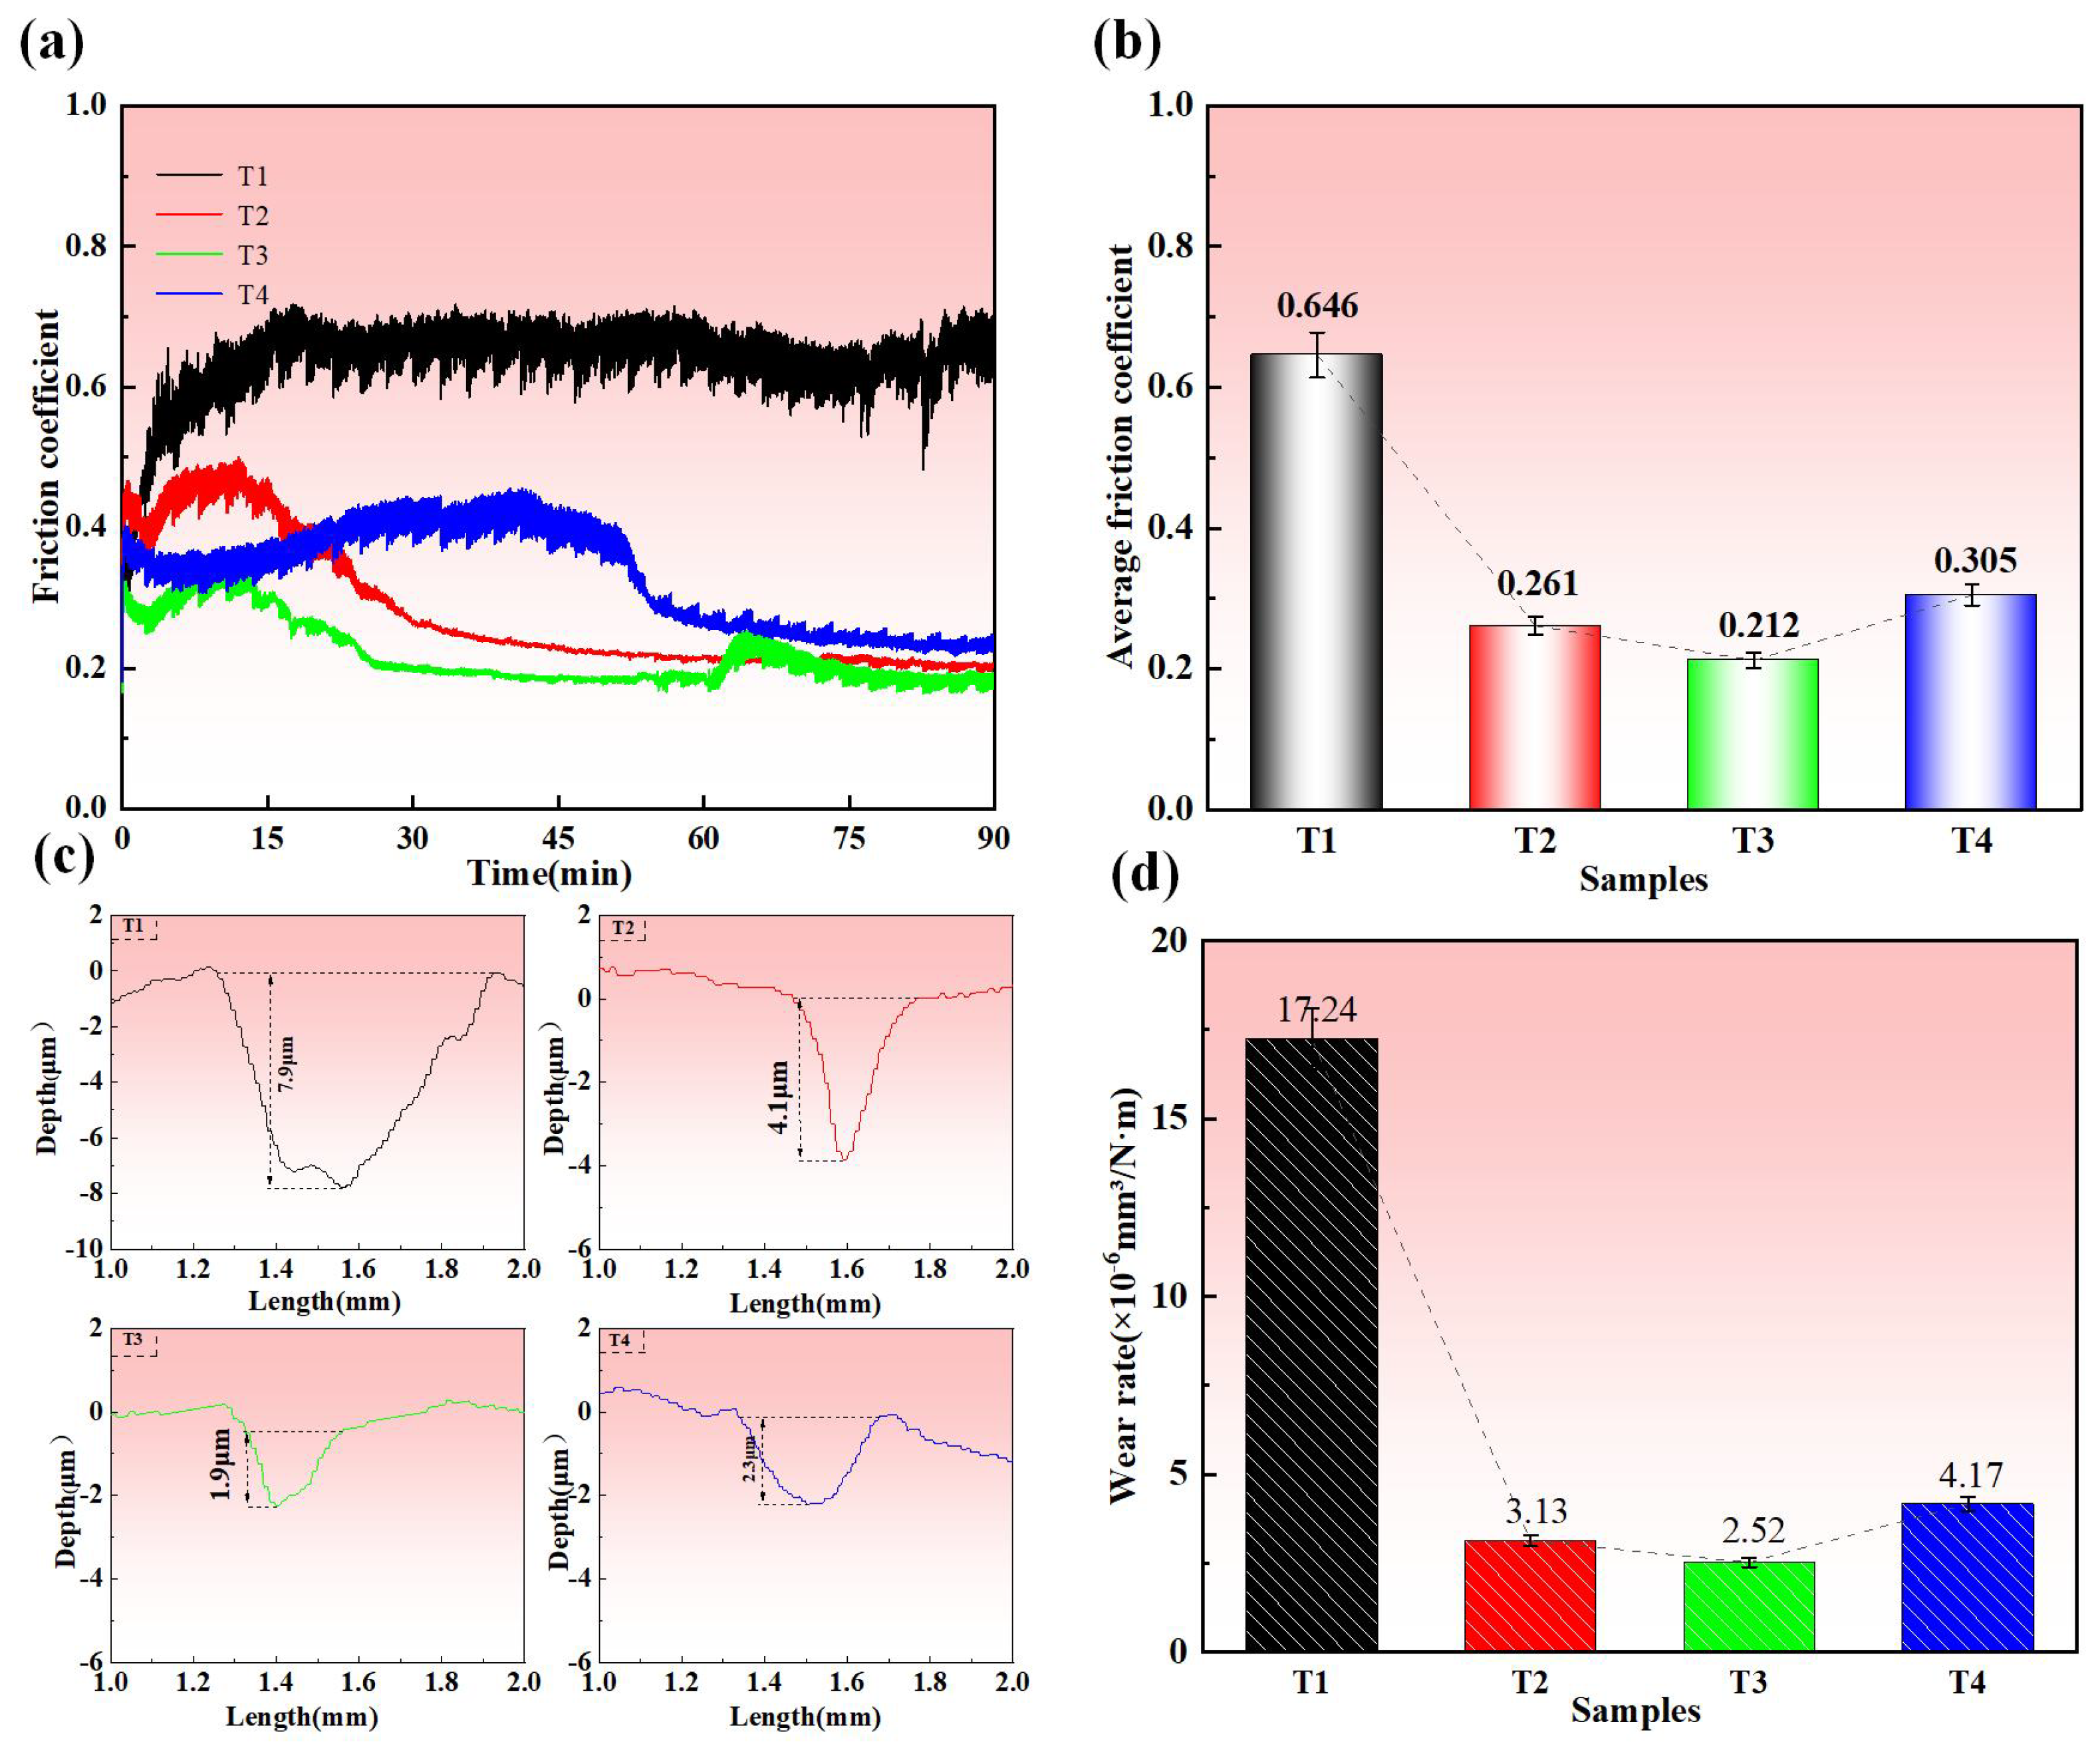
Figure 12 presents the wear track morphology and EDS analysis of coatings under water-lubricated conditions. T1 exhibits extensive substrate exposure due to its loose microstructure, enabling water infiltration that weakens the coating–substrate interfacial bonding. This facilitates adhesive wear through material transfer and abrasive wear via dislodged particles. For T2–T4, abrasive wear dominates with differential spalling severity: T4 shows the largest pits >T2 > T3 (smallest pits). Wear track widths follow T4 > T2 > T3. Figure 13a,b demonstrates significantly reduced COF for all coatings except T1 under water lubrication versus dry conditions, attributable to water’s cooling/flushing effects mitigating frictional heating and oxidation. The trend of COF is consistent with the results under dry friction conditions, fully demonstrating that the addition of Mo elements affects the intrinsic frictional properties of the coating. This influence is still manifested by changing the properties of the boundary lubrication film and the frictional chemical reaction products under water lubrication. In Figure 13c, the wear scar depth and width of all the samples are greater than those in the dry friction condition, and the wear rate is also higher. This is due to the influence of friction corrosion under water friction conditions. Crucially, the wear mechanisms fundamentally differ between conditions: dry friction combines abrasive and oxidative wear, while water lubrication involves synergistic water–film lubrication, corrosive wear, and oxide lubrication mechanisms.

3.5. Electrochemical Test

As shown in Figure 14a, when a voltage of −60 V and −150 V is applied, the Nyquist plot presents a single depressed semi-circular feature; by contrast, under the conditions of −90 V and −120 V, the Nyquist plot exhibits a dual-segment feature: the high-frequency region is a depressed semi-circle, and the low-frequency region shows a linear part at a 45° angle to the real axis. This spectral pattern evolution indicates that the kinetic control mechanism of the corrosion process may have shifted from charge transfer control to diffusion control. Among them, the 45° linear feature in the low-frequency region is the Warburg impedance, which characterizes the diffusion process. According to the research of Heakal et al. [37], the total resistance (Rt) of the system is inversely proportional to the corrosion rate, and an extended expression is proposed: Rt = Rct + Rw (where Rct is the charge transfer resistance and Rw is the resistance of reactant diffusion). This model, by incorporating the diffusion resistance (Rw), can achieve a more accurate assessment of the corrosion response. Therefore, by comparing the radius of the capacitive reactance arc (reflecting the size of Rct) in the Nyquist plot, the corrosion resistance of the coating can be qualitatively evaluated: the larger the radius of the capacitive reactance arc, the higher the Rct value and the more significant the obstruction of the charge transfer process, indicating stronger corrosion resistance [38]. The analysis results show that the −60 V coating has the smallest radius of the capacitive reactance arc (i.e., the lowest Rct value, the weakest corrosion resistance), while the −120 V coating exhibits the largest radius of the capacitive reactance arc (i.e., the highest Rct value, the best corrosion resistance). In the Bode modulus plots (Figure 14b), the low-frequency impedance magnitudes at 0.01 Hz are ~104 Ω·cm2 (−60 V, −150 V), ~105 Ω·cm2 (−90 V), and ~106 Ω·cm2 (−120 V), confirming superior barrier protection at −120 V through impeded charge/mass transport [39]. Phase angle plots (Figure 14c) further validate the enhanced interfacial barrier properties at −120 V via maximized low-frequency phase angles. To address the intrinsic defects in physical vapor deposition (PVD) coatings, the EIS data were fitted using two equivalent circuit models: R(Q(RW)) and R(Q(R(QR))) (Figure 14d), and the fitting results are shown in Table 3. In this configuration, Rs denotes the solution resistance; Rf and CPE represent the corrosion layer resistance and constant-phase element capacitance governing corrosive ion transport; Rct and CPEdl correspond to the charge-transfer resistance and capacitance at the coating–substrate interface; and w signifies the Warburg impedance. The CPEdl component quantifies the interfacial charge storage capacity, where lower values indicate effective barrier properties. Elevated CPEdl measurements at −60 V (135.2 F·cm−2) and −150 V (149.1 F·cm−2) correlate with corrosion morphology, confirming that defective regions permit electrolyte penetration to the substrate, accelerating corrosion and indicating compromised protection. Complementary to this, the Rct magnitudes (T1 < T4 < T2 < T3) directly validate coating quality, aligning with the Bode plot interpretations and confirming optimal corrosion resistance at −120 V. The progressive CPEdl reduction and Rct enhancement with increasing bias toward −120 V reflect diminished corrosion rates due to reduced through-film pinhole density [40]. These electrochemical responses consistently mirror the structural evolution of TiN coatings, corroborating established literature findings.
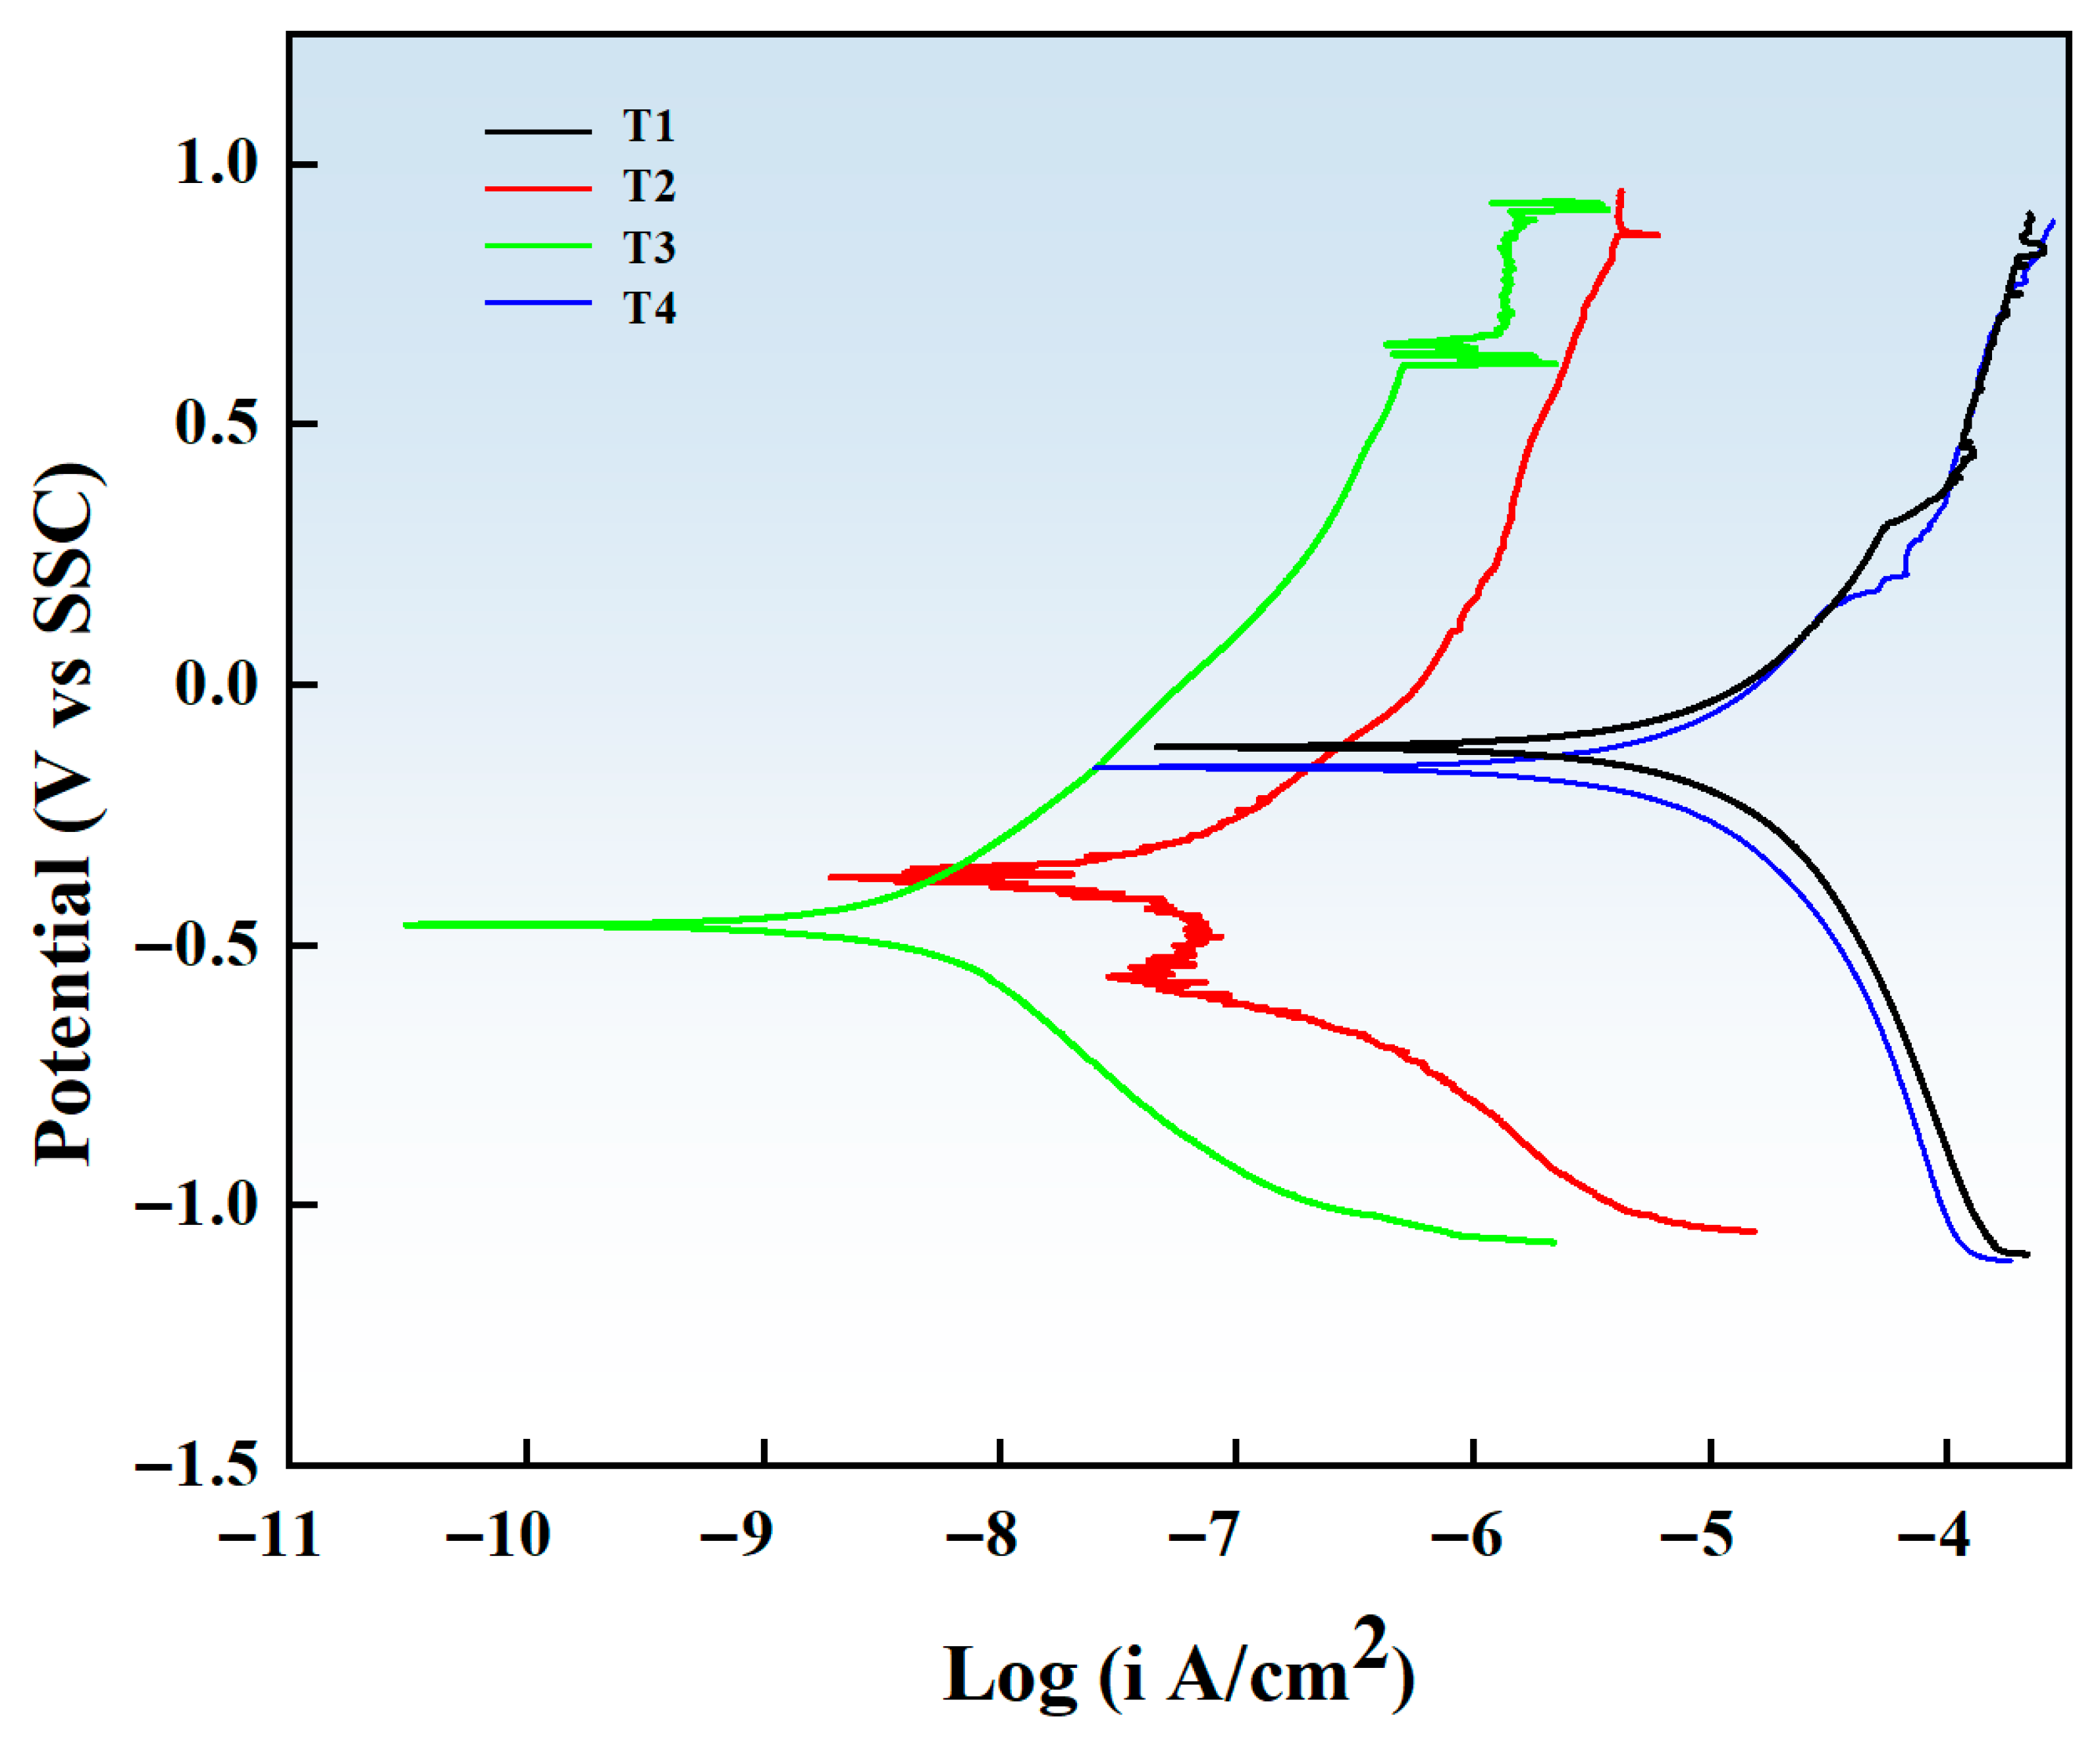
Figure 15 depicts the electrochemical corrosion behavior of Ti-Mo-N coatings deposited at varying substrate bias voltages in a 3.5 wt% NaCl solution. Polarization curves were analyzed using the Tafel extrapolation method to determine the corrosion potential and corrosion current density. The corresponding fitted data are presented in Table 4. The corrosion current densities of the Ti-Mo-N coatings at different bias voltages were as follows: 8.43 × 10⁻⁶ A/cm2 at −60 V, 3.97 × 10⁻⁸ A/cm2 at −90 V, 3.62 × 10⁻⁹ A/cm2 at −120 V, and 5.67 × 10⁻⁶ A/cm2 at −150 V. As the bias voltage increased, the corrosion current density of the Ti-Mo-N coatings first decreased and then increased. Notably, at −120 V bias voltage, the corrosion current density of the Ti-Mo-N coating was the lowest, at 3.62 × 10⁻⁹ A/cm2, which was three orders of magnitude lower than that at −60 V. It is generally accepted that an increased corrosion current density is indicative of a faster corrosion reaction rate per unit area. This is also associated with a higher metal corrosion rate and poorer corrosion resistance. Conversely, a smaller corrosion current density is associated with better corrosion resistance. Furthermore, corrosion initiation in materials typically occurs at surface defects such as pores and cracks [41]. An optimal substrate bias voltage promotes enhanced crystallinity and higher coating density, effectively hindering the ingress of corrosive electrolytes. This microstructural characteristic, evidenced by the dense cross-sectional morphology observed (implied), corresponds to the improved performance and further substantiates the superior corrosion resistance of the −120 V coating. However, excessively high substrate bias voltage can induce lattice defects and surface imperfections, detrimentally impacting corrosion resistance [42].
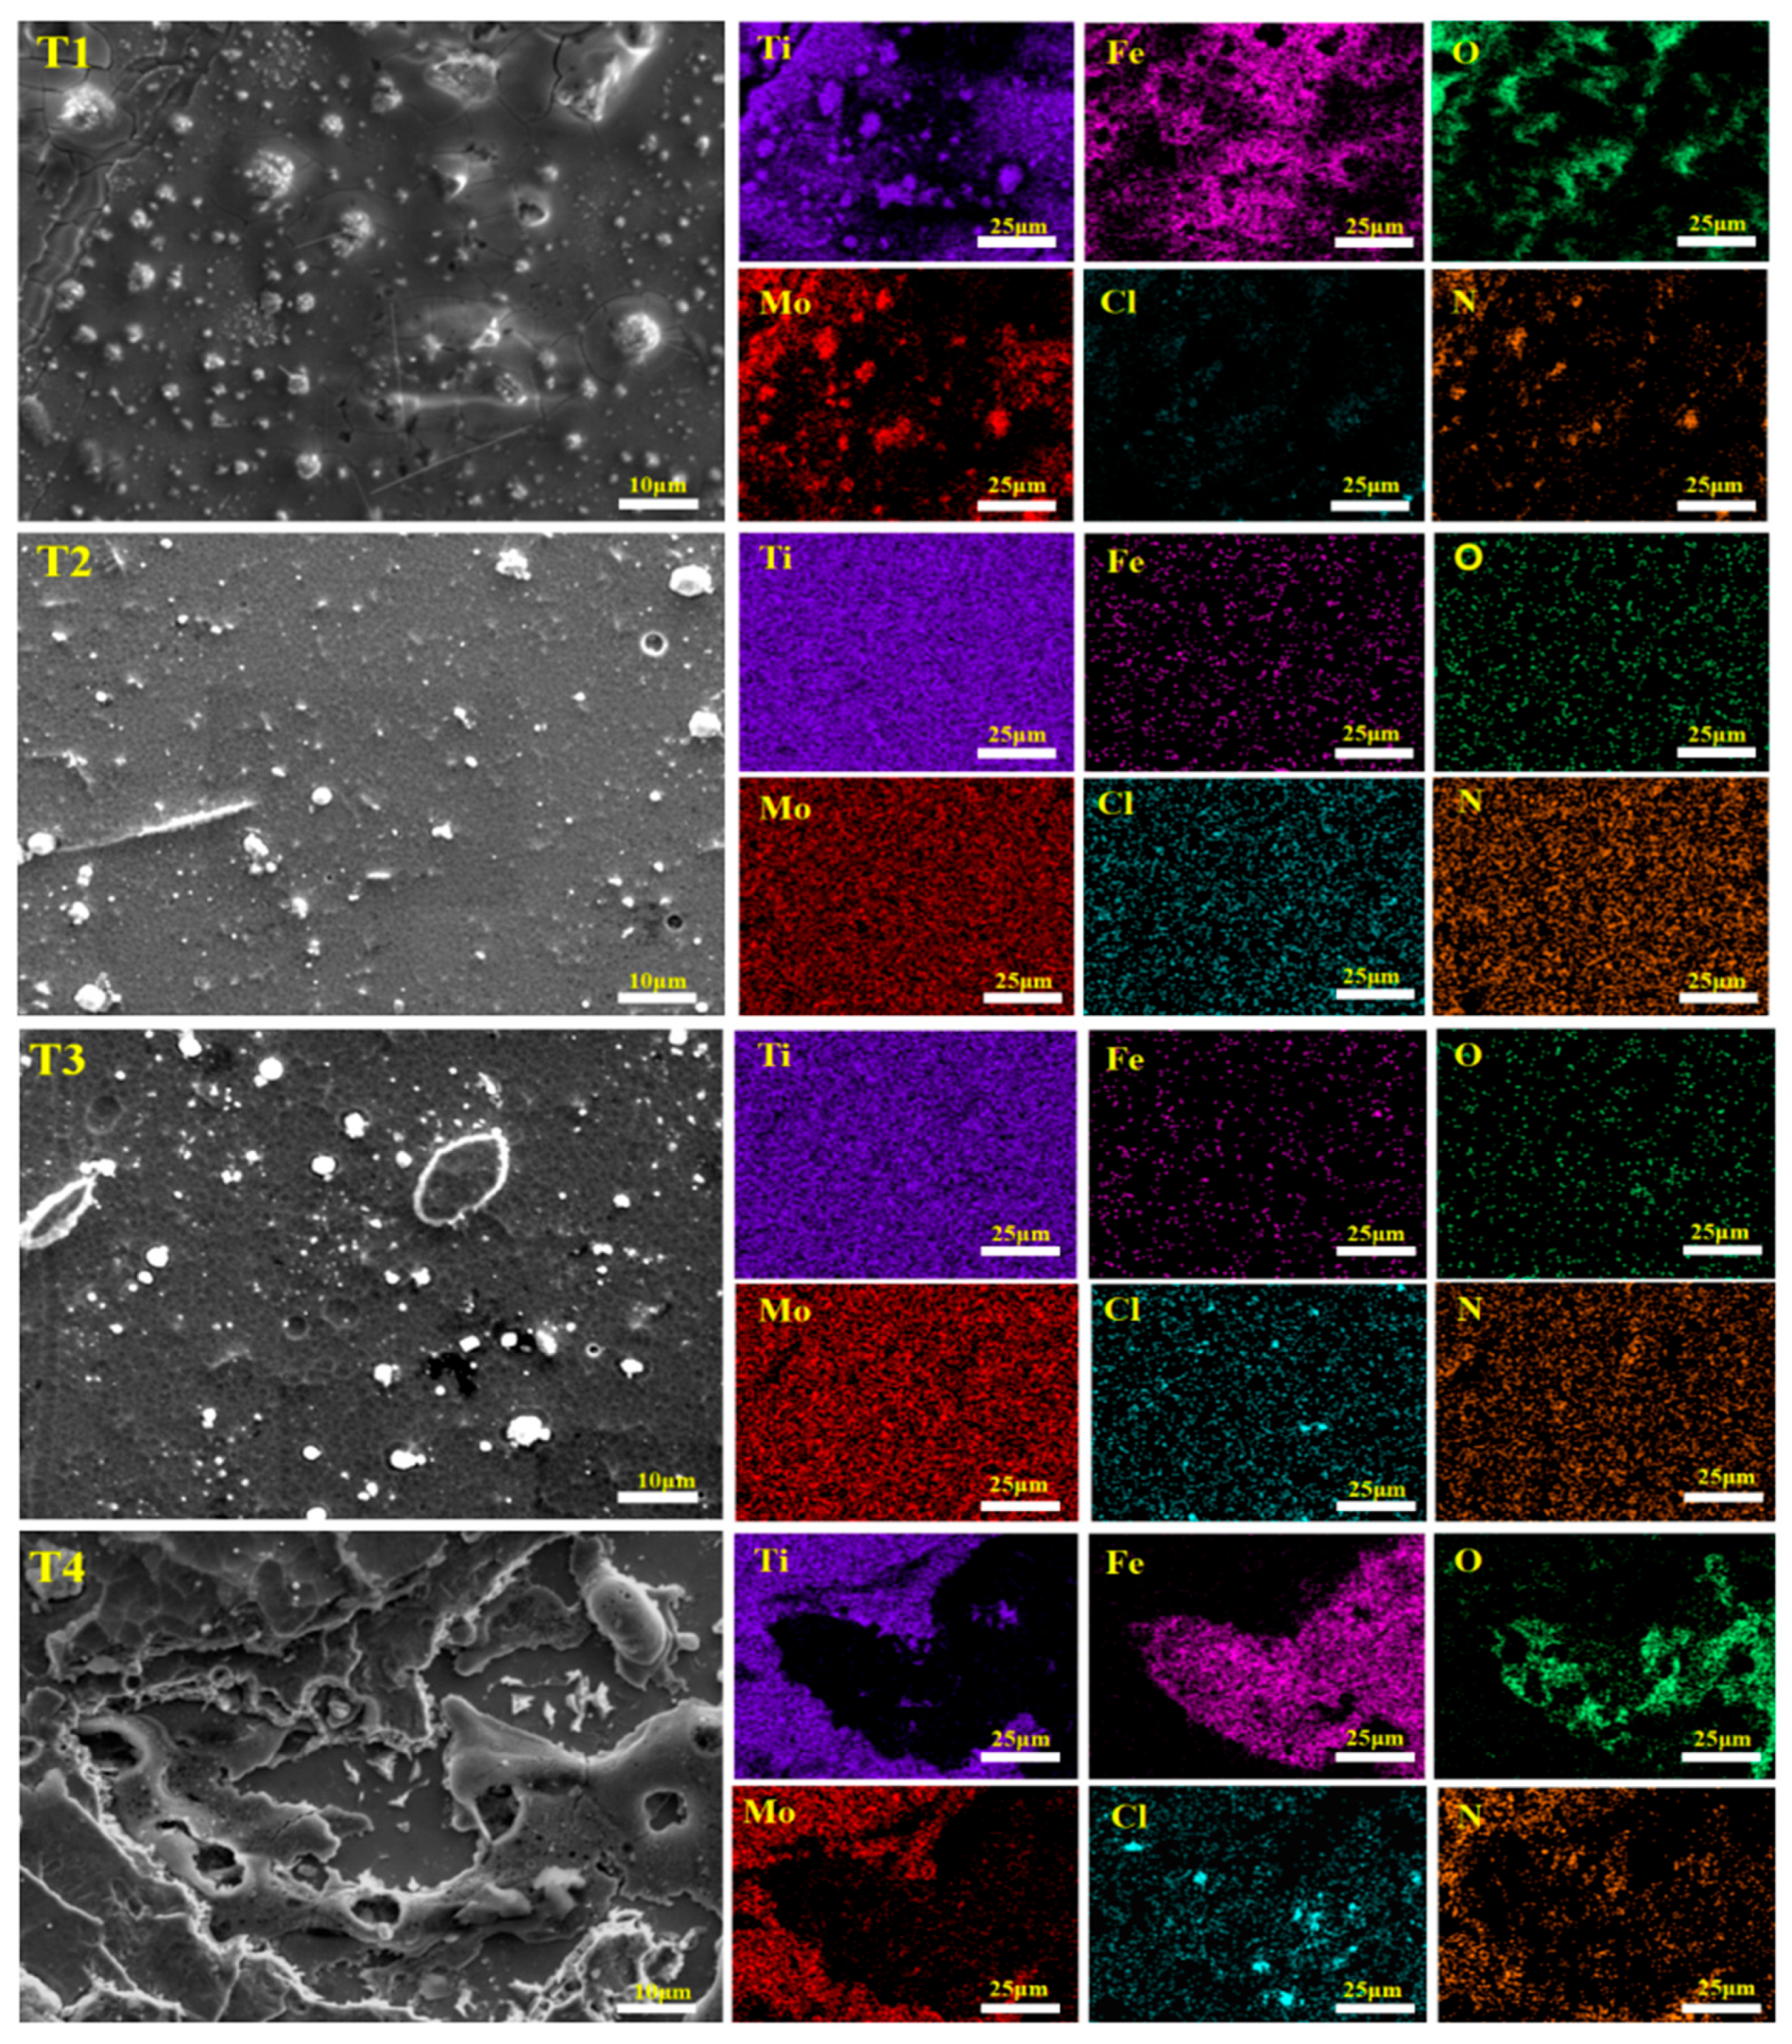
Figure 16 depicts the corrosion morphologies of Ti-Mo-N coatings under different bias voltages (−60 V, −90 V, −120 V, −150 V). The corrosion morphology can visually reflect the corrosion resistance of the coatings. The results demonstrate that at bias voltages of −90 V and −120 V, there are no conspicuous corrosion marks on the coating surface, indicating excellent corrosion resistance. This can be ascribed to the enhanced densification of the coating structure. Furthermore, a minute amount of Fe element enrichment is detected on the sample surface. This might be a result of the outward diffusion of Fe ions dissolved from the substrate through the micro-defect channels within the coating. This mass transfer process highlights the complexity of the corrosion process. For comparison, at a bias voltage of −60 V, numerous cracks and corrosion micropores are observed on the surface of the coating specimens. Intriguingly, the cracks appear to initiate from surface droplets, while the micropores are caused by the further expansion and intertwining of corrosion, and the original “pinholes” most likely also contribute to this process. This suggests that under low bias voltage conditions, the particle energy is relatively low, leading to an increase in micro-defects (especially droplets), which provides more pathways for the corrosive medium to penetrate. At a bias voltage of −150 V, the coating has been completely eroded, with corrosion delamination and a large number of erosive pits emerging, thereby exposing the substrate to the corrosive environment. This indicates that a further increase in the bias voltage will result in the degradation of the coating performance. This could be due to the combined effect of a loose coating structure and the accumulation of internal stress. On the one hand, the boundaries of columnar crystals can serve as invasion channels for Cl. On the other hand, internal stress can generate numerous lattice defects, and corrosion can cause stress relaxation, which accelerates the penetration of corrosion. These two factors further weaken the bonding strength at the coating/substrate interface, ultimately resulting in coating failure.

4. Conclusions

This study systematically investigated the effects of substrate bias voltage (ranging from −60 V to −150 V) on the microstructure, mechanical properties, tribological behavior and corrosion resistance of Ti-Mo-N coatings deposited on bearing steel using cathodic arc deposition technology. The following conclusions were drawn:
  • The deposition bias voltage is the core process parameter for regulating the microstructure and properties of the Ti-Mo-N coating. At a bias voltage of −120 V, the number of surface droplets is the least, the structure is the densest, and the (111) crystal plane has the strongest preferred orientation; deviations from this optimal value result in an increase in surface droplets and a decrease in density.
  • The hardness and fracture toughness of the coating increase significantly with the increase in bias voltage (from −60 V to −120 V), reaching a peak at −120 V, which is closely related to its densified microstructure and strong (111) texture.
  • The Ti-Mo-N coating prepared at −120 V bias voltage exhibits the best tribological performance, with the lowest friction coefficient (0.308) and the lowest wear rate (1.99 × 10⁻⁶ mm3/N·m). This excellent performance is attributed to the layered MoO3 lubricating phase formed during the friction process, and the coating substrate can continuously transport Mo elements to the friction interface to compensate for consumption, thereby dynamically maintaining an effective lubricating film, demonstrating a significant self-lubrication effect.
  • In terms of electrochemical corrosion behavior, the coating with −120 V bias voltage shows the lowest corrosion current density (3.62 × 10⁻⁹ A/cm2) and the best corrosion resistance. No obvious damage was observed in the corrosion morphology, indicating that it has good surface protection capability.
Compared to empirical bias adjustments, this approach overcomes inherent AIP limitations while providing new design principles for high-performance bearing steel protective coatings. Future research could develop along three primary directions: exploring deposition bias adaptation rules for different substrates and complex operating conditions; combining composition optimization (e.g., Ti/Mo ratio adjustment) with bias regulation to broaden coating performance balance; and applying in situ characterization to analyze the dynamic mechanisms of Mo migration and lubricant film formation. These investigations will advance the fundamental understanding of process–structure–property relationships and facilitate practical applications in high-performance wear- and corrosion-resistant equipment, demonstrating significant potential for development.

Author Contributions

Conceptualization, G.L.; methodology, C.W., J.L., and L.X.; investigation, C.W., J.L., L.X., and K.Z.; resources, G.L. and K.Z.; data curation, J.L., G.L., and K.Z.; writing—original draft preparation, C.W.; writing—review and editing, J.L. and G.L.; supervision, J.L., G.L., and K.Z.; project administration, G.L. All authors have read and agreed to the published version of the manuscript.

Funding

This work was financially supported by the Natural Science Basic Research Plan in Shaanxi Province of China (No. 2025JC-YBMS-473) and the Graduate Innovation Fund Project (No. YCX2513152).

Institutional Review Board Statement

Not applicable.

Informed Consent Statement

Not applicable.

Data Availability Statement

Data will be made available on request.

Conflicts of Interest

Authors Gang Liu and Liyuan Xue were employed by the company Xi’an Rare Metal Materials Institute Co., Ltd. The remaining authors declare that the research was conducted in the absence of any commercial or financial relationships that could be construed as a potential conflict of interest.

References

  1. Yu, F.; Chen, X.; Xu, H.; Dong, H.; Weng, Y.; Cao, W. Current Situation of Metallurgical Quality and Fatigue Properties of Rolling Bearing Steel and the Development Direction of High-end Bearing Steel. Acta Metall. Sin. 2020, 56, 513–522. [Google Scholar]
  2. Hu, X.; Wang, L.; Li, F.; Zhang, H.; Zheng, Z. Analysis of Failure Causes and Optimization Measures of Main Drive Bearings of Loaders. Constr. Mach. 2025, 56, 187–190+114. [Google Scholar]
  3. Wei, A.; Ma, G.; Li, G.; Yong, Q.; Guo, W.; Zhao, H.; Huang, Y.; Han, C.; Wang, H. Current Situation and Prospect of Research Methods on Wear Life of Self-lubricating Spherical Plain Bearings. Surf. Technol. 2023, 52, 31–46. [Google Scholar]
  4. Zhang, Y.; Feng, S.; Qi, Y.; Zhu, J. The Main Failure Modes of the Main Bearings of Aero Engines. Mech. Manag. Dev. 2024, 39, 268–270. [Google Scholar]
  5. Ma, B.; Fu, L.; Bao, S.; Du, S.; Yue, Y.; Zhang, Y. Research on Microstructure and Friction and Wear Propertiesof GCr15 and G20CrNi2Mo Bearing Steels. Mater. Rev. 2021, 35, 16120–16125. [Google Scholar]
  6. Ebrahimzadeh, P.; Peral, L.B.; González-Martínez, R.; Mardaras, E.; Fernández-Pariente, I. Influence of Severe Surface Plastic Deformation Induced by Shot Peening on Microstructure and Corrosion Resistance of fine grained 316 L stainless steel. Corros. Sci. 2024, 231, 111988. [Google Scholar] [CrossRef]
  7. Hoche, H.; Pusch, C.; Oechsner, M. Corrosion and wear protection of mild steel substrates by innovative PVD coatings. Surf. Coat. Technol. 2020, 391, 125659. [Google Scholar] [CrossRef]
  8. Wen, X.; Cui, X.; Jin, G.; Liu, Y.; Zhang, Y.; Zhang, X.; Liu, E.; Tian, H.; Fang, Y. Corrosion and tribo-corrosion behaviors of nano-lamellar Ni1.5CrCoFe0.5Mo0.1Nbx eutectic high-entropy alloy coatings: The role of dual-phase microstructure. Corros. Sci. 2022, 201, 110305. [Google Scholar] [CrossRef]
  9. Bisht, A.K.; Vaishya, R.O.; Walia, R.; Singh, G. Nitrides ceramic coatings for tribological applications: A journey from binary to high-entropy compositions. Ceram. Int. 2024, 50, 8553–8585. [Google Scholar] [CrossRef]
  10. Deng, Y.; Chen, W.; Li, B.; Wang, C.; Kuang, T.; Li, Y. Physical vapor deposition technology for coated cutting tools: A review. Ceram. Int. 2020, 46, 18373–18390. [Google Scholar] [CrossRef]
  11. Movassagh-Alanagh, F.; Abdollah-Zadeh, A.; Aghababaei, R. Effects of B and C elements on microstructure, mechanical and tribological properties of TiN coating deposited by PACVD. Mater. Charact. 2025, 225, 115178. [Google Scholar] [CrossRef]
  12. Wang, X. Research on the Microstructure and Properties of Ti-Mo-N Nanostructured Composite Films. Bachelor’s Thesis, Jiangsu University Of Science And Technology, Zhenjiang, China, July 2011. [Google Scholar]
  13. Zhou, S.; Zhao, W.; Qiu, Z.; Lin, S.; Zheng, Z.; Zeng, D. Improved load-bearing capacity of Mo-doped Ti-N coatings: Effects of Mo alloying and GB plasticity. Surf. Coat. Technol. 2021, 424, 127630. [Google Scholar] [CrossRef]
  14. Moussaoui, A.; Abboudi, A.; Aissani, L.; Belgroune, A.; Cheriet, A.; Alhussein, A.; Rtimi, S. Effect of Mo addition on the mechanical and tribological properties of magnetron sputtered TiN films. Surf. Coat. Technol. 2023, 470, 129862. [Google Scholar] [CrossRef]
  15. Othman, M.F.; Bushroa, A.R.; Abdullah, W.N.R. Evaluation techniques and improvements of adhesion strength for TiN coating in tool applications: A review. J. Adhes. Sci. Technol. 2015, 29, 569–591. [Google Scholar] [CrossRef]
  16. Santecchia, E.; Hamouda, A.; Musharavati, F.; Zalnezhad, E.; Cabibbo, M.; Spigarelli, S. Wear resistance investigation of titanium nitride-based coatings. Ceram. Int. 2015, 41, 10349–10379. [Google Scholar] [CrossRef]
  17. Zuo, J.; Xie, Y.; Zhang, J.; Wei, Q.; Zhou, B.; Luo, J.; Wang, Y.; Yu, Z.; Tang, Z. TiN coated stainless steel bracket: Tribological, corrosion resistance, biocompatibility and mechanical performance. Surf. Coat. Technol. 2015, 277, 227–233. [Google Scholar] [CrossRef]
  18. Olbrich, W.; Fessmann, J.; Kampschulte, G.; Ebberink, J. Improved control of TiN coating properties using cathodic arc evaporation with a pulsed bias. Surf. Coat. Technol. 1991, 49, 258–262. [Google Scholar] [CrossRef]
  19. Bozyaz, E.; Rgen, M.; Akr, A.F. Comparison of reciprocating wear behaviour of electrolytic hard chrome and arc-PVD CrN coatings. Wear 2004, 256, 832–839. [Google Scholar] [CrossRef]
  20. He, C.; Zhang, J.; Wang, J.; Ma, G.; Zhao, D.; Cai, Q. Effect of structural defects on corrosion initiation of TiN nanocrystalline films. Appl. Surf. Sci. 2013, 276, 667–671. [Google Scholar] [CrossRef]
  21. Zhang, M.; Hu, X.-G.; Yang, X.-X.; Xu, F.-F.; Kim, K.-H.; Shao, Z.-G. Influence of substrate bias on microstructure and morphology of ZrN thin films deposited by arc ion plating. Trans. Nonferrous Met. Soc. China 2012, 22 (Suppl. S1), s115–s119. [Google Scholar] [CrossRef]
  22. Qi, Z.B.; Zhu, F.P.; Wang, Z.C.; Peng, C.; Wu, D.L. The inverse Hall–Petch effect in nanocrystalline ZrN coatings. Surf. Coat. Technol. 2011, 205, 3692–3697. [Google Scholar] [CrossRef]
  23. Xue, L.; Hu, X.; Xi, Y.; Qiu, L.; Pan, X.; Zhang, Y. Effect of N2 partial pressure on ZrN coating orientation and tribocorrosion behavior and mechanism. Ceram. Int. 2024, 50, 24847–24863. [Google Scholar] [CrossRef]
  24. Liu, A.; Deng, J.; Cui, H.; Chen, Y.; Zhao, J. Friction and wear properties of TiN, TiAlN, AlTiN and CrAlN PVD nitride coatings. Int. J. Refract. Met. Hard Mater. 2012, 31, 82–88. [Google Scholar]
  25. Wang, L.; Jin, Y.; Lin, X.; Chen, C. Effects of Substrate Bias Duty Cycle on Morphology and Mechanical Properties of TiAlSiN Coatings Prepared by Multi-Arc Ion Plating. Surf. Technol. 2017, 46, 237–240. [Google Scholar]
  26. Du, J.; Tao, G.; Chen, H.; Yi, J.; Wan, H.; Liu, S.; Zhang, Y. The Influence of Bias Voltage on the Structure and Properties of TiAlSiN Coating Prepared by HiPIMS. Mater. Prot. 2024, 57, 30–42. [Google Scholar]
  27. Gu, W.; Li, S.; Wang, H.; Chen, C.; Li, P.; Huang, F. The influence of substrate bias voltage on the structure and properties of TiB2 coating prepared by magnetron sputtering. J. Aeronaut. Mater. 2014, 34, 37–42. [Google Scholar]
  28. Li, Z.; Munroe, P.; Jiang, Z.; Zhao, X.; Xu, J.; Zhou, Z.; Jiang, J.; Fang, F.; Xie, Z. Designing superhard, self-toughening CrAlN coatings through grain boundary engineering. Acta Mater. 2012, 60, 5735–5744. [Google Scholar] [CrossRef]
  29. Chou, W.J.; Yu, G.P.; Huang, J.H. Mechanical properties of TiN thin film coatings on 304 stainless steel substrates. Surf. Coat. Technol. 2002, 149, 7–13. [Google Scholar] [CrossRef]
  30. Yuan, S.; Wang, S.; Fang, L.; Zhang, Y.; Li, X.; Zhou, Z. Influence of Microhardness and Wear Resistance of CrAlN Coating Deposited by Multi-Arc Ion Plating on the Surface of H13 Steel. Equip. Environ. Eng. 2023, 20, 115–120. [Google Scholar]
  31. Fillot, N.; Iordanoff, I.; Berthier, Y. Modelling third body flows with a Discrete Element Method a tool for understanding wear with adhesive particles. Tribol. Int. 2007, 40, 973–981. [Google Scholar] [CrossRef]
  32. Raaif, M. Investigating the structure and tribo-mechanical performance of PVD TiN on bearing TiN substrate constructed by rf plasma. Mater. Chem. Phys. 2019, 224, 117–123. [Google Scholar] [CrossRef]
  33. Wang, T.; Zhang, G.; Jiang, B. Comparison in mechanical and tribological properties of CrTiAlMoN and CrTiAlN nano-multilayer coatings deposited by magnetron sputtering. Appl. Surf. Sci. 2016, 363, 217–224. [Google Scholar] [CrossRef]
  34. Yang, Q.; Zhao, L.; Patnaik, P.; Zeng, X. Wear Resistant TiMoN Coatings Deposited by Magnetron Sputtering. Wear 2006, 261, 119–125. [Google Scholar] [CrossRef]
  35. Chen, X.; Lin, Z.; Xiao, K.; Han, Y.; Ding, W.; Li, T.; Yuan, F.; Fang, S.; Liang, Z.; Zhang, L. Superior wear performance of titanium alloys from TiN coatings and ultrafine-grained gradient structures. Surface and Coatings Technology. Surf. Coat. Technol. 2025, 513, 132514. [Google Scholar] [CrossRef]
  36. Jiang, S.; Che, X.; Huang, J.; Huang, D. High temperature oxidation behavior of Mo-Zr alloys in pure oxygen condition. Int. J. Refract. Met. Hard Mater. 2024, 124, 106820. [Google Scholar] [CrossRef]
  37. Liu, C.; Park, S.; Nagao, S.; Nogi, M.; Koga, H.; Ma, J.-S.; Zhang, G.; Suganuma, K. The role of Zn precipitates and Cl anions in pitting corrosion of Sn–Zn solder alloys. Corros. Sci. 2015, 92, 263–271. [Google Scholar] [CrossRef]
  38. Guan, X.; Wang, Y.; Zhang, G.; Jiang, X.; Wang, L.; Xue, Q. Microstructures and properties of Zr/CrN multilayer coatings fabricated by multi-arc ion plating. Tribol. Int. 2016, 106, 78–87. [Google Scholar] [CrossRef]
  39. Xie, H.; Zhang, L.; Zhang, X.; Han, Y. A Hierarchically Structured Coating on 2a12-T4 Aluminum Alloy for Anti-Wear and Corrosion. SSRN Electron. J. 2022, 207, 110598. [Google Scholar]
  40. He, C.-L.; Zhang, J.-L.; Ma, G.-F.; Du, Z.-F.; Wang, J.-M.; Zhao, D.-L. Influence of bias voltage on structure, mechanical and corrosion properties of reactively sputtered nanocrystalline TiN films. J. Iron Steel Res. 2017, 24, 1223–1230. [Google Scholar] [CrossRef]
  41. Li, J.; Lin, X.; Wang, J.; Zheng, M.; Guo, P.; Zhang, Y.; Ren, Y.; Liu, J.; Huang, W. Effect of stress-relief annealing on anodic dissolution behaviour of additive manufactured Ti-6Al-4V via laser solid forming. Corros. Sci. 2019, 153, 314–326. [Google Scholar] [CrossRef]
  42. Qin, Q.; Fu, Z.; Wang, Z. The influence of matrix bias pressure on the surface TiAlCrN film structure and properties of H13 steel. Electroplat. Precis. Finish. 2023, 45, 19–25. [Google Scholar]
Figure 1. The composite multi-functional coating machine used in this experiment [23].
Coatings 15 00956 g001
Figure 2. Schematic diagram of friction and wear principle.
Coatings 15 00956 g002
Figure 3. Surface and cross-sectional morphology of the deposited coating: T1, T2, T3, T4.
Coatings 15 00956 g003
Figure 4. Surface roughness of deposited coatings: T1, T2, T3, T4.
Coatings 15 00956 g004
Figure 5. XRD patterns of T1, T2, T3, and T4 coatings in the deposition state.
Coatings 15 00956 g005
Figure 6. Grain size and texture coefficient of the (111) crystal plane of the deposited coating.
Coatings 15 00956 g006
Figure 7. Vickers hardness of coatings in the deposited state.
Coatings 15 00956 g007
Figure 8. SEM morphology of the Vickers indentation morphology: T1, T2, T3, T4.
Coatings 15 00956 g008
Figure 9. SEM morphology, element distribution, and two-dimensional profile of the wear marks on the coating surface under dry friction conditions.
Coatings 15 00956 g009
Figure 10. Friction coefficient diagram of Ti-Mo-N coating under dry friction conditions (a). Average friction coefficient diagram (b). Wear profile diagram (c). Average wear rate diagram (d).
Coatings 15 00956 g010
Figure 11. (a) XPS characterization of the wear scar area of the Mo element in sample T3. (b) XPS characterization of the wear scar area of the O element in sample.
Coatings 15 00956 g011
Figure 12. SEM morphology, element distribution, and two-dimensional profile of the wear marks on the coating surface under water friction conditions.
Coatings 15 00956 g012
Figure 13. Friction coefficient diagram of Ti-Mo-N coating under water friction conditions (a). Average friction coefficient diagram (b). Wear profile diagram (c). Average wear rate diagram (d).
Coatings 15 00956 g013
Figure 14. Nyquist diagram (a) of Ti-Mo-N coating in 3.5% NaCl solution, Bode phase Angle diagram (b), Bode impedance amplitude diagram (c), and equivalent circuit model (d).
Coatings 15 00956 g014
Figure 15. Dynamic potential polarization curve of Ti-Mo-N coating in 3.5% NaCl solution.
Coatings 15 00956 g015
Figure 16. Corrosion morphology diagram of Ti-Mo-N coating.
Coatings 15 00956 g016
Table 1. Fabrication parameters of coating.
ParameterAdhesion LayerIntermediate LayerT1T2T3T4
N2/Ar Flow [ccm]0/1500400/800400/800400/800400/800400/800
Bias Voltage [V]1001006090120150
Deposition Time [min]1515120120120120
Target Current [A]130130100100100100
TargetsTiTiTi/TiMoTi/TiMoTi/TiMoTi/TiMo
Temperature [℃]300300300300300300
Rotation Speed [rpm]222222
Table 2. The EDS compositions of samples T1 to T4 with the alteration of the bias voltage.
SampleTi/MoElement Composition (at. %)
TiMoN
T17.0553.917.6538.44
T28.3853.446.3838.19
T36.9954.117.7438.15
T47.5754.637.2238.15
Table 3. The fitted results of the EIS spectra for the as-prepared coating in 3.5% NaCl solution.
SampleRs (Ω)CPE (F·cm−2)nRct (Ω)WRf (Ω)CPEdl (F·cm−2)nd
60 V15.2326.630.4978.7 × 103135.20.742
90 V271.41.580.5203.4 × 1053.6 × 10−6
120 V622.21.450.6024.6 × 1051.9 × 10−5
150 V70.990.520.8169.3 × 103149.10.837
Table 4. The polarization curve fitting of the prepared coating in 3.5% NaCl solution.
SpecimensEcorr/VIcorr/(A/cm2)
T1−0.178.43 × 10−6
T2−0.393.97 × 10−8
T3−0.443.62 × 10−9
T4−0.185.67 × 10−6
Disclaimer/Publisher’s Note: The statements, opinions and data contained in all publications are solely those of the individual author(s) and contributor(s) and not of MDPI and/or the editor(s). MDPI and/or the editor(s) disclaim responsibility for any injury to people or property resulting from any ideas, methods, instructions or products referred to in the content.