Article

The Synergistic Influence of Trace Impurities and Temperature on the Corrosion Behavior of Tubing in Supercritical CO2 Environment

1
R&D Center for Ultra Deep Complex Reservior Exploration and Development, CNPC, Korla 841000, China
2
Engineering Research Center for Ultra-Deep Complex Reservoir Exploration and Development, Xinjiang Uygur Autonomous Region, Korla 841000, China
3
Xinjiang Key Laboratory of Ultra-Deep Oil and Gas, Korla 841000, China
4
Oil and Gas Technology Research Institute of Petrochina Tarim Oilfield Branch, Korla 841000, China
5
State Key Laboratory for Performance and Structure Safety of Petroleum Tubular Goods and Equipment Materials, CNPC Tubular Goods Research Institute, Xi’an 710077, China
*
Author to whom correspondence should be addressed.
Coatings 2025, 15(8), 944; https://doi.org/10.3390/coatings15080944
Submission received: 25 June 2025 / Revised: 11 July 2025 / Accepted: 21 July 2025 / Published: 13 August 2025
(This article belongs to the Section Corrosion, Wear and Erosion)

Abstract

Carbon dioxide capture, utilization, and storage for enhanced oil recovery (CCUS-EOR) represents an effective strategy for reducing CO2 emissions while improving oil recovery efficiency. However, harsh environmental conditions during the process can induce a supercritical state in captured CO2, which may undermine the structural integrity of tubular components through corrosion. This study systematically investigated the corrosion behaviors of two tubing steels (P110 and Super 13Cr) in 20 MPa supercritical CO2 containing trace H2S/O2 impurities at 60–120 °C using weight loss tests and surface analysis. The results demonstrate that in water-unsaturated supercritical CO2 with ≤500 ppmv H2S, both steels exhibited low general corrosion rates (P110: 0.03 mm/y; S13Cr: 0.01 mm/y), with incomplete surface films partially covering grinding traces. However, S13Cr suffered pitting corrosion at >500 ppmv H2S. Oxygen introduction triggered severe general/localized corrosion characterized by cracked, non-protective surface films. Reducing O2 to 500 ppm yielded thin, continuous protective films, eliminating pitting. Temperature critically influenced S13Cr corrosion: decreasing from 120 °C to 60 °C increased the corrosion rates from 0.0031 mm/y to 0.08 mm/y due to enhanced water precipitation and impurity gas dissolution. These findings establish impurity thresholds to ensure acceptable corrosion performance.

1. Introduction

Carbon neutrality has garnered significant global attention since the 2015 Paris Agreement [1]. Carbon dioxide (CO2) capture, utilization, and storage (CCUS) are widely recognized as effective emission-reduction strategies crucial for mitigating global warming. Injecting CO2 into geological formations is a common storage method [2], enabling permanent emission reduction via integration into production processes for carbon recycling. For instance, CO2 injection enhances fluid properties, reduces interfacial tension, optimizes oil flow, and improves sweep efficiency in reservoirs, thereby promoting oil recovery through miscible displacement (i.e., CCUS for Enhanced Oil Recovery, CCUS-EOR) [2,3,4]. CCUS-EOR delivers dual environmental and economic benefits, driving its widespread application.
Cost minimization in CCUS-EOR necessitates compression of captured CO2 to a supercritical state (temperature > 31.1 °C, pressure > 7.38 MPa) [5] to avoid biphasic flow and enhance efficiency. However, supercritical CO2 becomes highly corrosive upon aqueous contact [6,7], threatening infrastructure integrity. Although pure supercritical CO2 exhibits high water solubility (yielding ~1 μm/y corrosion rates when water is fully dissolved [8]), trace impurities (at the ppm level), such as hydrogen sulfide (H2S), oxygen (O2), nitrogen dioxide (NO2), and sulfur dioxide (SO2), accelerate corrosion by altering corrosion product solubility. Morland et al. [9] hypothesized that minimal water may form surface films where dissolved impurities generate acids, though their work focused on NO2 in gaseous CO2 [9,10]. Extensive studies address O2/NO2/SO2 impacts on carbon steel corrosion in wet supercritical CO2 [11], particularly pipeline steels [12,13,14], as such impurities originate from capture sources. In contrast, H2S predominantly exists as a downhole-associated gas in high-sulfur oilfields, primarily influencing injection processes [15]. Crucially, H2S corrosion research on tubing steels remains scarce for supercritical CO2 environments. Sun et al. [16] noted that N80 tubing steel suffers severe corrosion (>4 mm/y) in supercritical CO2, exacerbated by trace H2S due to degraded film protectiveness. Oxygen introduction during injection further complicates corrosion mechanisms [17]. Although both H2S and O2 are present in downhole CCUS-EOR environments, their combined effects on corrosion in supercritical CO2 have not been systematically studied, particularly regarding how their interaction modifies the corrosion mechanisms of tubing steels.
In addition to water contents and trace impurities, temperature critically influences corrosion by modulating water solubility in supercritical CO2. Xiang et al. [18] observed that X70 steel corrosion rates in high-pressure (10 MPa) CO2 systems containing SO2, O2, and H2O peaked at 348 K (75 °C) before declining at 366 K (93 °C), which was attributed to changes in corrosion products. At 366 K, the formation of dense, spherical corrosion products offered enhanced protection to the steel surface. Hua et al. [19] demonstrated that temperature reduction in water-unsaturated systems enhances corrosion, with localized attack being particularly critical. However, the publications above primarily focused on pipeline steels. Other existing studies focus exclusively on pipeline steels, leaving temperature-modulated corrosion of tubing steels in supercritical CO2 with H2S/O2 impurities entirely uninvestigated.
This study aims to investigate the combined effects of trace impurities and temperature on the corrosion behavior of tubing steels in supercritical CO2 environments containing H2S and O2. The corrosion performance of two commonly used tubing steels, P110 and Super 13Cr (S13Cr), was evaluated under supercritical CO2 conditions with varying H2S concentrations (10–1400 ppm) and O2 levels (10–13,000 ppm) across a temperature range of 60 °C to 120 °C. The effects of H2S, O2, and temperature on corrosion rates, surface morphology, and corrosion product characteristics were assessed using weight-loss measurements and surface analysis techniques. The findings are expected to inform the development of operational thresholds for impurity levels and temperature conditions that ensure acceptable corrosion resistance in tubing steels.

2. Materials and Methods

2.1. Materials and Sample Preparation

Commercial P110 and S13Cr tubing steels were machined into specimens for corrosion tests, with dimensions of 50 mm × 10 mm × 3 mm. Figure 1 shows their tempered lath martensite microstructure before testing.
Weight loss tests were conducted in a 10 L Cortest-C276 autoclave to evaluate the corrosion rate and corrosion morphology of P110 and S13Cr steel in a supercritical CO2 with trace impurities, and the schematic diagram is displayed in Figure 2. For each material type, three specimens were analyzed in parallel to ensure reproducibility of the experimental results. The specimens used for the corrosion test were polished with SiC paper of 240, 400, 800, and 1200 grit and then cleaned with deionized water and alcohol, sequentially. The experimental solution consisted of deionized water, which was fully deaerated using 99.999% CO2 for 3 h prior to being transferred to the autoclave. It is also worth noting that most previous studies have primarily focused on water-saturated supercritical CO2 systems. In contrast, in practical industrial applications, the EOR projects in the United States permit up to 600 ppm (mole fraction) of water [20]; the DYNAMIS project (EU’s 6th Framework Programme) allows for 500 ppm of water; and the EOR projects in Canada require nearly complete water removal (20 ppm). Therefore, establishing stringent impurity-level specifications is more critical to support EOR projects with significant cost reductions. As such, all the lines connected to the autoclave were thoroughly purged with CO2 to ensure the complete elimination of O2 from the system. The required CO2/H2S/O2 mixture was introduced into the autoclave, which was then heated and pressurized to the target conditions. The concentrations of trace impurity gases were precisely controlled using a gas flow controller with a resolution of 0.01 sccm (standard cubic centimeters per minute), as shown in Figure 2, ensuring accurate quantification of individual impurity levels in the gas mixture prior to the experiment. After immersion testing, the corrosion products were removed using a cleaning solution (3.5% methenamine in 10% HCl). The sample was then cleaned, dried, and weighed to calculate the weight loss and corrosion rate using the following equation [14,21].
V C R = 8.76 × 10 4 W S ρ t
where VCR is the corrosion rate, mm/a; W is the weight loss, g; S is the exposed surface area of specimen, cm2; ρ is the density specimen, g/cm3; t is the immersion time, h; and 8.76 × 10 4 is the unit conversion constant.
As for the pitting rate, it was determined based on the depth of the deepest pit selected from the cleaned surface of the specimen, which was measured using an RH-2000 3D super-depth microscope (Hirox-japan Co., Ltd., Fukuoka, Japan) in accordance with ultra-depth morphological analysis, following the procedure outlined in Equation (2), in alignment with NACE Standard SP0775 [22].
V P R = d e p t h   o f   d e e p e s t   p i t   m m × 365 e x p o s u r e   t i m e   d a y s

2.2. Characterization of Corrosion Products

All the corrosion product samples were obtained from high-temperature and high-pressure autoclave immersion experiments. The surface morphologies were analyzed using SEM (EVO MA15, Carl Zeiss, Oberkochen, Germany), and elemental distribution was determined by EDS (X-MaxN, Oxford Instruments Co., Ltd., Abingdon, UK). Furthermore, the phase composition of the corrosion products was identified by X-ray diffraction (XRD) and X-ray photoelectron spectroscopy (XPS).

3. Results and Discussions

3.1. The Influence of H2S

Figure 3a presents the average corrosion rates, based on mass loss measurements, for P110 and S13Cr steels exposed to supercritical CO2 (120 °C, 20 MPa) with different H2S concentrations. Both steels showed similar trends in corrosion rate variations with changing H2S concentrations. The highest corrosion rates were recorded at 1400 ppm H2S (0.0434 mm/y for P110 and 0.0313 mm/y for S13Cr). As the H2S concentration decreased, the rates fluctuated between 0.020 and 0.034 mm/y for P110 and 0.0099 and 0.0116 mm/y for S13Cr. Notably, although P110 consistently exhibited higher average corrosion rates than S13Cr across all the H2S concentrations, no pitting corrosion was observed in P110, even at 1400 ppm H2S. In contrast, S13Cr experienced significant pitting corrosion at H2S concentrations above 1000 ppm, as shown in Figure 3b. The pitting corrosion rates for S13Cr were 2.3846 mm/y at 1400 ppm H2S and 1.2775 mm/y at 1000 ppm H2S. These values were derived from the dimensions of the deepest pits, calculated using Equation (2) and illustrated in Figure 3c,d.
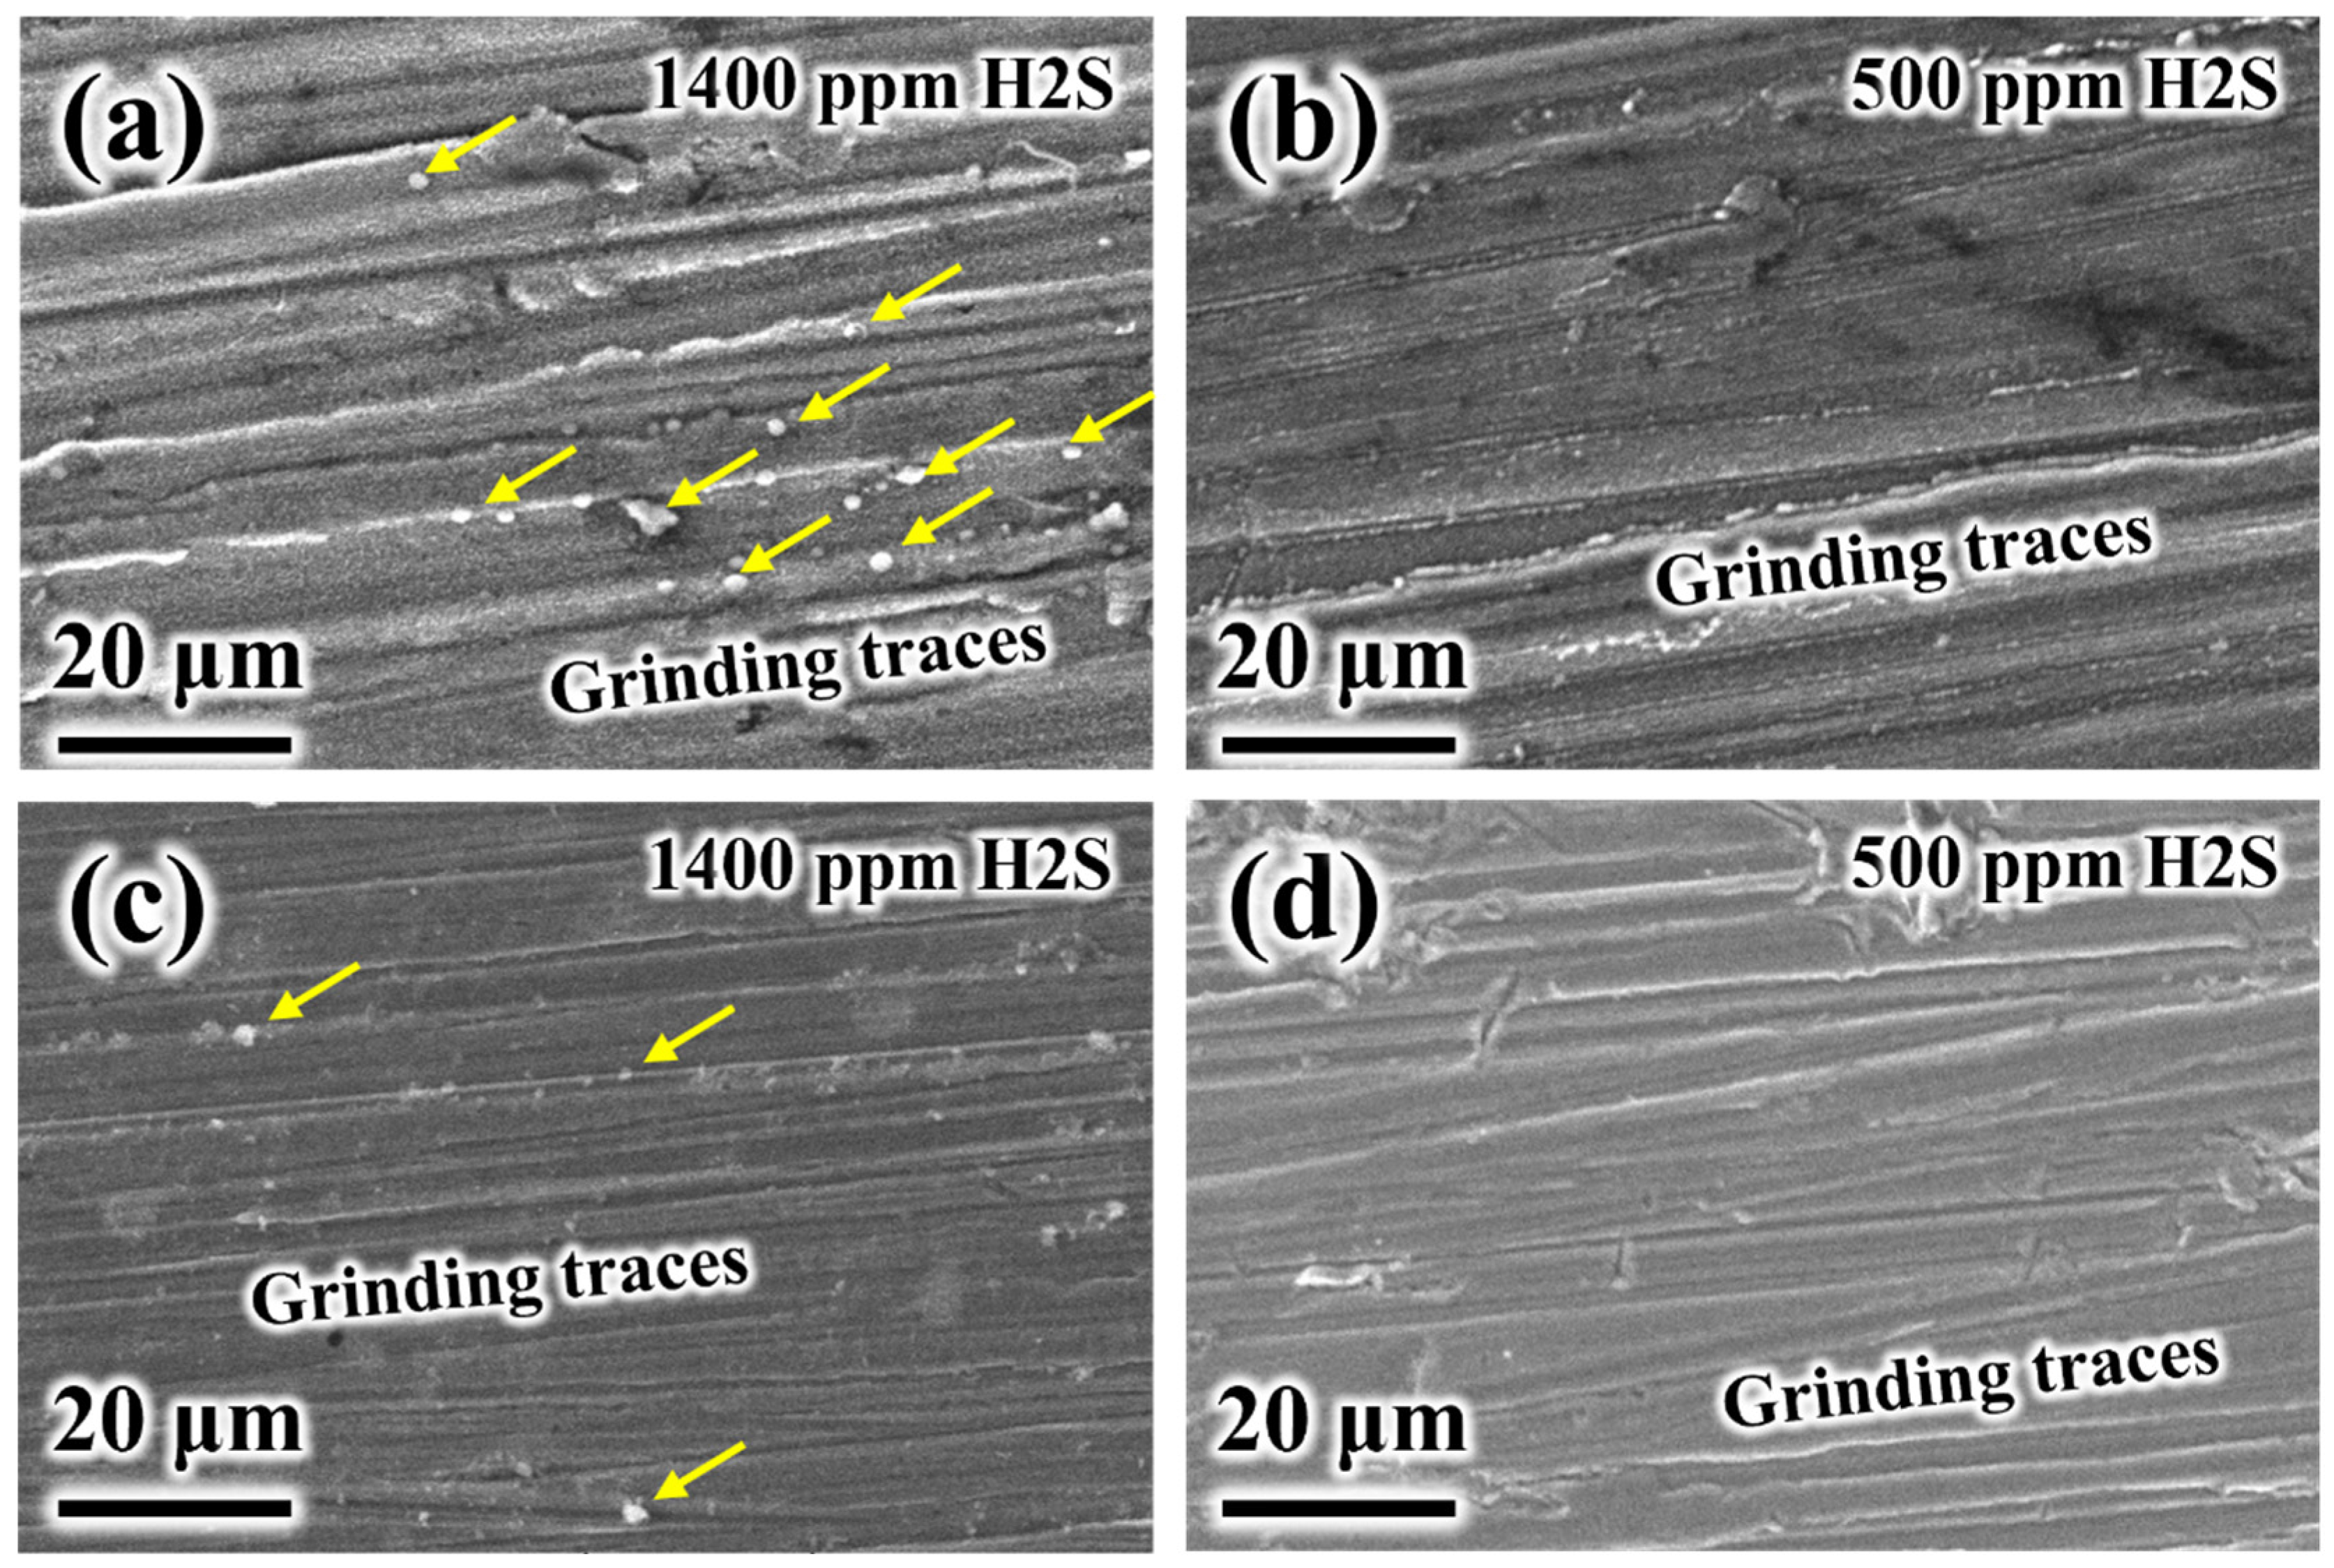
As shown in Figure 3a, 1000 ppm H2S appears to mark a transition point, below which the average corrosion rates stabilized. To further investigate this behavior, the secondary electron (SE) images in Figure 4 show the surface morphologies of the P110 and S13Cr specimens exposed to 1400 ppm and 500 ppm H2S, respectively. For both steels, the surfaces under both conditions displayed visible grinding and polishing marks, as seen in all the SE images. At 1400 ppm H2S, small spherical corrosion products were observed on the P110 surface (Figure 4a). These became less prominent at 500 ppm H2S (Figure 4b). A similar trend was observed for S13Cr (Figure 4c,d). At 1400 ppm H2S, only a few products formed on the S13Cr surface, which appeared almost clean at 500 ppm, with virtually no corrosion products visible.
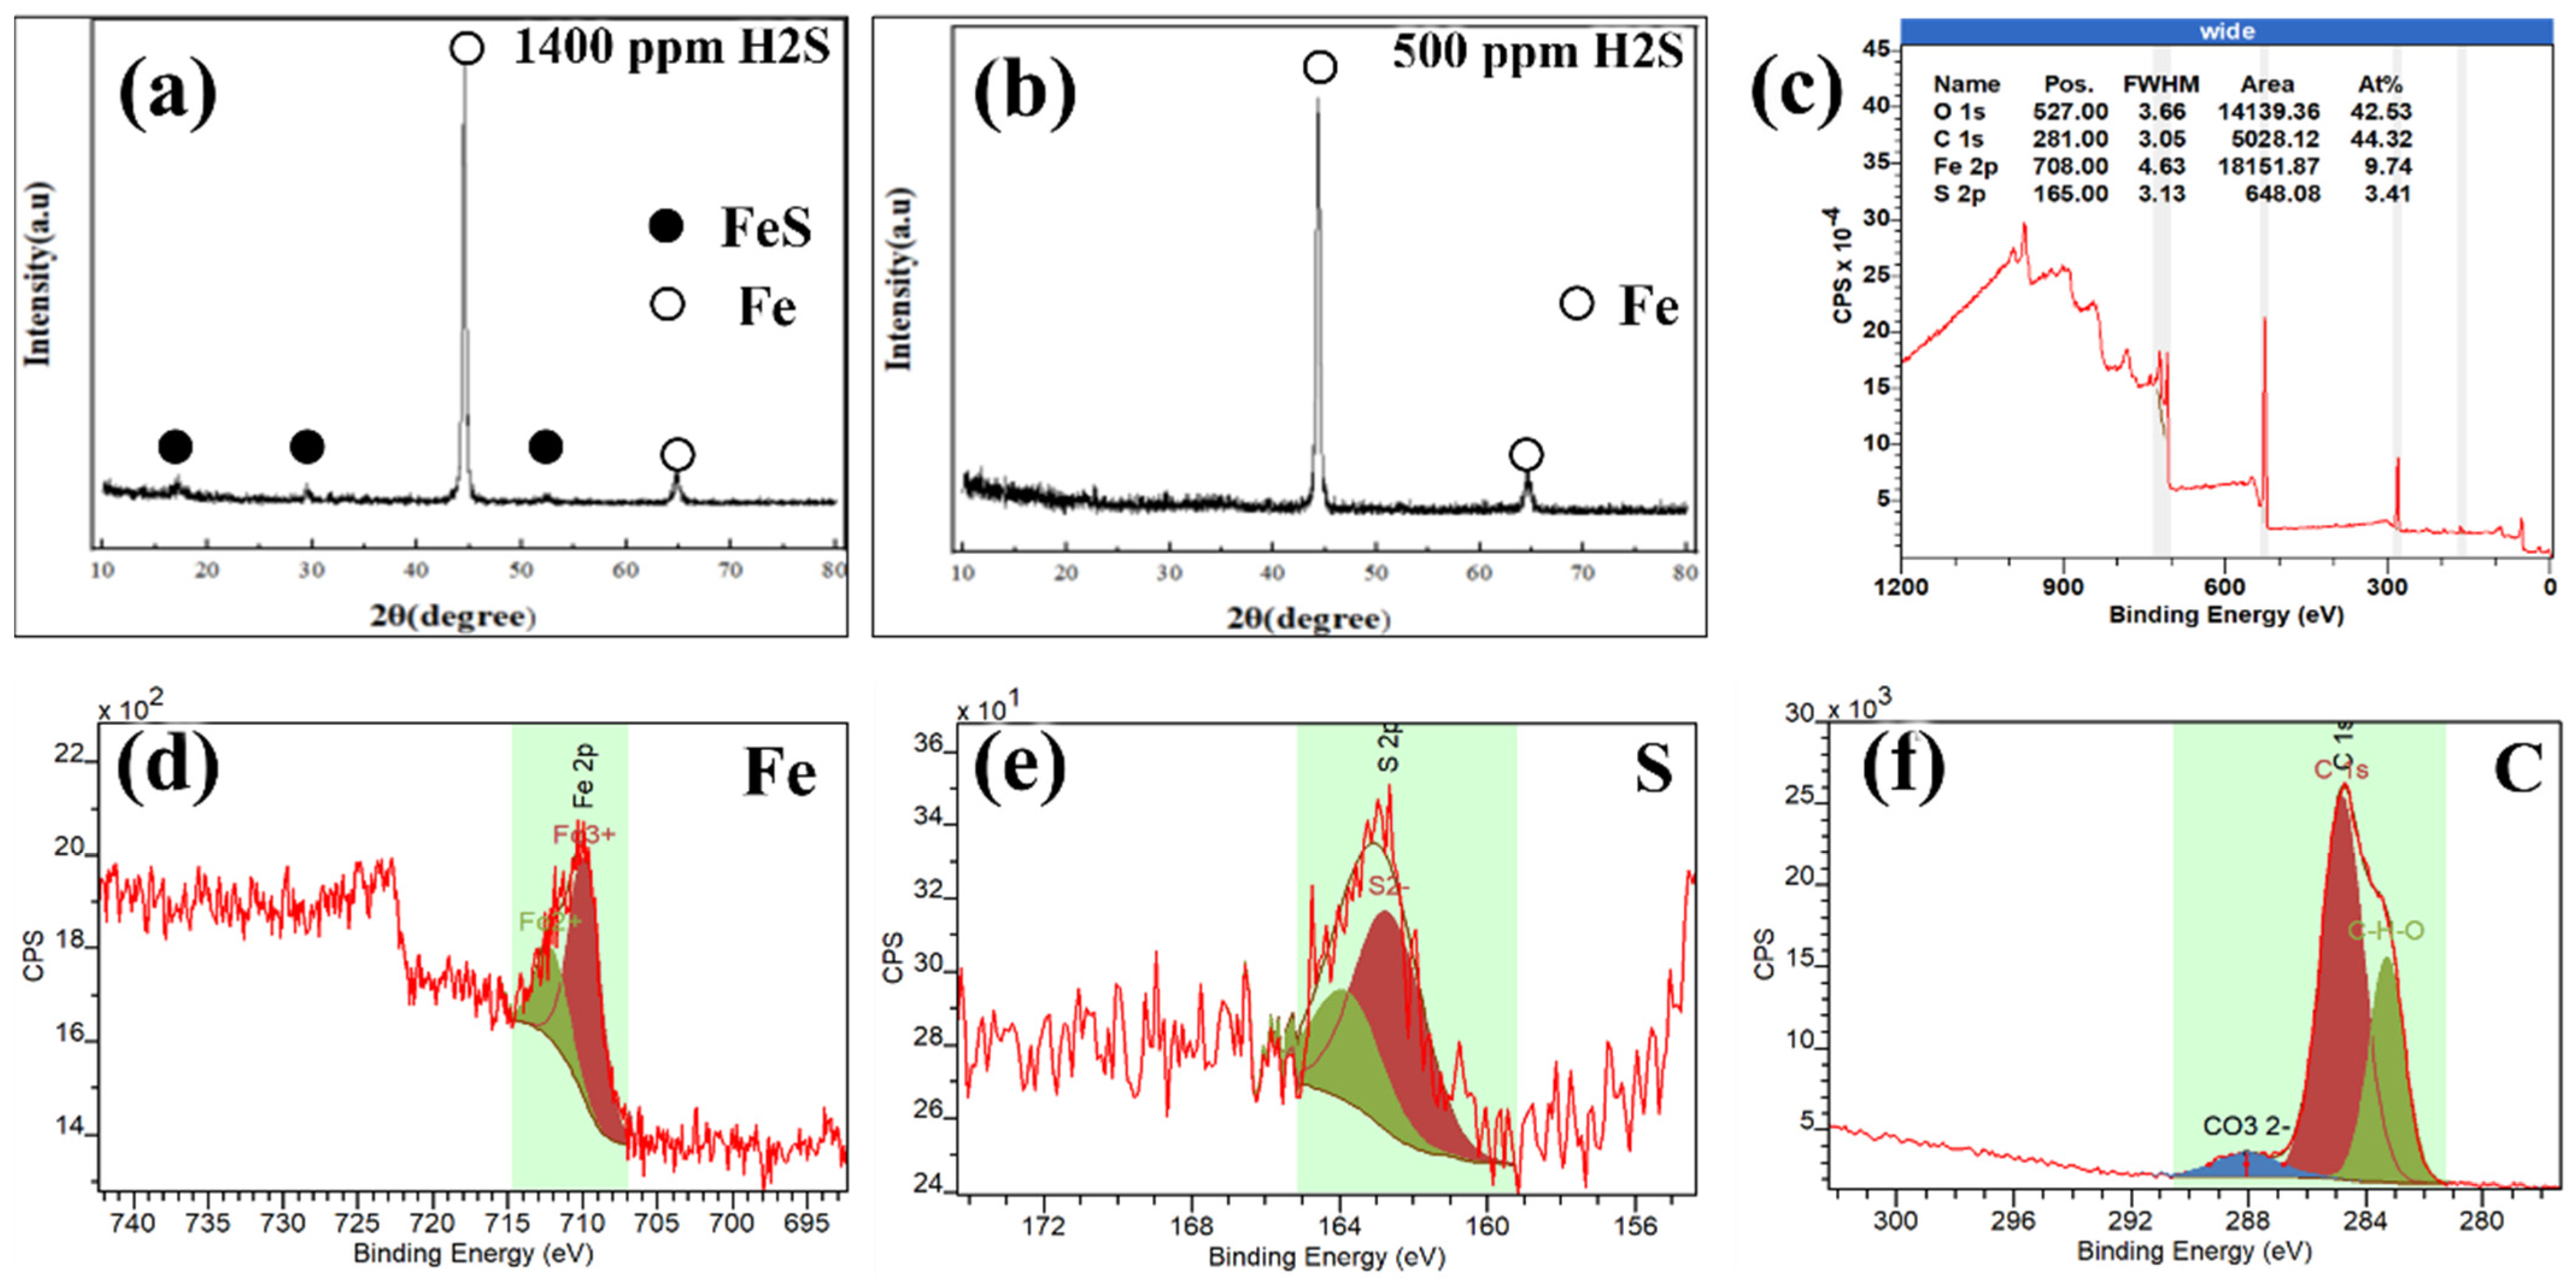
To elucidate the chemical composition of these corrosion products, XRD spectral analysis was performed. Distinct FeS peaks were observed for the P110 sample at 1400 ppm H2S (Figure 5a), whereas only the matrix peaks (i.e., Fe) were detected when the H2S concentration decreased to 500 ppm (Figure 5b). This observation is consistent with the reduction in the number of corrosion products on the specimen surface, as depicted in Figure 4a,b. Given that certain components of corrosion products cannot be accurately classified using the XRD method due to its resolution limitations, the XPS technique was employed in this study to further identify potential corrosion products formed on the P110 surface at 1400 ppm H2S. Considering the chemical composition of P110 and the supercritical CO2-H2S testing environment, Fe, C, and S were the primary elements detected in the XPS analysis. However, the presence of O was also observed, as shown in Figure 5c, which likely corresponded to the formation of oxides upon exposure of the sample to air, rather than originating from the corrosion process. Figure 5d exhibits the Fe 2p3/2 peak at a binding energy of approximately 711.2 eV, which indicates that Fe existed in an oxidized state, such as Fe2+ [23,24]. The S 2p peak centered around 163.2 eV (Figure 5e) was attributed to sulfides [25], consistent with the identification of FeS products from XRD analysis. Additionally, a C 1s peak at a binding energy of approximately 289.0 eV was also detected, corresponding to carbonate species (Figure 5f). Given the presence of oxidized Fe, it is reasonable to infer that FeCO3, as one of the corrosion products, is also present in supercritical CO2-H2S environments. However, its low concentration and weak crystallinity may have rendered it undetectable by XRD. Therefore, based on the XRD and XPS results, it is inferred that at 1400 ppm H2S, the corrosion process follows the reaction and precipitation mechanisms outlined in Equations (3) and (4):
F e +   H 2 S F e S + 2 H +
F e 2 + +   H S F e S +   H +
Notably, H2S has higher solubility in water than CO2 [26], and when its concentration exceeds 1000 ppm, the thermodynamic driving force for FeS formation is generally greater than that for FeCO3 [27]. As a result, H2S preferentially dissolves in the surface water film and reacts with the steel substrate to form FeS, which precipitates onto the corrosion product layer. When the H2S concentration was reduced to 500 ppm, these reaction and precipitation mechanisms were likely suppressed. This is supported by SE imaging (Figure 4a,b) and XRD analysis (Figure 5a,b), both of which show minimal FeS deposition on the specimen surfaces.
For S13Cr, although the average corrosion rates leveled off below 500 ppm H2S, notable pitting corrosion was still observed at 1000 ppm and 1400 ppm (Figure 3). This indicates that, with respect to pitting behavior, the transition threshold for S13Cr should be considered at 1000 ppm H2S rather than 500 ppm. Therefore, the corrosion products formed on the S13Cr surface at 1000 ppm H2S were systematically analyzed using XRD and XPS techniques. The XRD analysis revealed only Fe peaks (Figure 6a), corresponding to the metallic matrix. This is consistent with prior surface observations (Figure 4c), where minimal corrosion products were present at 1400 ppm H2S and even fewer at 1000 ppm. The XPS analysis confirmed the presence of FeS through Fe and S peaks (Figure 6b,c), and detected Cr 2p peaks centered around 577.4 eV (Figure 6d), corresponding to Cr(OH)3 (Figure 6e) [28,29]. Cr(OH)3 is notable for its thermodynamic stability and low solubility, which can contribute to protective barrier formation against further corrosion. However, Fierro et al. [30] proposed that Cr enrichment of about 25 at% in the corrosion products formed on 13Cr steels in CO2 environments, while the Cr concentration reduced to 11 at% of the same material tested in H2S-containing environments. Accordingly, Ueda concluded that Cr(OH)3 alone cannot remain stable in CO2-H2S environments and emphasized the synergetic effect of Mo sulfides (outer layer) and Cr(OH)3 (inner layer) in resisting further H2S corrosion due to their high thermodynamic stability in H2S-containing environments [27]. In this study, the Mo 3d peaks centered around 231.2 and 229.2 eV were observed (Figure 6f), corresponding to Mo4+ 3d3/2 and Mo4+ 3d5/2, respectively [31], typical of MoS2. Although the Mo 3d peak centered around 234.2 eV corresponds to Mo6+ 3d3/2, its presence should be attributed to the oxidation of MoS2 [31]. Despite the coexistence of Cr(OH)3 and MoS2 products, severe pitting still occurred in S13Cr specimens under 1000 and 1400 ppm H2S-containing environments. A similar phenomenon was also observed in a recent study by Wang et al. [26]. In their tests at 180 °C and 27.5 MPa, S13Cr exhibited a low general corrosion rate (0.019 mm/y) but showed deep pitting (~7 μm). These results align with the present study, where S13Cr had a general corrosion rate of 0.013 mm/y and pit depths of ~10 μm at 1000 ppm H2S (Figure 3). Wang et al. also reported that the corrosion product layer on S13Cr was thin, with FeS, Cr(OH)3, and other species forming a single, mixed layer rather than a distinct multilayer structure. These findings suggest that neither 1000 ppm nor 1400 ppm H2S provided enough MoS2 to form a dense, protective outer layer (Figure 4c). As a result, the Cr(OH)3 layer alone was insufficiently protective, becoming unstable and vulnerable to H2S attack, leading to deep pitting. When the H2S concentrations dropped below 500 ppm, the formation of MoS2 was suppressed, as was overall H2S-induced corrosion, and pitting no longer occurred.
Based on the summarized results of general and pitting corrosion rates for both tested materials across varying H2S concentrations, in conjunction with SE imaging and XRD/XPS analyses, it can be concluded that 500 ppm H2S represents a critical threshold. Below this concentration, both general corrosion and pitting corrosion remained within acceptable limits. Therefore, 500 ppm H2S was selected as the representative concentration for subsequent investigations.

3.2. The Coupled Effect of H2S and O2

Figure 7a,b present the general and pitting corrosion rates of P110 and S13Cr steels across various O2 concentrations. A clear trend emerges: corrosion rates increased significantly, and severe pitting occurred (Figure 7c–f) when the O2 concentrations exceeded 1000 ppm, highlighting the corrosive impact of elevated O2 levels. In contrast, when the O2 concentrations were reduced to 100 ppm or below, the general corrosion rates declined to values comparable to those observed in supercritical CO2 with 500 ppm H2S (Figure 3), and pitting corrosion was no longer observed. Therefore, 100 ppm O2 can be considered a critical threshold for both general and localized corrosion. Notably, S13Cr exhibited lower general corrosion rates than P110 across all the conditions, but significantly higher pitting rates at 1000 and 13,000 ppm O2.
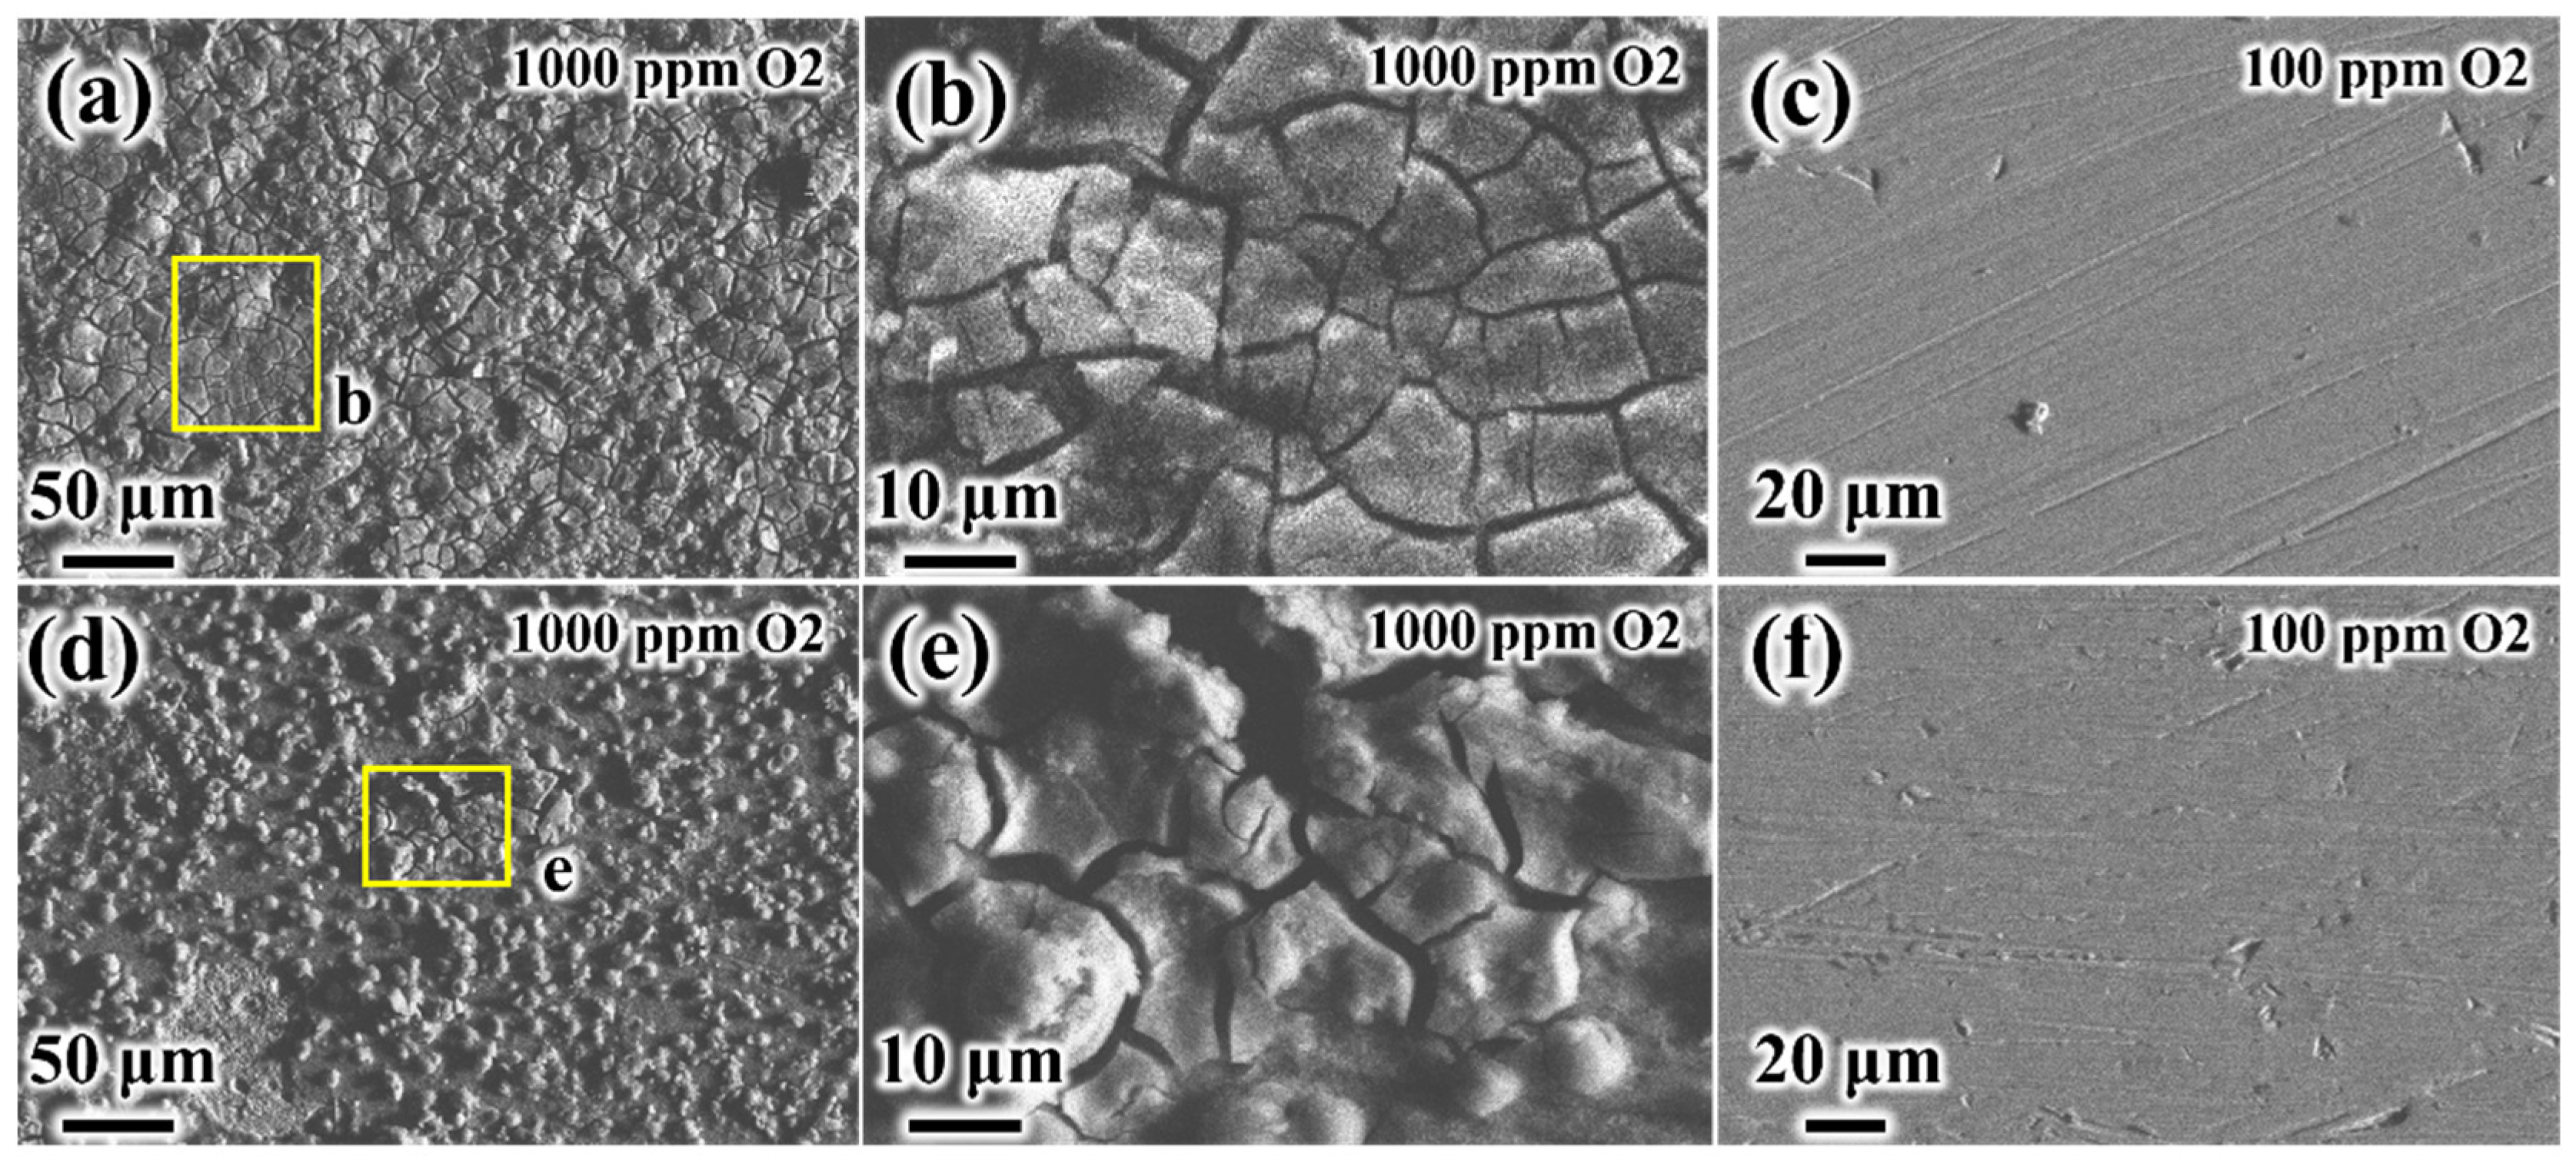
Figure 8 illustrates the variation in corrosion product morphology on the specimen surfaces as the O2 concentration decreases. For the P110 steel tested in the CO2-H2S-O2 (1000 ppm) environment, a relatively thick corrosion product film was evident, as indicated by the full coverage of grinding and polishing marks (Figure 8a). At higher magnification (Figure 8b), the film exhibited pronounced cracking, likely caused by internal stresses resulting from volume changes during dehydration [32]. When the O2 concentration was reduced to 100 ppm, corrosion was significantly mitigated (Figure 7a,b), and the film thickness decreased accordingly, exposing the underlying grinding marks (Figure 8c). A similar trend was observed for the S13Cr specimens. At 1000 ppm O2, a thick, cracked product film was present (Figure 8d,e), while the surface appeared clean and flat with minimal corrosion at 100 ppm O2 (Figure 8f). Additionally, spherical corrosion products (~10 μm in diameter) were observed on the cracked film surfaces. To further identify the chemical composition of the corrosion products formed under 1000 ppm O2, XPS analysis was conducted on both P110 and S13Cr specimens.
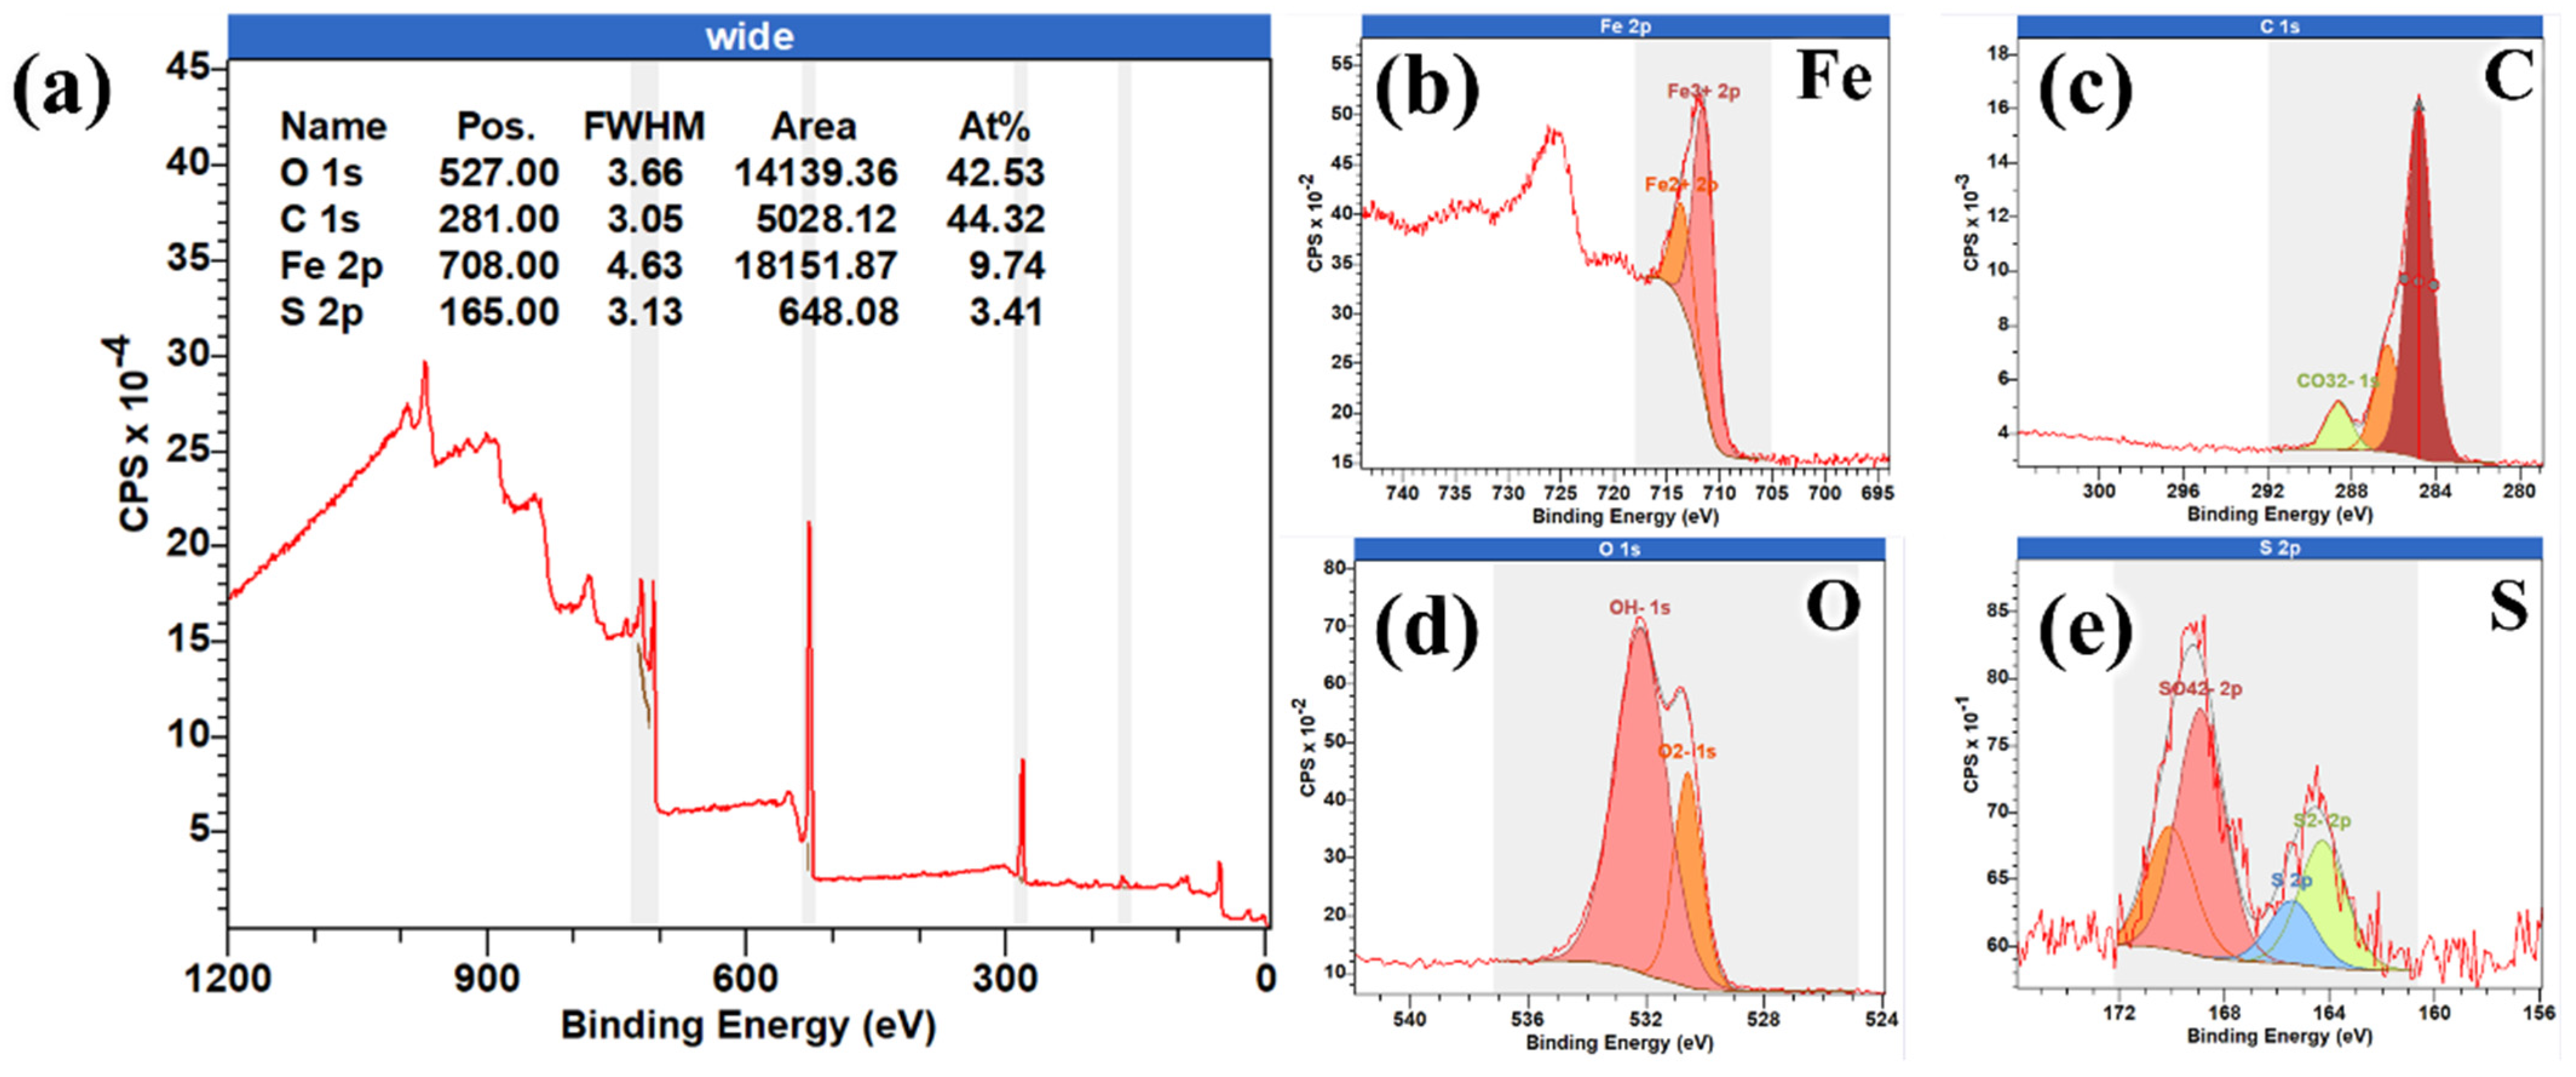
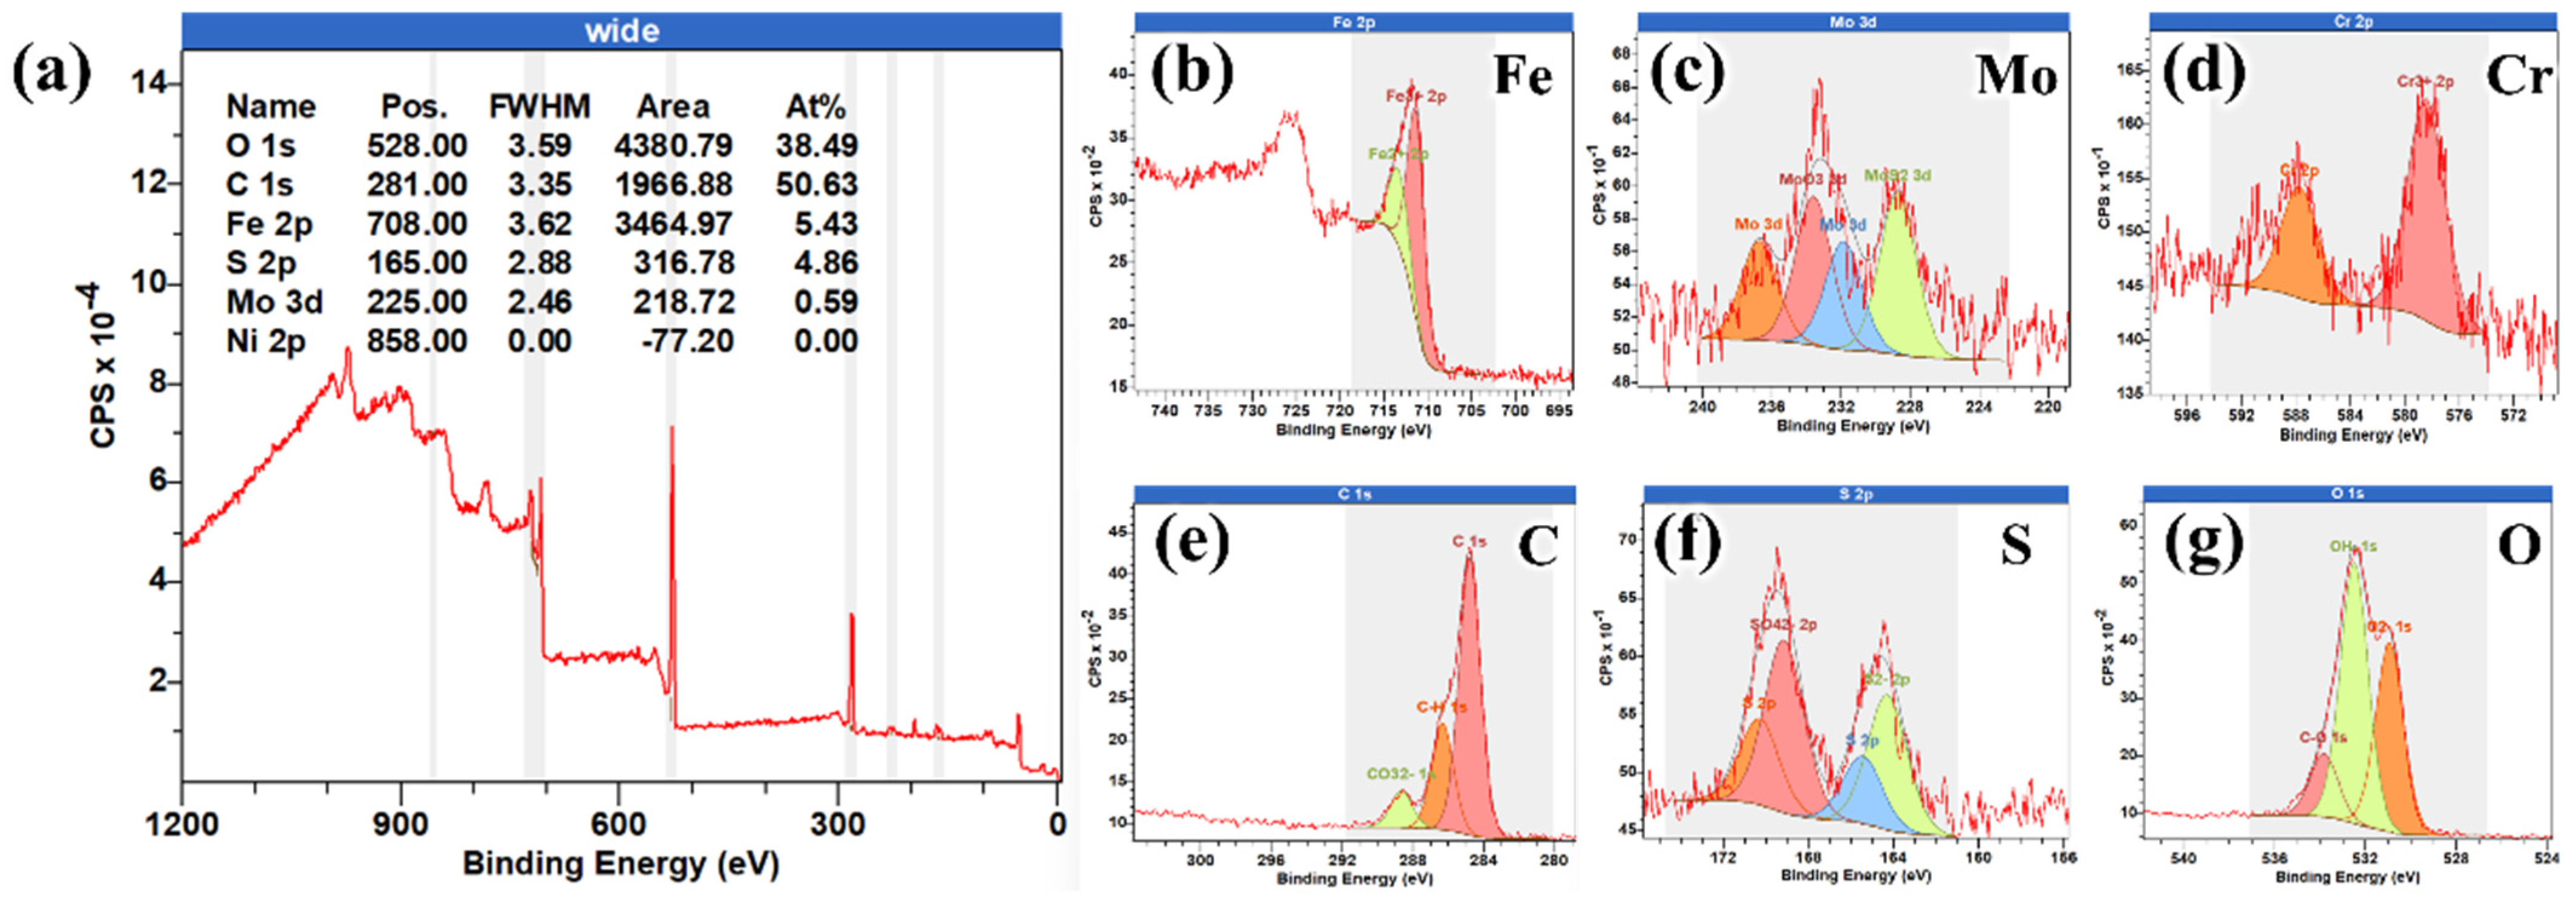
For P110, the XPS spectra primarily detected Fe 2p, C 1s, O 1s, and S 2p peaks (Figure 9a). The C 1s peak at a binding energy of approximately 289.0 eV (Figure 9c) was attributed to FeCO3. The S 2p peak centered at approximately 163.2 eV (Figure 9d) was assigned to FeS. Additionally, the Fe 2p3/2 peak around 711.6 eV and the O 1s peak at approximately 529.7 eV indicated the presence of Fe2O3. In summary, three corrosion products were identified: FeCO3, FeS, and Fe2O3. For S13Cr, the XPS-detected elements are shown in Figure 10a. Except for the presence of FeS (S 2p peak around 163.2 eV, Figure 9f) and FeCO3 (C 1s peak around 289.0 eV, Figure 9e), the Cr 2p peak around 577.4 eV (Figure 9d) and Mo 3d peaks around 231.2 and 229.2 eV (Figure 9c) revealed the presence of Cr(OH)3 and MoS2. According to the recent publications of Naixin et al. [33] and Wang et al. [26], the inner layer was primarily composed of Cr(OH)3. During the dehydration process, the Cr-enriched product film transformed Cr(OH)3 into Cr2O3, which led to the cracking of the product film, as shown in Figure 8d,e. The outer layer was likely composed of iron oxides, consistent with the spherical products observed on the surface of the cracked film (Figure 8d). In a supercritical CO2-H2O environment, FeCO3, a commonly observed corrosion product has been extensively studied and is considered to form via either a one-step or two-step reaction mechanism (Equations (5)–(7)) [34]. Meanwhile, Barker et al. reported that impurities in a supercritical CO2 environment influence the deposition kinetics, morphological characteristics, and protective performance of FeCO3 [35].
F e 2 + + C O 3 2 F e C O 3
F e 2 + + 2 H C O 3 F e ( H C O 3 ) 2
The introduction of oxygen impurities promotes additional cathodic reactions (Equation (8)) and inhibits FeCO3 formation by oxidizing ferrous ions to ferric ions, thereby facilitating the formation of non-protective Fe2O3 (Equations (9)–(11)).
O 2 + 4 H + + 4 e 2 H 2 O
F e 2 + + 2 O H F e ( O H ) 2
4 F e ( O H ) 2 + O 2 + 2 H 2 O 4 F e ( O H ) 3
2 F e ( O H ) 3 F e 2 O 3 + 3 H 2 O
Generally, at low H2S concentrations, the uniform corrosion rate can be significantly reduced due to the rapid formation of a relatively thin FeS corrosion product film on the P110 surface, as described by the following formulation (Equation (12)) [36]. However, in the case of S13Cr steel, the addition of Mo and Cr leads to substantial changes in the composition of the product film. Ueda et al. reported that MoS2 demonstrates considerably higher stability compared to FeS, which favors its preferential formation during the film formation process [27]. Moreover, according to the spontaneous passivation mechanism, MoS2 is initially formed on the steel surface, followed by the subsequent growth of Cr oxide beneath these sulfides, which acts as a protective barrier against further H2S corrosion. Additionally, Mo promotes the formation of a stable Cr oxide passive film in the inner layer.
F e s + H 2 S F e S + H 2
Based on the observed trends in general and the pitting corrosion rates for both tested materials under CO2-H2S-O2 environments (Figure 7a,b), as well as the variations in corrosion product composition revealed through the SEM observations and XPS analyses, it can be concluded that the combination of 500 ppm H2S and 100 ppm O2 serves as a critical threshold condition. Below this threshold, both general and localized corrosion remain within acceptable limits. Therefore, in the following section, the influence of temperature on the corrosion behavior of P110 and S13Cr steels will be investigated under this defined threshold environment.

3.3. The Influence of Temperature

To evaluate the influence of temperature on the corrosion behavior of P110 and S13Cr steels in a supercritical CO2-H2S (500 ppm)-O2 (100 ppm) environment, corrosion tests were conducted at three temperatures: 60 °C, 90 °C, and 120 °C. The average corrosion rates are summarized in Figure 11. A decrease in temperature led to an increase in corrosion severity for both materials. This effect was particularly pronounced for S13Cr, whose average corrosion rate rose sharply from 0.0031 mm/y at 120 °C to 0.08 mm/y at 60 °C. The surface morphologies of the corrosion products are shown in Figure 12. On the P110 specimen (Figure 12a), a protective film was observed to reform, covering the grinding marks and appearing more intact than the film formed under 1000 ppm O2 at 120 °C (Figure 8a,b). However, shallow cracks were still present, discernible only at high magnification, as shown in the inset of Figure 12a. Similar shallow cracking was also observed on the corrosion product film of the S13Cr specimen (Figure 12b). A plausible explanation for the observed increase in the average corrosion rates of both tested materials is that the reduction in testing temperature affected the solubility of H2O in supercritical CO2. Spycher et al. [37] and Choi et al. [5] developed a thermodynamic model to describe the mutual solubility of CO2 and H2O and demonstrated that the solubility of H2O in supercritical CO2 decreases with decreasing temperature. Consequently, it can be inferred that a reduction in operating temperature may induce aqueous phase precipitation, resulting in the formation of a free aqueous layer above the specimen surface. Subsequently, both supercritical CO2 and impurity gases (H2S and O2) dissolve into the aqueous phase, thereby promoting corrosion of the tested tubing steels.

4. Conclusions

In this study, the effects of impurities and temperature on the corrosion behavior of two commonly used tubing steels, P110 and S13Cr, were systematically investigated through corrosion tests and SEM observations. The chemical compositions of the corrosion products were further characterized using XRD and XPS analyses. Based on the experimental findings, the following conclusions can be drawn:
  • In water-unsaturated (500 ppmv H2O) supercritical CO2-H2S environments, both P110 and S13Cr exhibited relatively low and stable general corrosion rates (approximately 0.03 mm/y and 0.01 mm/y, respectively). The corrosion product films were poorly developed and only partially obscured the grinding marks. However, S13Cr showed susceptibility to pitting corrosion when the H2S concentration exceeded 500 ppm. Therefore, a supercritical CO2 environment containing 500 ppm H2S was identified as the threshold condition, below which the corrosion behavior of both materials remained within acceptable limits.
  • Upon the introduction of O2, both steels exhibited markedly accelerated corrosion, characterized by elevated general corrosion rates and the presence of deep pits. Although relatively thick product films formed on the specimen surfaces, these films displayed severe cracking, compromising their protective ability and exacerbating localized corrosion. When the O2 concentration was reduced to 100 ppm, the corrosion product films became thinner yet continuous, correlating with stable corrosion rates and the complete suppression of pitting in both materials.
  • The corrosion behavior of S13Cr was found to be highly sensitive to temperature. As the test temperature decreased from 120 °C to 60 °C, the general corrosion rate of S13Cr increased substantially from 0.0031 mm/y to 0.08 mm/y. This trend is attributed to the influence of temperature on water solubility in supercritical CO2. At lower temperatures, water is more likely to precipitate on the steel surface, enhancing the dissolution of H2S into the aqueous phase and thus intensifying its corrosive effect.

Author Contributions

Conceptualization, M.Z. and X.L.; Methodology, M.Z., Z.Z., J.X. and Q.H.; Formal analysis, M.Z. and W.S.; Investigation, M.Z., X.L., W.S. and Q.H.; Resources, J.Z.; Data curation, M.Z., Z.Z., J.X. and W.S.; Writing—original draft, M.Z.; Writing—review & editing, Z.Z., J.X., X.L., W.S., J.Z. and Q.H.; Visualization, M.Z., Z.Z. and J.X.; Supervision, M.Z. and X.L.; Project administration, Z.Z.; Funding acquisition, X.L. All authors have read and agreed to the published version of the manuscript.

Funding

This research was funded by CNPC Tubular Goods Research Institute, Research on Failure Mechanisms and New Technologies for Healthy Service of Oil and Gas Pipeline No. 2025DJ106, and the CNPC Basic Research and Strategic Reserve Technology Research Fund Projectt No. 2023ZZ11-02.

Institutional Review Board Statement

Not applicable.

Informed Consent Statement

Informed consent was obtained from all subjects involved in the study.

Data Availability Statement

The original contributions presented in this study are included in the article. Further inquiries can be directed to the corresponding author.

Conflicts of Interest

The authors declare no conflicts of interest.

References

  1. Shiyi, Y.; Desheng, M.A.; Junshi, L.I.; Tiyao, Z.; Zemin, J.I.; Haishui, H.A.N. Progress and Prospects of Carbon Dioxide Capture, EOR-Utilization and Storage Industrialization. Pet. Explor. Dev. 2022, 49, 955–962. [Google Scholar] [CrossRef]
  2. Yang, J.; Yang, C.; Gu, Q.; Zhu, C.; Luo, M. Economic Evaluation and Influencing Factors of CCUS-EOR Technology: A Case Study from a High Water-Bearing Oilfield in Xinjiang, China. Energy Rep. 2023, 10, 153–160. [Google Scholar] [CrossRef]
  3. Fang, W.; Guangzhi, L.; Chunmei, S.U.; Feng, W.; Jianguo, M.A.; Yongzhi, Y. Carbon Emission Reduction Accounting Method for a CCUS-EOR Project. Pet. Explor. Dev. 2023, 50, 989–1000. [Google Scholar] [CrossRef]
  4. Kang, H.; Li, G.; Zhou, X.; Gao, J. Challenge and Strategy for the Successful Application of CCUS-EOR in China. Front. Energy Res. 2023, 11, 1073402. [Google Scholar] [CrossRef]
  5. Choi, Y.-S.; Nesic, S. Corrosion Behvaior of Carbon Steel in Supercritical CO2-Water Environment. In Proceedings of the Corrosion Conference and Expo 2009, Atlanta, GA, USA, 22–26 March 2009; pp. 1–20. [Google Scholar] [CrossRef]
  6. Wang, Z.M.; Song, G.; Zhang, J. Corrosion Control in CO2 Enhanced Oil Recovery From a Perspective of Multiphase Fluids. Front. Mater. 2019, 6, 272. [Google Scholar] [CrossRef]
  7. Dai, Z.; Viswanathan, H.; Middleton, R.; Pan, F.; Ampomah, W.; Yang, C.; Jia, W.; Xiao, T.; Lee, S.; Mcpherson, B.; et al. CO2 Accounting and Risk Analysis for CO2 Sequestration at Enhanced Oil Recovery Sites. Environ. Sci. Technol. 2016, 50, 7546–7554. [Google Scholar] [CrossRef] [PubMed]
  8. Morland, B.H.; Dugstad, A.; Svenningsen, G. Corrosion of Carbon Steel in Dense Phase CO2 with Water above and below the Solubility Limit. Energy Procedia 2017, 114, 6752–6765. [Google Scholar] [CrossRef]
  9. Morland, B.H.; Norby, T.; Tjelta, M.; Svenningsen, G. Effect of SO2, O2, NO2, and H2O Concentrations on Chemical Reactions and Corrosion of Carbon Steel in Dense Phase CO2. Corrosion 2019, 75, 1327–1338. [Google Scholar] [CrossRef] [PubMed]
  10. Sun, C.; Sun, J.; Luo, J.L. Unlocking the Impurity-Induced Pipeline Corrosion Based on Phase Behavior of Impure CO2 Streams. Corros. Sci. 2020, 165, 108367. [Google Scholar] [CrossRef]
  11. Kladkaew, N.; Idem, R.; Tontiwachwuthikul, P.; Saiwan, C. Corrosion Behavior of Carbon Steel in the Monoethanolamine-H2O-CO2-O2-SO2 System. Ind. Eng. Chem. Res. 2009, 48, 8913–8919. [Google Scholar] [CrossRef]
  12. Kairy, S.K.; Zhou, S.; Turnbull, A.; Hinds, G. Corrosion of Pipeline Steel in Dense Phase CO2 Containing Impurities: A Critical Review of Test Methodologies. Corros. Sci. 2023, 214, 110986. [Google Scholar] [CrossRef]
  13. Hua, Y.; Barker, R.; Neville, A. Comparison of Corrosion Behaviour for X-65 Carbon Steel in Supercritical CO2-Saturated Water and Water-Saturated/Unsaturated Supercritical CO2. J. Supercrit. Fluids 2015, 97, 224–237. [Google Scholar] [CrossRef]
  14. Sun, C.; Sun, J.; Wang, Y.; Lin, X.; Li, X.; Cheng, X.; Liu, H. Synergistic Effect of O2, H2S and SO2 Impurities on the Corrosion Behavior of X65 Steel in Water-Saturated Supercritical CO2 System. Corros. Sci. 2016, 107, 193–203. [Google Scholar] [CrossRef]
  15. Ji, X.; Zhu, C. Predicting Possible Effects of H2S Impurity on CO2 Transportation and Geological Storage. Environ. Sci. Technol. 2013, 47, 55–62. [Google Scholar] [CrossRef] [PubMed]
  16. Sun, C.; Ding, T.; Sun, J.; Lin, X.; Zhao, W.; Chen, H. Insights into the Effect of H2S on the Corrosion Behavior of N80 Steel in Supercritical CO2 Environment. J. Mater. Res. Technol. 2023, 26, 5462–5477. [Google Scholar] [CrossRef]
  17. Deshmukh, S.; Brown, B.; Young, D. Investigating Oxygen Ingress in the Oil and Gas Industry. Proceedings of the AMPP Annual Conference + Expo 2024 1–17.
  18. Xiang, Y.; Wang, Z.; Li, Z.; Ni, W.D. Effect of Temperature on Corrosion Behaviour of X70 Steel in High Pressure CO2/SO2/O2/H2O Environments. Corros. Eng. Sci. Technol. 2013, 48, 121–130. [Google Scholar] [CrossRef]
  19. Hua, Y.; Barker, R.; Neville, A. International Journal of Greenhouse Gas Control Effect of Temperature on the Critical Water Content for General and Localised Corrosion of X65 Carbon Steel in the Transport of Supercritical CO2. Int. J. Greenh. Gas Control 2014, 31, 48–60. [Google Scholar] [CrossRef]
  20. Choi, Y.-S.; Nesic, S.; Young, D. Effect of Impurities on the Corrosion Behavior of CO2 Transmission Pipeline Steel in Supercritical CO2-Water Environments. Environ. Sci. Technol. 2010, 44, 9233–9238. [Google Scholar] [CrossRef] [PubMed]
  21. Ding, J.; Zhang, L.; Lu, M.; Wang, J.; Wen, Z.; Hao, W. The Electrochemical Behaviour of 316L Austenitic Stainless Steel in Cl-Containing Environment under Different H2S Partial Pressures. Appl. Surf. Sci. 2014, 289, 33–41. [Google Scholar] [CrossRef]
  22. NACE SP0775-2013; Standard Practice: Preparation, Installation, Analysis, and Interpretation of Corrosion Coupons in Oilfield Operations. NACE INTER.: Houston, TX, USA, 2012.
  23. Li, C.; Xiang, Y.; Song, C.; Ji, Z. Assessing the Corrosion Product Scale Formation Characteristics of X80 Steel in Supercritical CO2-H2O Binary Systems with Flue Gas and NaCl Impurities Relevant to CCUS Technology. J. Supercrit. Fluids 2019, 146, 107–119. [Google Scholar] [CrossRef]
  24. Heuer, J.K.; Stubbins, J.F. An XPS Characterization of FeCO3 Films from CO2 Corrosion. Corros. Sci. 1999, 41, 1231–1243. [Google Scholar] [CrossRef]
  25. Bukhtiyarova, G.A.; Bukhtiyarov, V.I.; Sakaeva, N.S.; Kaichev, V.V.; Zolotovskii, B.P. XPS Study of the Silica-Supported Fe-Containing Catalysts for Deep or Partial H2S Oxidation. J. Mol. Catal. A Chem. 2000, 158, 251–255. [Google Scholar] [CrossRef]
  26. Wang, Y.; Wang, B.; Xing, X.; He, S.; Zhang, L.; Lu, M. Effects of Flow Velocity on the Corrosion Behaviour of Super 13Cr Stainless Steel in Ultra-HTHP CO2-H2S Coexistence Environment. Corros. Sci. 2022, 200, 110235. [Google Scholar] [CrossRef]
  27. Ueda, M. 2006 F.N. Speller Award Lecture: Development of Corrosion-Resistance Alloys for the Oil and Gas Industry-Based on Spontaneous Passivity Mechanism. Corrosion 2006, 62, 856–867. [Google Scholar] [CrossRef]
  28. Shuttleworth, D. Preparation of Metal-Polymer Dlspersions by Plasma Techniques. J. Phys. Chem. 1980, 84, 1629–1634. [Google Scholar] [CrossRef]
  29. Guo, S.; Xu, L.; Zhang, L.; Chang, W.; Lu, M. Corrosion of Alloy Steels Containing 2% Chromium in CO2 Environments. Corros. Sci. 2012, 63, 246–258. [Google Scholar] [CrossRef]
  30. Fierro, G.; Ingo, G.M.; Mancia, F. XPS Investigation on the Corrosion Behavior of 13Cr-Martensitic Stainless Steel in CO2-H2S-Cl Environments. Corrosion 1989, 45, 814–823. [Google Scholar] [CrossRef]
  31. Keshri, S.; Pandit, N.; Singh, P.; Grain, A.K.; Keshri, A.K. Synergistic Effect of Al2O3 and MoS2 on the Corrosion Behaviour of Plasma Sprayed Aluminium Matrix Composite Coating. J. Alloys Compd. 2024, 998, 174935. [Google Scholar] [CrossRef]
  32. Zhao, X.; Li, G.; Liu, J.; Li, M.; Du, Q.; Han, Y. Corrosion Performance Analysis of Tubing Materials with Different Cr Contents in the CO2 Flooding Injection–Production Environment. Coatings 2023, 13, 1812. [Google Scholar] [CrossRef]
  33. Naixin, L.; Anqing, F.; Hanwei, L.; Wei, L.; Yan, G.; Haitao, B.; Shaohua, S.; Chengxian, Y.; Xin, L.; Zhengyi, X. Influence of Oxygen Partial Pressure on the Passivation and Depassivation of Super 13Cr Stainless Steel in High Temperature and CO2 Rich Environment. Sci. Rep. 2024, 14, 1–16. [Google Scholar] [CrossRef] [PubMed]
  34. Hua, Y.; Barker, R.; Charpentier, T.; Ward, M.; Neville, A. Relating Iron Carbonate Morphology to Corrosion Characteristics for Water-Saturated Supercritical CO2 Systems. J. Supercrit. Fluids 2015, 98, 183–193. [Google Scholar] [CrossRef]
  35. Barker, R.; Hua, Y.; Neville, A. Internal Corrosion of Carbon Steel Pipelines for Dense-Phase CO2 Transport in Carbon Capture and Storage (CCS)—A Review. Int. Mater. Rev. 2017, 62, 1–31. [Google Scholar] [CrossRef]
  36. Sun, W.; Nešić, S. A Mechanistic Model of Uniform Hydrogen Sulfide/Carbon Dioxide Corrosion of Mild Steel. Corrosion 2009, 65, 291–307. [Google Scholar] [CrossRef]
  37. Spycher, N.; Ruess, K.A.P.; Ing, J.O.E.N. CO2-H2O Mixtures in the Geological Sequestration of CO2. I. Assessment and Calculation of Mutual Solubilities from 12 to 100 °C and up to 600 Bar. Geochim. Cosmochim. Acta 2003, 67, 3015–3031. [Google Scholar] [CrossRef]
Figure 1. (a,b) Microstructural features of P110 and S13Cr before corrosion tests, respectively.
Coatings 15 00944 g001
Figure 2. The experimental setup for measurements under supercritical CO2 conditions with trace impurities.
Coatings 15 00944 g002
Figure 3. (a) Average general corrosion rates of P110 and S13Cr under different H2S contents. (b) Pitting corrosion rates of S13Cr under different H2S contents. (c,d) Depths of pits in S13Cr specimens tested with 1400 and 1000 ppm H2S, respectively.
Coatings 15 00944 g003
Figure 4. (a,b) SE images of the specimen surfaces for P110 steel tested under 1400 ppm and 500 ppm H2S conditions, respectively. (c,d) SE images of the specimen surfaces for S13Cr steel tested under 1400 ppm and 500 ppm H2S conditions, respectively. Yellow arrows highlight the corrosion products on the surface.
Coatings 15 00944 g004
Figure 5. (a,b) XRD results of corrosion scales on the surface of P110 specimens tested under 1400 ppm and 500 ppm H2S conditions, respectively. (cf) XPS results of corrosion scales on the surface of the P110 specimen tested under 1400 ppm H2S condition.
Coatings 15 00944 g005
Figure 6. (a) XRD result of corrosion scales on the surface of the S13Cr specimen tested under 1000 ppm H2S condition. (bf) XPS results of corrosion scales on the surface of the S13Cr specimen tested under 1000 ppm H2S condition.
Coatings 15 00944 g006
Figure 7. (a) Average general corrosion rates of P110 and S13Cr under different O2 contents. (b) Pitting corrosion rates of S13Cr under different O2 contents. (c,e) Depths of pits in P110 specimens tested with 1400 and 1000 ppm H2S, respectively. (d,f) Depths of pits in S13Cr specimens tested with 1400 and 1000 ppm H2S, respectively.
Coatings 15 00944 g007
Figure 8. (a) SE image of the specimen surface for P110 steel tested under 1000 ppm O2 condition and (b) the magnified SE image of the region highlighted in (a). (c) SE image of the specimen surface for P110 steel tested under 100 ppm O2 condition. (d) SE image of the specimen surface for S13Cr steel tested under 1000 ppm O2 condition and (e) the magnified SE image of the region highlighted in (d). (f) SE image of the specimen surface for S13Cr steel tested under 100 ppm O2 condition.
Coatings 15 00944 g008
Figure 9. XPS results of corrosion scales on the surface of the P110 specimen tested under 1000 ppm O2 condition. (a) The FWHM of all examined elements. (b) Fe 2p. (c) C 1s. (d) O 1s. (e) S 2p.
Coatings 15 00944 g009
Figure 10. XPS results of corrosion scales on the surface of the S13Cr specimen tested under 1000 ppm O2 condition. (a) The FWHM of all examined elements. (b) Fe 2p. (c) Mo 3d. (d) Cr 2p. (e) C 1s. (f) S 2p. (g) O 1s.
Coatings 15 00944 g010
Figure 11. Summary of the average corrosion rates of P110 and S13Cr specimens tested under three different temperature conditions.
Coatings 15 00944 g011
Figure 12. (a,b) SEM images of the surfaces of P110 and S13Cr specimens tested at 60 °C, respectively.
Coatings 15 00944 g012
Disclaimer/Publisher’s Note: The statements, opinions and data contained in all publications are solely those of the individual author(s) and contributor(s) and not of MDPI and/or the editor(s). MDPI and/or the editor(s) disclaim responsibility for any injury to people or property resulting from any ideas, methods, instructions or products referred to in the content.