Article

Effects of Oxygen Gas Flow During Deposition on the Thermal Shock Life of YSZ Thermal Barrier Coatings Prepared by Electron Beam Physical Vapor Deposition

1
Guiyang AECC Power Precision Casting Co., Ltd., Shawen Science Park Baiyan District, Guiyang 550000, China
2
Department of Mechanical and Electronic Engineering (Chinese-Foreign Cooperation), Dalian Polytechnic University, Dalian 116034, China
3
Department of Mechanical Engineering, Hunan Institute of Technology, Hengyang 421002, China
4
International Joint Laboratory for Light Alloys (MOE), College of Materials Science and Engineering, Chongqing University, Chongqing 400044, China
*
Authors to whom correspondence should be addressed.
Coatings 2025, 15(8), 928; https://doi.org/10.3390/coatings15080928
Submission received: 16 July 2025 / Revised: 3 August 2025 / Accepted: 6 August 2025 / Published: 8 August 2025
(This article belongs to the Special Issue Characterization and Industrial Applications of PVD Coatings)

Abstract

Electron beam physical vapor deposited (EB-PVD) thermal barrier coatings (TBCs) are widely used to protect the hot section parts of aircraft engine turbines due to its uniform columnar microstructure and high strain tolerance. The microstructure and thermal shock life of 7 wt% Y2O3 stabilized zirconia (YSZ) coatings produced by EB-PVD were investigated as a function of oxygen gas flow during deposition. The surface and cross-section microstructure of EB-PVD YSZ coatings were highly influenced by the oxygen gas flow. When the oxygen gas flow is less than 60 sccm, a sandwich is formed between the bond coat (BC) layer and the YSZ layer, which significantly reduces the thermal shock life of the coating.

1. Introduction

Improving the efficiency of aero engines is a permanent pursuit for academic researchers and engine manufacturers [1]. Elevated temperature capabilities in the hot sections would directly increase the efficiency of these engines, so research on how to increase service temperatures is critical for the further development of high-performance engines. To further increase the service temperature, Ni-based superalloys, internal cooling holes and thermal barrier coatings (TBCs) have been developed [2]. The combined use of TBCs and internal cooling can even reduce the surface temperature of hot-section components by 300 K [2]. Therefore, these three technologies enable the engine to operate at temperatures higher than the melting point of superalloy, thereby improving the efficiency and performance of engines. However, limited by the melting temperatures of superalloys and the reduction efficiency due to internal cooling, TBCs have become an indispensable technology to increasing engine performance [3]. Typical TBCs are a multilayer system consisting of four layers: superalloy substrate, bond coat (BC) layer, thermally grown oxide, and ceramic topcoat. Specifically, 7–8 wt.% yttria stabilized zirconia (YSZ) is the most commonly used ceramic topcoat material due to its high melting point, low thermal conductivity, high coefficient of thermal expansion, and high phase stability [2]. The ceramic layer can be prepared in a variety of ways, but the two most common methods are air plasma spray (APS) and electron beam physical vapor deposition (EB-PVD). APS TBCs have the microstructural feature of “splat” grain morphology and lamellar cracks parallel to the interface resulting in low thermal conductivity [3]. The intrasplat pores and high porosity in APS TBCs reduce the strength of the topcoat, so it usually has shorter thermal-cycling lifetimes than EB-PVD. As a result, APS TBCs are only suitable for applications with lower requirements in aircraft engines, such as stationary guide vanes and combustors [4]. The typical microstructural characteristic of EB-PVD TBCs is the columnar grain structure, which grows perpendicular to the interface between the ceramic topcoat and the BC layer. Segmented vertical cracks formed by disconnected columnar structures can provide sufficient in-plane strain tolerance, resulting in more durable coatings with longer life in severe conditions. Nowadays, EB-PVD TBCs have been widely applied to rotating blades because of their high reliability and excellent resistance against thermal stress [5].
Although engineers and researchers are eager to obtain highly repeatable microstructures by controlling the processing parameters of the EB-PVD, due to variations in working pressure, substrate temperature and rotation speed, ingot and substrate materials, and oxygen flow rate, ceramic coatings through the EB-PVD deposition process can vary significantly from one sample to the other [6]. Many studies have been conducted on the relationship between the microstructure and crystallographic texture of EB-PVD coatings and various process parameters. Movchan [7] established the structure zone model based on detailed research on the effects of substrate temperature and vacuum pressure on the microstructure of the EB-PVD coating. Messier [8] revised the structure zone model by considering the evolutionary growth stages of structural development and the separate effects of thermal- and bombardment-induced mobility. Based on the structure zone model, Thornton [9] proposed a specific and more functional model that permits a broader correlation with experimental observations. Morphological and crystallographic observations revealed that the preheating temperature and deposition time had a significant impact on the structure and orientation of the columnar grains grown in the YSZ coating [10]. Yamaguchi’s [11] results indicated that intercolumnar gaps, feather-like structures and the texture of YSZ layers prepared by EB-PVD TBCs are closely related to substrate rotation. By investigating YSZ ceramic layers deposited using various combinations of substrate pre-heat temperature and rotation speed, Dipak [12] revealed that non-rotated samples exhibited a dense structure consisting of an extremely fine column, while rotated samples showed a much coarser coating structure comprising pyramidal columns. Controlling the substrate oscillation and rotation during the EB-PVD process can lead to differences in crystallographic microstructure and texture, which may be related to the effect of the direction of the incoming vapor on the competition between the in-plane and out-plane alignment of grains [13]. In addition, the microstructure, elastic modulus and lifetime of EB-PVD YSZ coatings were highly influenced by the rotation speed of the substrates. Mineaki [14] demonstrated that higher substrate speeds result in lower coating elastic modulus and smaller defect sizes which led to a longer thermal cycle life of the coating. Furthermore, by varying the key process variables in EB-PVD, Rao [15] established the relationship among process conditions, surface and cross-sectional morphologies, and the physical and mechanical properties of YSZ. Guo’s [16] results indicated the influence of the deposited beam currents on columnar crystal growth and porosity, which determine the surface roughness and mechanical properties.
To sum up, the microstructure and texture that determine the performance of YSZ coatings prepared by EB-PVD are highly influenced by processing parameters. Although many researchers have considered the influence of EB-PVD processing parameters on the crystallographic texture of YSZ, there have been few studies about the relationship between microstructure evolution and oxygen gas flow. Therefore, understanding the microstructure and crystallographic texture evolution which have a major impact on the thermal shock resistance of YSZ coatings is important for determining EB-PVD process parameters. In view of the above, this paper is aimed at relating the deposited oxygen gas rate to microstructure and thermal shock life in the case of EB-PVD YSZ coatings deposited on blades.

2. Materials and Methods

2.1. Preparation of Coatings

The YSZ was deposited on the directionally solidified nickel-base superalloy (DZ125) substrates by a self-build EB-PVD. The BC layer was prepared with NiCoCrAlYSi to a thickness of ~35 μm using vacuum-arc ion plating technology. Before the EB-PVD, the substrates were preheated to about 850 °C (only for the plate specimen) and 930 °C (for the plate and blade specimen) by the electron beam guns (EG-100, Paton Electric Welding Institute, Ukraine). The surface of the YSZ ingot was scanned using a 270° deflected electron beam at an accelerating voltage of 8.5 kV. The rotation speed and coating-chamber pressure were controlled at 10 rpm and 10−5 torr throughout the coating process, respectively. During the deposition process, the oxygen gas flow was kept at 0, 20, 40, and 60 sccm for plate samples, and 0 and 60 sccm for blade samples, respectively. The thickness of the deposited YSZ coatings was 100–120 μm.

2.2. Thermal Shock Test 0

Since the furnace cycle test is one of the most common empirical life assessment methods for TBCs, the thermal shock testing of blade samples was conducted on a self-built thermal shock furnace platform. The platform includes a vertical circulating oxidation furnace with automatic lifting and forced air cooling. The thermal shock test was carried out at 1121 °C for 5 min, followed by forced cooling in air for the same duration. The heating and cooling processes were continuously repeated until 5% of the ceramic coating was exfoliated on the blade samples’ surface, at which point the experiment was halted.

2.3. Characterization

The surface and cross-sectional morphology of the samples were observed by a scanning electron microscope (SEM) (MIRA3, TESCAN, Brno, Czech Republic), and the chemical component and element distribution were measured by an energy dispersive spectrometer (EDS) (INCA X-Max20, IL, USA). The phase composition of as-deposited and after thermal shock tested samples was detected by X-ray diffraction (XRD) (Ultima IV, Rigaku, Tokyo, Japan). Samples for transmission electron microscopy (TEM) (Talos F200X, FEI, NY, USA) characterization were prepared using Ar-ion milling and focused ion beam (FIB) (GAIA3, TESCAN, Brno, Czech Republic), methods. Phase identification in the desired area was accomplished by TEM characterization, and selected area electron diffraction patterns (SAEDPs) were indexed using standard procedures.

3. Results and Discussion

3.1. Confirmation of Deposition Parameters

In order to confirm the substrate temperature and oxygen gas flow deposition parameters of the blade samples, preliminary experiments were first conducted on flat plate samples with different oxygen levels and substrate temperatures. Figure 1 shows cross-section SEM images at different oxygen flow rates at substrate temperatures of 850 °C (Figure 1a–d) and 930 °C (Figure 1e–h). Figure 1a shows the morphology at a substrate temperature of 850 °C without oxygen. The top ceramic layer was composed of columnar grains aligned perpendicular to the BC layer that is typically observed in EB-PVD coatings. However, a distinct light gray intermediate layer (as shown in Figure 1a) was seen between the YSZ layer and the BC layer, which was uncommon in normal EB-PVD coating structures. The 850 °C samples with oxygen gas flow increased to 20 sccm (as shown in Figure 1b) and 40 sccm (as shown in Figure 1c) still had an intermediate layer, while the mixed layer disappeared when the oxygen flux increased to 60 sccm (as shown in Figure 1d). The columnar crystals of the non-oxygen sample at 930 °C (see Figure 1e) are coarser than those at 850 °C, but there was still a mixed layer at the interface. The evolution of the microstructure with an increasing oxygen flow rate shows a clear trend towards excellent columnar structures. When the substrate temperature was 930 °C, the intermediate layer still existed at oxygen flow rates of 20 sccm (as shown in Figure 1f) and 40 sccm (as shown in Figure 1g), but disappeared at 60 sccm (as shown in Figure 1h). Comparing the morphology of the same oxygen flow rate at two different temperatures (Figure 1a–d vs. e–h), the higher the substrate temperature, the larger the diameter of the columnar crystals. The differences in the columnar crystal size of the samples prepared at different temperatures are also consistent with the well-known structural zone model [8]. To analyze the effect of the oxygen flow rate on the coating in detail, the deposition parameters shown in Table 1 were selected to prepare the coating on the blade samples. The non-oxygen and 60 sccm oxygen flow blade samples were named BS1 and BS2, respectively.

3.2. Thermal Shock Life

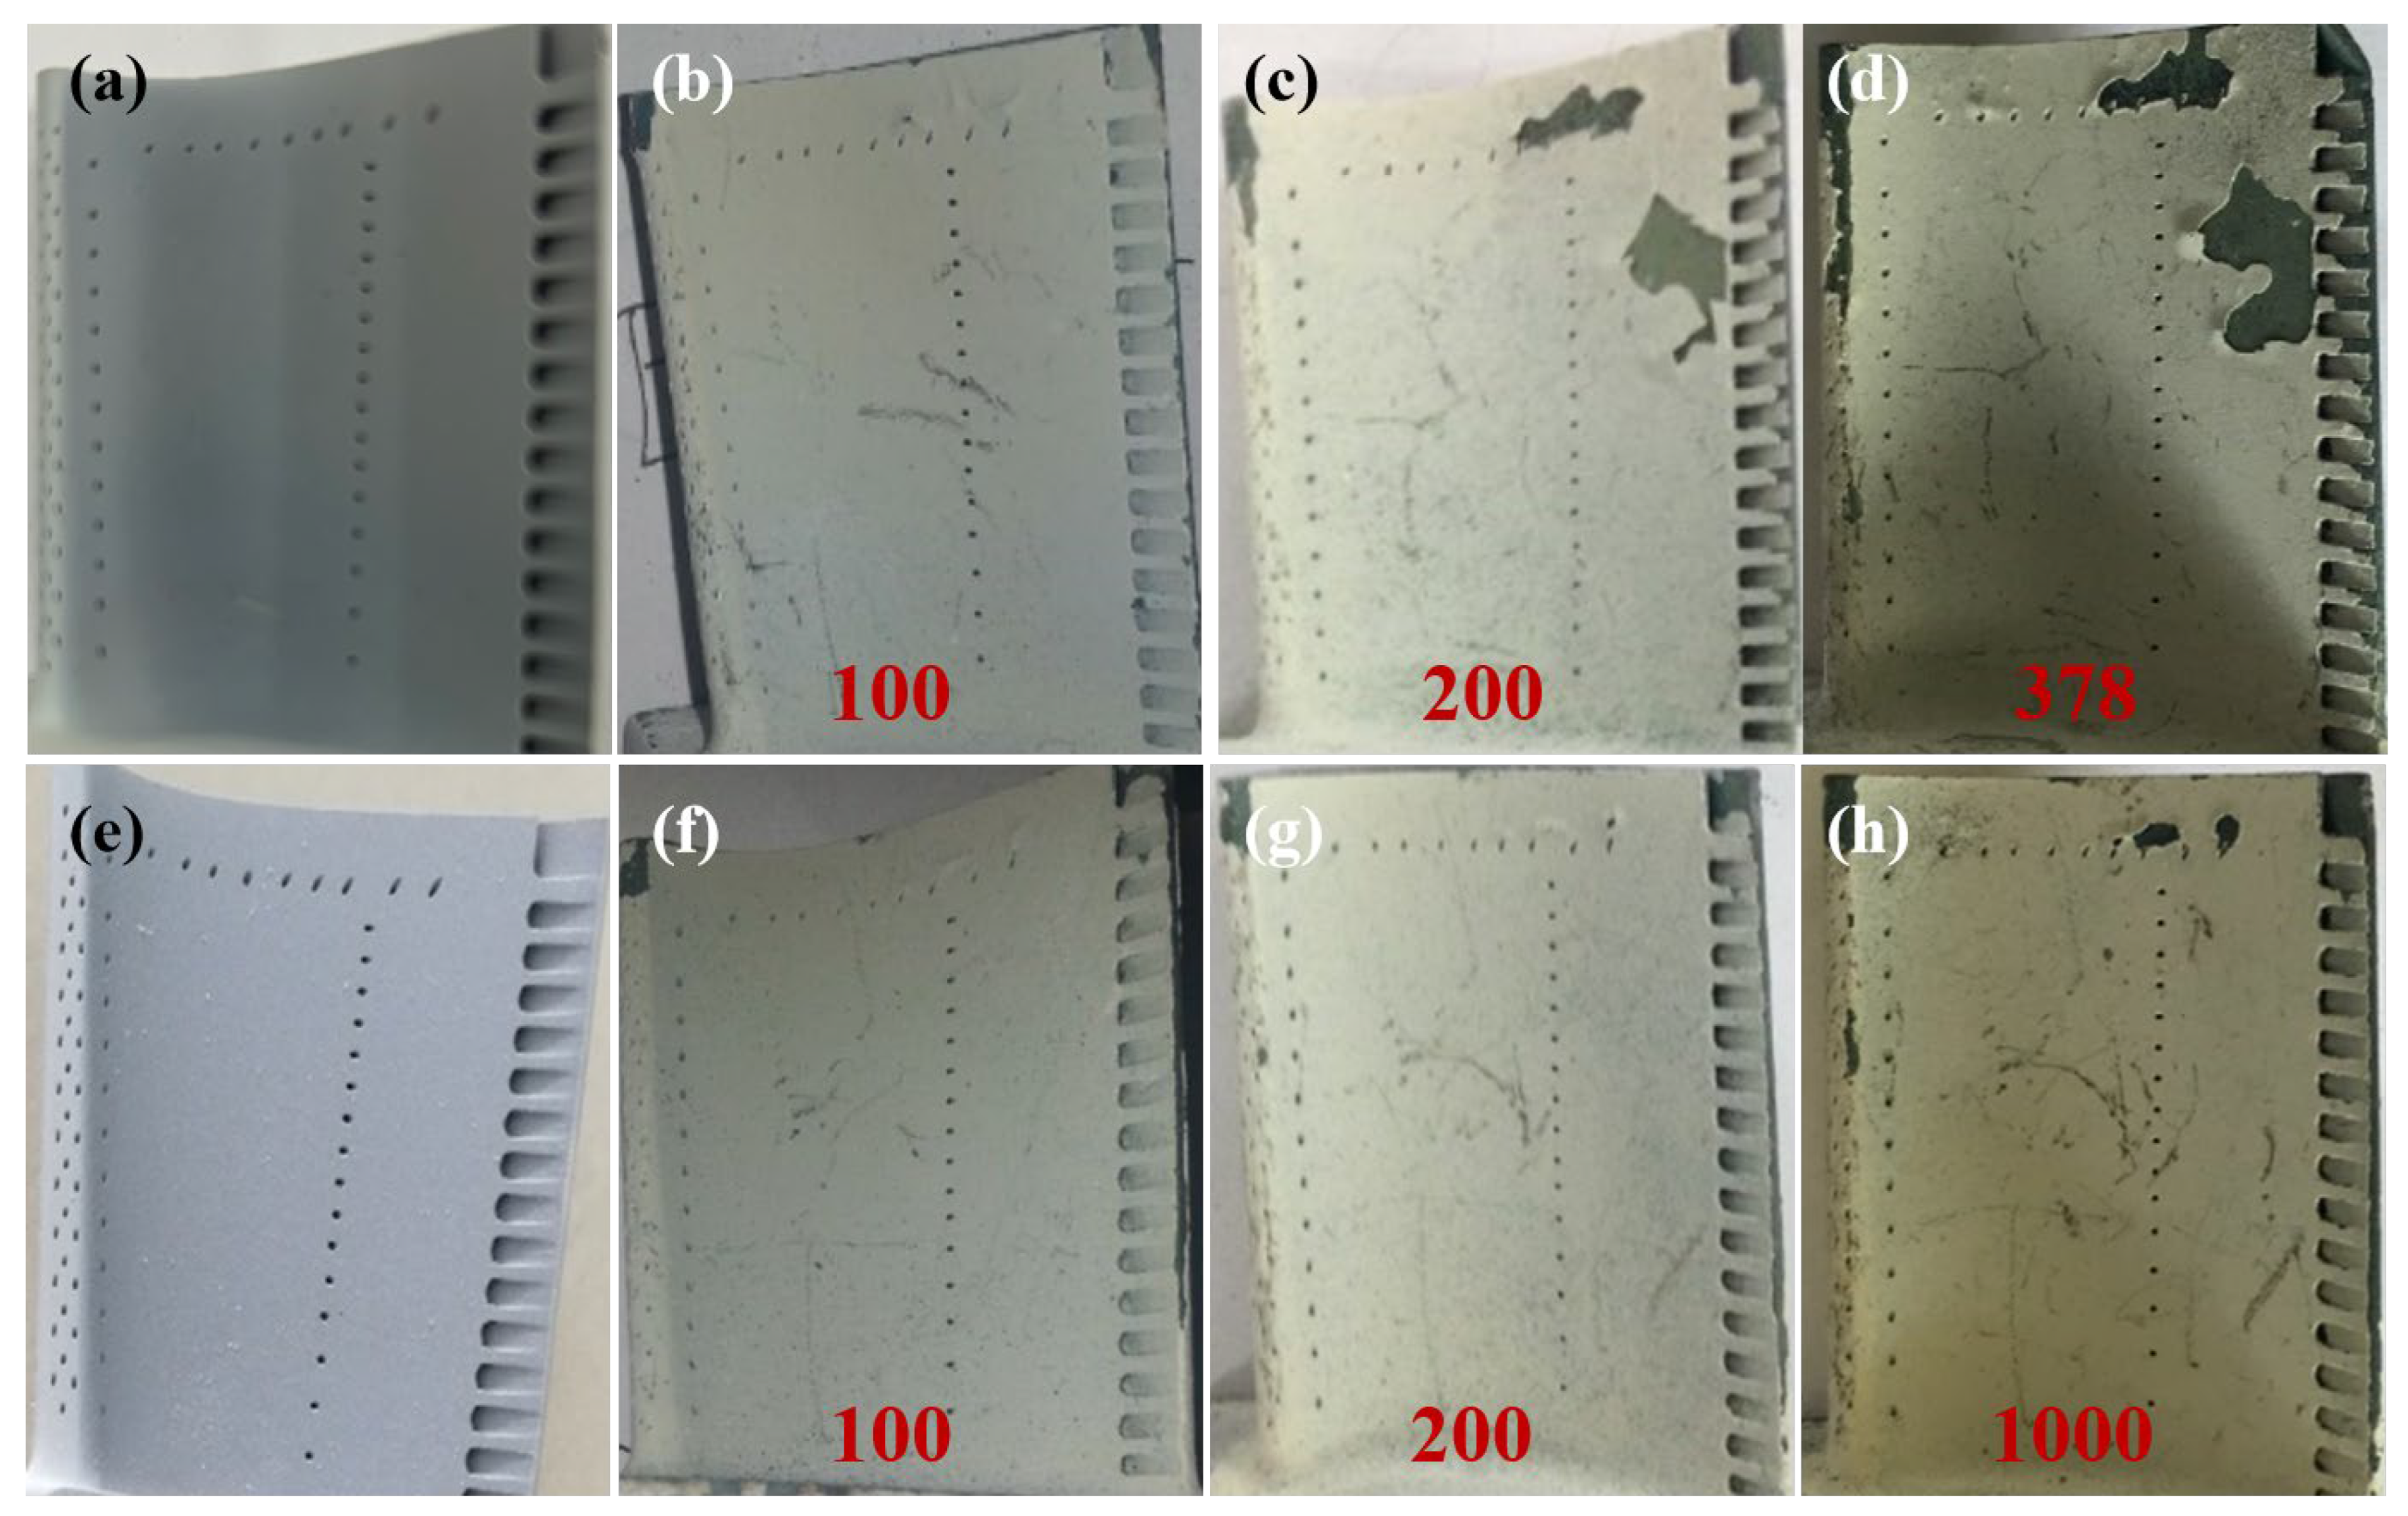
Figure 2a shows the surface morphology of the original BS1 coating prepared without oxygen flow, which appears dark in color. When the YSZ coating appears dark in color, it is an indication of oxygen deficiency in the zirconia [17]. The morphology of the BS1 coating shown in Figure 2b remained intact after 100 thermal shocks. There was considerable spallation over a large area only after 200 cycles. After 378 cycles, the sample’s exfoliation area had far exceeded the specified 5% requirement. As indicated in Figure 2e, the surface color of the as-deposited morphology of the BS2 is white, indicating that it is normal zirconia with sufficient oxygen. Compared with the as-deposited sample, the BS2 sample showed no significant spallation after 100 and 200 cycles. After 1000 cycles, the BS2 sample showed only minor flaking. From the thermal shock results, it can be observed that the BS2 sample has far superior thermal shock resistance to the BS1 sample, indicating that oxygen flow has a significant impact on the thermal shock resistance of the coating. BS1 after 378 cycles and BS2 after 1000 cycles were used for subsequent SEM, XRD, and TEM characterization. It should be pointed out that all surface scratches were caused by clamping the samples during the experiment.

3.3. Crystallographic Texture Evolution

Figure 3a,b show the surface XRD patterns of BS1 and BS2 in their original deposited state and after thermal shock, respectively. In Figure 3a, the BS1 sample is mainly composed of the t-ZrO1.88 phase, which is not the conventional t-ZrO2 phase expected after EB-PVD deposition. This may be due to insufficient oxygen elements during the deposition process, leading to an increase in oxygen vacancies and the formation of a non-stoichiometric phase. However, the phase composition of the BS1 sample changed to the t-ZrO2 phase after thermal shock. Compared with the XRD patterns of the as-deposited sample, the peak position of the BS1 sample shifted to the left after thermal shock, indicating that the oxygen element entered the coating to fill the oxygen vacancies and formed chemically stoichiometric ZrO2 at the high temperature of thermal shock. The XRD results of the original BS2 sample in Figure 3b indicated that the sample prepared with 60 sccm oxygen flow was mainly composed of the t-ZrO2 phase. Furthermore, the BS2 sample exhibited a strong preferential orientation along the “200” plane. The strong preferential orientation commonly observed in EB-PVD YSZ samples was highly influenced by the preheating temperature and deposition time [10], vapor incident angle [18], and substrate rotation mode [15]. Compared with the as-deposited sample, the composition and preferred orientation of the BS2 did not significantly change after thermal shock. The XRD results showed that the oxygen flow rate also has a strong effect on the coating texture.
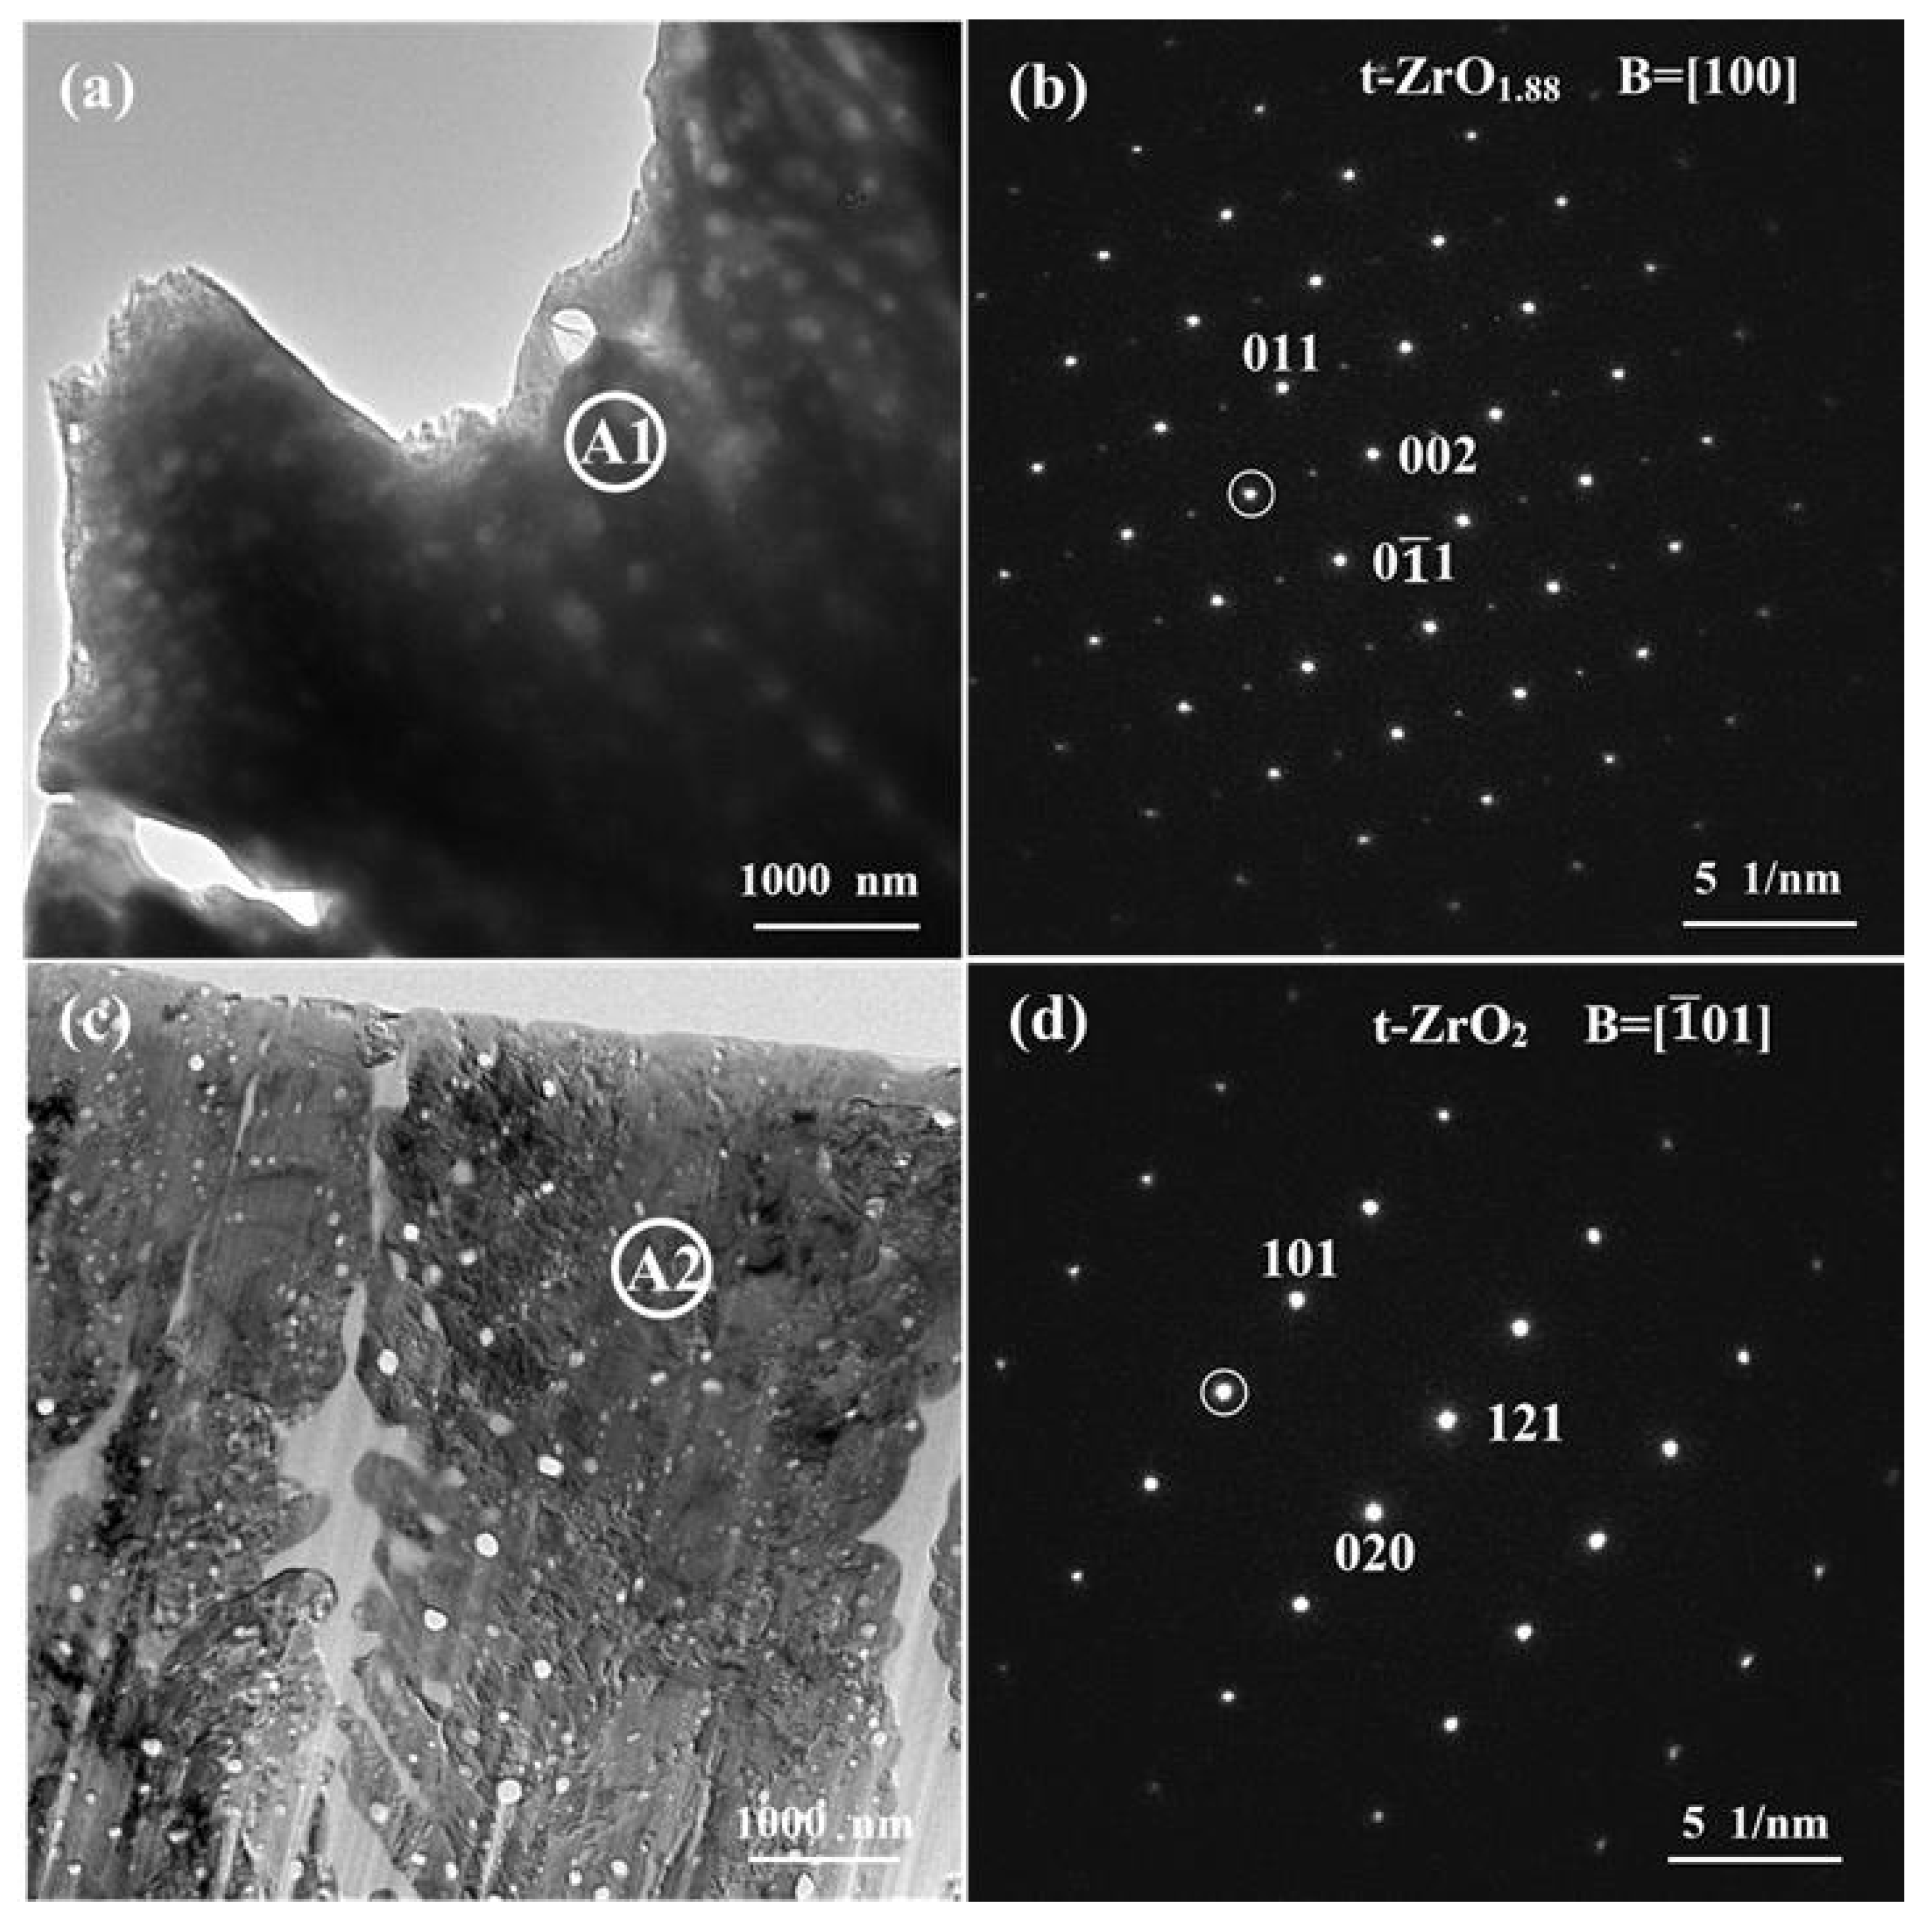
To further reveal the microstructural and phase evolution of the without-oxygen flow YSZ coating caused by thermal shock, a comparative study was conducted using the TEM on the as-deposited and after thermal shock samples. Figure 4a is a TEM image of the as-deposited BS1 coating, which consists of columnar grains with a large number of small voids. The SAEDP (Figure 4b) can be well indexed with t-ZrO1.88, consistent with the XRD analysis shown in Figure 3a. Figure 4c shows the sample cut by the FIB after thermal shock, which also displays columnar grains with the typical feather-like morphology. Figure 4d shows the SAEDP of region A2, which can be well indexed using t-ZrO2, consistent with the XRD analysis shown in Figure 3b. TEM results further confirmed that the phase structure of the without-oxygen gas flow prepared coating was t-ZrO1.88 due to insufficient oxygen in the coating, while after thermal shock, the phase structure changed to t-ZrO2 due to the addition of oxygen. Volume changes caused by phase transformation may reduce the strain tolerance of the EB-PVD coating and induce stress in the coating, leading to delamination and spallation.

3.4. Microstructure Analysis of Surfaces and Cross-Sections

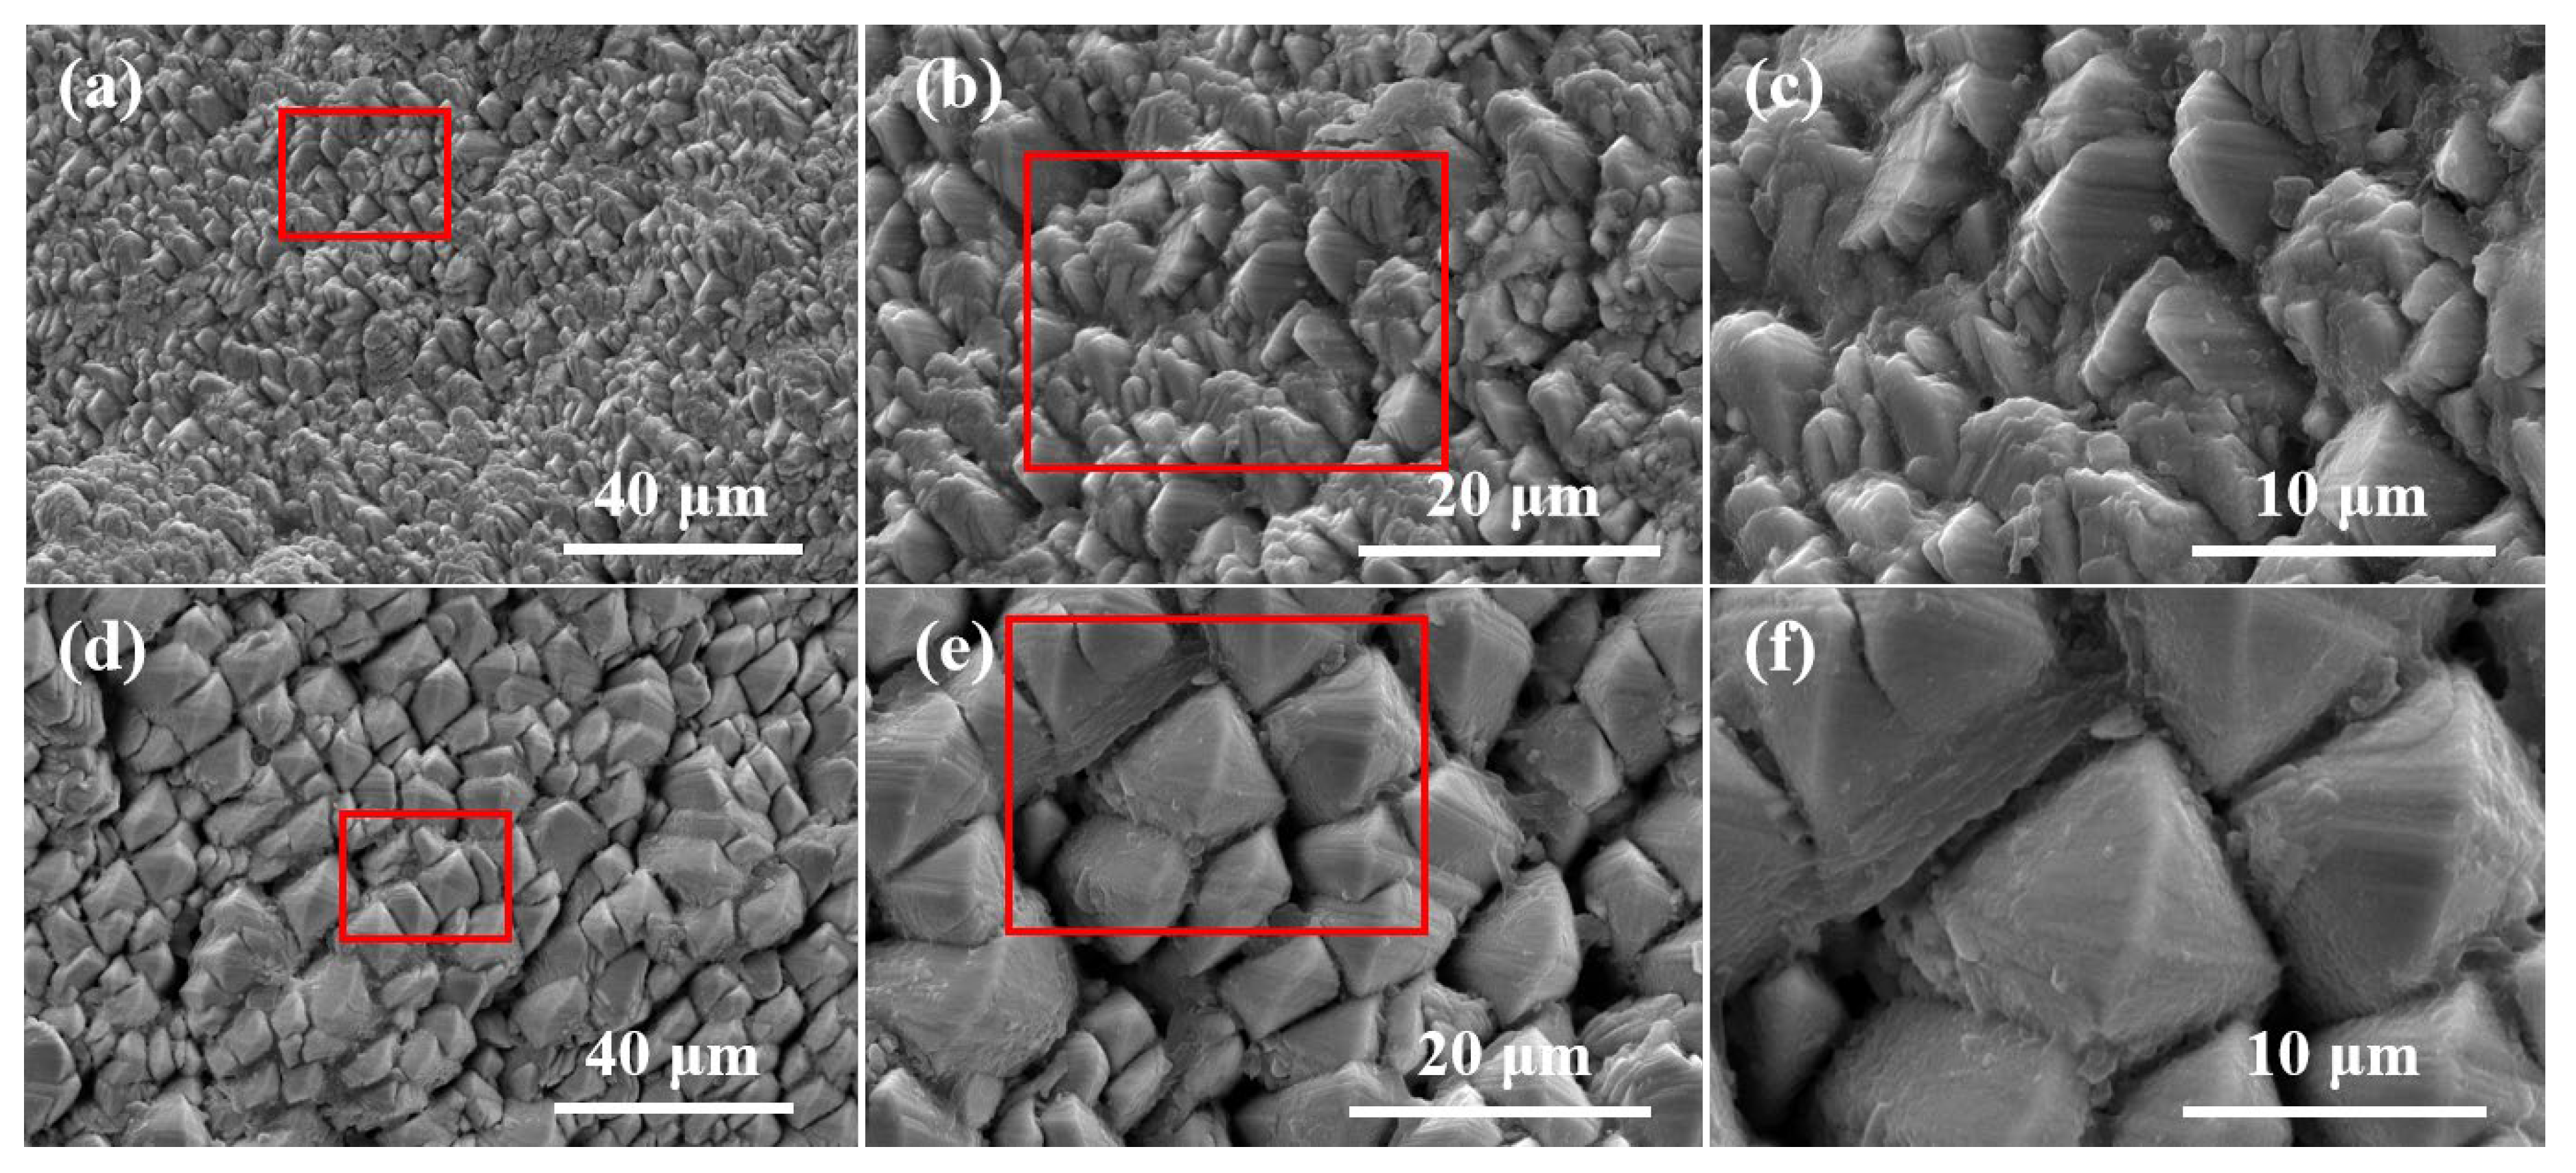
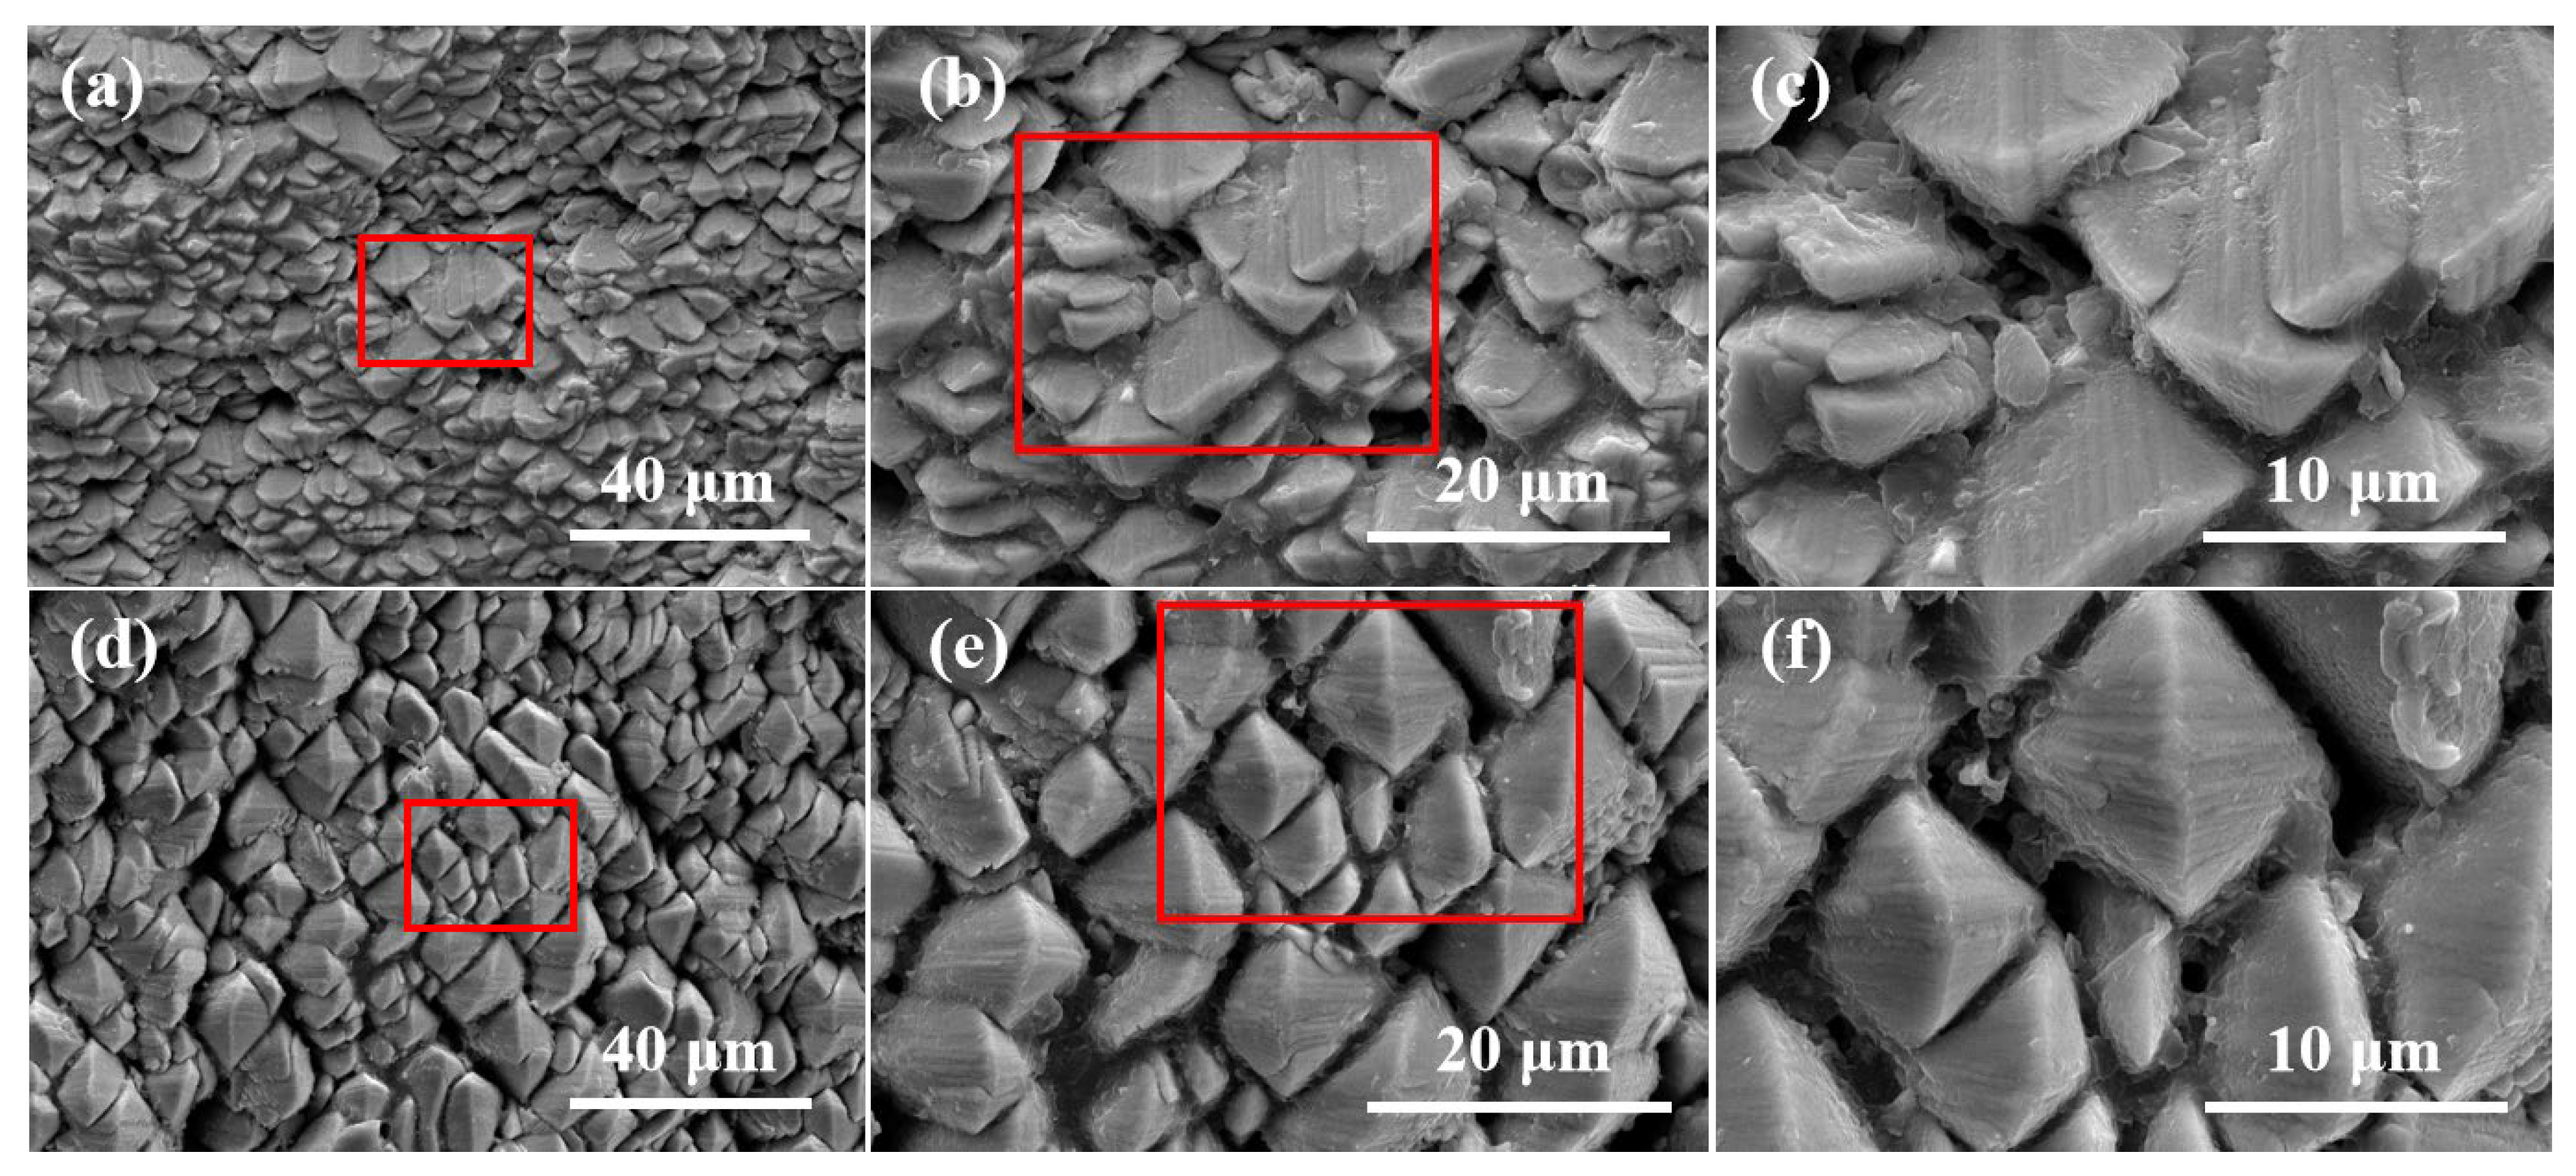
To determine how the microstructure of the coating changes under varying oxygen flow processing conditions and thermal shock, detailed SEM observations were conducted on the surface and cross-section. Figure 5 shows the surface morphology of as-deposited samples under different oxygen flow conditions. Figure 5a–c show the surface morphology of the BS1 sample without oxygen flow at different magnifications. The BS1 sample showed a less faceted morphology with a grain size smaller than 5 μm. However, Figure 5d–f show that the surface morphology of the BS2 sample exhibited a faceted surface morphology with a typical particle size between 5 and 15 μm. This is consistent with the conventional YSZ surface morphology reported in the literature [19,20]. The surface morphology of the two samples after thermal shock is presented in Figure 6. The morphology of BS1 samples still showed a less faceted morphology after thermal shock (see Figure 6a–c). Compared with the morphology of the BS2 sample in the as-deposited state (see Figure 5d–f), the morphology of BS2 after thermal shock shown in Figure 6d–f also had no obvious changes. Thermal shock has little effect on the surface morphology of both coatings.
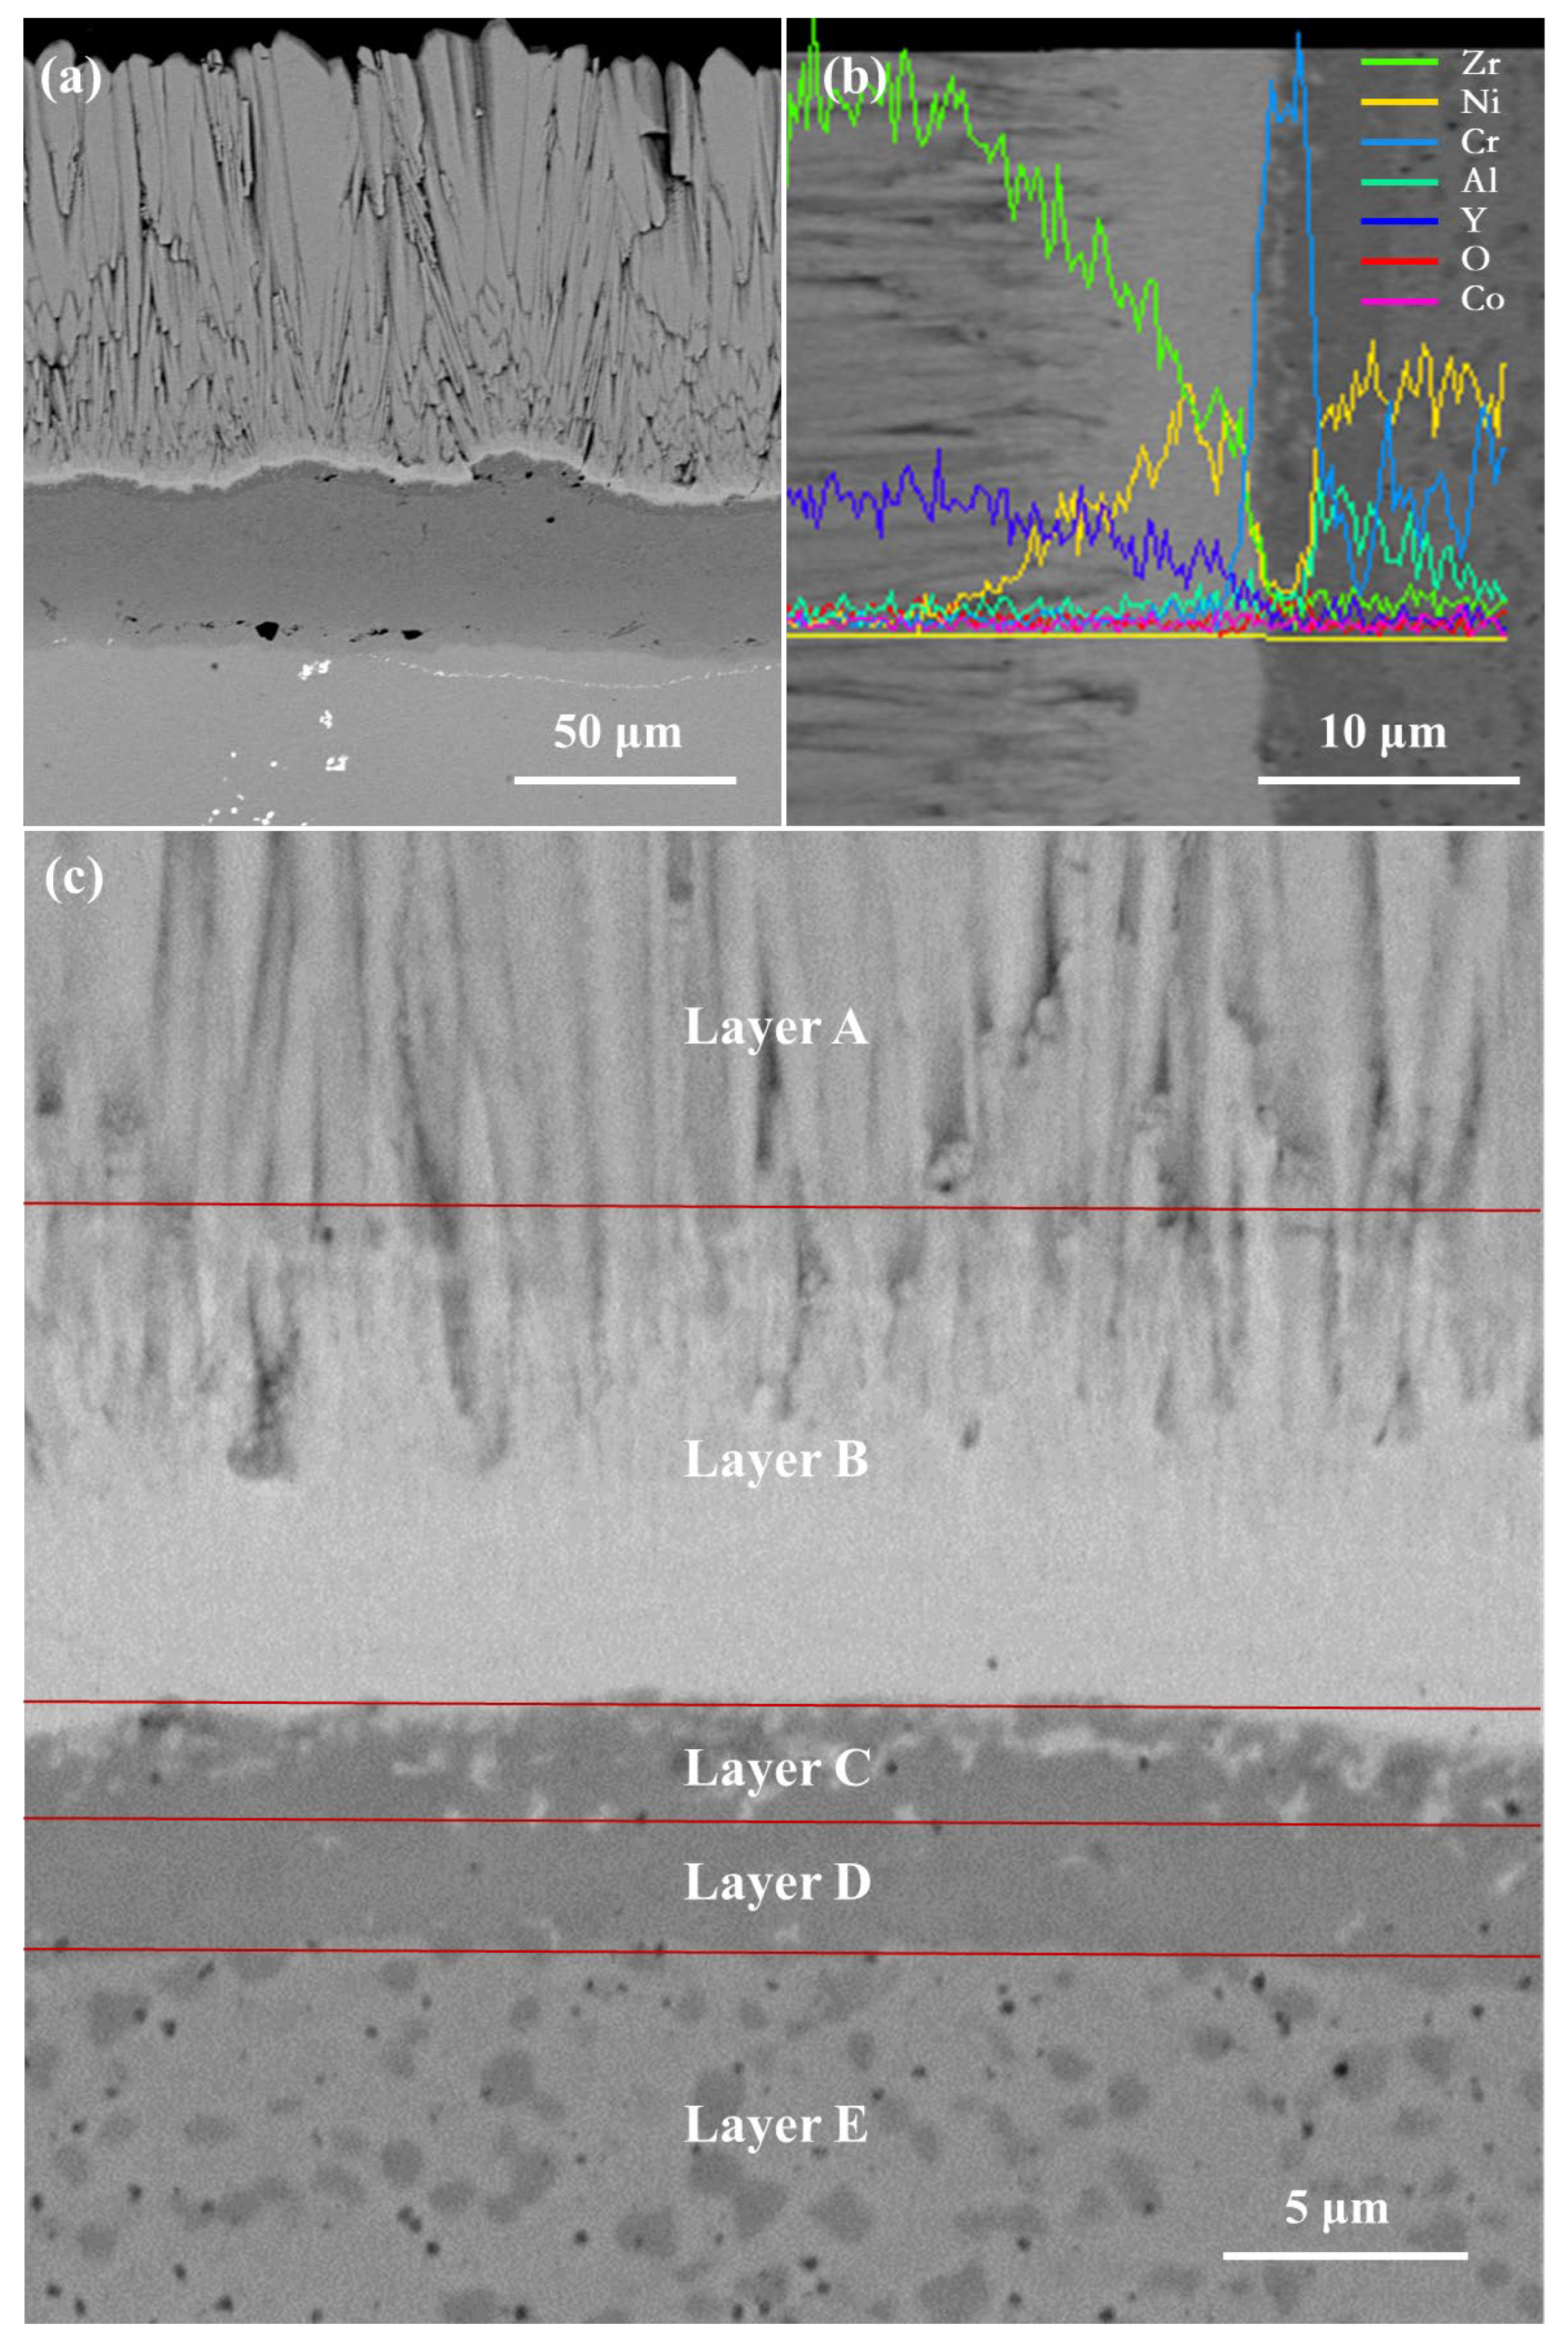
Figure 7 shows a cross-sectional SEM image of the BS1 sample. As can be observed in Figure 7a, the ceramic layer has very fine and dense columnar crystals, which corresponds to the surface morphology shown in Figure 5a–c. It is worth noting that a distinct gray mixed layer between the ceramic layer and BC layer, similar to that found in the flat plate sample (see Figure 1e) was observed. To further analyze the interface layer, Figure 7b shows the EDS line scan results at the interface. Figure 7c shows a high-magnification image of the interface. Based on the EDS in Figure 7b and the morphology in Figure 7c, layer A (marked in Figure 7c) was mainly composed of Zr, which suggests that this layer is a YSZ ceramic layer. Layer B was rich in Ni and Zr elements, which may be a mixed layer formed by zirconia and the melting of Ni in the BC layer. Layer C was rich in Cr element, which was formed when Ni melts and the remaining Cr in BC precipitate. Layer D consists mainly of Ni and Al, which may be a mixture of Ni and Al remaining after the accumulation of Cr from layer BC in layer C. The layer E consisted of normal BC layer components. From the above analysis, it can be seen that the YSZ coating prepared without oxygen flow formed a very complex intermediate layer at the YSZ and BC interface.
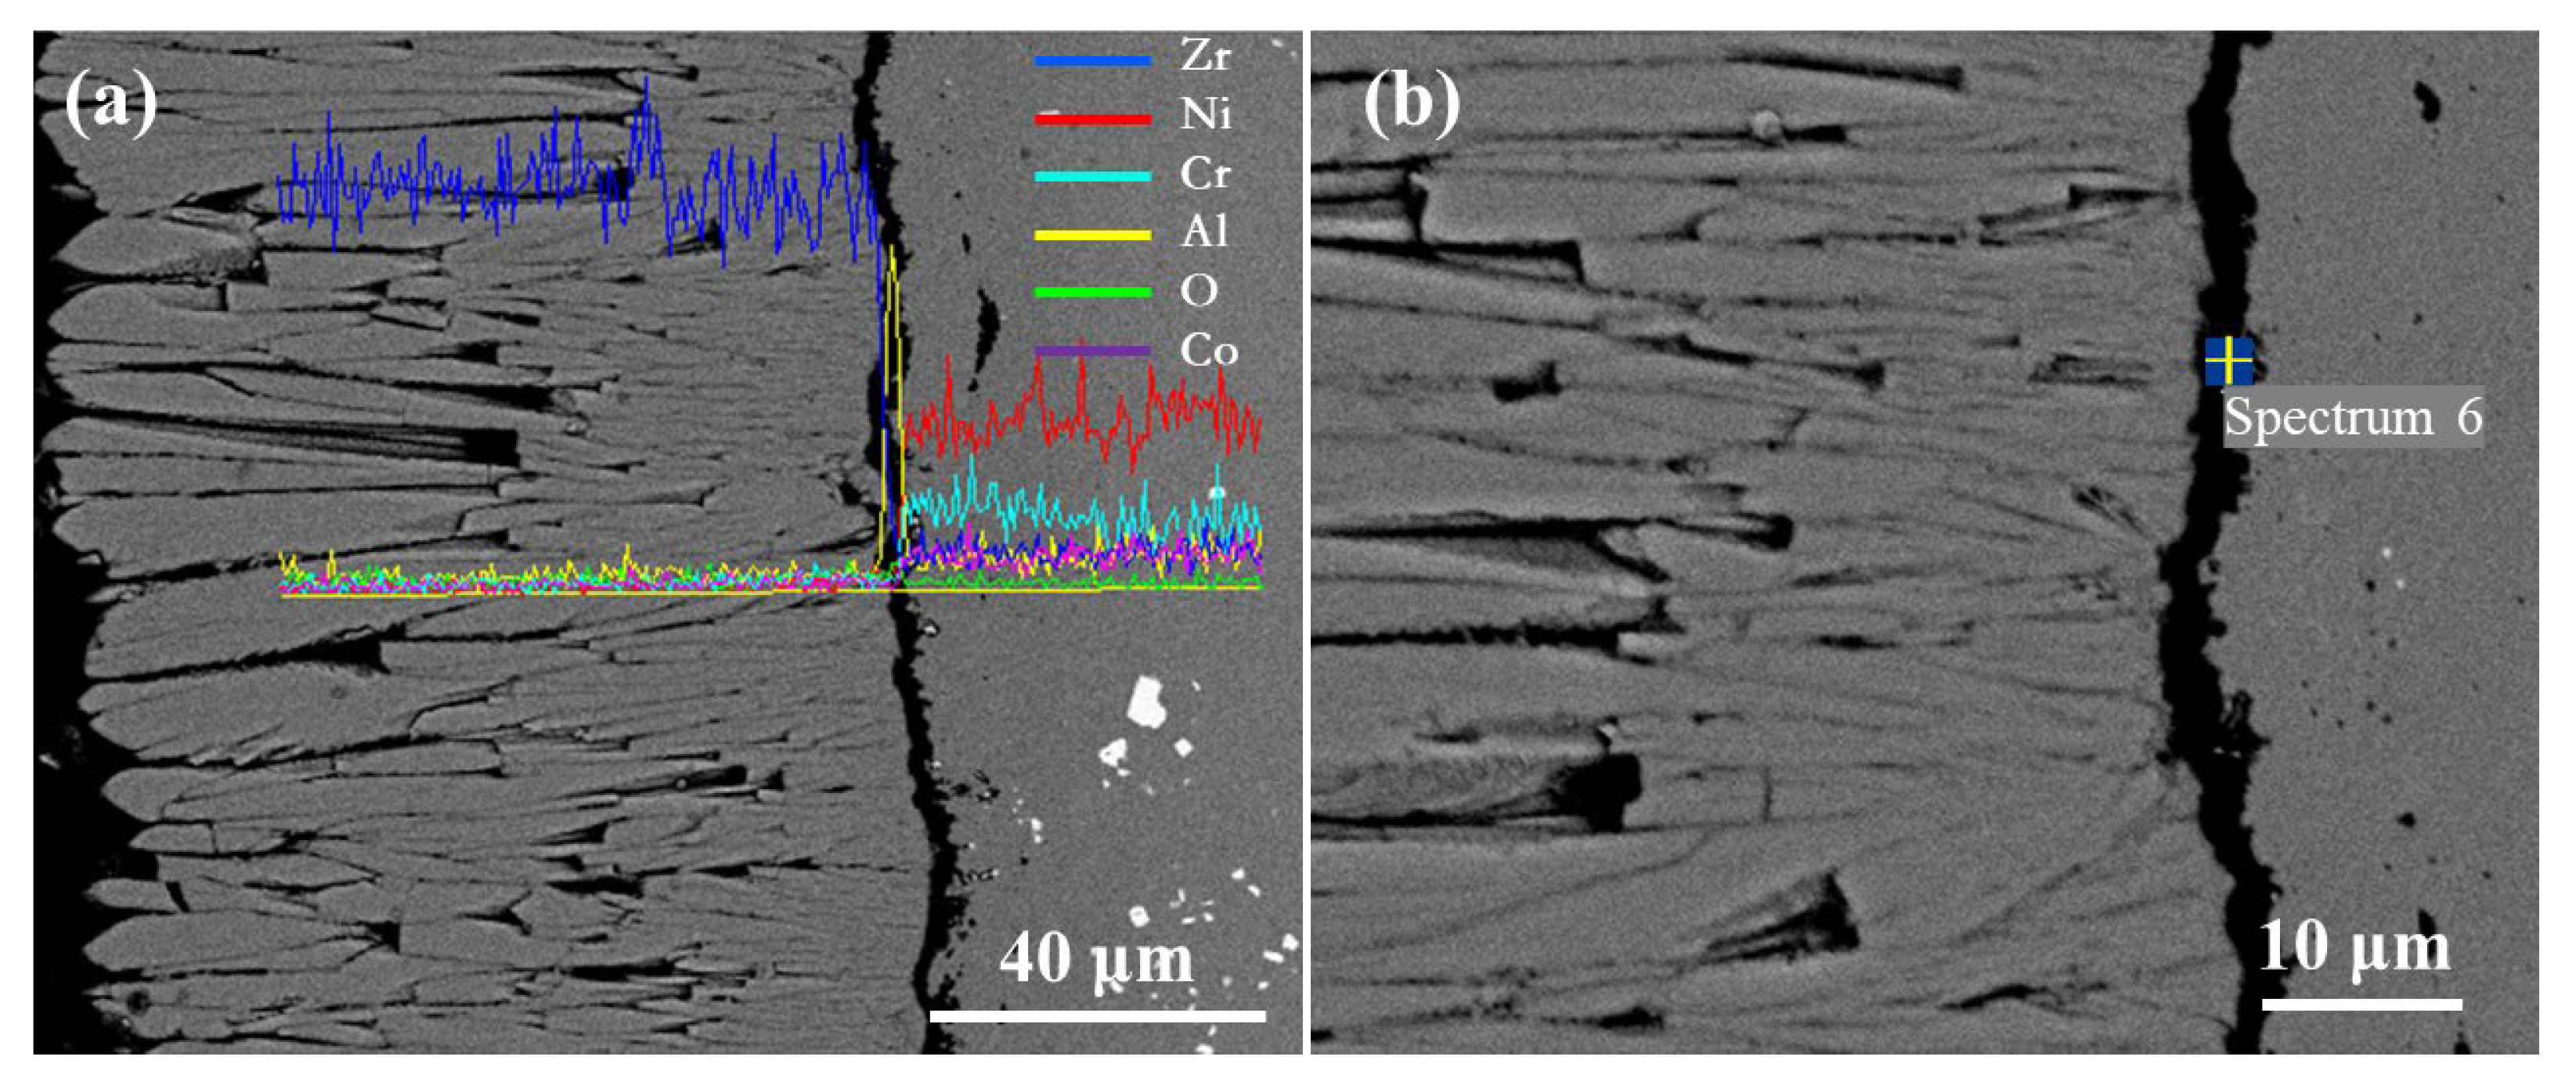
Figure 8a shows a cross-sectional view of the BS2 sample, with the ceramic layer exhibiting distinct columnar crystals and typical EB-PVD feather-like structures. The gray intermediate layer that presented in the BS1 sample was not detected between the ceramic layer and BC. Compared with the BS1 sample, the columnar crystal diameter of the BS2 sample was found to be large, which is consistent with the surface morphology results shown in Figure 5. The EDS results (Figure 8b) indicate that a thin layer of aluminum oxide was formed at the interface.
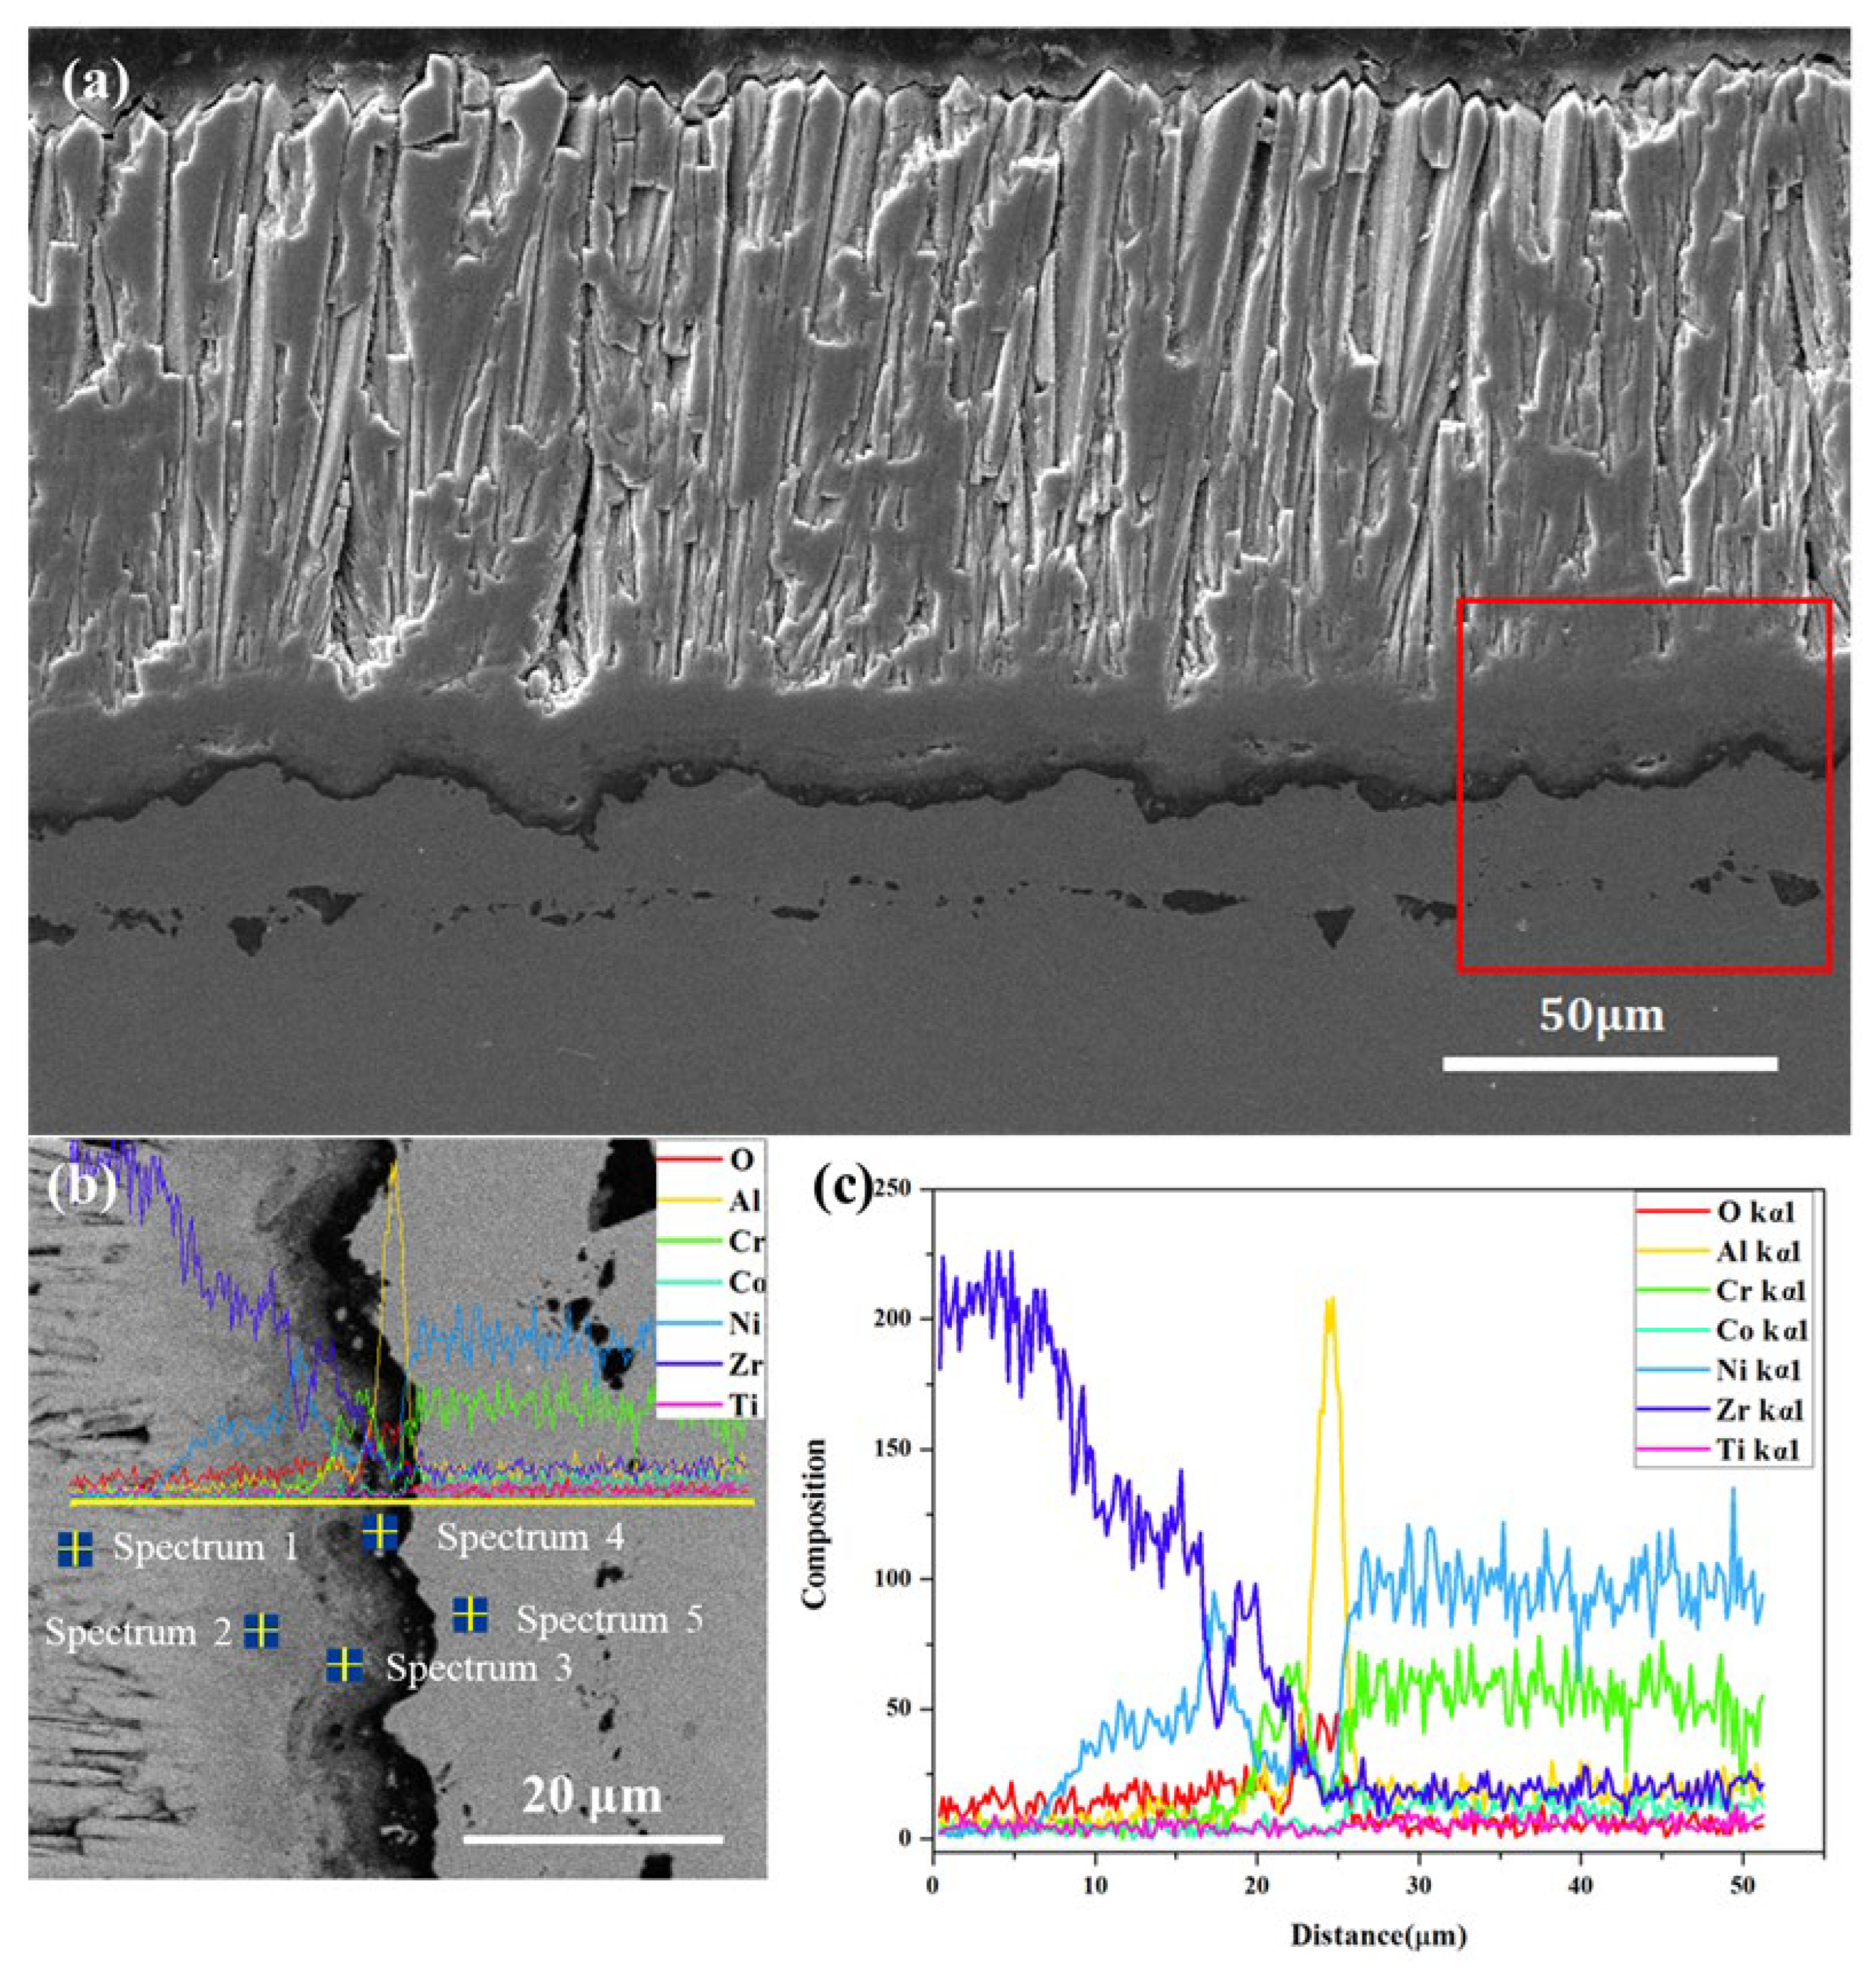
Figure 9 shows the SEM image of the BS1 sample after thermal shock. The ceramic top layer still maintained a dense columnar crystal structure after thermal shock (Figure 9a). Compared with the as-deposited BS1 sample (see Figure 7a), there was no obvious change in the morphology of the ceramic layer. Figure 9b shows a magnified image of the area marked with a red rectangle in Figure 9a. Figure 9c shows the EDS results marked with yellow lines in Figure 9b. The EDS results for each point marked in Figure 9b are given in Table 2. Combined with the EDS data in Figure 9c and Table 2, the area marked as Spectrum 1 in Figure 9b was the zirconia ceramic layer. Spectrum 2 mainly consisted of Ni and Zr oxides, corresponding to further oxidation of the Ni- and Zr-rich Layer B. Spectrum 3 consisted of oxides of Ni, Al, Cr, and Zr, corresponding to the oxides in Layer C and Layer D. The Spectrum 4 region mainly consisted of Al oxides, which are consistent with typical TGO components. The Spectrum 5 region was mainly composed of elements from the BC, which was the unoxidized BC layer. As shown in Figure 9b,c, the thermally grown oxide layer formed a thickness of 10 μm after only 378 cycles. According to the parabolic growth law of TGO thickness [21], the oxidation rate of the BS1 sample in this study was very fast. Due to the rapid oxidation of the BS1 sample interface during thermal shock, the coating exhibited large-area spallation after 378 cycles (see Figure 2d). In addition, unlike typical TGO layers, which were mainly composed of aluminum oxide, the oxide layer of BS1 contained oxides of various components, such as Ni, Al, Cr, and Zr.
Figure 10 shows the cross-sectional morphology and the EDS line scan results of the BS2 sample after thermal shock. Compared with the as-deposited sample (see Figure 8a), the columnar crystal structure of the ceramic layer after thermal shock did not noticeably change. Figure 10b shows a magnified image at the interface. From EDS data for spectrum 6 in Table 2., it can be observed that the main component of the oxide layer is aluminum oxide, with a thickness of approximately 2 μm, which is much smaller than that of the BS1 sample. Compared to Figure 8b, the preoxidation layer formed at the interface during deposition prevents further oxidation, thereby improving the thermal shock life of BS2.

3.5. Influence of Oxygen Gas Flow

The above results indicate that the oxygen flow rate during the preparation process has a significant impact on the phase structure, microstructure, and thermal shock life of the coating. First, BS2 exhibited strong preferential orientation along the “200” plane, while BS1 did not exhibit obvious preferential orientation. It has been confirmed that the grain size and preferential orientation of YSZ thin films prepared using electron beam evaporation technique changed as a function of deposition rate and oxygen partial pressure [22]. Second, an intermediate layer was observed at the interface between the ceramic layer and the BC layer of the BS1 sample, which has rarely been reported in other literature. Based on the EDS results, the main elements in the intermediate layer are Zr and Ni, suggesting that this layer was formed by the combination of the BC layer and ZrO2 of the ceramic layer. A possible reason was that during electron beam heating, the energy density is very high, resulting in local temperatures exceeding the actual substrate temperature measured by the thermocouple. The excessively high temperature caused the BC layer to mix with ZrO2 vapor to form an intermediate layer. Rapid oxidation of the intermediate layer caused premature spalling of the YSZ coating during thermal shock. When oxygen was introduced, the oxygen flow may remove some of the heat, causing the substrate surface to cool. Simultaneously, the oxygen flow reacted with the active element Al in the BC layer to form a very thin aluminum oxide layer (see Figure 8), thereby preventing further oxidation of the BC layer. Therefore, the BS2 sample with oxygen flow exhibited excellent thermal shock resistance. Finally, during the EB-PVD coating preparation process, the oxygen flow and vacuum pumping rate were set to obtain the desired vacuum level [23]. If the oxygen flow rate was ignored in order to obtain a high vacuum, it may have resulted in the preparation of coatings with insufficient oxygen. These not fully oxidized phases (see the XRD results in Figure 3a) subsequently underwent oxidation in thermal shock, resulting in growth stresses, which was likely to cause coating spalling [17]. In summary, adjusting the oxygen flow parameters during the EB-PVD preparation process played a very important role in the structure and performance of the coating.

4. Conclusions

Oxygen flow rate is an important parameter in the preparation of YSZ coatings by the EB-PVD method. In this paper, by variation in this parameter, TBC samples without oxygen and with a 60 sccm oxygen flow rate were prepared on turbine blades, and then changes in coating morphology and crystallographic phase properties were systematically investigated. Thermal cycling shock experiments were performed to compare the phase structure and microstructure changes in the two samples before and after thermal shock. The following major results were obtained.
The without-oxygen flow coatings showed a very fine and dense columnar structure with less inter-columnar gaps and no preferred growth orientation. It is remarkable that BS1 coatings without oxygen have an intermediate layer at the ceramic coating and BC interface, which is not commonly found in the standard EB-PVD coatings. In contrast, the coating deposited at an oxygen flow rate of 60 sccm exhibited distinct columnar crystals with inter-columnar gaps, no intermediate layer, a typical feather-like structure, and a strong preferential orientation along the “200” direction.
Samples with oxygen flow exhibited significantly higher thermal shock resistance than those without oxygen flow. During preparation, the absence of oxygen flow resulted in excessively high temperatures on the substrate surface, leading to the formation of a mixed layer. After thermal shock, structural analysis revealed that the mixed layer structure formed at the interface under oxygen-free conditions significantly reduced the thermal shock life. During thermal shock, the mixed layer rapidly oxidizes to form a thickness far exceeding that of a normal oxide layer, leading to coating spalling. Oxygen flow during preparation may reduce the substrate surface temperature and form the preliminary oxidation layer, which can prevent further oxidation during thermal shock.
The analysis of the experimental results explains that the thermal shock life can be attributed to the variation in microstructure in YSZ coating as a function of the deposition oxygen flow rate. This further illustrates the close relationship between the EB-PVD preparation process, microstructure, and service performance of thermal barrier coatings. Therefore, selecting the appropriate preparation conditions is fundamental to improving coating performance.

Author Contributions

K.H.: Conceptualization, Funding acquisition, Resources, Writing—original draft. C.X.: Investigation, Methodology. Z.H.: Investigation, Writing–review and editing. J.X.: Funding acquisition, Project administration. L.Z.: Writing–review and editing. X.Z.: Data curation, Formal analysis. T.L.: Supervision, Validation. All authors have read and agreed to the published version of the manuscript.

Funding

This work was supported by the Scientific Research Fund of the Hunan Provincial Education Department (23A0635) and the Guizhou Provincial science and technology support project Guizhou cosupports [2022] general 054.

Institutional Review Board Statement

Not applicable.

Informed Consent Statement

Not applicable.

Data Availability Statement

All data included in this study are available upon request by contact with the corresponding author.

Conflicts of Interest

Authors Keli Huo, Chunhui Xu, and Xiaoshan Zhang are employed by the company Guiyang AECC Power Precision Casting Co., Ltd. The remaining authors declare that the research was conducted in the absence of any commercial or financial relationships that could be construed as a potential conflict of interest.

References

  1. Perepezko, J.H. The hotter the engine, the better. Science 2009, 326, 1068–1069. [Google Scholar] [CrossRef]
  2. Liu, B.; Liu, Y.; Zhu, C.; Xiang, H.; Chen, H.; Sun, L.; Gao, Y.; Zhou, Y. Advances on strategies for searching for next generation thermal barrier coating materials. J. Mater. Sci. Technol. 2019, 35, 833–851. [Google Scholar] [CrossRef]
  3. Thakare, J.G.; Pandey, C.; Mahapatra, M.M.; Mulik, R.S. Thermal barrier coatings-a state of the art review. Met. Mater. Int. 2021, 27, 1947–1968. [Google Scholar] [CrossRef]
  4. Feuerstein, A.; Knapp, J.; Taylor, T.; Ashary, A.; Bolcavage, A.; Hitchman, N. Technical and economical aspects of current thermal barrier coating systems for gas turbine engines by thermal spray and EBPVD: A review. J. Therm. Spray Technol. 2008, 17, 199–213. [Google Scholar] [CrossRef]
  5. Mauer, G.; Vaßen, R. Coatings with columnar microstructures for thermal barrier applications. Adv. Eng. Mater. 2020, 22, 1900988. [Google Scholar] [CrossRef]
  6. Schulz, U.; Fritscher, K.; Leyens, C.; Peters, M. Influence of processing on microstructure and performance of electron beam physical vapor deposition (EB-PVD) thermal barrier coatings. J. Eng. Gas Turbines Power. 2002, 124, 229–234. [Google Scholar] [CrossRef]
  7. Movchan, B.A.; Demchishin, A.V. Study of structured properties of thick vacuum condensates of Nickel, Titanium, Tungsten, Aluminum oxide and zirconium dioxide. Fized Metall. Met. 1969, 28, 83–90. [Google Scholar]
  8. Messier, R.; Giri, A.P.; Roy, R.A. Revised structure zone model for thin film physical structure. J. Vac. Sci. Technol. A Vac. Surf. Film. 1984, 2, 500–503. [Google Scholar] [CrossRef]
  9. Thornton, J.A. High rate thick film growth. Annu. Rev. Mater. Sci. 1977, 7, 239–260. [Google Scholar] [CrossRef]
  10. Wada, K.; Yamaguchi, N.; Matsubara, H. Crystallographic texture evolution in ZrO2–Y2O3 layers produced by electron beam physical vapor deposition. Surf. Coat. Technol. 2004, 184, 55–62. [Google Scholar] [CrossRef]
  11. Yamaguchi, N.; Wada, K.; Kimura, K.; Matsubara, H. Microstructure Modification of Yttria-Stabilized Zirconia Layers Prepared by EB-PVD. J. Ceram. Soc. Jpn. 2003, 111, 883–889. [Google Scholar] [CrossRef]
  12. Das, D.K.; Lakshmi, S.G.; Rao, D.S.; Banumathy, S.; Singh, A.K. Microstructure, texture and thermal cycling performance of EB-PVD TBCs deposited under different processing conditions. High Temp. Mater. Process. 2011, 30, 539–548. [Google Scholar] [CrossRef]
  13. Teng, X.; Peng, H.; Li, L.; Guo, H. Investigation on crystal orientations in EB-PVD YSZ coatings under different substrate rotation mode. J. Eur. Ceram. Soc. 2023, 43, 5373–5380. [Google Scholar] [CrossRef]
  14. Matsumoto, M.; Wada, K.; Yamaguchi, N.; Kato, T.; Matsubara, H. Effects of substrate rotation speed during deposition on the thermal cycle life of thermal barrier coatings fabricated by electron beam physical vapor deposition. Surf. Coat. Technol. 2008, 202, 3507–3512. [Google Scholar] [CrossRef]
  15. Rao, D.S.; Valleti, K.; Joshi, S.V.; Janardhan, G.R. Processing-structure-property relationships in electron beam physical vapor deposited yttria stabilized zirconia coatings. J. Vac. Sci. Technol. A 2011, 29, 031501. [Google Scholar] [CrossRef]
  16. Guo, F.; Zhou, R.; Shang, Y.; Zhang, H.; Pei, Y.; Li, S.; Gong, S. Development of deposition beam current dependent microstructure and nanomechanical properties in ZrO2-8wt% Y2O3 thermal barrier coatings produced by electron beam-physical vapor deposition technique. Mater. Chem. Phys. 2021, 272, 124998. [Google Scholar] [CrossRef]
  17. Rösemann, N.; Ortner, K.; Petersen, J.; Schadow, T.; Bäker, M.; Bräuer, G.; Rösler, J. Influence of bias voltage and oxygen flow rate on morphology and crystallographic properties of gas flow sputtered zirconia coatings. Surf. Coat. Technol. 2015, 276, 668–676. [Google Scholar] [CrossRef]
  18. Wada, K.; Yoshiya, M.; Yamaguchi, N.; Matsubara, H. Texture and microstructure of ZrO2-4mol% Y2O3 layers obliquely deposited by EB-PVD. Surf. Coat. Technol. 2006, 200, 2725–2730. [Google Scholar] [CrossRef]
  19. Wolfe, D.E.; Singh, J.; Miller, R.A.; Eldridge, J.I.; Zhu, D.M. Tailored microstructure of EB-PVD 8YSZ thermal barrier coatings with low thermal conductivity and high thermal reflectivity for turbine applications. Surf. Coat. Technol. 2005, 190, 132–149. [Google Scholar] [CrossRef]
  20. Schulz, U.; Fritscher, K.; Leyens, C.; Peters, M.; Kaysser, W.A. Thermocyclic Behavior of Differently Stabilized and structured EB-PVD thermal barrier coatings. Mater. Werkst. 1997, 28, 370–376. [Google Scholar] [CrossRef]
  21. Wen, M.; Jordan, E.H.; Gell, M. Effect of temperature on rumpling and thermally grown oxide stress in an EB-PVD thermal barrier coating. Surf. Coat. Technol. 2006, 201, 3289–3298. [Google Scholar] [CrossRef]
  22. Xiao, Q.; He, H.; Shao, S.; Shao, J.; Fan, Z. Influences of deposition rate and oxygen partial pressure on residual stress and microstructure of YSZ thin films. Thin Solid Film. 2009, 517, 4295–4298. [Google Scholar] [CrossRef]
  23. Schulz, U.; Miinzer, J.; Kaclen, U. Influence of Deposition Conditions on Density and Microstructure of EB–PVD TBCs. In 26th Annual Conference on Composites, Advanced Ceramics, Materials, and Structures: B: Ceramic Engineering and Science Proceedings; John Wiley & Sons, Inc.: Hoboken, NJ, USA, 2002; pp. 353–360. [Google Scholar]
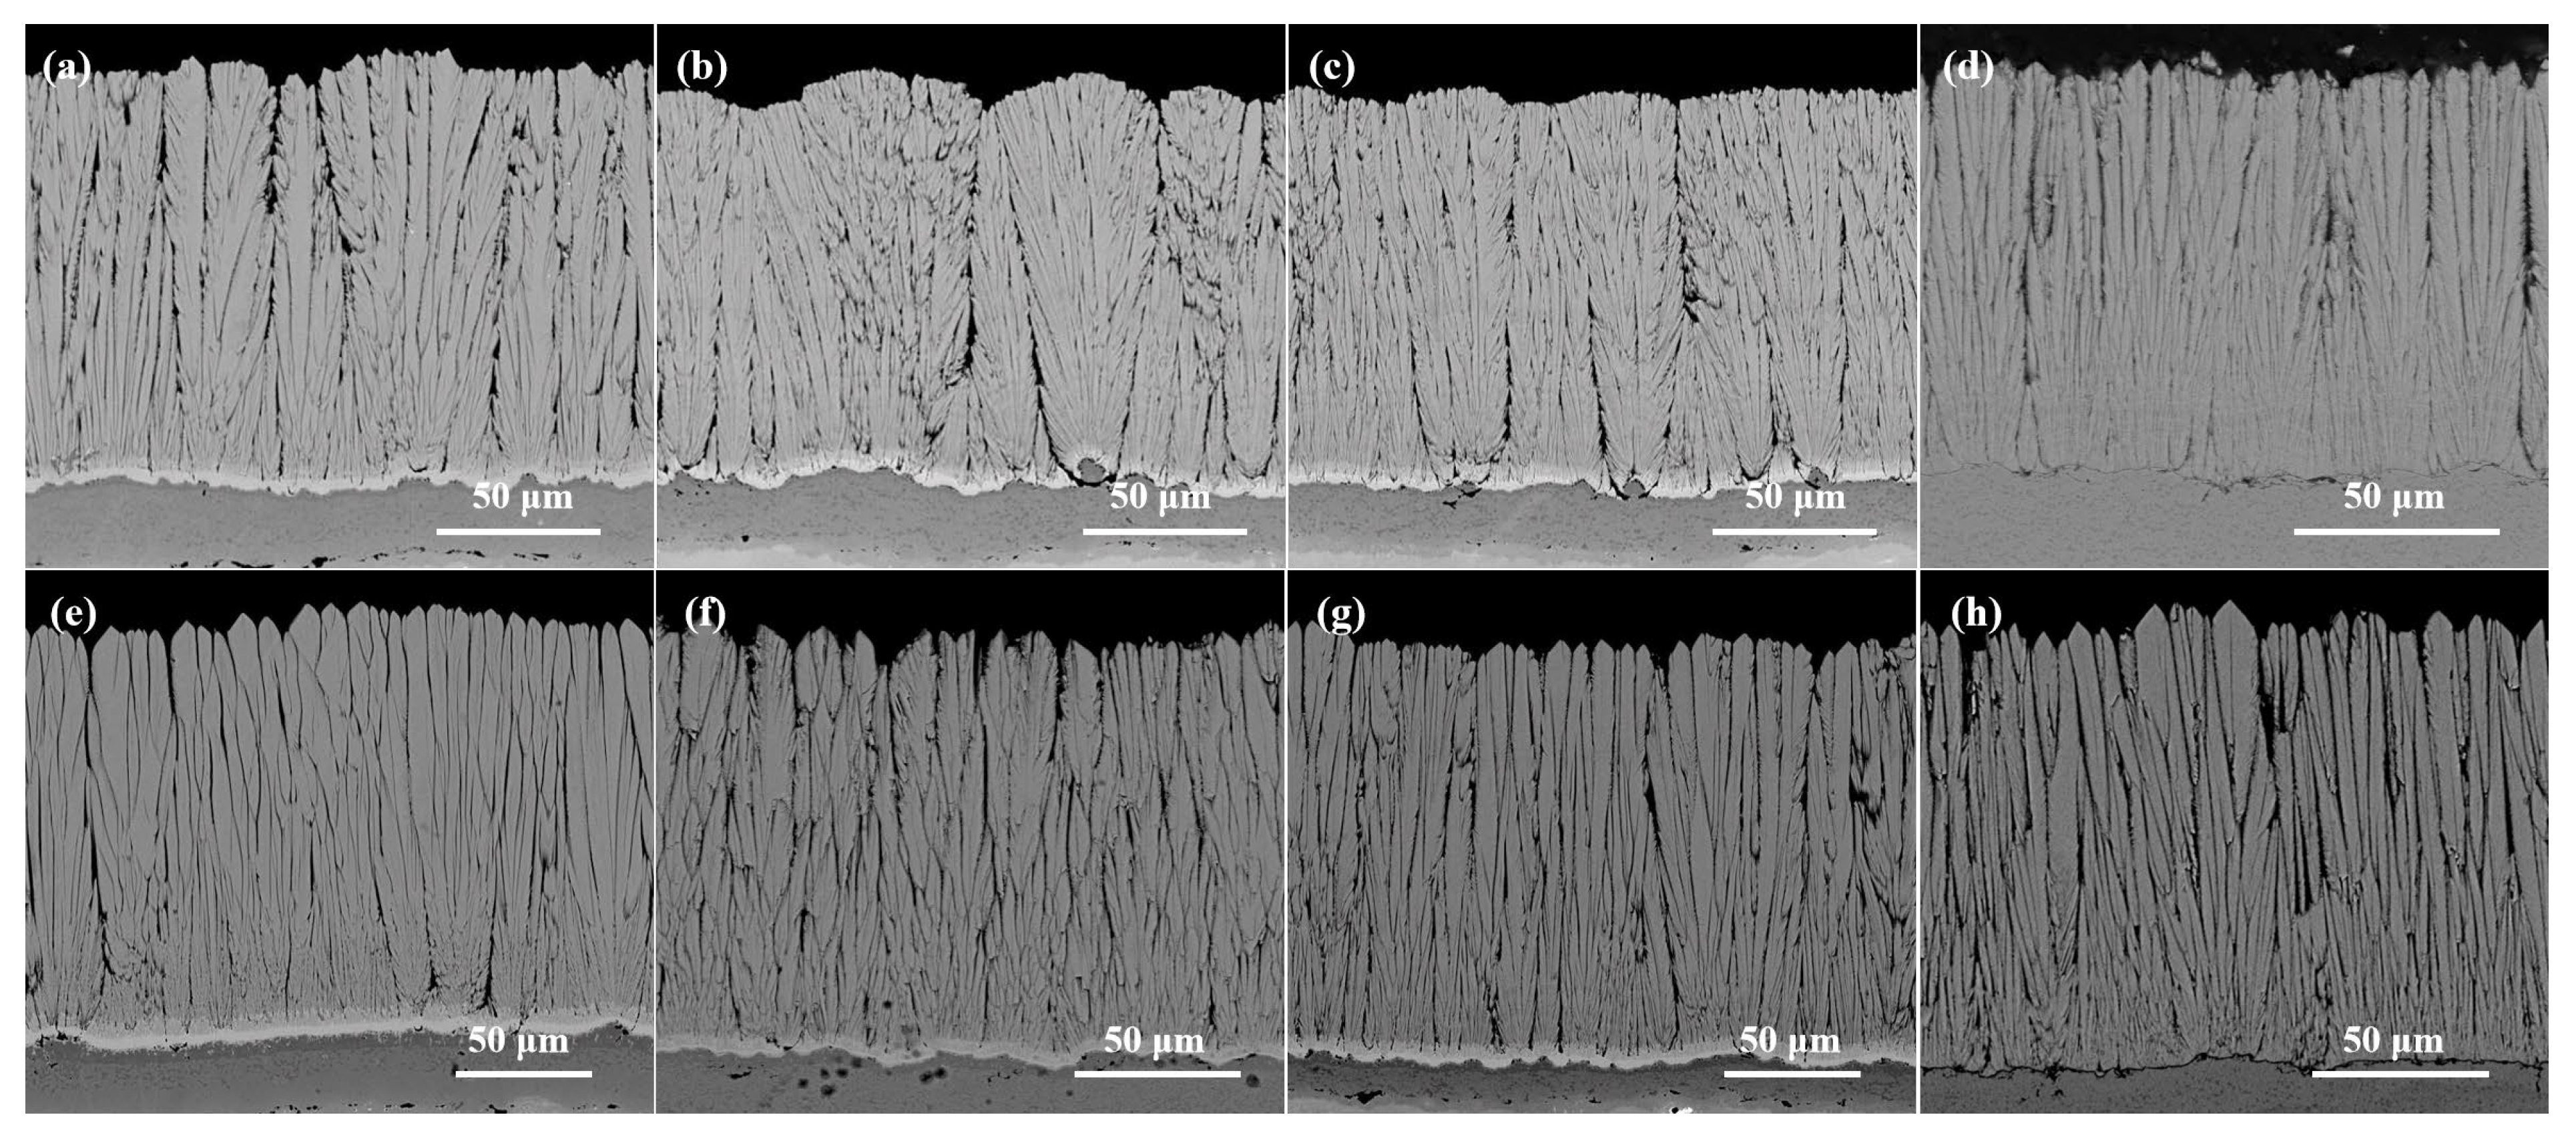
Figure 1. SEM images of flat plate specimens with different oxygen gas flow, (a) 0 sccm, (b) 20 sccm, (c) 40 sccm, and (d) 60 sccm at a substrate temperature of 850 °C; (e) 0 sccm, (f) 20 sccm, (g) 40 sccm, and (h) 60 sccm at a substrate temperature of 930 °C.
Coatings 15 00928 g001
Figure 2. The front view of blade samples with EB-PVD YSZ coatings subjected to thermal shock, (a) 0, (b) 100, (c) 200, and (d) 378 cycles of BS1, (e) 0, (f) 100, (g) 200, and (h) 1000 cycles of BS2.
Coatings 15 00928 g002
Figure 3. XRD patterns of (a) as-deposited and after thermal shock of BS1, (b) as-deposited and after thermal shock of BS2.
Coatings 15 00928 g003
Figure 4. (a) TEM image of BS1, (b) SAEDP of area A1 in (a); (c) TEM image of BS1 after thermal shock, and (d) SAEDP of area A2 in (c).
Coatings 15 00928 g004
Figure 5. (ac) the surface micrographs of as-deposited BS1, and (df) the surface micrographs of as-deposited BS2. The area marked by the red rectangle is magnified in the subsequent image.
Coatings 15 00928 g005
Figure 6. (ac) the surface micrographs of BS1 after thermal shock, and (df) the surface micrographs of BS2 after thermal shock. The area marked by the red rectangle is magnified in the subsequent image.
Coatings 15 00928 g006
Figure 7. The cross-section micrographs of as-deposited BS1, (a) SEM, (b) EDS line spectra, and (c) magnified SEM image.
Coatings 15 00928 g007
Figure 8. The cross-section micrographs of as-deposited BS2, (a) SEM, and (b) EDS line spectra.
Coatings 15 00928 g008
Figure 9. The cross-section micrographs of BS1 after thermal shock, (a) SEM, (b) magnified image marked by the red rectangle in (a), and (c) EDS line spectra.
Coatings 15 00928 g009
Figure 10. The cross-section micrographs of BS2 after thermal shock, (a) SEM with EDS line spectra, and (b) magnified image.
Coatings 15 00928 g010
Table 1. Electron beam physical vapor deposition parameters for YSZ coatings.
EB Power (kW)Pressure (Torr)Substrate Temperature (°C)Rotation (rpm)Oxygen Flow Rate
(sccm)
1010−5930100 (BS1)//60 (BS2)
Table 2. The EDS results marked in Figure 9 and Figure 10.
Element (at %)OZrNiSiAlCrTiCo
Spectrum 165.0634.94------
Spectrum 260.2526.5713.18-----
Spectrum 353.4317.5521.341.532.673.48--
Spectrum 452.752.124.05-37.513.300.26-
Spectrum 5-0.9259.002.8011.9519.77-5.56
Spectrum 643.39---54.542.07--
Disclaimer/Publisher’s Note: The statements, opinions and data contained in all publications are solely those of the individual author(s) and contributor(s) and not of MDPI and/or the editor(s). MDPI and/or the editor(s) disclaim responsibility for any injury to people or property resulting from any ideas, methods, instructions or products referred to in the content.