Article

Optimization of Welding Sequence and Improvement of Welding Process for Large-Diameter Curved Penetrations of Thick Plates

1
School of Mechanical Engineering, Jiangsu University of Science and Technology, Zhenjiang 212100, China
2
Industry Technology Research Institute, Jiangsu University of Science and Technology, Zhangjiagang 215600, China
*
Author to whom correspondence should be addressed.
Coatings 2025, 15(8), 923; https://doi.org/10.3390/coatings15080923
Submission received: 13 July 2025 / Revised: 3 August 2025 / Accepted: 5 August 2025 / Published: 7 August 2025

Abstract

To reduce welding deformation during the automated welding of intersection seams on thick plate curved penetrations and thereby improve welding quality and efficiency, an optimized method for segmented and multi-layer multi-pass welding sequences, along with welding process improvement strategies, is proposed. First, based on the welding model of the curved penetrations, a multi-layer multi-pass welding trajectory equation is designed. Next, a Gaussian heat source model is selected, and numerical simulation theories for welding temperature and stress fields are established using finite-element theory. Then, for the intersection seams of curved components with three different thicknesses, four numerical tests of segmented welding sequence optimization are carried out using welding finite-element simulation theory. Finally, the optimal welding process for the welding sequence is improved using orthogonal experimental methods, and the optimal welding process parameters for curved components with different thicknesses are determined. The optimization of welding sequences for intersection seams on three types of thick plates shows that the optimal sequence for segmented welding is first to perform upper–lower diagonal symmetry, followed by left–right symmetry. Compared to other welding sequences, the proposed method reduces welding deformation by an average of 9.24% and welding stress by an average of 7.40%, which verifies the effectiveness of the welding sequence optimization presented in the paper.

Graphical Abstract

1. Introduction

Welding technology is a part of the manufacturing process in ships and marine engineering equipment. During the welding process, welding seams formed by intersecting curved penetrations are often encountered. The thickness of such a curved component is typically greater than 10 mm, the radius is larger than 5 m, and the radius of the penetration components is also greater than 300 mm. Since the pipeline containers formed by curved penetrations are often used for liquid storage or transportation, the welding quality requirements are extremely high. In addition, the intersecting welding seams formed by curved penetrations are spatially closed curves [1], which makes the welding process complex [2]. Currently, curved-penetration welding is mainly performed manually by a team of several people, which results in low welding efficiency, high worker workload, and inconsistent overall welding quality.
Therefore, automated welding based on robotics is urgently needed in this field. However, the large-diameter structural characteristics and the spatially closed curve of the intersecting seams not only limit automated welding by robot pose but also result in welding quality being restricted by the welds’ segmentation form, welding sequence, and welding process [3]. In view of this, for the intersecting welding seams formed by thick-plate large-diameter curved penetrations, the optimization of the welding sequence and the improvement of the welding process have become research focuses in the field of automated welding.
Park [4] conducted extensive experimental tests on the left–right weld sequence of T-type welds in shipbuilding subassemblies and obtained the optimal weld sequence by comparing welding deformations. However, obtaining the optimal weld sequence through experimental methods is costly. Lei Huo [5] determined the welding sequence of the cylindrical structure through the experimental method. However, this method depends on the accumulation of welding experience, and the method is time- and labor-intensive. For plasma arc welding, Bi et al. [6] constantly adjust the welding parameters through experiments and obtain the optimal welding parameters by comparing the effects of weld formation, which also requires a lot of labor and economic costs. With the development of computers, numerical simulation methods have provided an approach to overcoming the limitations of experimental methods. For the welding of Q235B thin plate on the crane, Wang et al. [7] used an orthogonal test to optimize the welding parameters. However, this single-pass multi-layer optimization scheme is not suitable for multiple welds of thick plates. Li et al. [8] successfully conducted numerical simulation on GMAW (gas metal arc welding)/FCAW (flux cored arc welding) single-pass welding of a 12 mm-thick steel plate. However, this simulation is not suitable for multi-layer and multi-pass welding of thick plates. Hu et al. [9] carried out multi-layer, multi-pass welding simulations for thick plate K-type welds. Although this method solved the welding simulation for thick plates, it addressed straight welds rather than the complex spatial closed-curve welds in this study. Gadallah et al. [10] completed numerical simulations for residual stress in thick plate T-joint welds. But this simulation method is also not applicable to curved penetration component welds. Mi et al. [11] performed numerical simulations of the temperature and stress fields for canopy ring welds, but their study only involved single-pass long ring welds. Existing saddle-shaped welds are mostly small components, consisting of single-layer [12], single-pass welding, and can be effectively automated using a positioner and robot. However, this method is not applicable to the complex spatial closed-curve welds described in this paper.
From the existing research results, it can be seen that the current, more complex welding sequence optimization is mainly aimed at thick straight plate welds or circular single-pass welds. There is little research on the welding sequence for the intersecting welds formed by thick-plate, large-diameter curved penetrations. Because thick plate large-diameter curved penetrations not only have large structural dimensions and complex weld curves but also have difficulty in melting during welding due to the influence of gravity on the welding wire, the optimization of the welding sequence and improvement of the welding process need to consider segmentation and multi-layer multi-pass welding [13]. In view of this, first, the welding model of thick-plate curved penetrations is established, and the multi-layer multi-pass trajectory equations are designed in this paper. Then, the welding temperature fields and stress fields are numerically calculated based on a Gaussian heat source. Subsequently, numerical simulations and optimizations of different welding sequences are conducted for different plate thicknesses. Finally, orthogonal experiments are used to improve the welding process parameters.

2. Establishment of Welding Model and Weld Seam Equation for Curved Penetrations

2.1. Establishment of the Welding Model

The large-diameter curved penetrations in the shipbuilding and offshore engineering fields not only have complex intersecting welds but also have multiple penetrations crossing the curved surface. To achieve safe and automated welding across regions, robots often need to adopt a redundant axis structure. Therefore, a welding model, as shown in Figure 1, is established in this paper, including a redundant axis, a welding robot, a curved component, and penetration components.
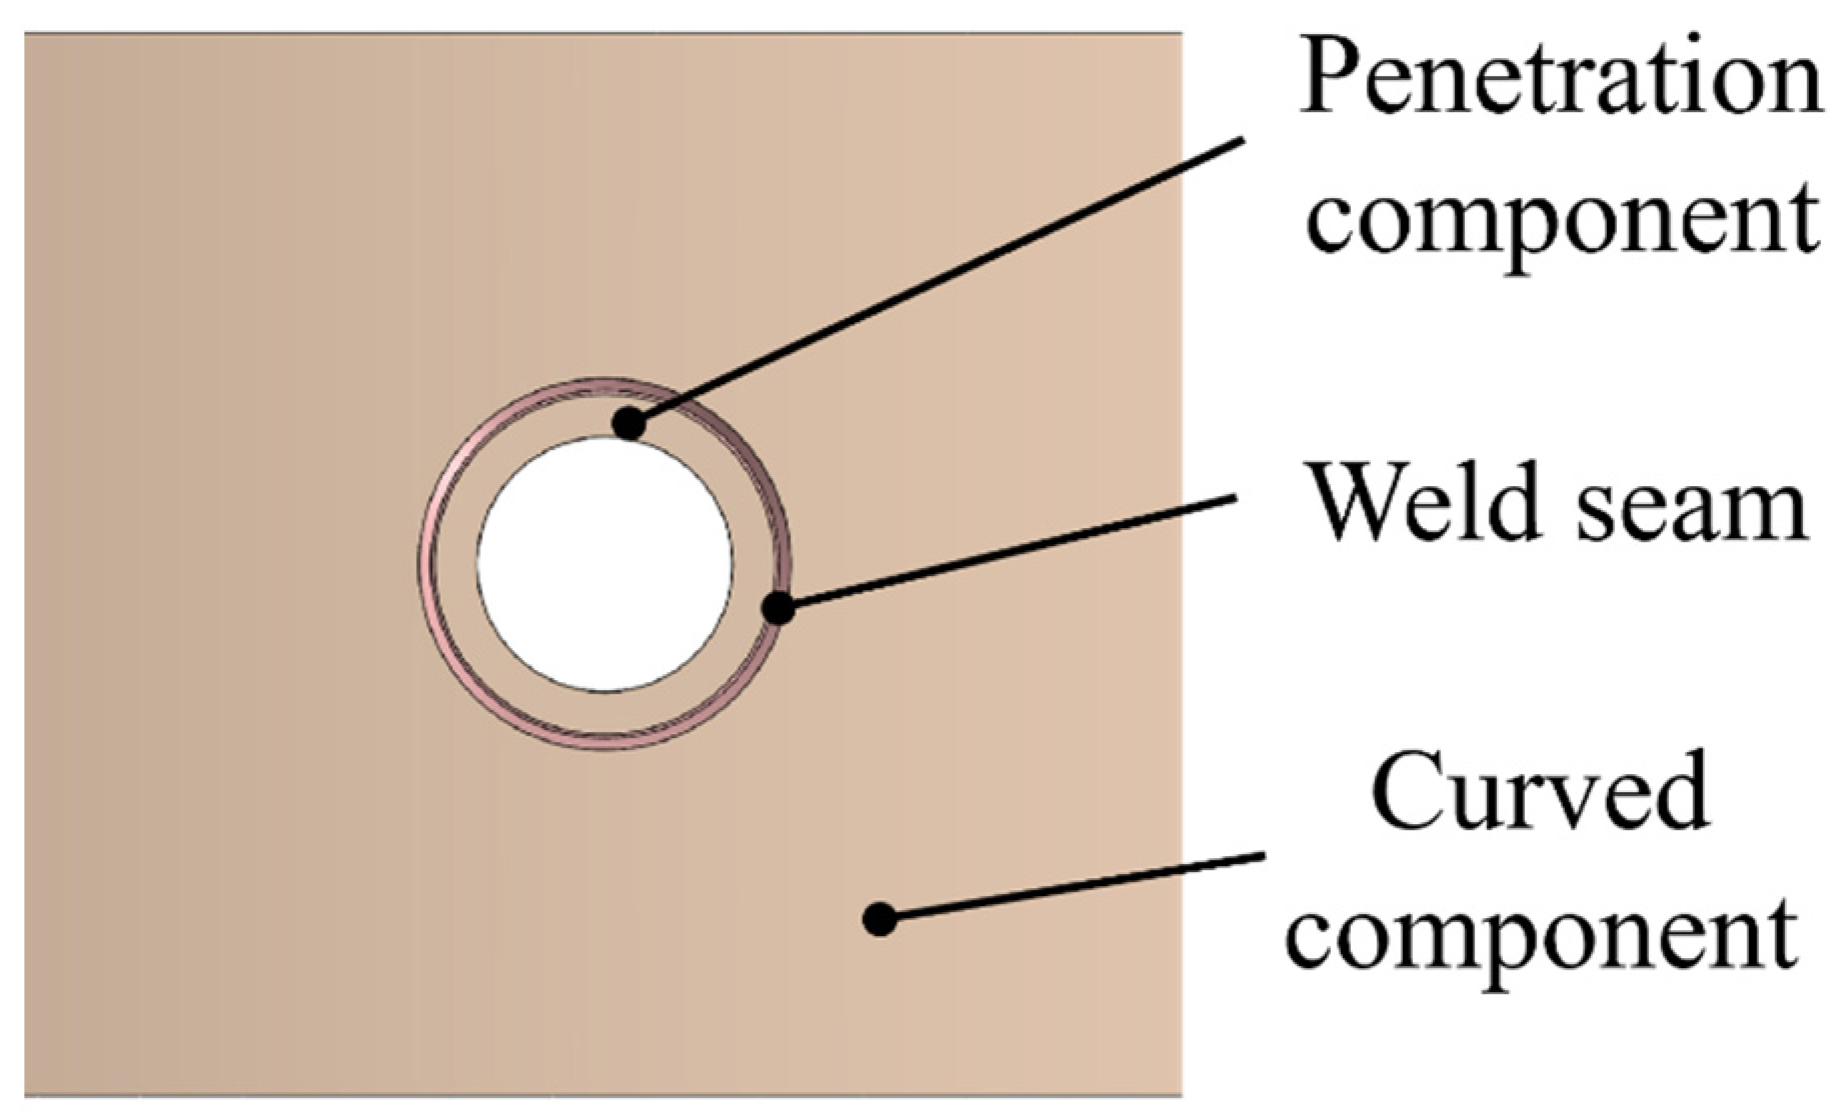
For the automated welding of curved penetrations, manual spot welding is first required to fix them. Then, the argon arc welding is used for manual root pass welding. After the root pass, the weld shape is shown in Figure 2. Finally, the robot performs multi-layer multi-pass welding according to the planned welding sequence.
In the shipbuilding and offshore engineering fields, thick-plate large-diameter curved penetrations are commonly found in boilers or liquid storage tanks. These penetrations are often inserted horizontally into the curved component, parallel to the ground. This means that the robot is not only limited by its posture during automatic welding but also needs to use different welding processes when welding different areas of the intersecting weld due to the gravity of the molten iron. Therefore, segmented symmetric welding is often used for intersecting welding seams, which also helps to offset some of the welding deformation and residual stress generated during the welding process.
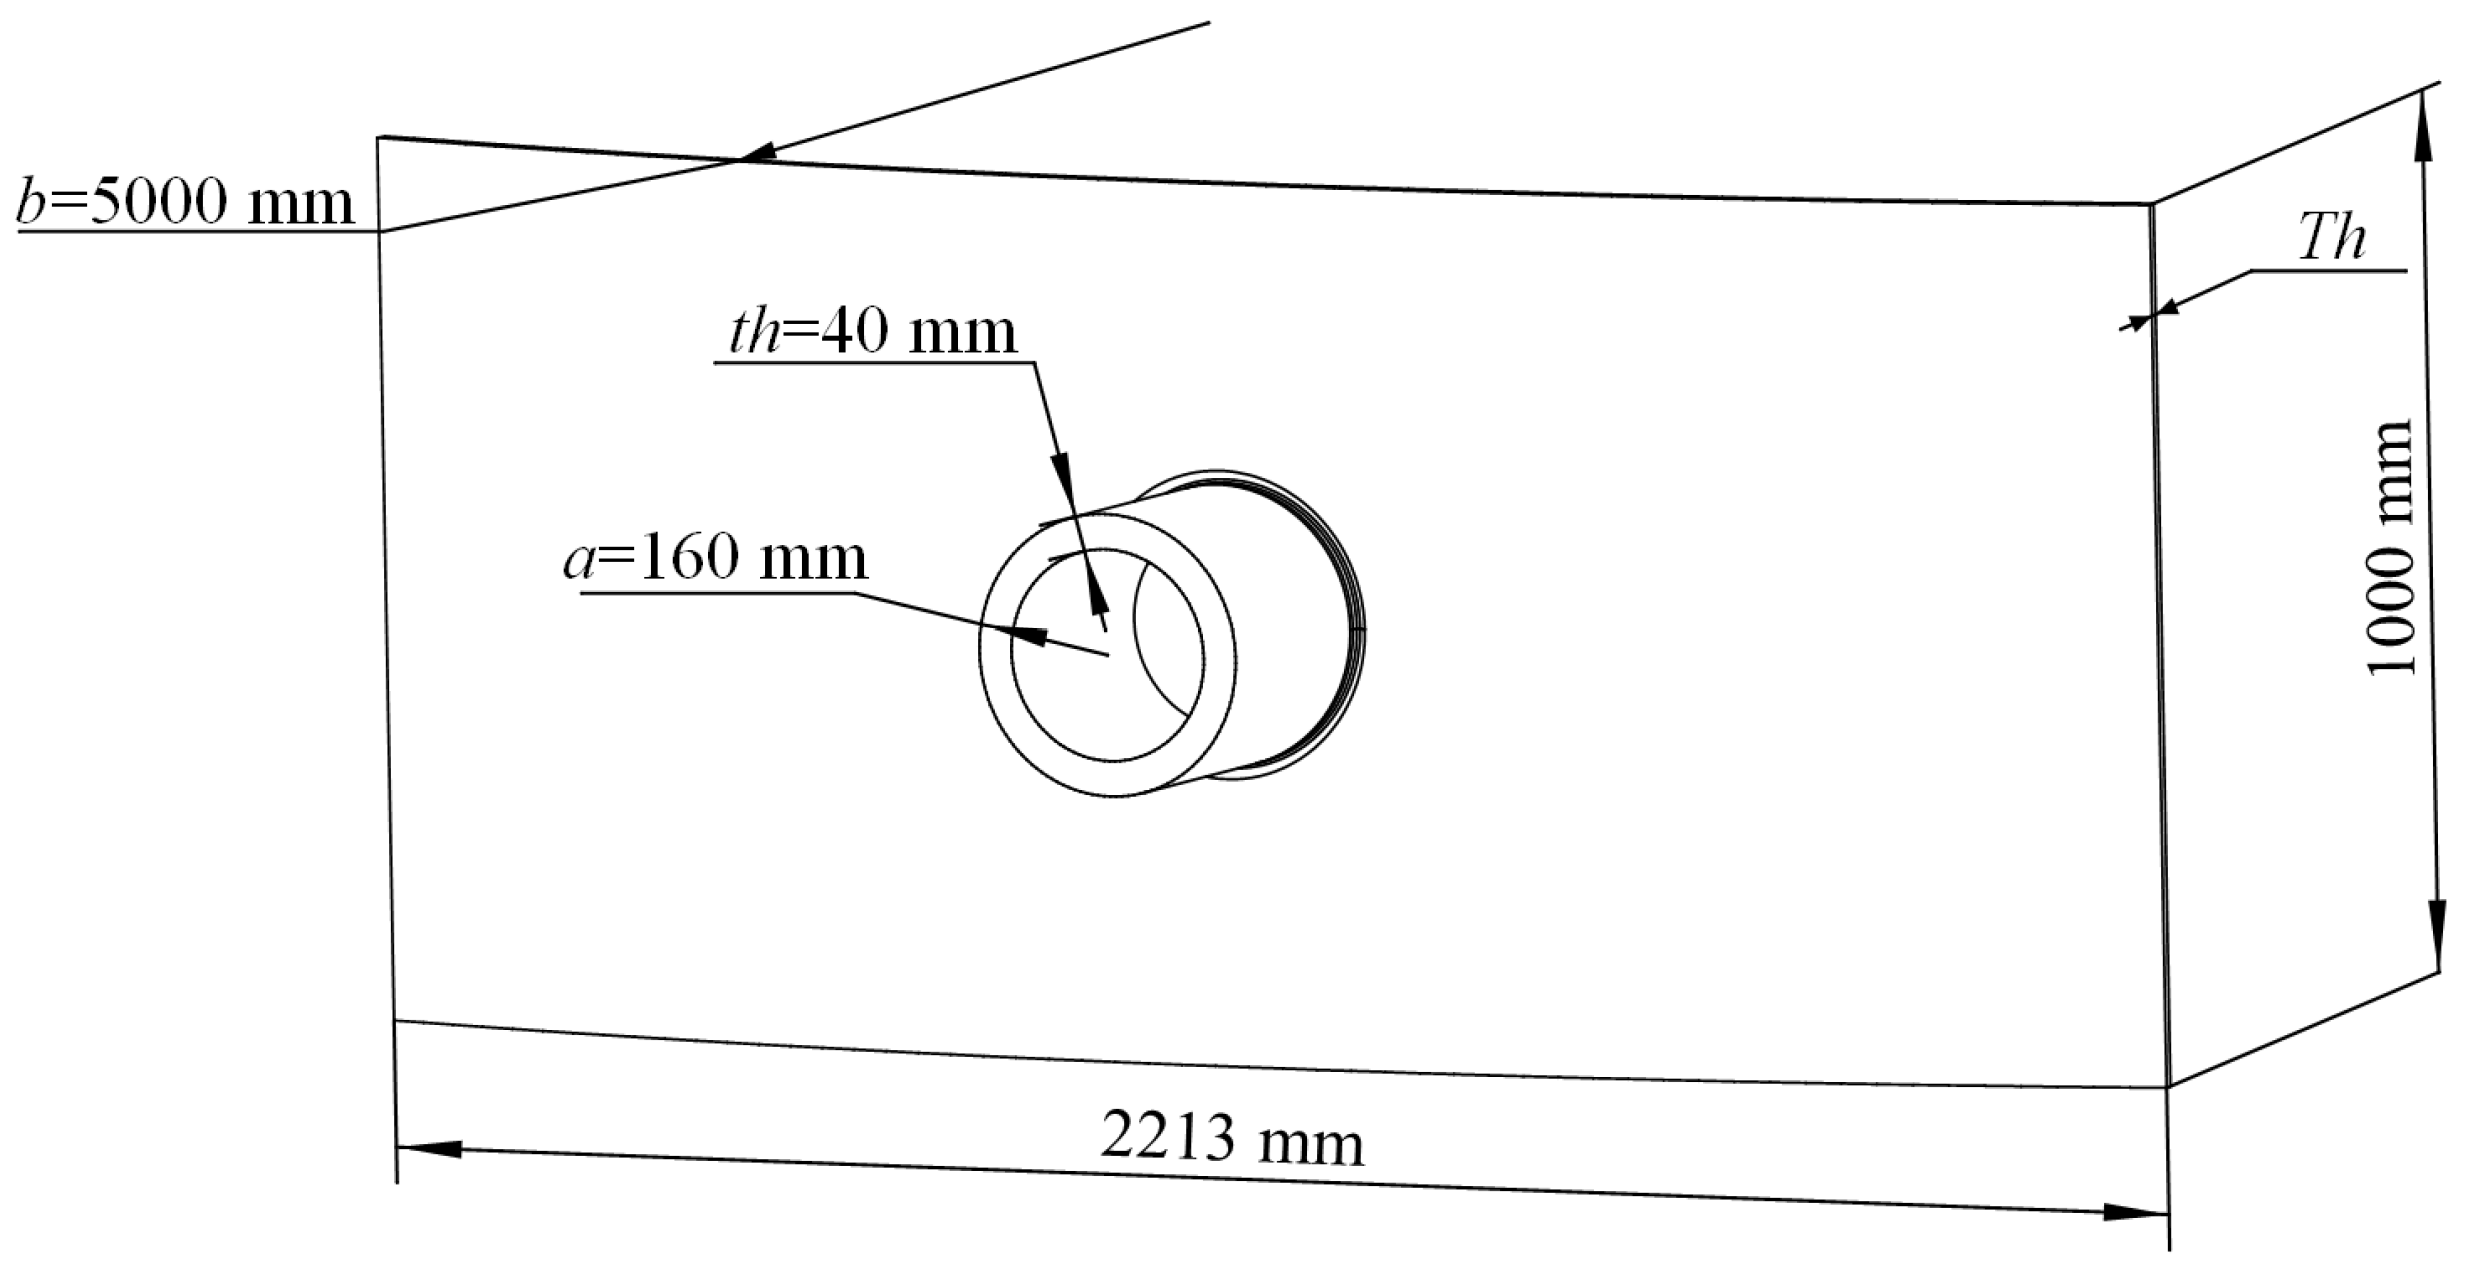
In order to study the influence of different welding sequences on the welding of thick plate large-diameter curved penetrations, welding simulations of different welding sequences of surface pieces with different thicknesses are carried out for the model in this paper, as shown in Figure 3. In the figure, the radius b of the curved component is 5000 mm, with a 45-degree bevel on the curved surface, and the radius a of the penetration component is 160 mm. Th represents the thickness of the curved component, which is taken as 10 mm, 15 mm, and 20 mm in this paper, in accordance with the ship and offshore engineering design specifications. th represents the thickness of the penetration component and is taken as 40 mm in this paper.

2.2. Establishment of Multi-Layer Multi-Pass Weld Seam Equation

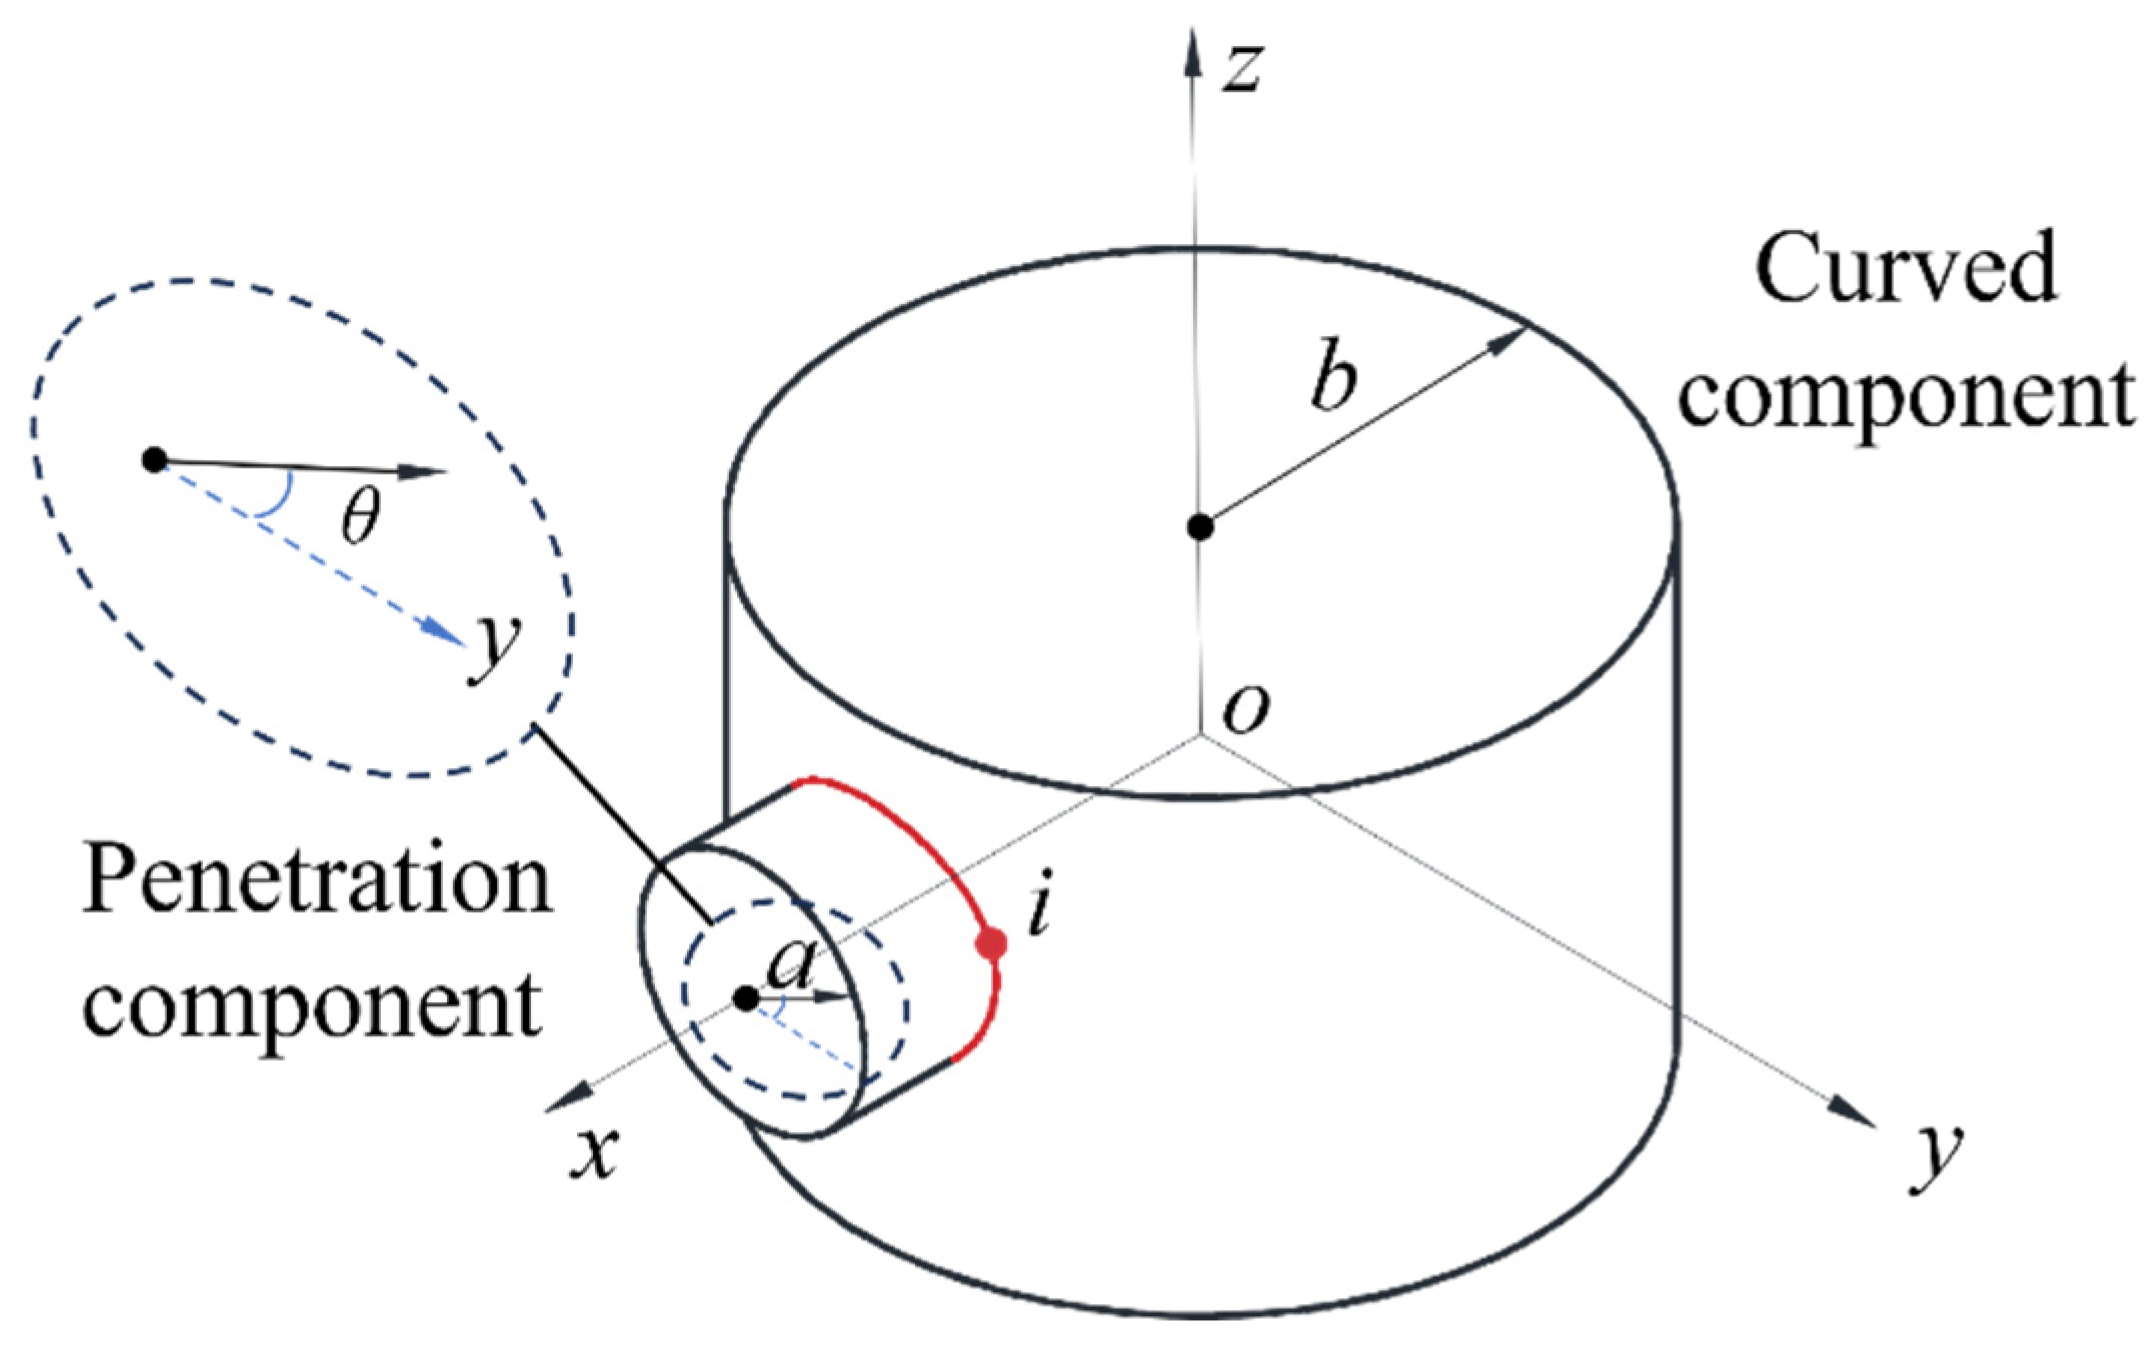
The intersection weld is formed by the intersection of a curved component with a radius of b and a penetration component with a radius of a. A rectangular coordinate system shown in Figure 4 is established at the intersection of its central axes [14].
The spatial intersecting line is formed by the intersection of the outer surfaces of two cylinders. Any point i on the spatial curve must satisfy the constraints of both cylinders simultaneously.
Any point on the edge of the penetration component satisfies the following equation:
y 2 + z 2 = a 2
Any point on the edge of the curved component satisfies the following equation:
x 2 + y 2 = b 2
Let θ be the angle formed between the projection vector of any radius of the penetration component’s circle onto the ozy-plane and the positive direction of the y-axis in the ozy-plane. Combining Equations (1) and (2), the following intersecting line equation r(θ) can be derived:
r ( θ ) x = b 2 ( a cos θ ) 2 y = a cos θ z = a sin θ , θ ( 0 , 2 π )
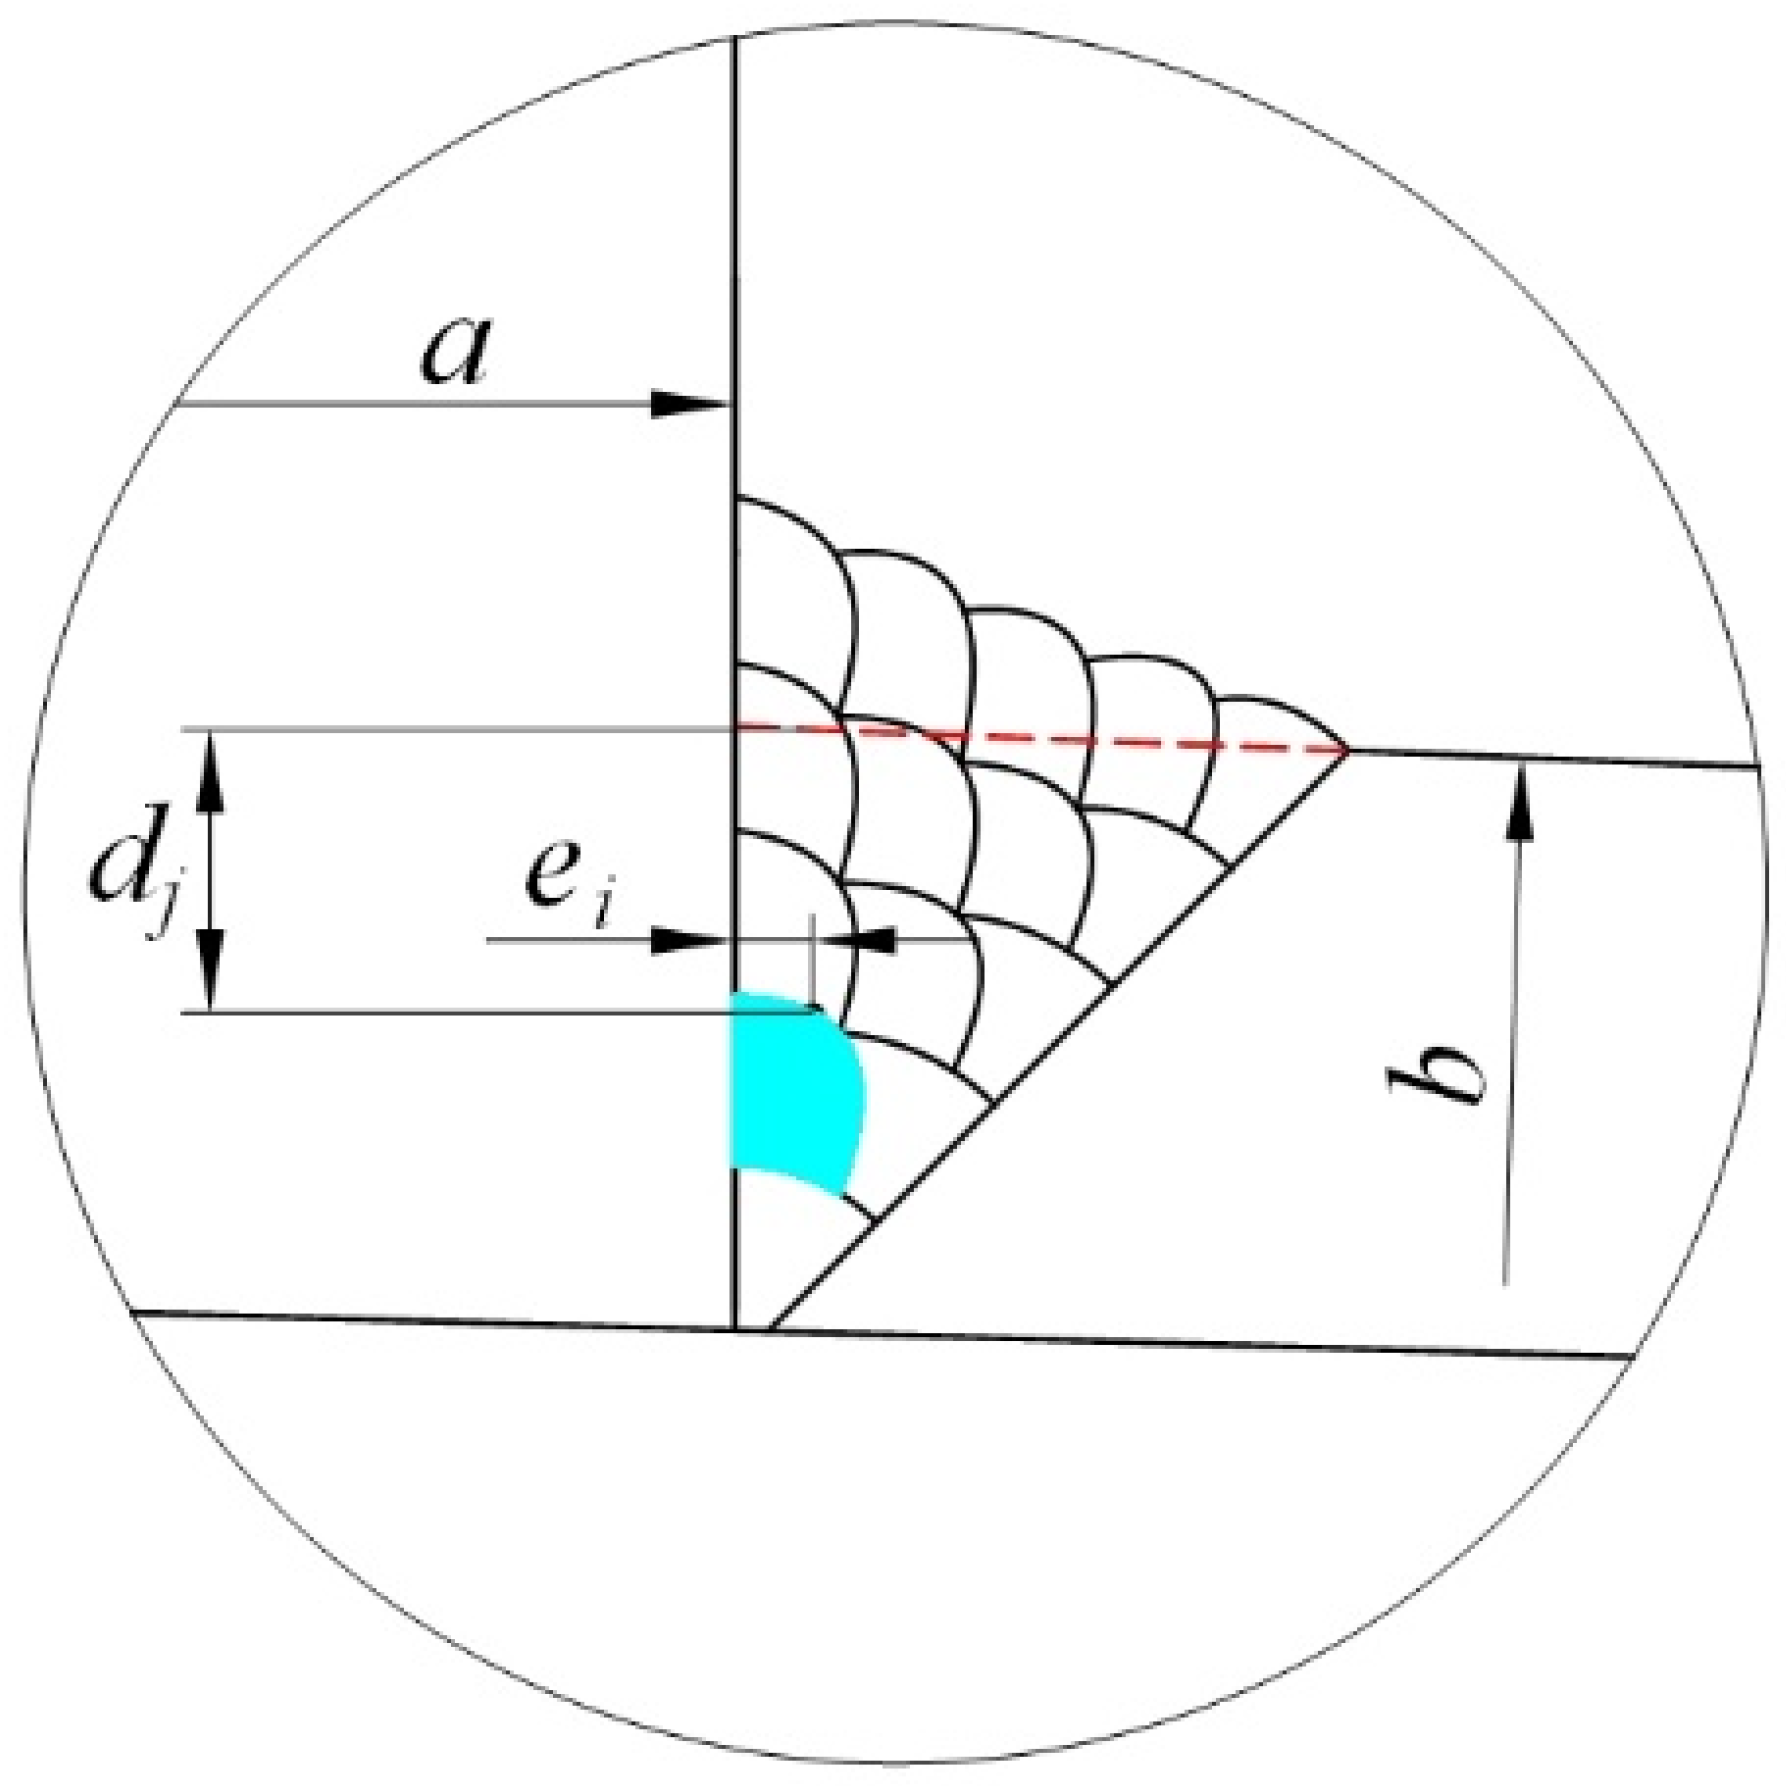
Since the intersecting welding seam is formed by a 45° inclined bevel along the original intersecting line [15], each weld seam has a certain relationship with the original intersecting line. Taking the five-layer welds of the thick plate as an example, the bevel and the cross-section of the weld are shown in Figure 5. The welds are designed using the equal height and equal area method [16]. The number of welds on each layer is one more than the number of welds on the previous layer. The shape of the first few welds on each layer is close to a diamond shape, while the last weld on each layer is close to a trapezoidal shape, which facilitates the prediction and calculation of each weld. According to the equal area method, the distance ei from each weld to the penetration component and the distance dj from each weld to the curved component can be calculated.
The trajectory equation for each weld is:
r ( θ ) x = b 2 ( a cos θ ) 2 d j y = a cos θ + e i cos θ z = a sin θ + e i sin θ , θ ( 0 , 2 π )
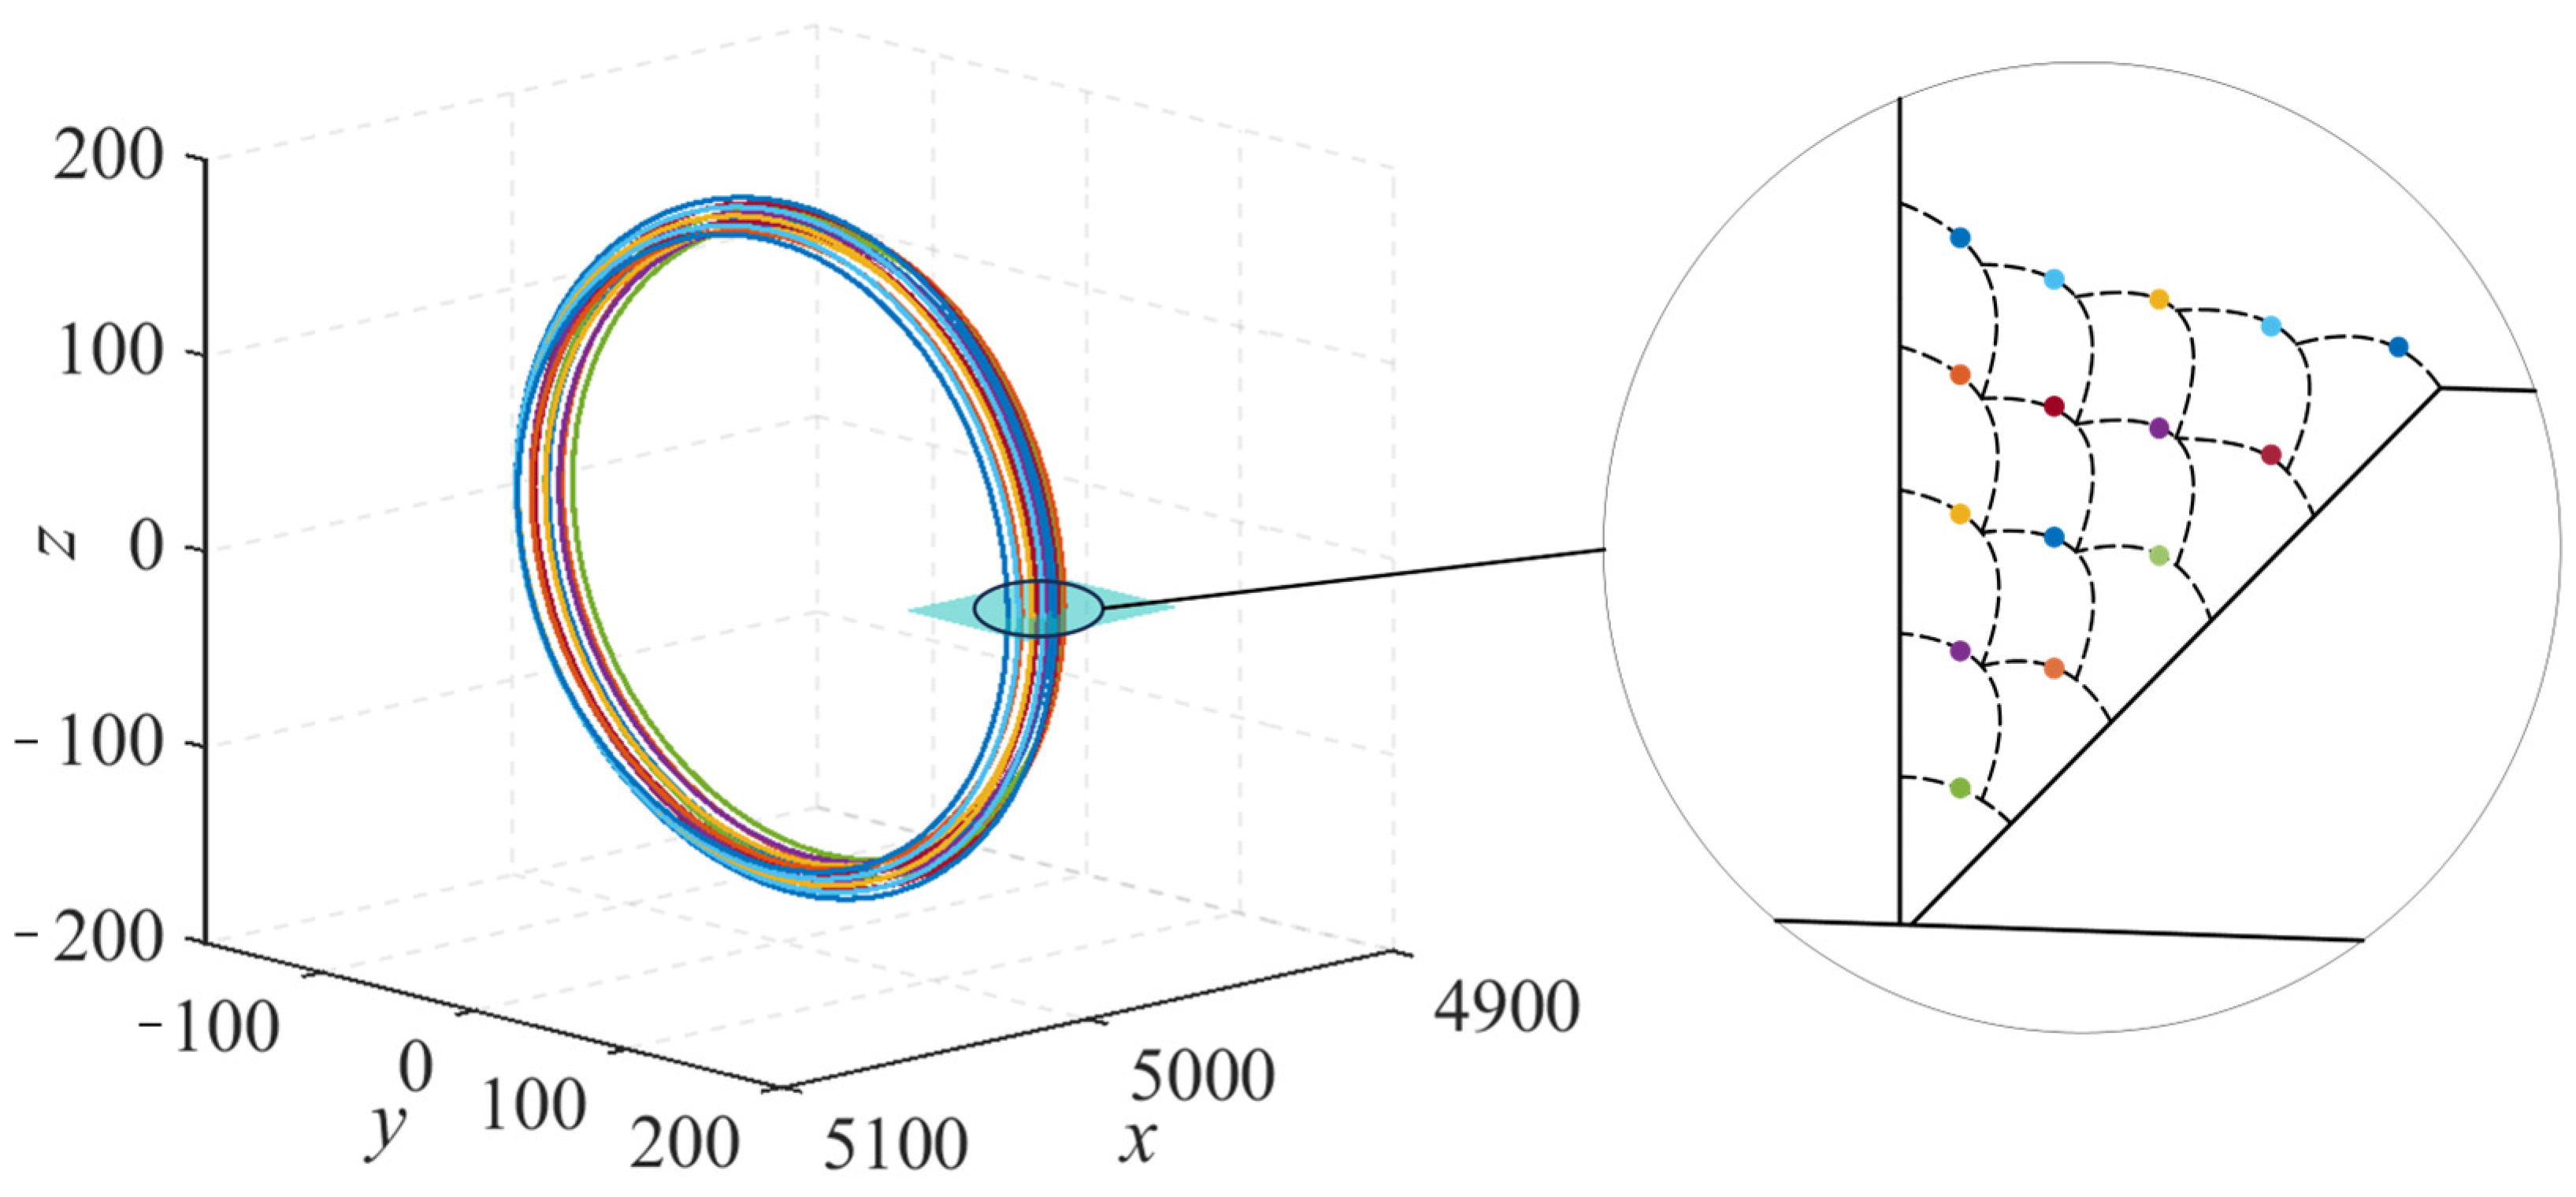
To verify the correctness of the trajectory equation for each weld, let a = 160 mm and b = 5000 mm, and obtain the multi-layer multi-pass welds, as shown in Figure 6, through simulation. From the local cross-section of the weld, it can be seen that the trajectory simulation results are consistent with the actual results.
Let ω be the angular velocity formed by the projection vector of any radius of the penetration component’s circle onto the ozy-plane and the positive direction of the y-axis in the ozy-plane. Let θ = ωt, and ci = a + ei. Then, the trajectory equation for each weld is:
r ( t ) x = b 2 ( a cos ( ω t ) ) 2 d j y = c i cos ( ω t ) z = c i sin ( ω t )
Taking the derivative of the above equation, the velocity equation can be obtained as:
v ( t ) = d r ( t ) d t = a 2 ω sin ( ω t ) cos ( ω t ) b 2 ( a cos ( ω t ) ) 2 c i ω sin ( ω t ) c i ω cos ( ω t )
Since the welding speed referred to in welding processes is generally the scalar speed, the velocity v(t) can be converted into a scalar as follows:
ν ( t ) = v ( t ) = c i 2 ω 2 + a 4 ω 2 sin 2 ( ω t ) cos 2 ( ω t ) b 2 a cos ( ω t ) 2
To better align with the actual welding conditions, the welding speed v(t) from the known welding process is used to reverse-calculate the corresponding ω at time t. Then, by substituting ω and t into Equation (5), the welding trajectory equation for the corresponding time t can be obtained. The smaller the time interval t, the closer the welding speed in the simulation is to the actual working conditions.

3. Numerical Calculation of Welding for Curved Penetration Components

3.1. Selection of Welding Heat Source

In order to accurately simulate the multi-layer multi-pass welding of thick plate and large-diameter curved penetrations and obtain precise welding performance, the selection of an appropriate heat source is the prerequisite and key.
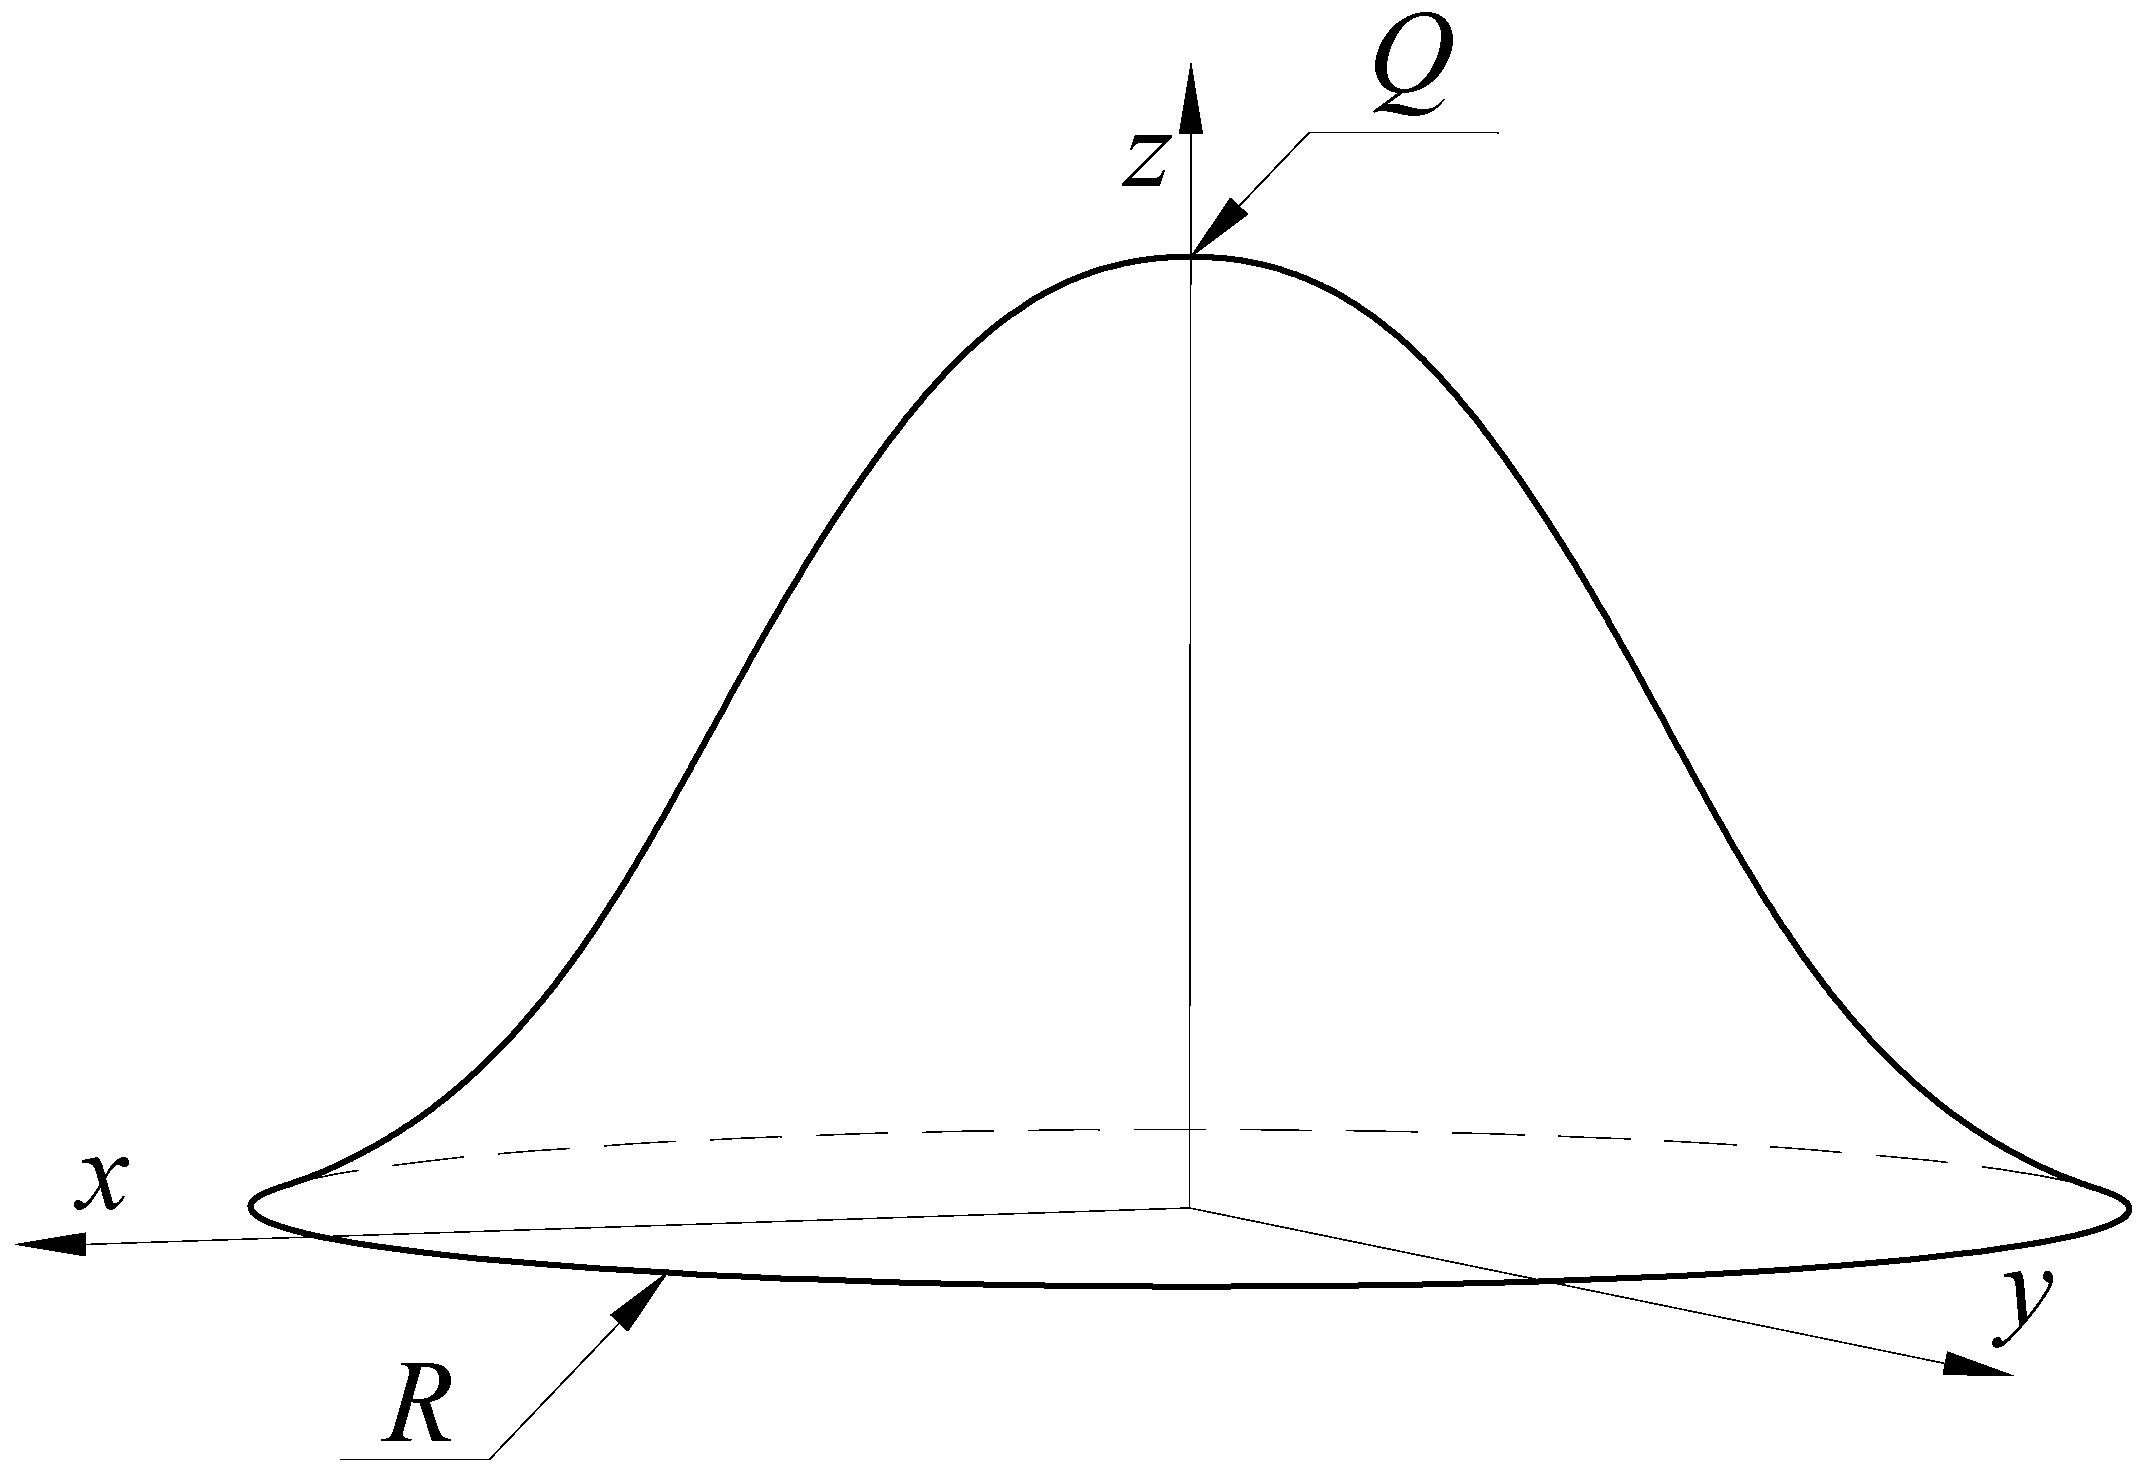
The first layer of the weld of the curved penetration is mainly made manually using argon arc welding. The second layer and the subsequent layers are mainly welded automatically by the robot using CO2 gas shielded welding, with less-stringent requirements for arc stiffness. In order to reduce the amount of calculation, the Gaussian heat source [17], as shown in Figure 7, is used in this paper for welding simulation.
The heat density q(r) of the Gaussian heat source can be described as:
q ( r ) = q m exp ( 3 r 2 R 2 )
where qm is the maximum heat flux density, r is the distance from the center of the heat spot, and R is an arc heating radius.
For a moving heat source, q(r) can be described as:
q ( r ) = 3 Q π R 2 exp ( 3 r 2 R 2 )
where Q is the maximum heat power, which is related to the welding voltage U and current I. Q can be described as:
Q = η U I
where η is the conversion efficiency.
By combining the weld seam trajectory equation r(t) with the moving heat source q(r), the following multi-layer multi-pass penetration moving heat source trajectory can be obtained:
q ( x , y , z , t ) = 3 Q π R 2 exp ( 3 ( x b 2 ( a cos ( ω t ) ) 2 + d j ) 2 + ( y c i cos ( w t ) ) 2 + ( z c i sin ( w t ) ) 2 R 2 )

3.2. Numerical Calculation of Welding Temperature Field

During the welding process, the welding heat source will first melt the welding wire and then continue to heat it to the interface of the weldment to form a molten pool. As the welding heat source moves, the workpiece cools rapidly and eventually solidifies into a weld seam. In this process, the material properties of the workpiece exhibit nonlinear characteristics as the temperature changes. Therefore, the welding process is essentially a nonlinear heat conduction problem.
The heat conduction diagram of the 3D element e is shown in Figure 8. In the x, y, and z directions, the heat flux per unit of distance in the directions dx, dy, and dz over a unit time is represented as qx, qy, and qz, respectively.
The difference in heat flow into and out of the smallest unit e is:
( q x + q x x q x ) d y d z + ( q y + q y y q y ) d x d z + ( q z + q z z q z ) d x d y
The heat generated per unit time due to temperature changes is:
ρ c T t d x d y d z
where ρ represents the density of the workpiece, c is the specific heat capacity of the workpiece, T is the temperature distribution, and t is time.
According to the principle of energy conservation, since Equation (12) equals the heat Qdxdydz generated within the unit e per unit time, plus the heat generated per unit time due to temperature changes, the following heat conservation equation can be derived:
q x x + q y y + q z z + ρ c T t = Q
The following three-dimensional heat conduction equation can be further derived:
x ( k T x ) + y ( k T y ) + z ( k T z ) + Q = ρ c T t
where k represents the thermal conductivity of the workpiece.
Assume that the initial temperature field of the workpiece is:
T ( x , y , z , 0 ) = T 0 ( x , y , z )
Therefore, during the welding process, the following three boundary conditions will exist.
The first boundary condition, Γ1, is the variation caused by temperature changes. That is:
T ( x , y , z ) = T 0
The second boundary condition, Γ2, is the known normal heat flux on the boundary. That is:
k x T x n x + k y T y n y + k z T z n z = q
The third boundary condition, Γ3, is the convective heat exchange between the workpiece boundary and the surrounding material. That is:
k x T x n x + k y T y n y + k z T z n z = h ( T f T b )
where h is the heat transfer coefficient, Tf is the temperature of the boundary layer’s adiabatic wall, and Tb is the external environmental temperature.
In three-dimensional space, the transient heat conduction equation is discretized using the finite-element method, and the residual RΩ is introduced through numerical approximation:
R Ω = x ( k x T x ) + y ( k y T y ) + z ( k z T z ) + Q ρ c T t
where Ω represents the domain to be solved.
RΩ is the residual function with respect to position within the domain Ω, and the closer RΩ is to zero, the better. The residual RΓq on the boundary Γq is handled using the Neumann method, as follows:
R Γ q = k T x + q
Based on the Galerkin weighted residual method, the transient heat can be obtained:
Ω ρ c N i T t d x d y d z + Ω ( N i x k T x + N i y k T y + N i z k T z ) d x d y d z Ω N i Q d x d y d z + Γ q N i q d Γ = 0
where Ni is the weighting function on the boundary Γq.
After dividing the solution domain into elements and defining the internal solution of each element using the shape function, the shape function can be differentiated with respect to time, as follows:
T e t ( x , y , z ) = Ω e j = 1 , P T j e t N j e ( x , y , z )
In the weighted residue method, the weight function is generally used as a trial function, and the Galerkin discrete equation can be derived from it:
e = 1 M Ω e ρ c N i e d x d y d z T j e t + e = 1 M Ω e ( N i e x k N j e x + N i e y k N j e y + N i e z k N j e z ) T j e d x d y d z e = 1 M Ω e N i e Q d x d y d z + e = 1 M Γ q e N i e q d Γ = 0 , i , j [ 1 , P ]
where M represents the total number of elements, P is the number of nodes per element, and c is the specific heat capacity. The trial function Nie for the element is a shape function and can be further simplified to obtain:
[ C ] = e = 1 M Ω e ρ c N i e d x d y d z
[ K ] = i = 1 M Ω e ( N i e x k N j e x + N i e y k N j e y + N i e z k N j e z ) d x d y d z + i = 1 M Γ q e N i e q d Γ
{ Q } = i = 1 M Ω e N i e Q d x d y d z
After organizing the above equations, the matrix representation of transient heat transfer can be obtained as follows:
C T + K T = Q
where [K] represents the total thermal conductivity matrix, [Q] is the total load matrix, [C] is the specific heat matrix, {T} denotes the node temperature, and { T ˙ } refers to the derivative of the node temperature.
Due to the fact that the material’s physical properties vary non-linearly with temperature throughout the welding process, the above equation can be rewritten as:
C ( T ) T + K ( T ) T = Q ( T )

3.3. Numerical Calculation of Welding Stress and Deformation

During the welding process, the weld seam first rapidly expands due to localized heating, and then contracts rapidly as it cools, which leads to the generation of thermal stresses and deformations. Moreover, an improper welding sequence and incorrect welding processes can also cause stress concentrations, resulting in structural stresses and residual stresses. To ensure welding quality, it is essential to effectively control the welding deformation and residual stresses.
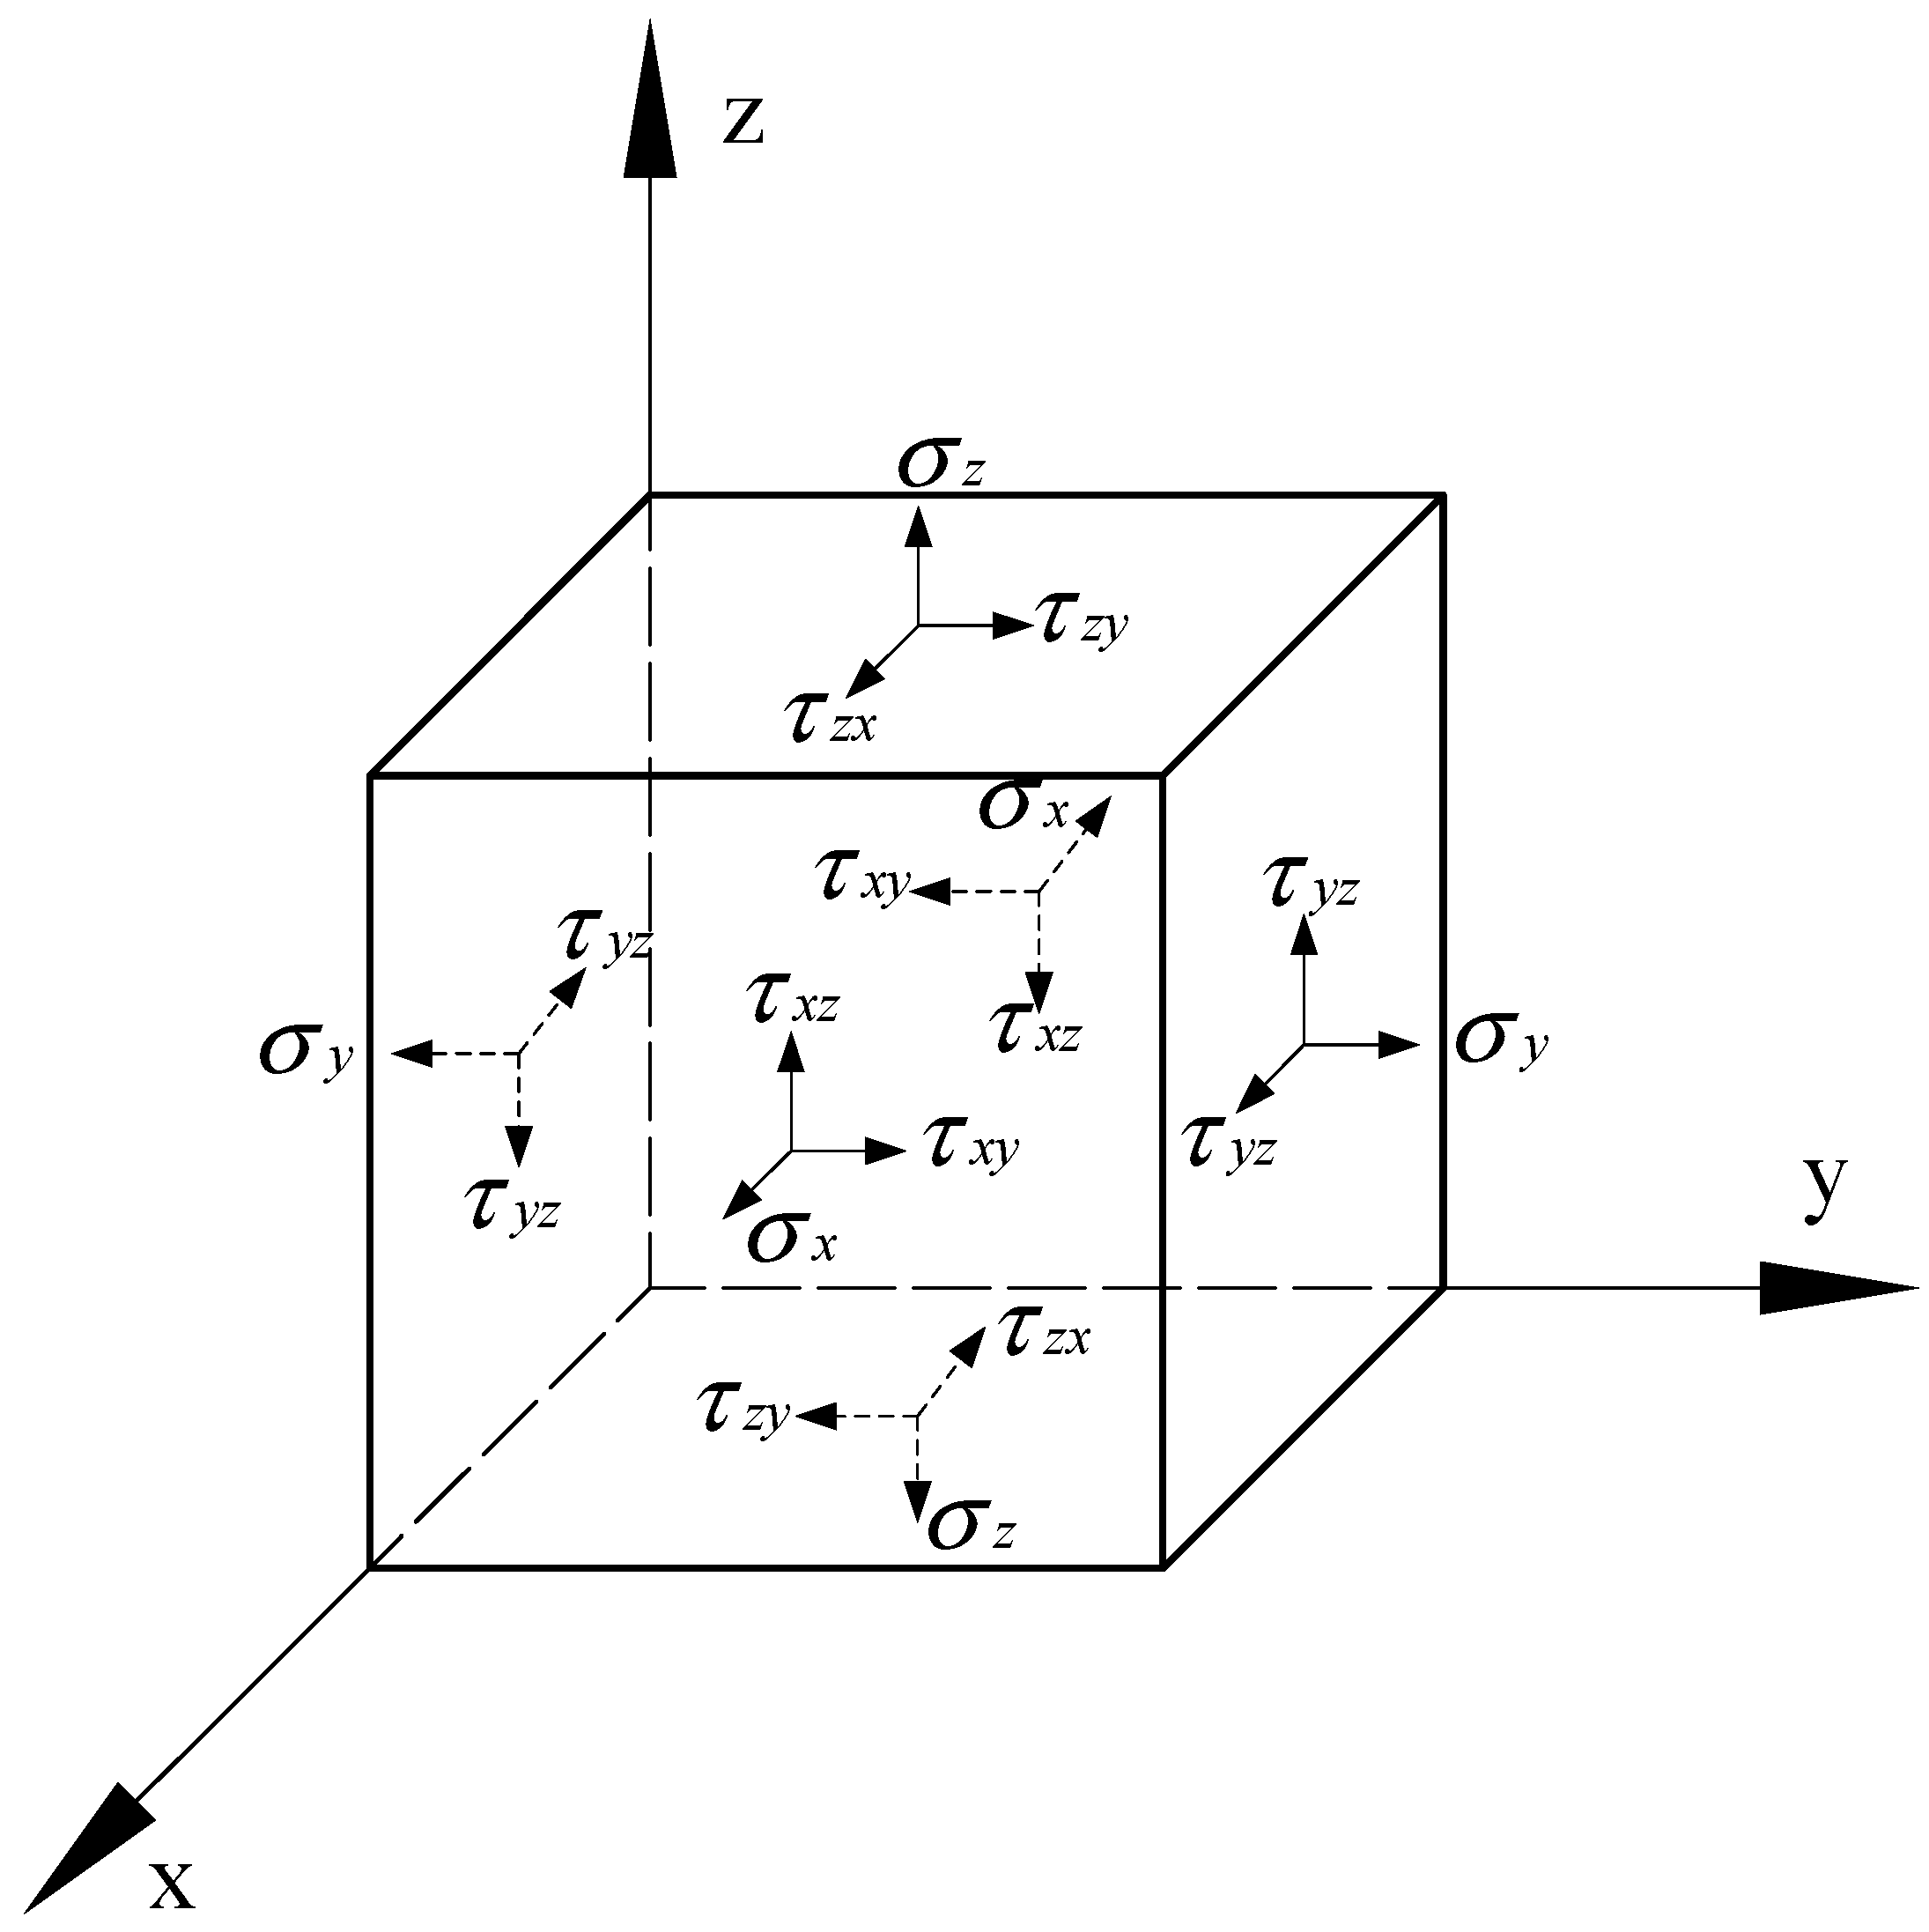
Assume that the micro-element of the welded workpiece is a cube e, as shown in Figure 9.
The edge lengths of the micro-element e are dx, dy, and dz, respectively. When the temperature increases from t 1 to t 2 , the edge lengths change to dx + at′, dy + at′, and dz + at′.
ε x 0 = ε y 0 = ε z 0 = a t
γ x y 0 = γ y z 0 = γ z x 0 = 0
where t = t 2 t 1 .
The workpiece will experience expansion and contraction under the heat source, but the infinitesimal elements cannot freely expand or contract due to constraints, leading to the generation of thermal stresses. According to the theory of thermoelastic mechanics, the total elastic strain {ε}all of the material consists of the elastic strain {ε}el and the thermal strain {ε}hot, as shown in Equation (32). The elastic strain {ε}el induced by external forces is calculated based on the principles of elasticity, while the thermal strain {ε}hot caused by temperature changes is calculated based on the principles of thermoelasticity.
ε a l l = ε e l + ε h o t
The relationship between elastic strain and elastic stress is as follows:
σ e l = D ε e l
where [D] is the three-dimensional elasticity matrix, which is determined by the elastic modulus E and Poisson’s ratio u.
Due to the nonlinear variation of the thermodynamic properties of the base material during welding, the coefficient of thermal expansion changes with the temperature, and the thermal strain is related to the coefficient of thermal expansion. The thermal strain {ε}hot can be written as:
ε h o t = α t , α t , α t , 0 , 0 , 0 T
where α represents the coefficient of thermal expansion of the workpiece, and t′ is the temperature change. The smaller the element size in unit e, the more accurate the calculation of the thermal strain {ε}hot.
Considering that plastic deformation occurs near the weld pool [9], the strain equation {ε}all, composed of the total strain increments, can be described as:
ε a l l = ε e l + ε p + ε h o t
where {ε}p represents the plastic strain increment, which is related to the material’s yield function.
Establish the displacement increment {δ}e at each node within element e, as well as the initial strain increment [R]e caused by temperature changes:
R e = K e δ e
R e = B T C d V d T
K e = B T D B d V
where [K]e is the element stiffness matrix, [B] is the coefficient matrix related to the element nodes, and dV is the differential increment along the x, y, and z axes.
In complex welding conditions, to minimize the difference between the simulation and the actual weldment, a correction coefficient matrix [G] is introduced to modify the stiffness matrix. The modified element stiffness matrix is as follows:
K ¯ e = B T D B G d V
The node displacement increment {δ}e can be described as:
δ e = B T D B G d V 1 B T C d V d T
The total welding deformation w can be described as:
w = i = 1 Ω I e δ e

4. Numerical Simulation of Welding Sequence for Curved Penetration Components

To determine the optimal welding sequence for thick plate large-diameter curved penetration components, a welding simulation is carried out based on the finite-element theory, as shown in Figure 10. First, create a curved penetration model in SolidWorks software (2020, Paris, France). Then, the values of ei and dj are calculated using the equal height area method, and the trajectory equations for each layer of weld beads are established. Next, the three-dimensional weld seam is created and imported into ANSYS software (2024R1, Pittsburgh, PA, USA) for nonlinear material settings. Finally, the temperature field is calculated in the transient heat analysis and imported into the transient structural analysis for residual stress and deformation calculations.

4.1. Preprocessing for Numerical Simulation

To make the welding simulation and welding sequence optimization for thick plate large-diameter curved penetration components more general, three different thicknesses and radii of curved parts, as well as different thicknesses and radii of penetration parts, are selected for numerical simulation in Table 1.
As mentioned above, the weld trajectory is calculated using the equal height and equal area method. The area and height of each weld are the same, and the number of weld layers increases or decreases as the thickness of the curved component increases or decreases.
As shown in Figure 11, the 10 mm curved plate welds consist of three layers and six passes, the 15 mm curved plate welds consist of four layers and ten passes, and the 20 mm curved plate welds consist of five layers and fifteen passes.
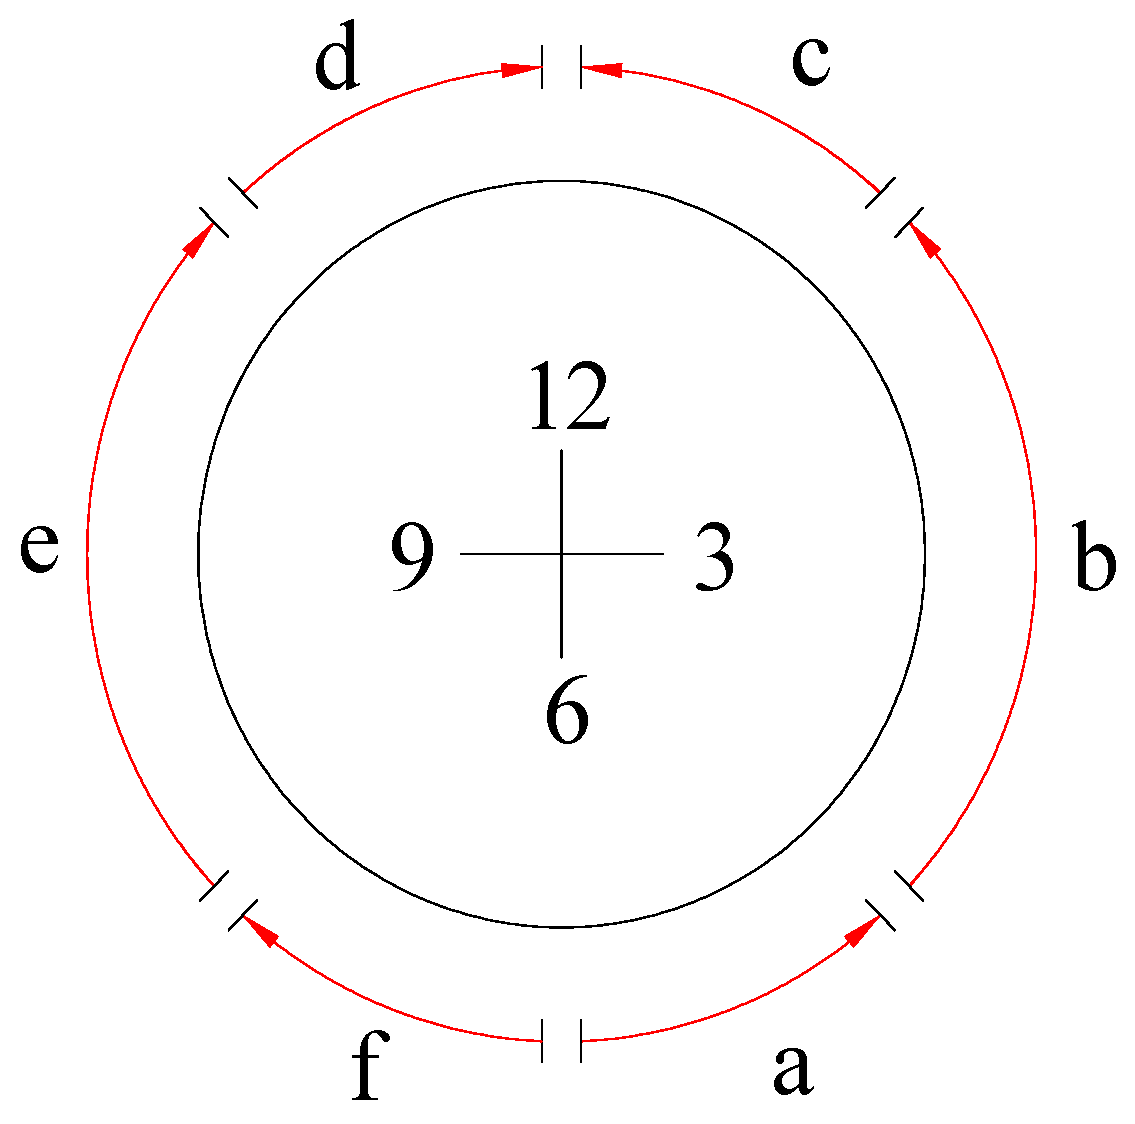
Since the curved penetrations are large in diameter and are mostly inserted horizontally in the curved component parallel to the ground, they are limited by the posture of the welding robot and the welding quality requirements. Therefore, each weld needs to be divided into six left–right symmetrical sections for welding, as shown in Figure 12. The welding direction and process vary. For example, segments c and d adopt horizontal welding, segments b and e adopt vertical welding, and segments a and f adopt overhead welding.
In the welding process, local heating of the workpiece causes the material to expand and contract due to thermal effects, leading to the generation of stress and strain, which in turn causes welding deformation and residual stress. Research and practice have shown that, when the welding parameters of each weld are the same, the welding deformation and welding residual stress can be improved by changing the welding sequence [18,19]. In view of this, the four segmented welding sequences, as shown in Figure 13, are proposed in this paper for the intersecting line welds formed by thick plate large-diameter curved penetrations in Table 1.
In the figure, the N1 welding sequence starts with left–right symmetry, followed by top–bottom symmetry. The N2 welding sequence starts with left–right symmetry, followed by top–bottom diagonal symmetry. The N3 welding sequence starts with top–bottom diagonal symmetry, followed by left–right symmetry. The N4 welding sequence starts with partial top–bottom diagonal symmetry, followed by left–right symmetry, and finally, top–bottom diagonal symmetry.
Due to the use of high-strength structural steel in pipelines or liquid storage tanks, the marine special steel DH36 [20] is selected as the welding material, and its composition is shown in Table 2.
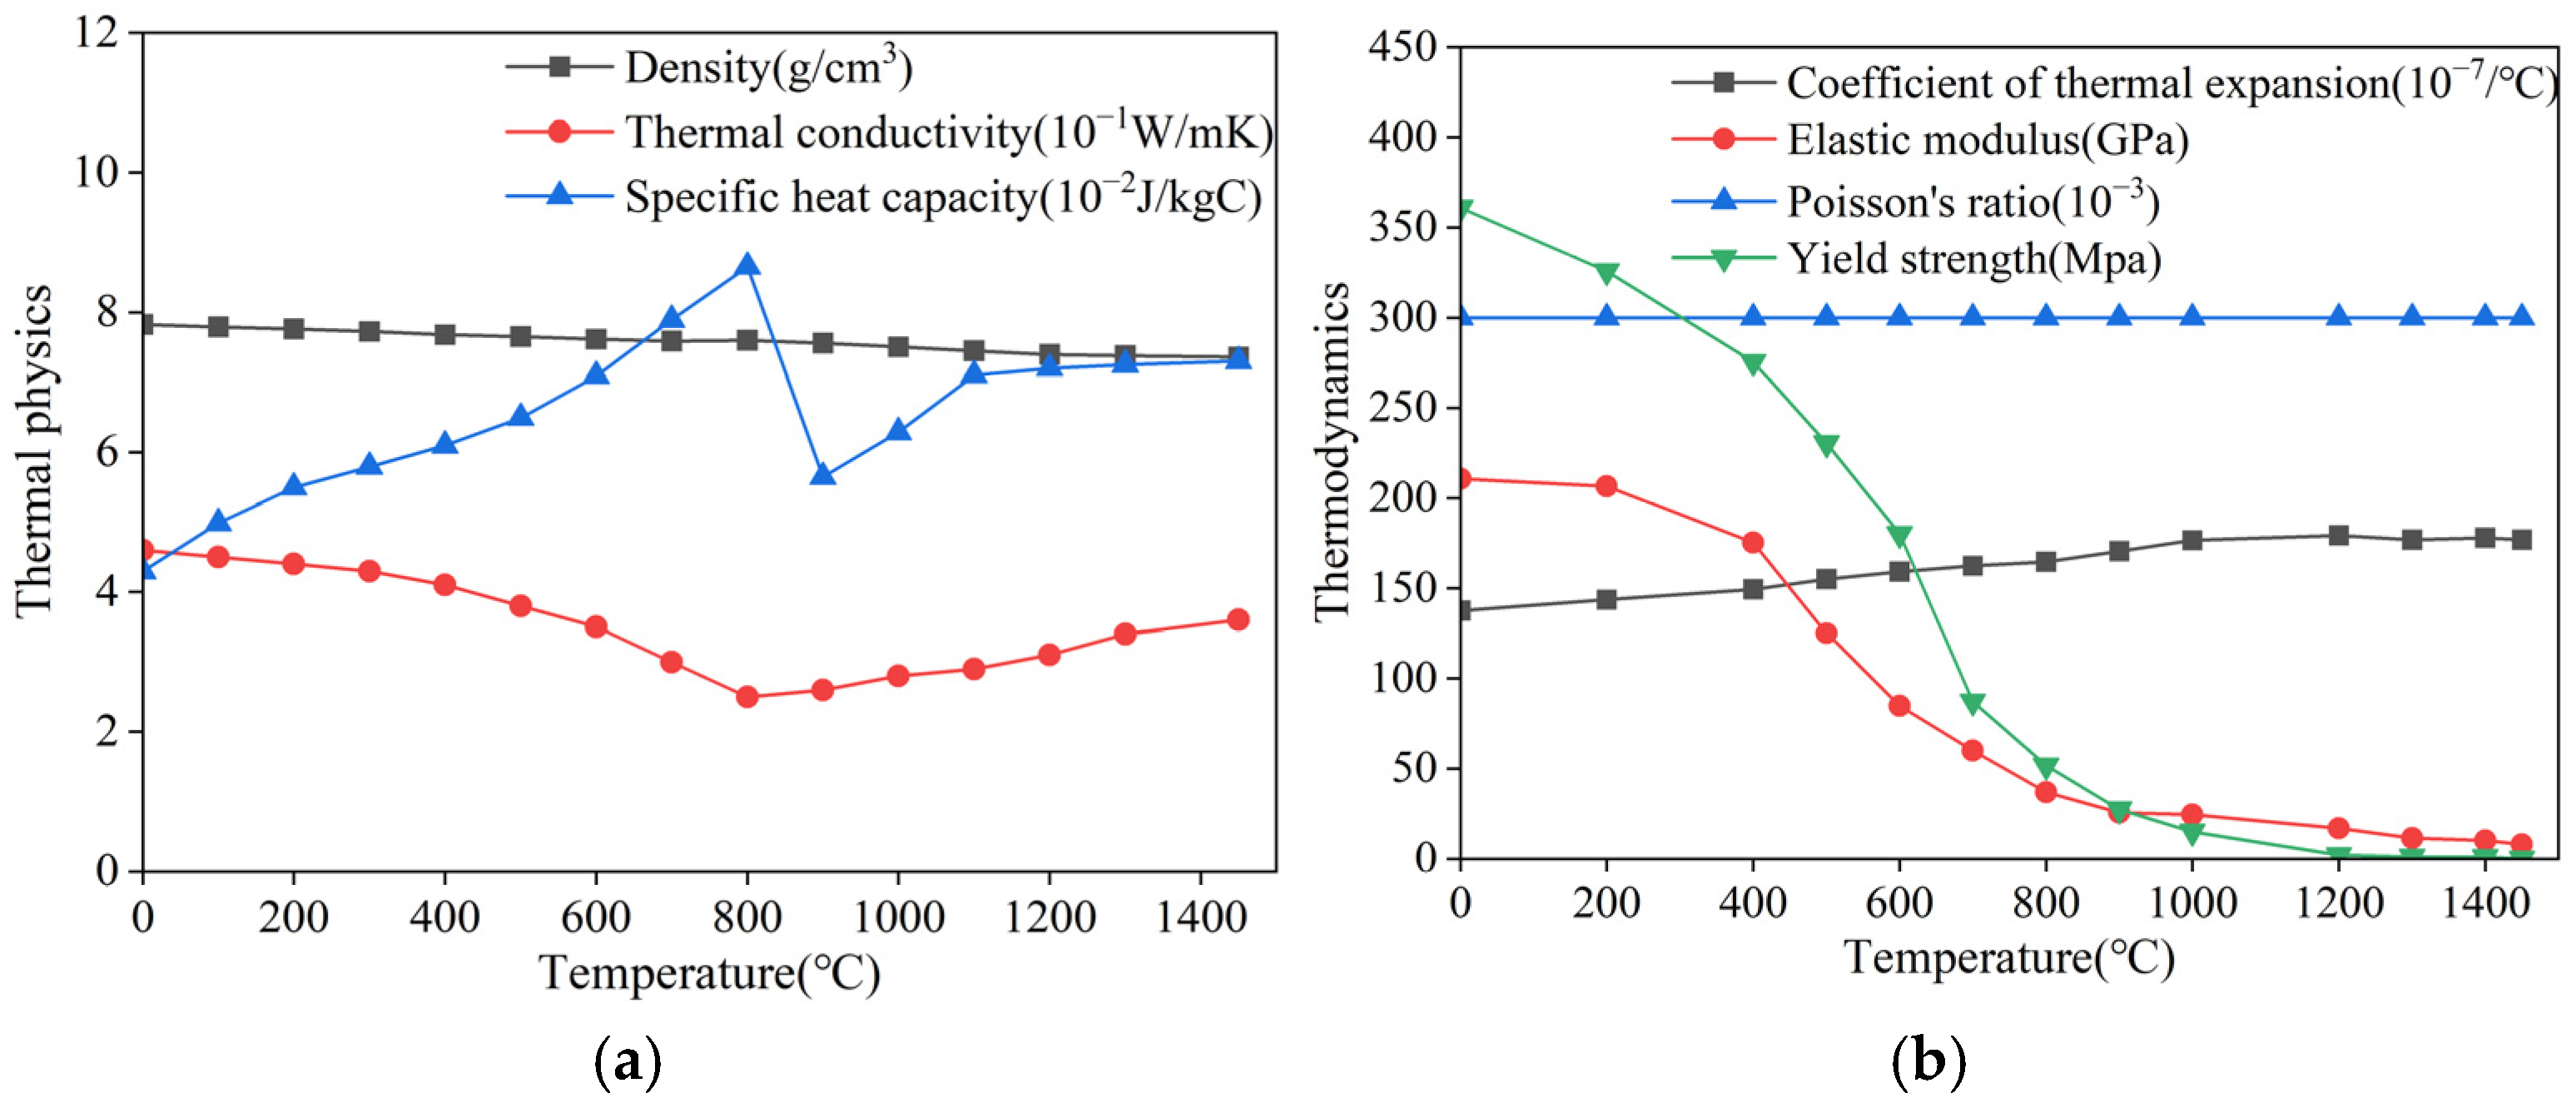
During the welding process, due to the rapid temperature increase, the material properties change nonlinearly with temperature. The temperature field calculation is related to the thermal physical properties of the steel, while the welding deformation and stress are related to the thermodynamic properties of the metal. The thermal, physical, and thermodynamic properties of DH36 steel [21] are shown in Figure 14.
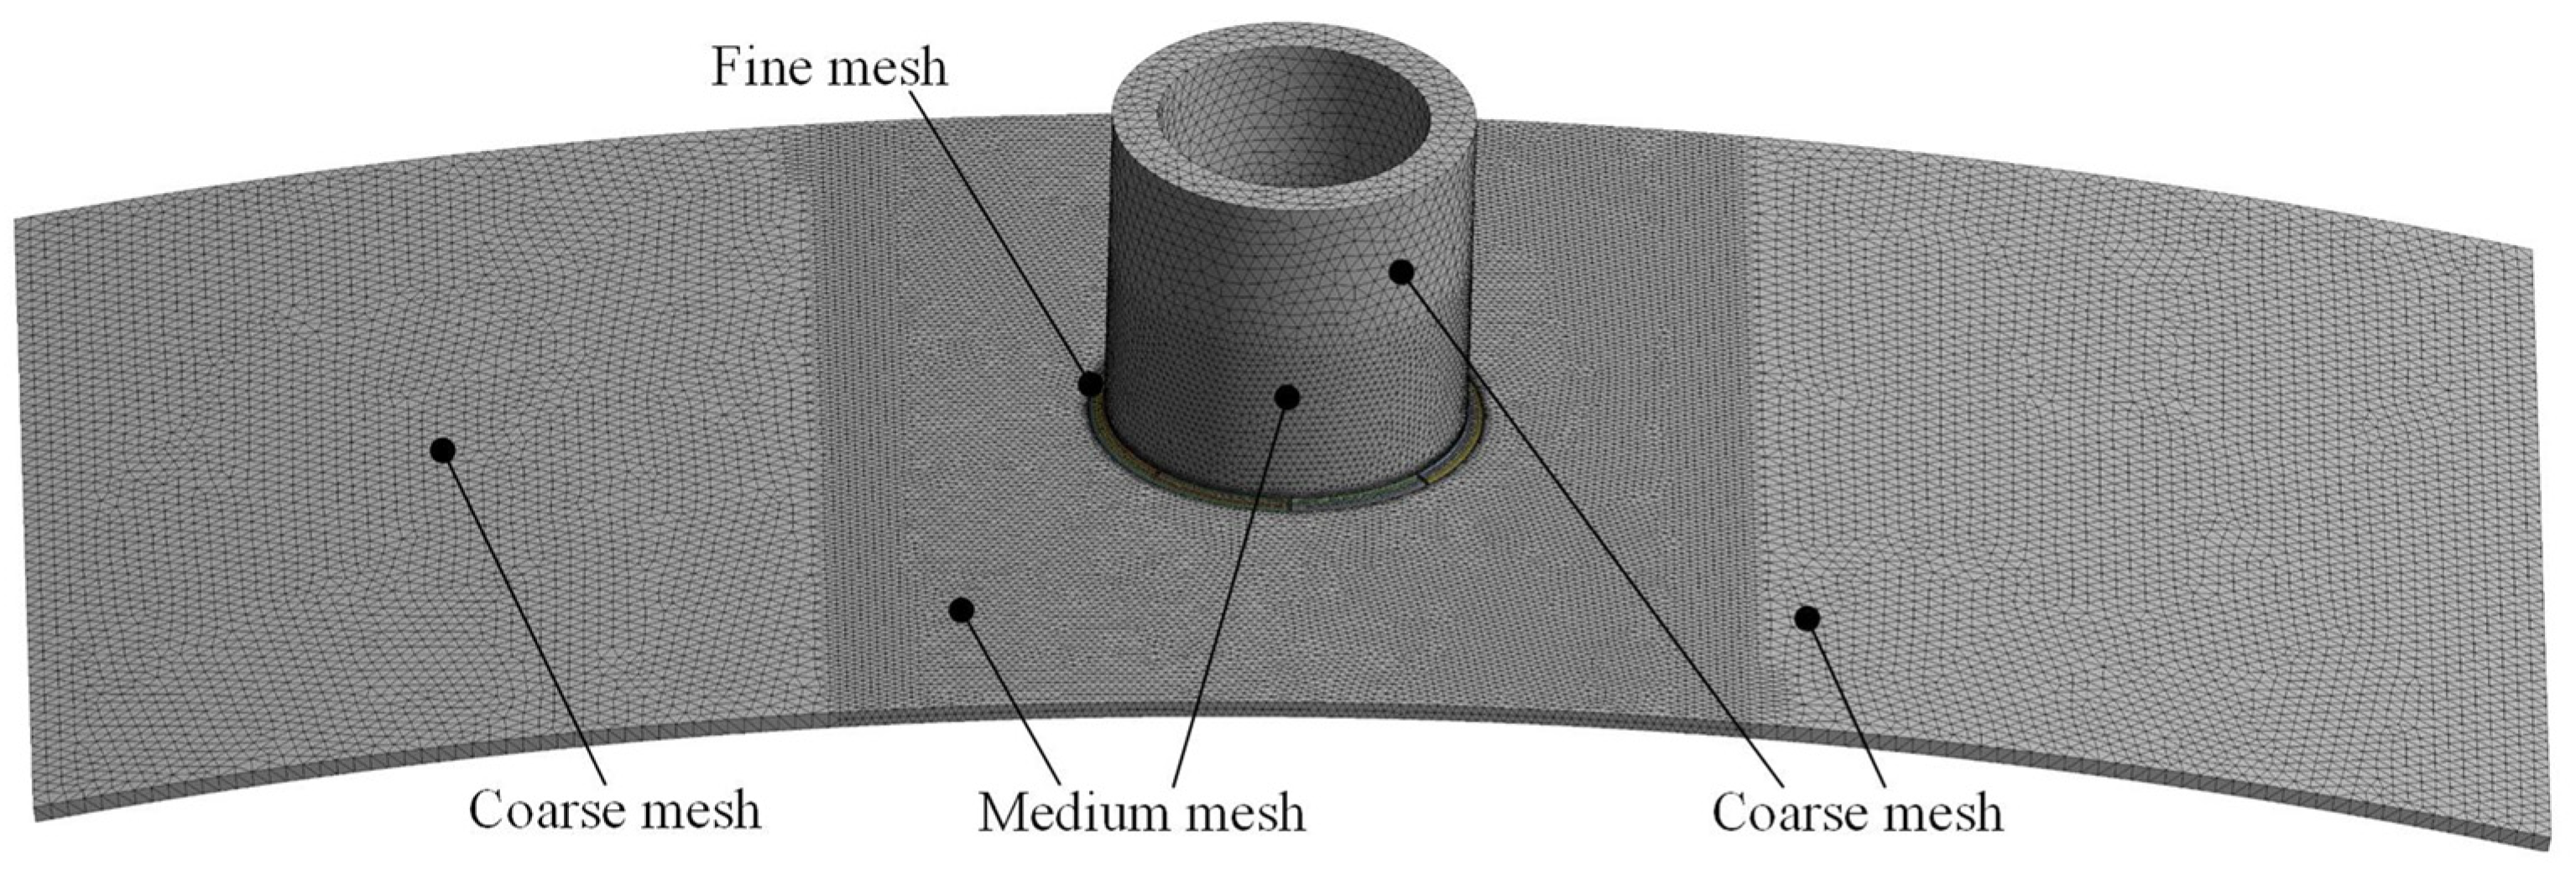
After completing the modeling and material setup of the curved penetration, mesh generation for the model can be performed [22]. The size and shape of the mesh determine the accuracy of the calculation. Although smaller meshes improve calculation accuracy, they also increase computational time and resource consumption. Due to the characteristics of the thick plate and the large diameter of the curved penetration component in this study, in order to reduce computational complexity, fine meshes are set near the weld seam, and coarse meshes are set far away from the weld seam. The weld seam mesh is divided into multiple regions using hexahedral elements with a mesh size of 2 mm, and the mesh type is SOLID186. The mesh farther from the weld seam on the curved surface has a maximum size of 15 mm, with the mesh type being SOLID187, as shown in Figure 15.

4.2. Numerical Simulation Analysis

After completing the preprocessing settings for the simulation, numerical simulation and analysis of the welding process for the curved penetration can be performed. The computer processor used for the simulation is an Intel Ulter9 185H, with 96 GB of RAM and an RTX 4050 graphics card. During the simulation, the manual welding process for thick plate large-diameter curved penetrations in the current shipbuilding and offshore engineering fields is used as a reference. The welding voltage is set to 25.2 V. The current is set to 230 A, and the welding speed is set to 8.3 mm/s. In addition, since the welding environment of this type of curved penetration is relatively closed, the convective heat transfer between the weldment surface and the air is set to 8 W/(m2·°C) in the temperature field boundary condition setting. Considering the complex spatial curve of the heat source trajectory, the heat source is loaded in the transient thermal module of Workbench using the APDL command flow, with a time step of 1 s. To make the simulation closer to the actual welding process, the Ansys birth–death element method is used to simulate the welding process.
Excluding the first manual argon arc root welding, the welds formed by the 10 mm-thick curved penetration use a three-layer, six-pass welding method, with a welding time of 600 s. For the 15 mm-thick curved penetration, the welds use a four-layer, ten-pass welding method, with a welding time of 1080 s. For the 20 mm-thick curved penetration, the welds use a four-layer, ten-pass welding method, with a welding time of 1680 s. Due to space limitations, this article focuses on the simulation process of a 15 mm curved component, with brief descriptions of a 10 mm and a 20 mm curved component.
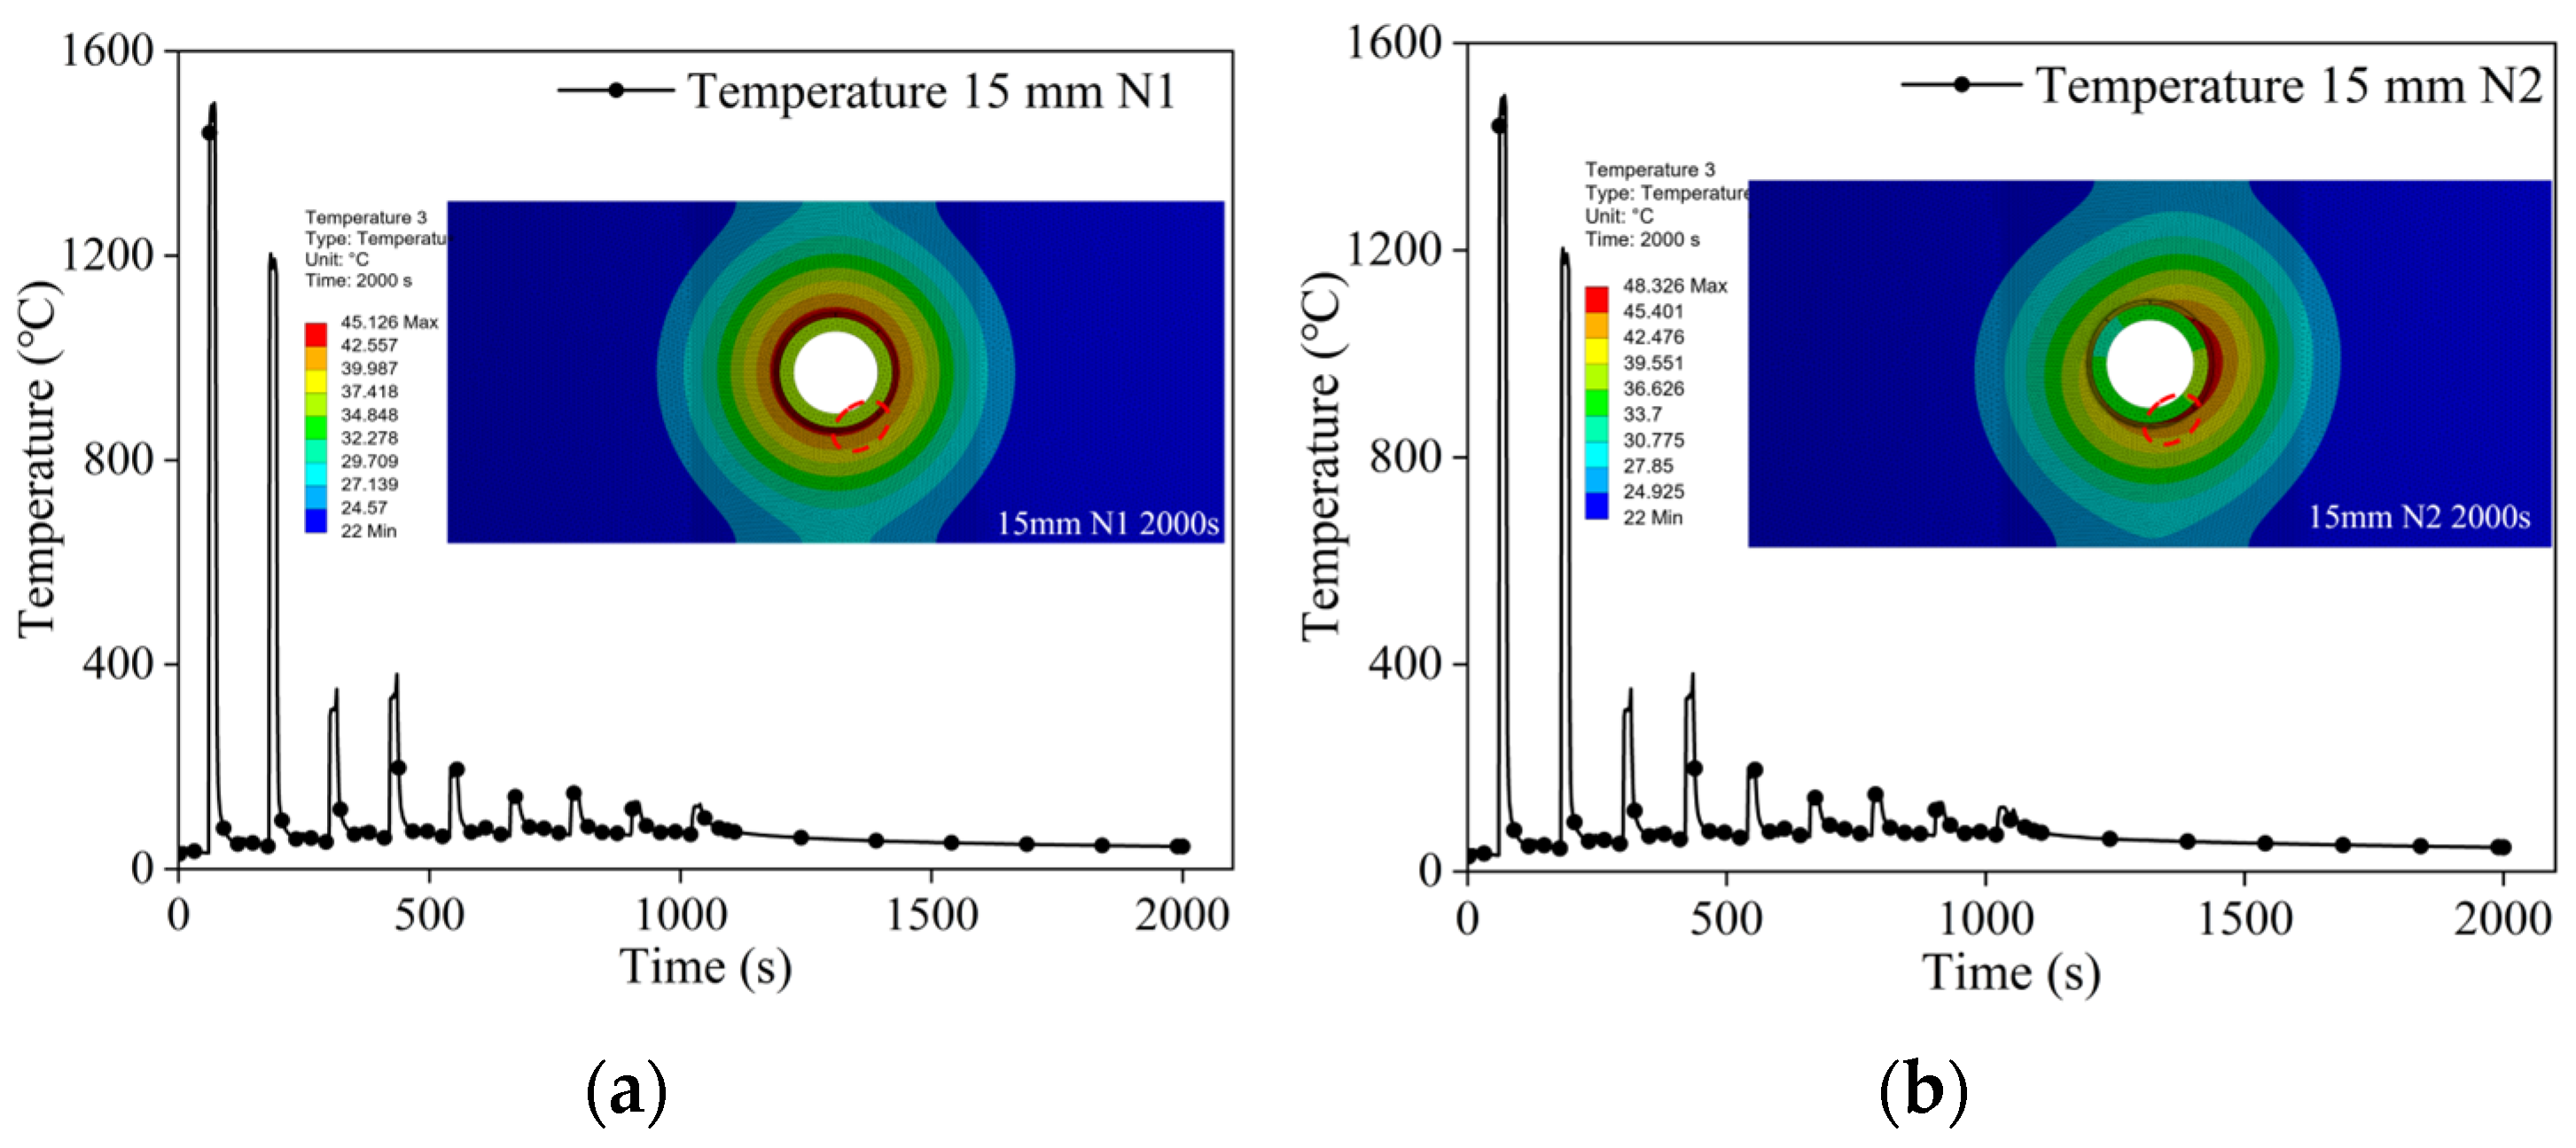
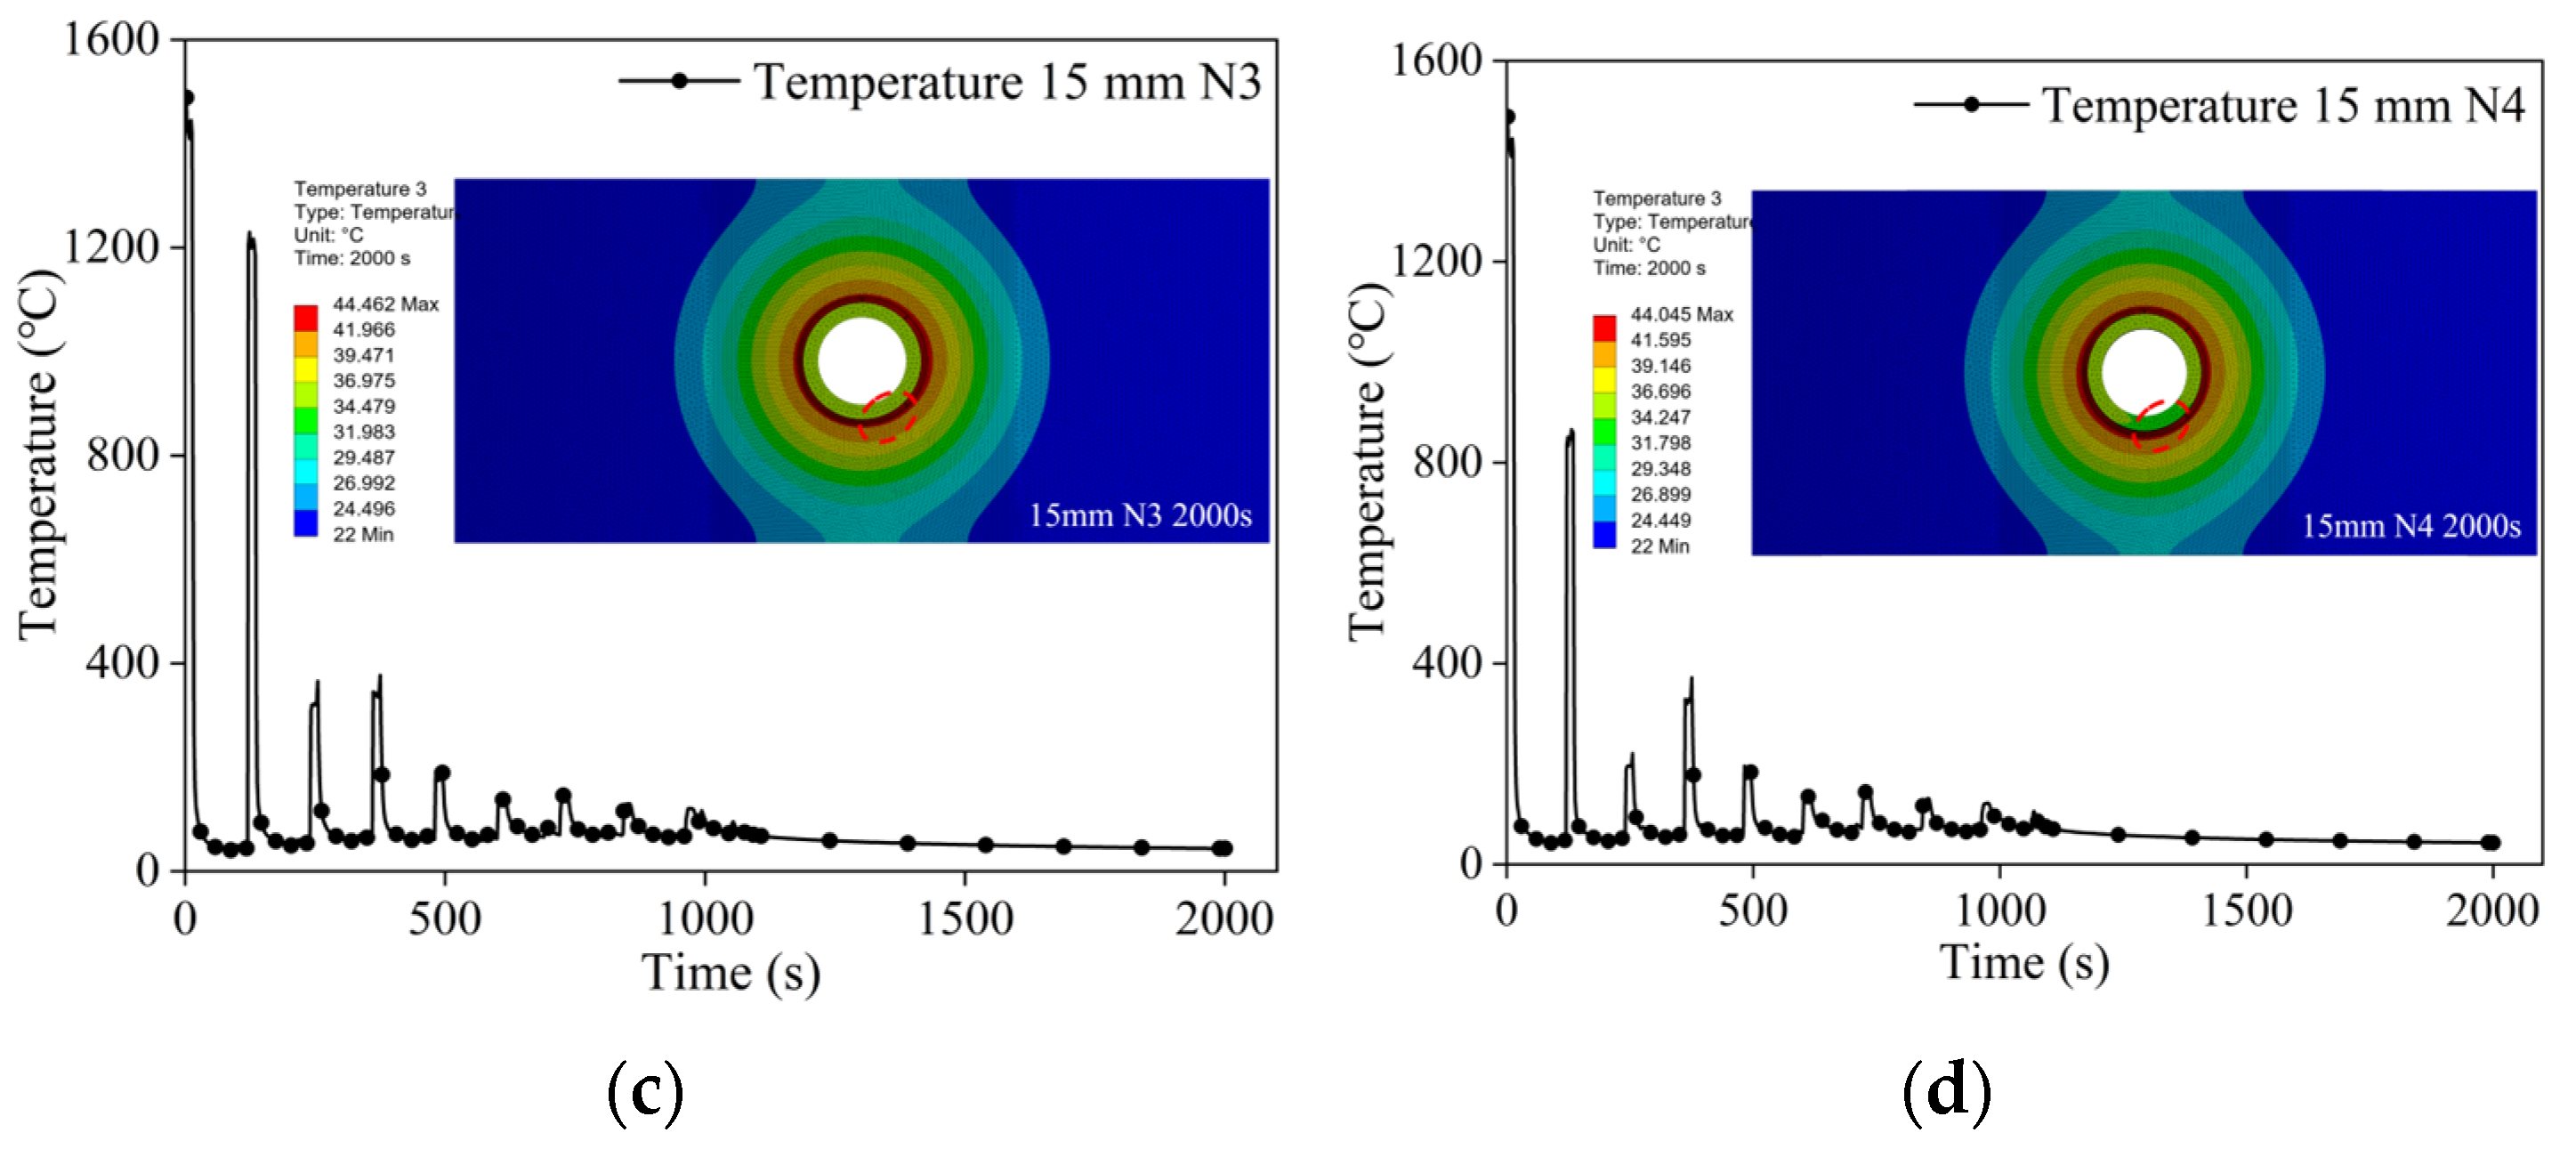
In order to verify the accuracy of the heat source, it is crucial to strictly control the heat in the entire welding simulation to ensure the welding quality. Taking the second layer a-segment of the weld in Figure 11 as an example, Figure 16 shows the temperature variation throughout the entire welding process.
The temperature variation throughout the entire welding process is shown in Figure 16.
From the welding node temperature in the figure, it can be seen that, during welding, the temperature of the weld seam rises sharply above the melting point of the steel, and once welding is completed, the weld seam temperature rapidly drops. As the weld layers accumulate, the previously welded layers are affected by the existing molten pool, causing the temperature to rise again [23]. The higher the number of weld layers, the smaller the effect of the molten pool on the lower layers. After 15 min of welding, the maximum temperature drops to around 45 °C, which closely matches the actual welding conditions in shipbuilding and offshore equipment, thus verifying the accuracy of the welding heat source. Additionally, the figure also shows that different welding sequences cause slight temperature variations in the a-segment weld, leading to welding deformation and residual stress due to localized thermal unevenness in the workpiece.
The temperature field in various welding sequences, shown in Figure 16, indicates that different welding sequences directly affect the temperature field during the welding process. After 15 min of cooling, the temperature field distribution for the N1, N3, and N4 welding sequences is relatively symmetrical, with N1 having a higher temperature field compared to N3 and N4. However, the temperature field for N2 is asymmetrical and higher, which is likely to cause the generation of residual stress. Therefore, the selection of a welding sequence is crucial for the effective control of the temperature field.
To study the effect of different welding sequences on welding deformation and residual stress, the data calculated from the transient thermal module are coupled into the transient structural module. Since welding involves large deformations, the “Full Newton-Raphson” method is used in the transient structural module, along with the “Weak Spring” and “Large Deflection” techniques. To increase the calculation speed, automatic linear search and SPARSE solver are employed, and fixed supports are added around the perimeter of the curved plate.
Based on transient structural calculations, Figure 17 shows the multi-layer and multi-pass segment welding deformation of a 15 mm-thick curved component. At 1080 s, the welding deformation for all four welding sequences reaches its maximum, with N3 exhibiting the least deformation and N1 showing the greatest deformation. Since the workpiece is not preheated to a certain temperature during the welding simulation, the overall heating of the curved component is relatively slow. Welding sequence N3 starts with a top–bottom diagonal symmetric weld, which causes significant welding deformation due to local uneven heating of the workpiece. As the number of welding layers increases, the curved component is heated evenly as a whole, and the welding deformation tends to grow steadily, which further verifies that the welding deformation changes in different welding sequences at 450 s. Before 450 s, N3 results in the largest welding deformation, while N2 results in the smallest. After 450 s, as the number of welding layers increases, the overall welding deformation stabilizes and continues to increase. Ultimately, the welding deformation based on the N3 welding sequence is the smallest, while the deformation based on the N1 sequence is the largest.
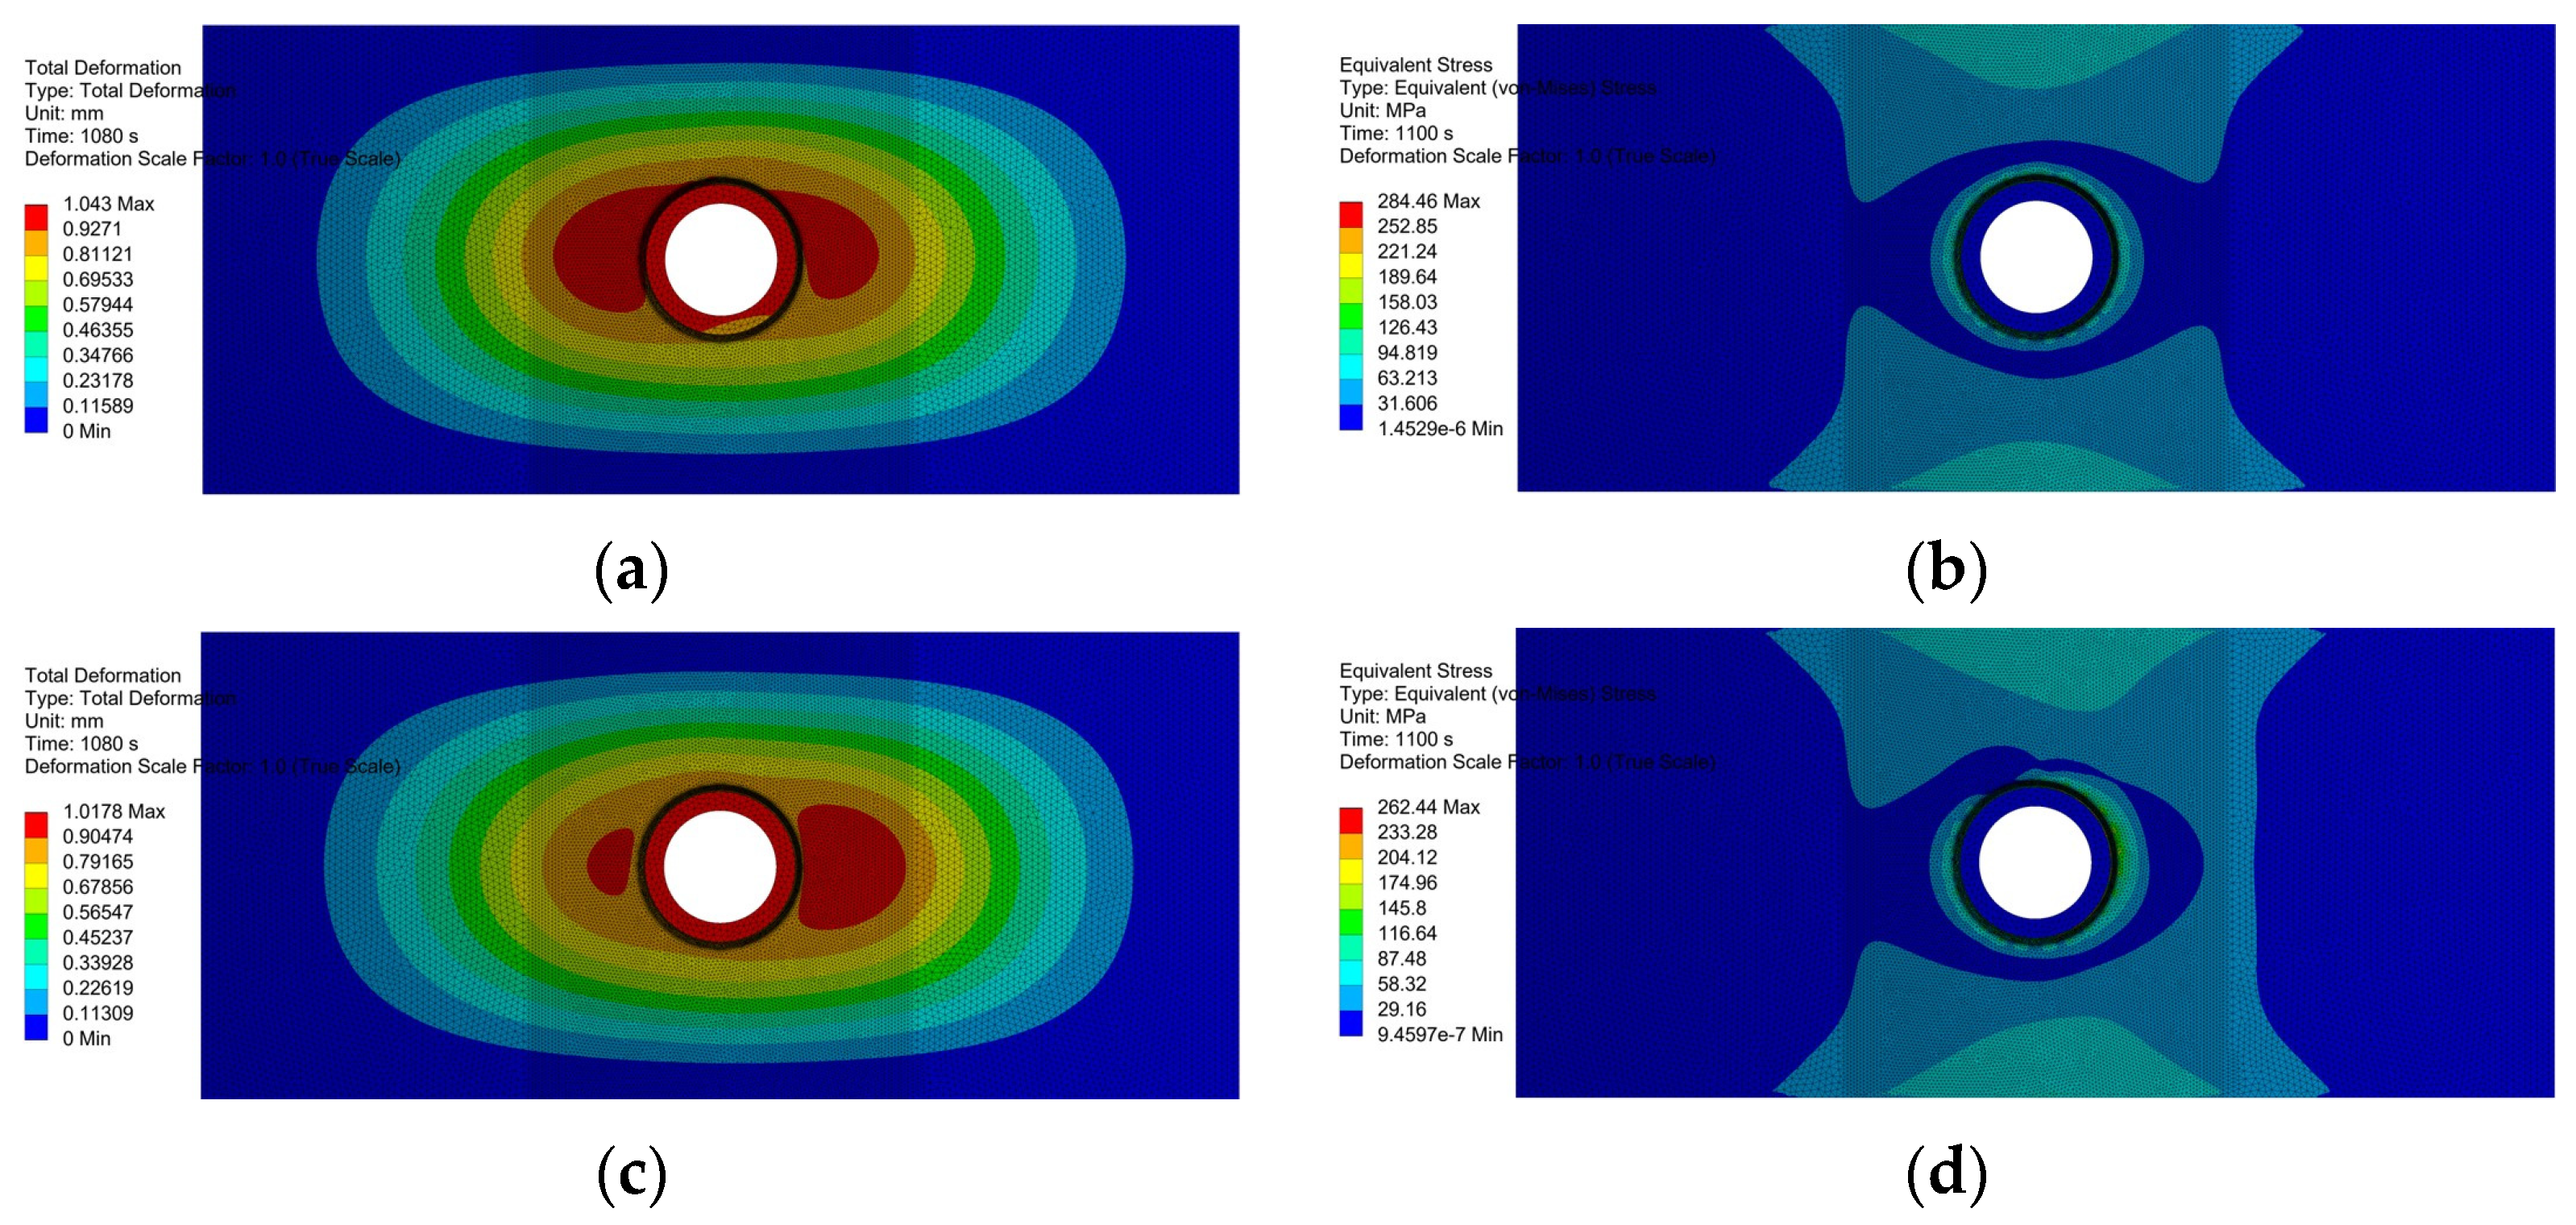
Figure 18 presents the welding deformation and residual stress of the 15 mm curved component based on the four welding sequences. From the deformation contour map, it can be observed that the welding deformation caused by the four welding sequences follows the order: N3 < N4 < N2 < N1. The deformation distribution for welding sequences N3 and N4 is more symmetric and uniform compared to N1 and N2. Sequence N1 adopts a left–right, but not top–bottom, symmetric segmented welding, while the other three sequences use full left–right and top–bottom symmetric welding, which results in noticeably larger deformation for N1. Additionally, N1 and N2 first perform vertical welding on the left and right seams, while N3 and N4 start with top–bottom diagonal symmetric welding. The contour maps for N3 and N4 show much more uniform deformation compared to N1 and N2. N3 has the smallest welding deformation, which is 9.36% less than the maximum deformation caused by N1. This is because N3 avoids the uneven heat distribution caused by heat concentration at the beginning. From the above analysis, it can be seen that the optimal welding sequence for a 15 mm-thick and large-diameter curved component is to start with top–bottom diagonal symmetric welding, followed by left–right symmetric welding.
Welding residual stress is the internal stress that remains in a welded structure due to deformation constraints during the welding process [24]. Because heat is concentrated near the weld during welding, significant deformation occurs near the weld. In this paper, fixed boundary conditions are applied to the edges of the welded part during the welding simulation, which tends to cause residual stress at the edges of the welded component. From the residual stress contour maps in Figure 18, caused by the four welding sequences, it can be observed that the maximum post-weld residual stress for each sequence is concentrated around the weld seam, and the stress is mostly distributed on the top and bottom sides of the curved plate, which aligns with the actual welding process. Post-weld residual stress corresponds to the welding deformation, meaning that areas with greater deformation have higher residual stress distribution. Since N1 uses left–right but not top–bottom symmetric segmented welding, while N2, N3, and N4 use full left–right and top–bottom symmetric welding, the post-weld residual stress values for N2, N3, and N4 are quite similar. The residual stress map shows that the post-weld residual stress based on N3 is 257.51 MPa. Compared to the maximum post-weld residual stress of N1 at 284.46 MPa, this stress is reduced by 9.47%.
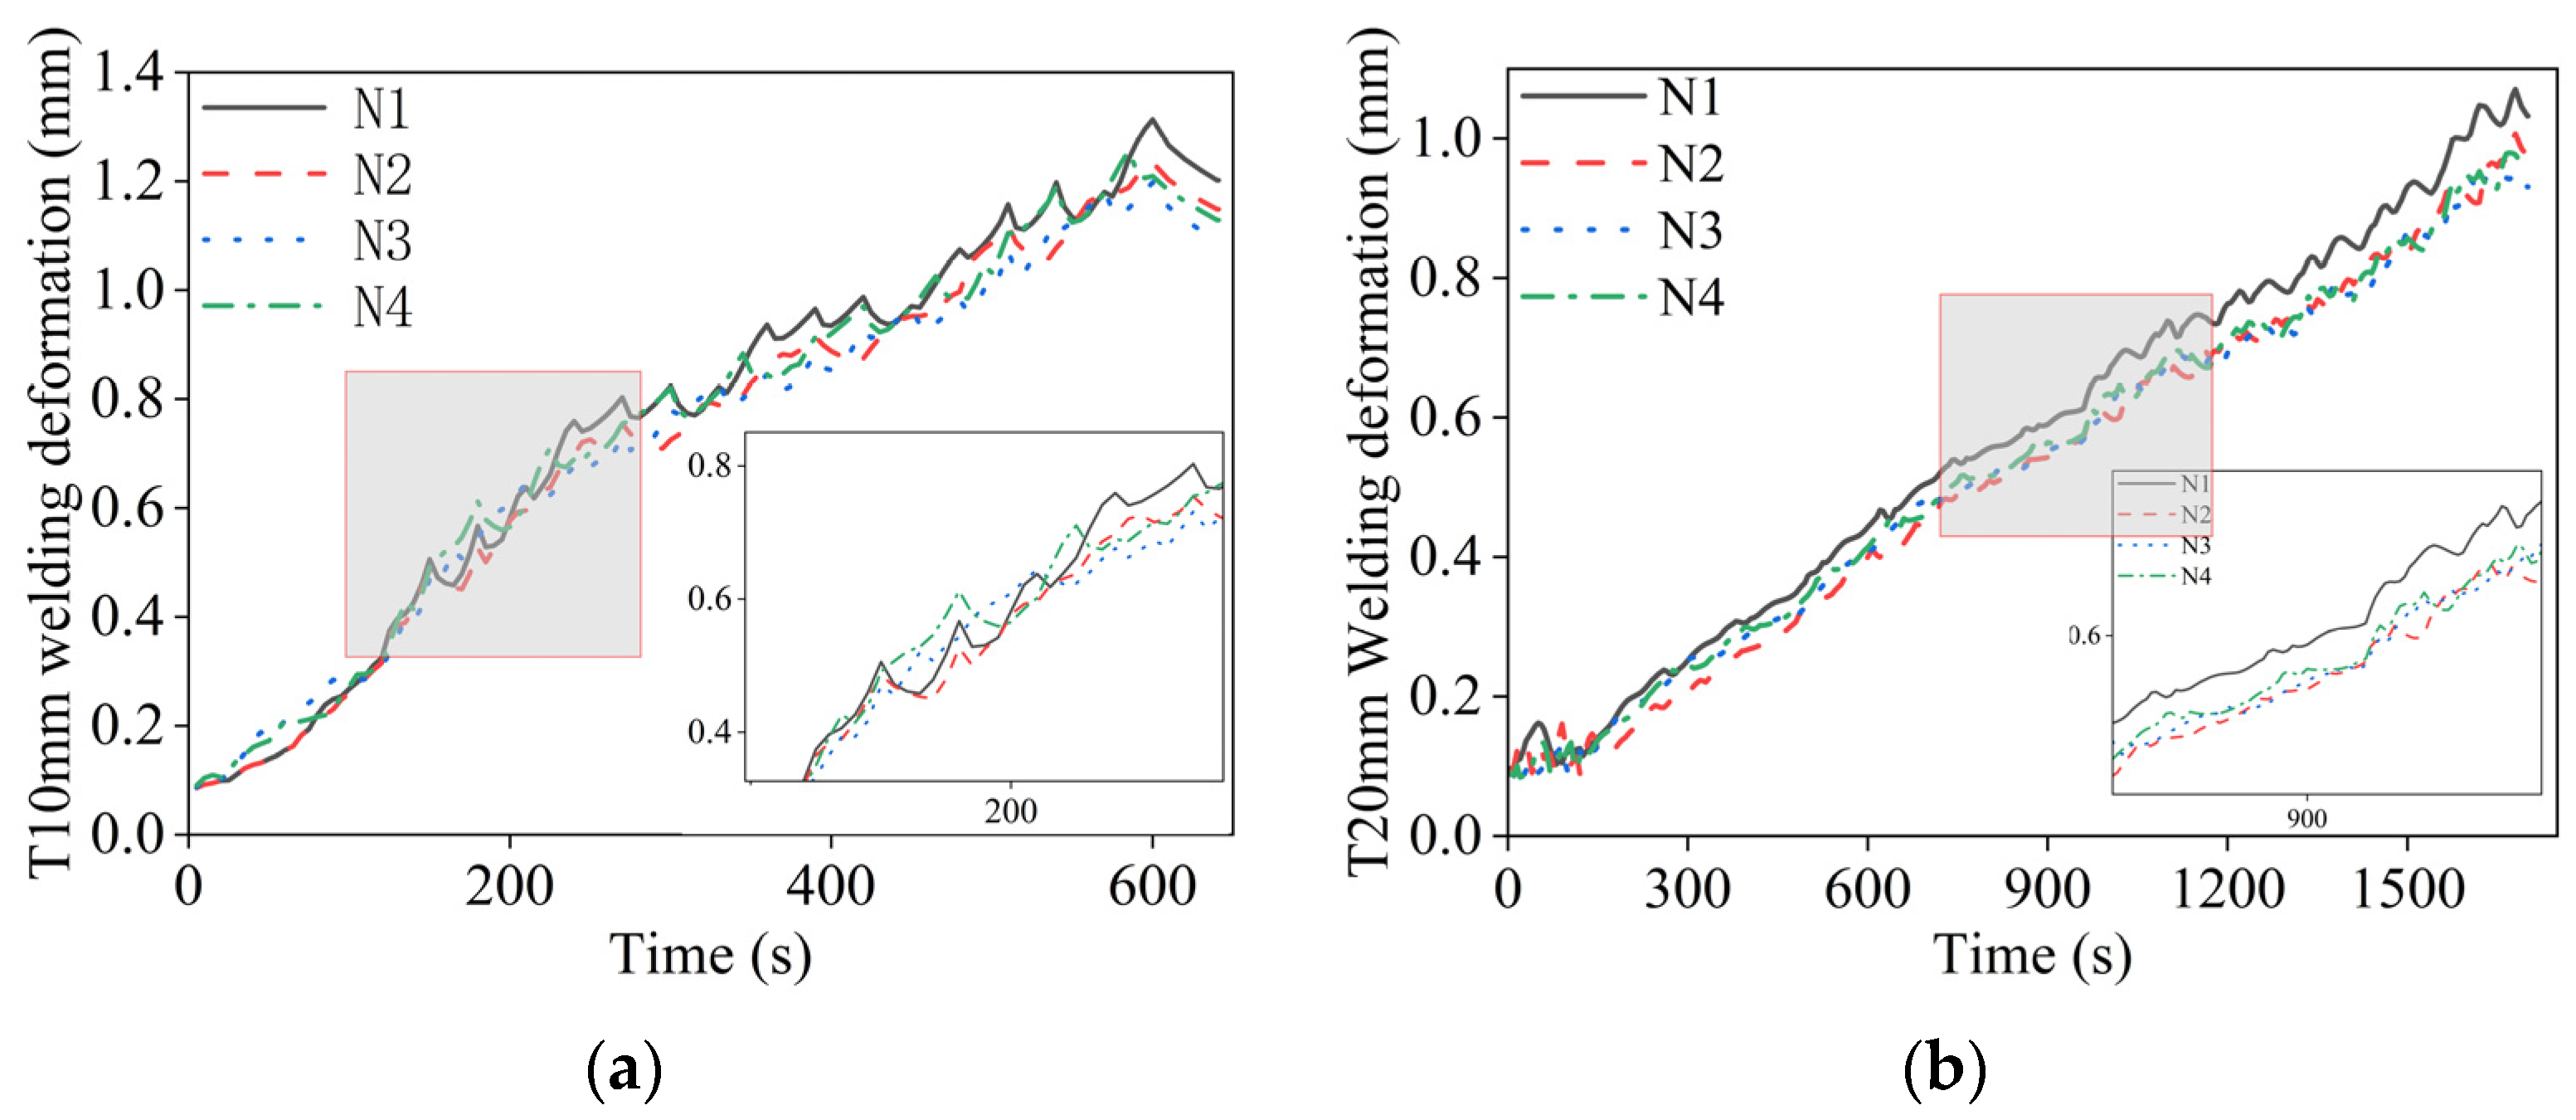
Similarly, the temperature fields for the 10 mm- and 20 mm-thick curved components are calculated in the transient thermal module, and these are imported into the transient structural module to calculate the deformation, as shown in Figure 19. From the figure, it can be observed that, for the 10 mm-thick plate, the welding deformation reaches its maximum at 600 s, with the maximum deformation caused by N1 and the minimum by N3. For the 20 mm-thick curved panel, the welding deformation reaches its maximum at 1680 s, with the maximum deformation caused by N1 and the minimum by N3. Compared to the 15 mm curved panel welding simulation, the welding deformations for these three thicknesses of the curved component follow a similar trend throughout the welding process. As the thickness of the curved panel increases, more time is needed for heat conduction, resulting in greater post-weld residual stress [25]. As the number of welding layers increases, the overall heat distribution in the curved panel becomes more uniform, and subsequent welding deformations tend to stabilize and increase gradually.
From the comparison of welding deformation in the figure, it can be observed that the welding deformation caused by the N3 welding sequence is the smallest for all three thicknesses of the curved component. For the 10 mm-thick curved component, the welding deformation under the N3 welding sequence is 1.198 mm, which is a reduction of 8.78% compared to the deformation of 1.3134 mm caused by the N1 welding sequence. For the 20 mm-thick curved component, the welding deformation under the N3 welding sequence is 0.95126 mm, which is a reduction of 9.58% compared to the deformation of 1.0521 mm caused by the N1 welding sequence. Due to the thinner 10 mm curved component, its overall deformation is relatively larger under the same welding current, voltage, and speed, which is consistent with actual welding scenarios. From the perspective of welding deformation for the three different thicknesses of the curved component, the N3 welding sequence undoubtedly results in the smallest welding deformation, with an average reduction of 9.24%.
From the comparison of residual stresses after welding in the figure, it can be seen that, for the 10 mm-thick curved component, the residual stress caused by the four welding sequences follows the order: N3 < N4 < N2 < N1. The welding residual stress caused by N3 is the smallest at 235.09 MPa. From the residual stress distribution cloud map, the residual stress for N3 is more symmetric and uniform. The residual stress caused by N4 is similar to that caused by N2 and N3. N1 results in the highest residual stress at 249.06 MPa. Compared to N1, the welding residual stress caused by N3 is reduced by 5.61%.
For the 20 mm-thick curved component, the residual stress caused by N3 is also the smallest at 315.99 MPa. The residual stress caused by N2 is the highest at 340.24 MPa. Compared to the residual stress caused by N2, the residual stress caused by N3 is reduced by 7.12%.
From the comparison of welding deformation and residual stress, it can be seen that, for the curved welds formed by the three thickness curved penetrations, the N3 welding sequence, that is, the welding sequence of first upper and lower oblique symmetry and then left and right symmetry, is the best, and it can effectively suppress welding deformation and residual stress after welding.

5. Improvement of Welding Process

In this paper, the optimal welding sequence for intersecting seams of thick curved components with three different thicknesses is optimized based on the current manual welding processes used in the shipbuilding and offshore industries. During manual welding, in order to achieve the best welding process, workers first set the welding current based on their experience with scrap steel plates. Then, they determine the preliminary voltage based on Equation (22), and during the trial welding process, they gradually fine-tune the parameters until the welding results are optimal.
U = ( 0.04 I + 16 ) ± 2 V
In the welding process of curved penetrations, the welding current determines the heat of welding, the welding voltage determines the size of the weld pool, and the wire-feeding speed determines the welding speed.
These three parameters interact with each other, but there is no clear mathematical relationship defined at present. In real-world welding, workers in the shipbuilding and offshore industries mainly rely on engineering experience to set the welding parameters. To enhance the efficiency of welding process optimization, based on the optimized N3 welding sequence and drawing from manual welding experiences in Chinese shipyards, this paper designs three welding processes for horizontal, vertical, and overhead welding for the intersecting seams, as shown in Table 3.
Subsequently, the orthogonal experimental method is used to improve the welding process for different weld segments, with the specific experimental plan detailed in Table 4.
According to the orthogonal scheme in Table 4, the welding parameters for each segment are first used with Equation (11) to calculate the moving heat source equation. Then, the APDL code for the segmented welding of the curved component is written. Finally, the code is imported into Workbench, and the welding deformation and residual stresses for the nine sets of welding processes are calculated. As an example, Table 5 presents the calculation results for a curved component with a plate thickness of 15 mm.
In order to better understand the optimal welding process for the 15 mm curved component, the paper presents the best segmented welding process combination shown in Table 6, based on the results of the aforementioned orthogonal experiments. Ki is the sum of welding deformation under a certain factor level i in the nine experiments; factor i refers to the process combinations in Table 3; Ki is the mean value of Ki. Rang is the extreme deviation, which is the difference between the maximum value of the mean and the minimum value of the mean.
First, from the post-weld residual stress in Table 5, it can be seen that the first experimental group has the largest residual stress, which is much higher than those based on the sixth and seventh experimental plans. Therefore, from the perspective of residual stress, the welding parameters from the sixth and seventh experimental groups should be prioritized. Next, from the range data in Table 6, it is observed that the welding deformation is largest for horizontal welding, followed by vertical welding, and smallest for overhead welding. Therefore, from the perspective of welding deformation, the welding parameters from experimental plans one, six, and seven in Table 4 should be selected first.
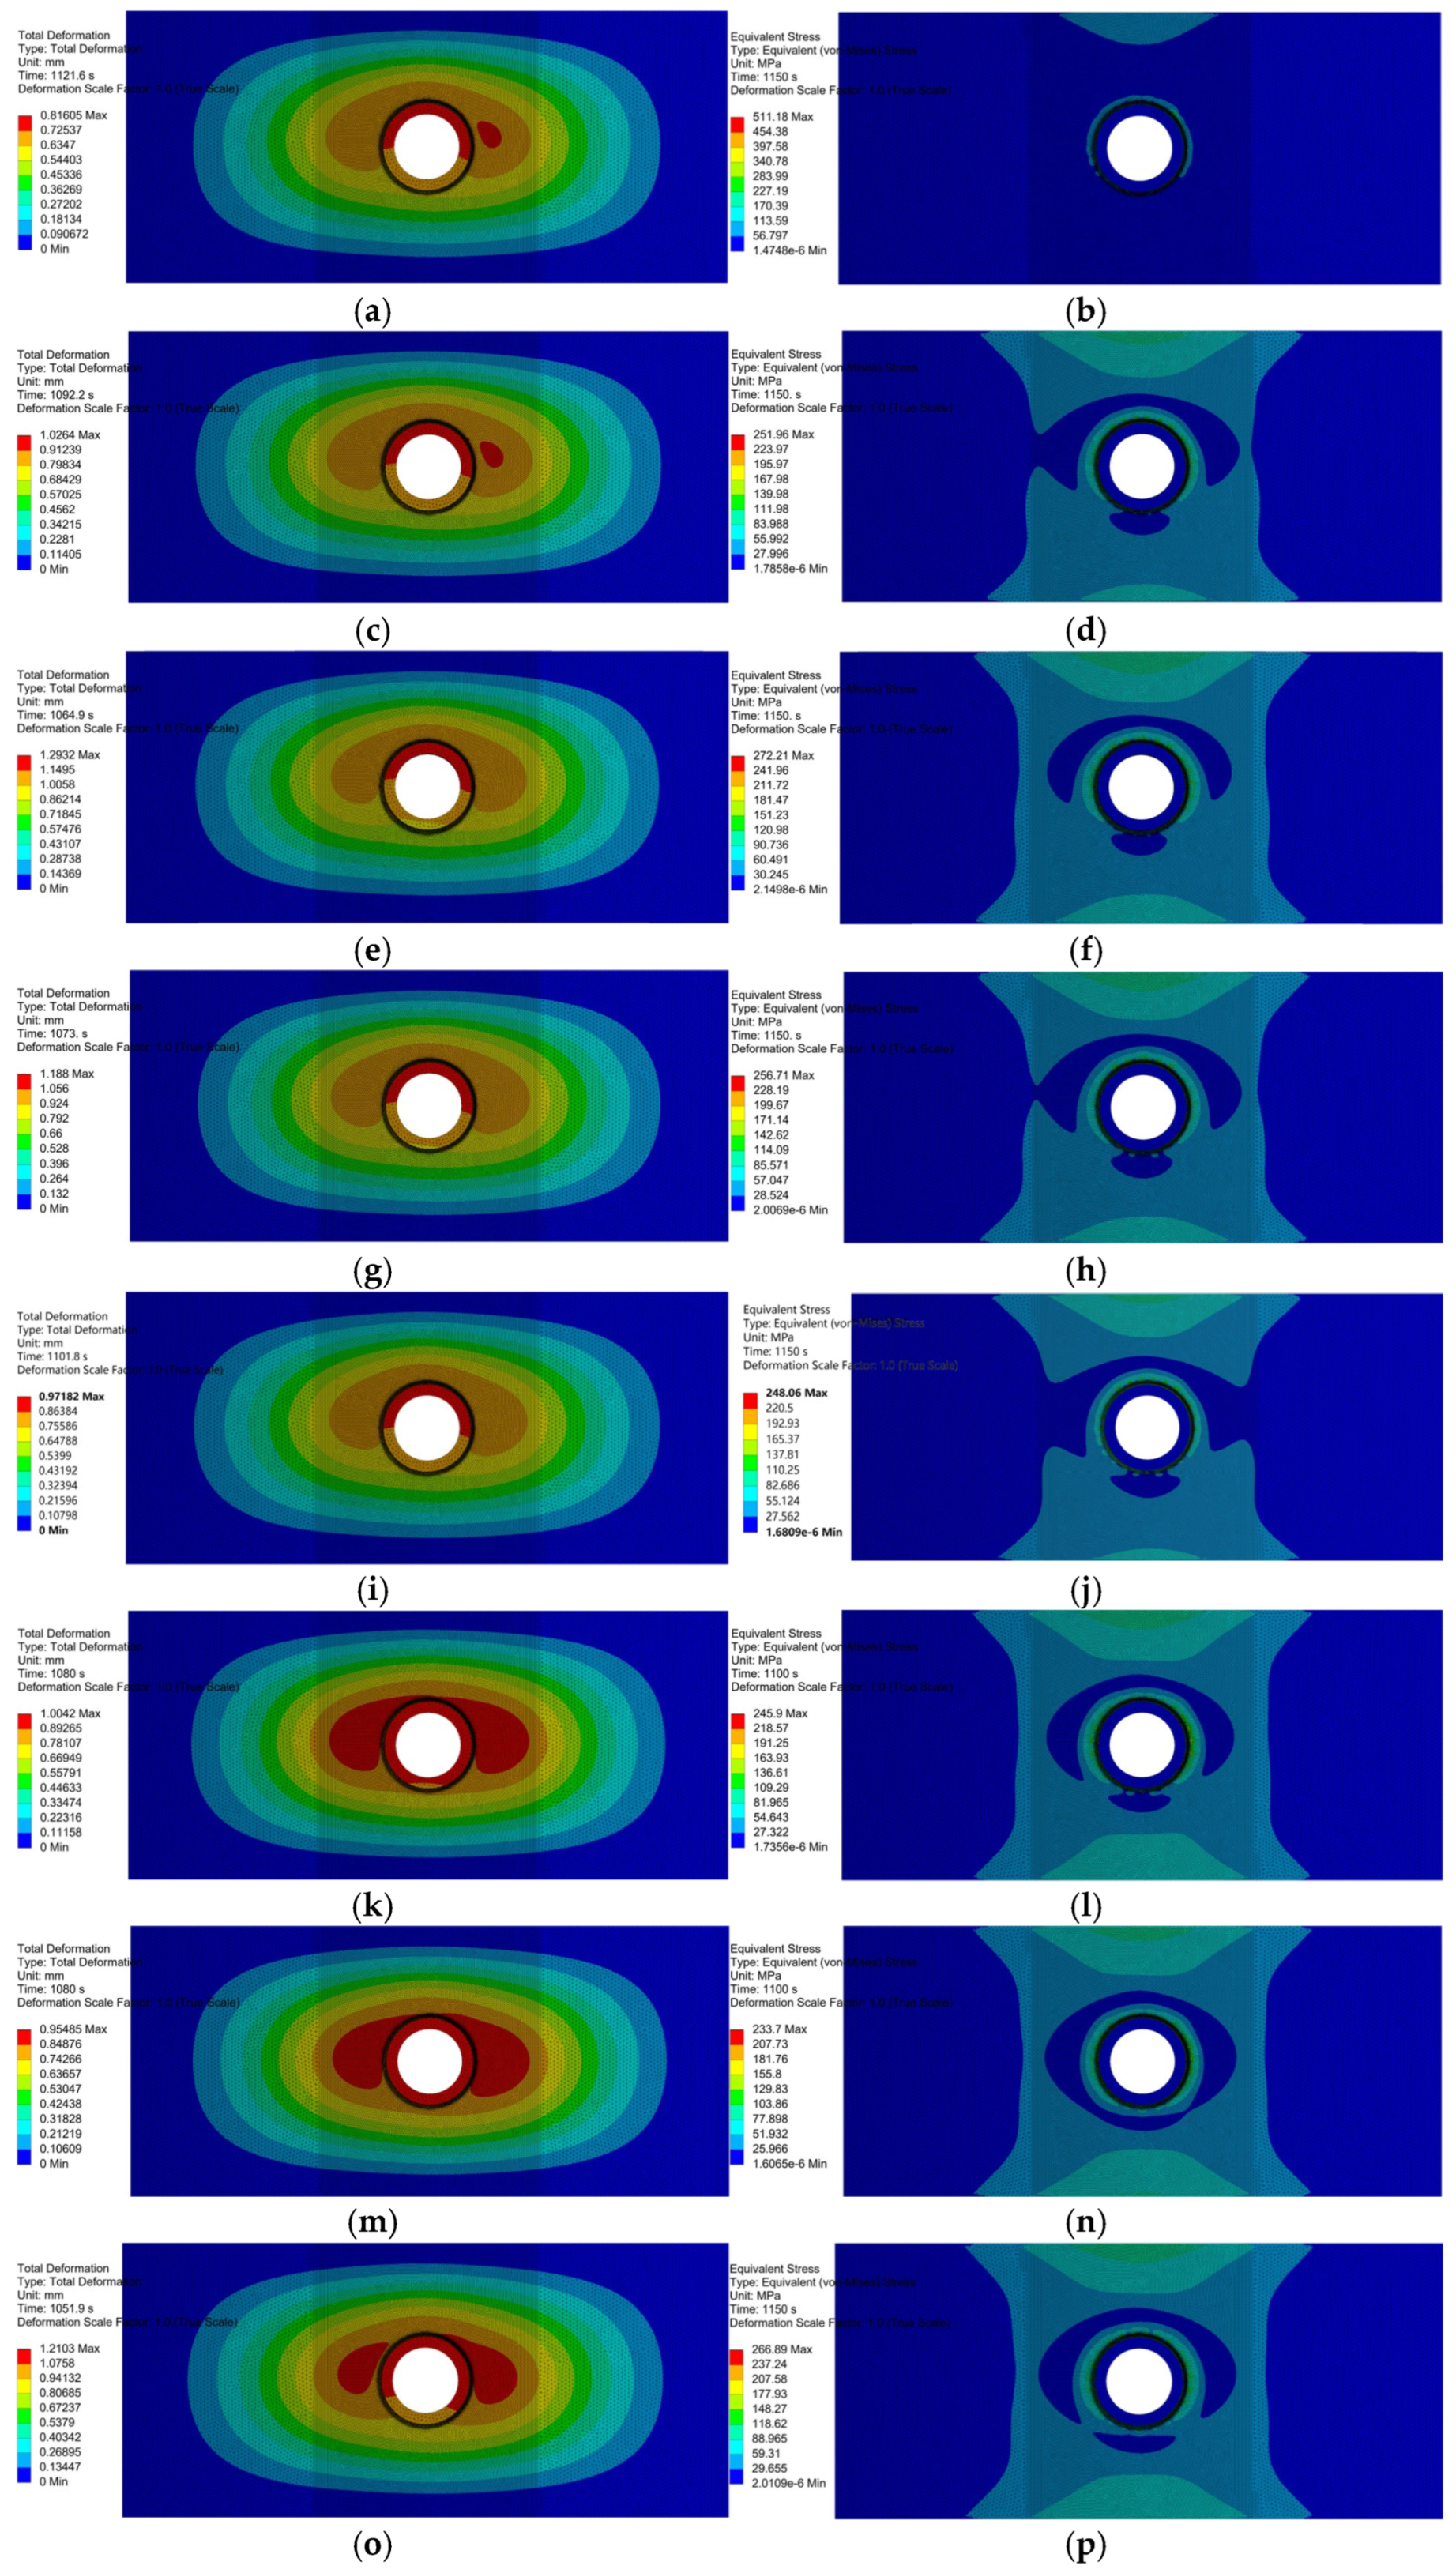
Additionally, from the welding deformation and residual stress diagrams in Figure 20, it can be seen that, because the c and d section welds use horizontal welding processes, the larger welding voltage and current cause significant deformation in the upper part of the curved component. The concentrated heat around the weld causes the residual stress to be primarily concentrated around the weld and extends towards the edges of the curved component. As shown in Figure 20k,m, the welding deformation distribution based on the sixth and seventh experimental groups is more symmetric. Figure 20l,n show that the post-weld residual stress is concentrated around the weld and extends to the edges of the component. However, the residual stress from the seventh experimental plan is more symmetrically distributed and has a lower value compared to the sixth experimental plan. The welding deformation caused by the seventh experimental group is 0.95485 mm, which is a reduction of 0.33836 mm compared to the maximum deformation. The post-weld residual stress caused by the seventh experimental group is 233.7 MPa, which is 277.48 MPa lower than the maximum residual stress.
In summary, for welding the 15 mm curved penetration, the welding process parameters from the seventh experimental plan are the optimal choice. Specifically, for the horizontal welding section, the welding voltage is 25.2 V, the welding current is 230 A, and the welding speed is 8.6 mm/s. For the vertical and overhead welding sections, the welding voltage is 24.8 V, the welding current is 220 A, and the welding speed is 8.3 mm/s.
From the above comparison, it can be seen that, when welding a 15 mm curved penetration, the welding process parameters in the seventh experimental plan are the preferred options, namely, the welding voltage of the horizontal welding section is 25.2 V, the welding current is 230 A, and the welding speed is 8.6 mm/s. The welding voltage of the vertical welding and overhead welding sections is 24.8 V, the welding current is 220 A, and the welding speed is 8.3 mm/s.
According to the orthogonal scheme in Table 4, the orthogonal simulation results of the welding deformation and the residual stress of the 10 mm and 20 mm curved components are also calculated in this paper, as shown in Table 7.
Based on further processing of the above data, the results shown in Table 8 are obtained. From the table, it can be seen that, when welding the 10 mm curved component, the welding deformation is largest in the vertical welding section, followed by the horizontal welding section, and the smallest in the overhead welding section. Therefore, from the perspective of welding deformation, the welding parameters of the first, fifth, and ninth experimental plans should be prioritized. However, considering welding residual stress, the welding parameters of the first and fifth experimental plans should be prioritized. Furthermore, comparing the welding efficiency between the first and fifth experimental schemes shows that the latter is faster. In summary, for the welding of a 10 mm curved component, the welding parameters in the fifth experimental scheme are optimal. That is, the welding voltage in the horizontal welding section is 25.6 V, the welding current is 240 A, and the welding speed is 8.9 mm/s. The welding voltage in the vertical and overhead welding sections is 24.4 V, the welding current is 210 A, and the welding speed is 8 mm/s. Based on the fifth experimental plan, the welding deformation is 1.1695 mm, which is a reduction of 0.2482 mm compared to the maximum deformation, and the residual stress is 231.97 MPa, reduced by 29.55 MPa compared to the maximum residual stress.
Similarly, when welding 20 mm curved component, by comparing the welding deformation, welding residual stress and welding speed, it can be seen that the welding parameters in the 7th experimental scheme are optimal, namely, the welding voltage of the horizontal welding section is 25.2 V, the welding current is 230 A, and the welding speed is 8.6 mm/s. The welding voltage of the vertical welding and overhead welding sections is 24.8 V, the welding current is 220 A, and the welding speed is 8.3 mm/s. Based on the 7th experimental scheme, the welding deformation is 0.8958 mm, which is a reduction of 0.1356 mm compared to the maximum deformation, and the residual stress is 286.82 MPa, reduced by 134.92 MPa compared to the maximum residual stress.
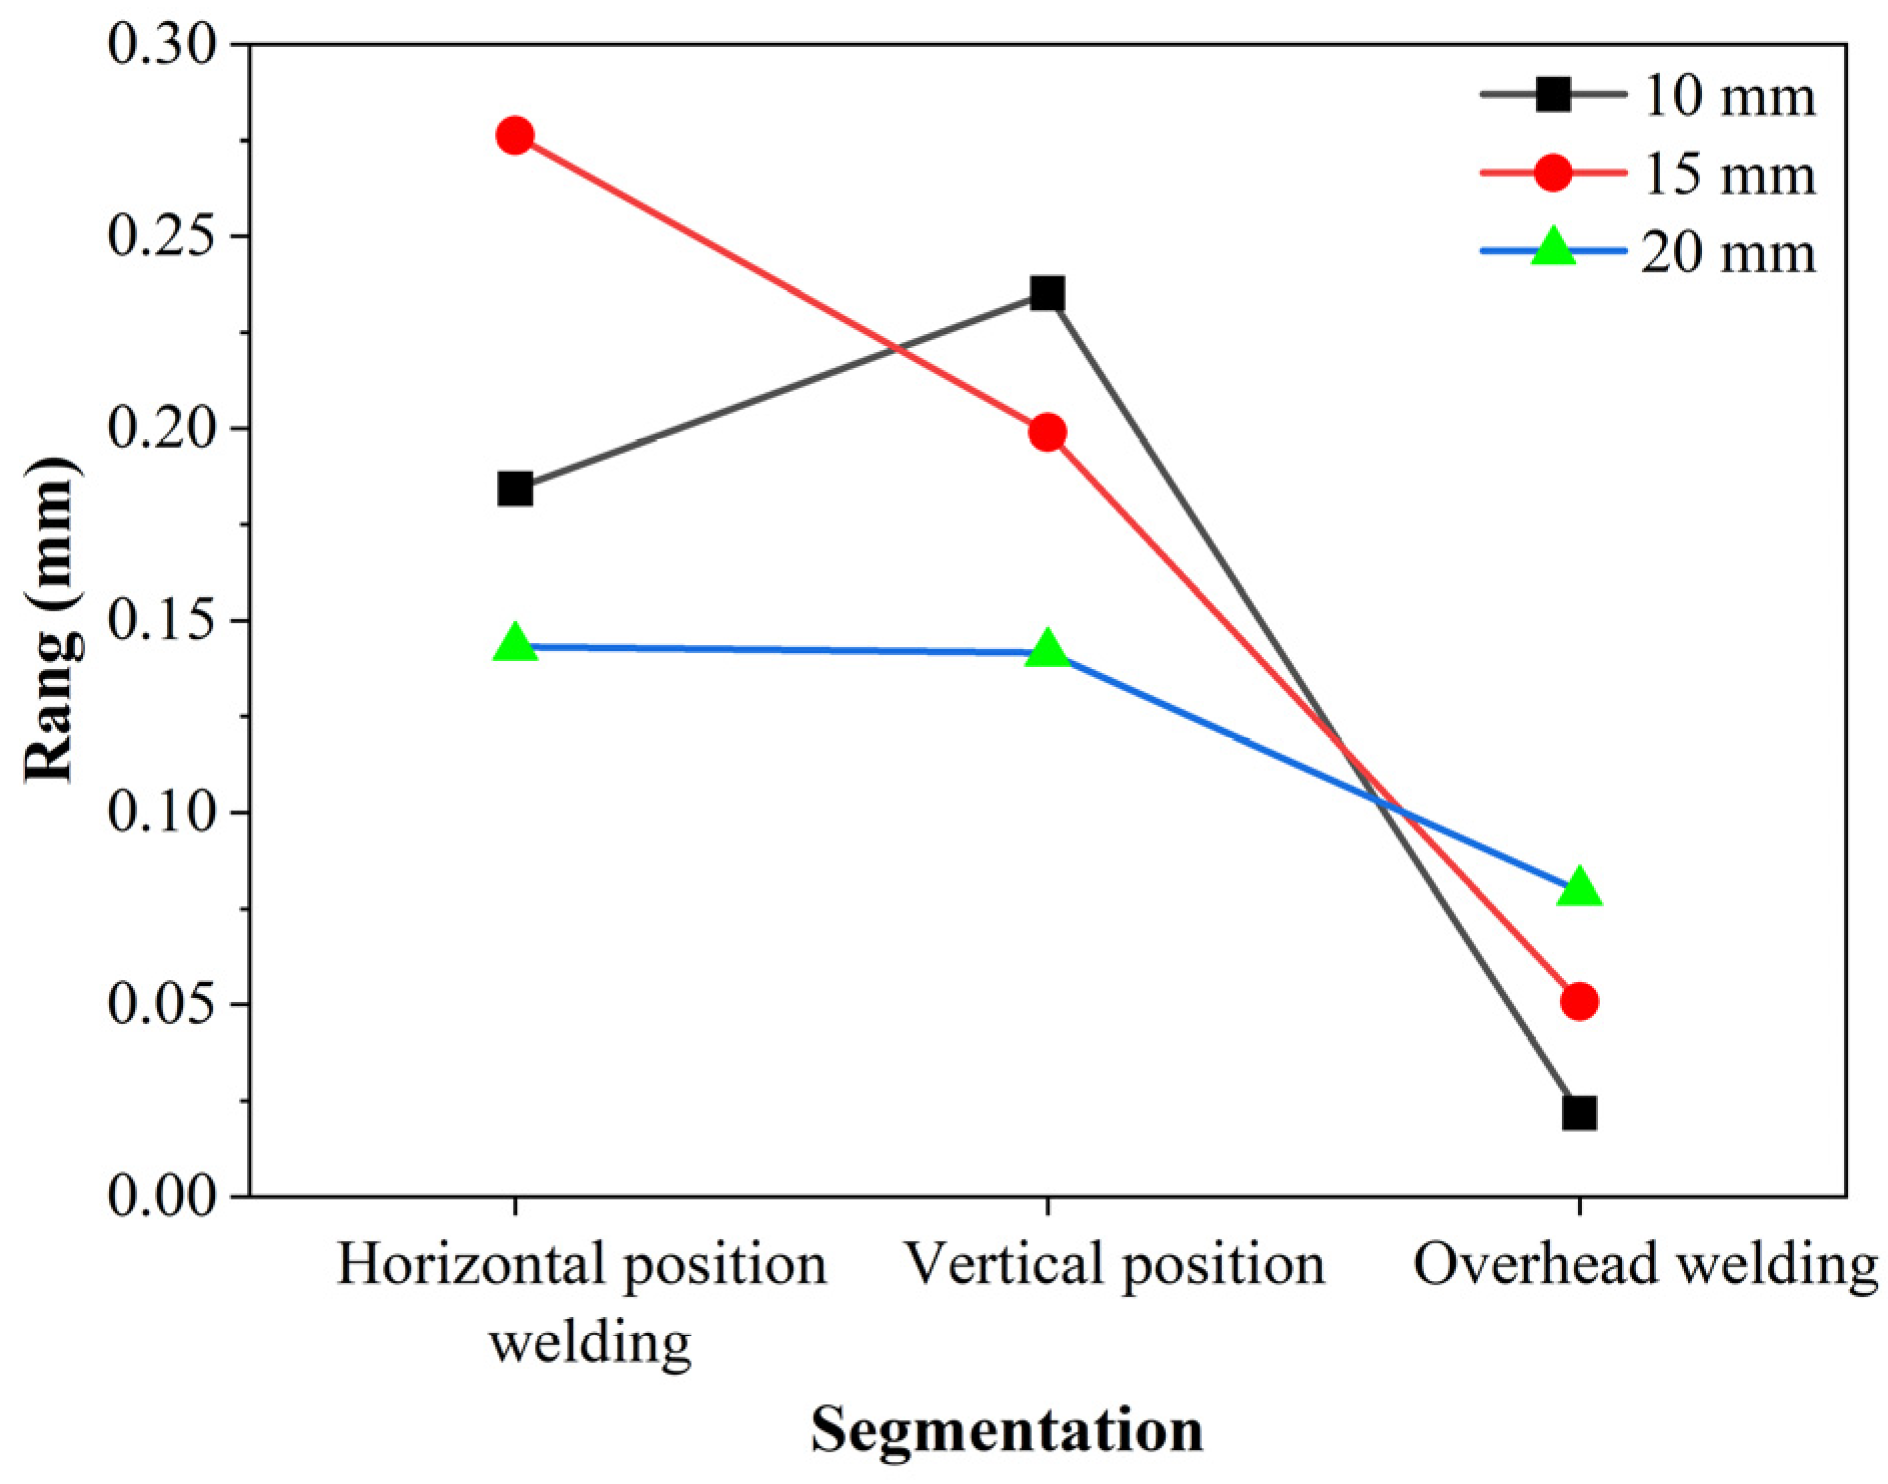
Figure 21 shows the range chart of orthogonal welding experiments for curved components with three different thicknesses.
From the figure, it can be seen that the sensitivity of different welding sections to welding parameters varies for workpieces of different thicknesses. Since thick plates have a larger mass and heat capacity, the heat gradient and cooling rate changes during welding are more complex, resulting in different distributions and magnitudes of residual stress. This aligns with the actual welding conditions in shipyards. During the welding of thick plates, a greater number of welding layers leads to higher residual stresses [26], which can cause cracks or fractures in the curved components. Therefore, the selection of optimal welding process parameters is particularly important for effectively suppressing welding deformation and post-welding residual stresses, as well as improving welding quality.

6. Conclusions

To obtain the optimal welding sequence and welding process for the segmented welding of large-diameter curved penetrations in thick plates, numerical simulations of segmented welding under four different welding sequences for curved plates of three thicknesses are carried out in this paper. Then, orthogonal experiments are performed for nine welding plans based on the optimal welding sequence. Through numerical calculations and theoretical analysis, the following conclusions can be drawn:
(1)
The weld planning is carried out using the equal area method, and a multi-layer, multi-pass welding trajectory equation is established for thick plate curved penetrations, ensuring the accurate simulation of segmented welding for different thicknesses of curved plates under various welding sequences in subsequent stages;
(2)
Based on the multi-layer, multi-pass welding trajectory equation and the use of a Gaussian heat source, the multi-layer, multi-pass moving Gaussian heat source is calculated. Finite-element theory is applied to obtain the temperature and stress fields during the segmented welding of intersecting welds, laying the foundation for optimizing the welding sequence and improving the welding process;
(3)
For the three thicknesses of the curved penetrations, numerical simulations of segmented welding are carried out under four welding sequences. The results show that the optimal welding sequence is first a skew-symmetric sequence followed by a left–right symmetric sequence, which effectively suppresses welding deformation and residual stresses;
(4)
For the three thicknesses of curved plates, orthogonal experiments are conducted for nine welding parameter schemes. Through these experiments, the best welding parameters for each thickness of the curved plate are determined. Additionally, it is observed that, as the plate thickness increases, the welding process parameters for each weld segment should not differ too much, as this helps effectively suppress welding residual stress and deformation.

Author Contributions

Methodology, H.M. and Y.S.; validation, W.X., S.Z., and H.M.; original draft preparation, H.M. and Y.S.; writing, H.M. and M.Y. All authors have read and agreed to the published version of the manuscript.

Funding

This research was funded by the High-tech Ship Scientific Research Project from the Ministry of Industry and Information Technology (CBG01N23-04-02) and the 2024 Industry–University Research Pre-research Fund Project of Zhangjiagang City (ZKYY2427).

Institutional Review Board Statement

Not applicable.

Informed Consent Statement

Not applicable.

Data Availability Statement

The data is included in the article.

Conflicts of Interest

The authors have no relevant financial or non-financial interests to disclose.

References

  1. Zhang, Y. Research on united planning of welding trajectory and parameters of welding robot for intersecting pipes. Master’s Thesis, Tianjin University, Tianjin, China, 2020. [Google Scholar] [CrossRef]
  2. Liu, S.; Wu, Z.Q.; Zhou, W.H.; Zhou, H.G.; Zhang, K.K.; Yin, D.Q.; Lei, Y.P.; Qiu, Y.F. A review of welding simulation methods for large components. Prog. Nat. Sci. Mater. Int. 2023, 33, 551–568. [Google Scholar] [CrossRef]
  3. Li, Y.; Hou, J.Y.; Gu, L.J.; Li, L.B.; Wan, Z.G. Influence of hardening model on the simulation calculation of thermal-mechanical coupling in ti80 thick plate welding. Electr. Weld. Mach. 2024, 54, 50–63. [Google Scholar] [CrossRef]
  4. Park, J.U.; An, G.B. Effect of welding sequence to minimize fillet welding distortion in a ship’s small component fabrication using joint rigidity method. Proc. Inst. Mech. Eng. Part B-J. Eng. Manuf. 2016, 230, 643–653. [Google Scholar] [CrossRef]
  5. Huo, L.; Ren, Y.L. Optimization of cylindrical structure and welding process based on welding deformation control. MW Met. Form. 2024, 2, 30–33. [Google Scholar] [CrossRef]
  6. Bi, X.S.; Li, Z.B.; Gao, W.G.; Shang, P. Effect of welding parameters on stainless steel lap weld formation. Hot Work. Technol. 2025, 53, 49–52. [Google Scholar] [CrossRef]
  7. Wang, X.K. Research on numerical simulation and deformation control of construction hoist cage skeleton welding. Master’s Thesis, Shandong Jianzhu University, Jinan, China, 2024. [Google Scholar] [CrossRef]
  8. Li, J. Research on the welding characteristics and properties of 16mndr steel using gmaw/fcaw. Master’s Thesis, Kunming University of Science and Technology, Kunming, China, 2025. [Google Scholar] [CrossRef]
  9. Hu, X.; Feng, G.J.; Wang, Y.F.; Zhang, C.H.; Deng, D. Influence of lumping passes on calculation accuracy and efficiency of welding residual stress of thick-plate butt joint in boiling water reactor. Eng. Struct. 2020, 222, 111136. [Google Scholar] [CrossRef]
  10. Gadallah, R.; Murakawa, H.; Shibahara, M. Investigation of fracture parameters for a surface-cracked multi-pass t-joint considering welding residual stress. Theor. Appl. Fract. Mech. 2023, 127, 104080. [Google Scholar] [CrossRef]
  11. Mi, D.W.; Shen, T.K.; Su, X.H.; Guo, B.C.; Zou, X.P.; Sun, G.; Wu, C.P. Simulation of welding temperature field and stress-strain field of canopy welded seam in control rod drive mechanism of nuclear power plant. J. Netshape Form. Eng. 2024, 16, 182–189. [Google Scholar] [CrossRef]
  12. Lian, C.; Zhou, F. Design and research of welding robot for saddle-shaped welds in heavy pressure vessels. Equip. Manag. Maint. 2024, 14, 140–143. [Google Scholar]
  13. Fang, H.C.; Ong, S.K.; Nee, A. Robot Path Planning Optimization for Welding Complex Joints. Int. J. Adv. Manuf. Technol. 2017, 90, 3829–3839. [Google Scholar] [CrossRef]
  14. Xiong, J.H.; Fu, Z.T.; Chen, H.; Pan, J.B.; Gao, X.S.; Chen, X.B. Simulation and Trajectory Generation of Dual-Robot Collaborative Welding for Intersecting Pipes. Int. J. Adv. Manuf. Technol. 2020, 111, 2231–2241. [Google Scholar] [CrossRef]
  15. Song, D.Z.; Yun, C.; Wei, W.H. Welding Groove Model Analysis of the Intersecting Pipe. Mach. Des. Manuf. 2013, 11, 171–174. [Google Scholar] [CrossRef]
  16. Chen, C.R.; Zhou, S.S.; He, H.; Lian, G.F.; Huang, X.; Feng, M.Y. Arrangement Planning of V-Groove Weld Beads Based on a Parabolic Model. Trans. China Weld. Inst. 2023, 44, 79–88. [Google Scholar] [CrossRef]
  17. Ma, Y.L.; Zhu, J.; Zhang, L.M.; Ren, Z.Q.; Zhao, Y.; Wang, W.Y.; Wang, X.M.; Hui, X.D.; Wu, Y.L.; Zheng, H.Y. Numerical Simulation and Experimental Study of Hybrid Laser-Electric Arc Welding between Dissimilar Mg Alloys. J. Cent. South Univ. 2022, 29, 3476–3488. [Google Scholar] [CrossRef]
  18. Jang, H.L.; Ryu, H.; Kang, S. A Study on the Effects of Welding Deformation According to Weld Sequence in Overlay-Welded Structures. Metals 2024, 14, 684. [Google Scholar] [CrossRef]
  19. Yuan, M.X.; Liu, S.D.; Gao, Y.Q.; Sun, H.W.; Liu, C.; Shen, Y. Immune Optimization of Welding Sequence for Arc Weld Seams in Ship Medium-Small Assemblies. Coatings 2022, 12, 703. [Google Scholar] [CrossRef]
  20. Li, L.; Ren, S.; Wang, P.Y.; Dai, K.Y. Study on Subsection Welding Sequence Simulation and Deformation Prediction of Large Ship Sides. Hot Work. Technol. 2018, 47, 206–211. [Google Scholar] [CrossRef]
  21. Miao, Y.G.; Wang, L.; Wang, Z.R.; Zhuo, Z.J.; Lin, C.X.; Tan, G.P.; Xie, Z.K. Numerical Simulation and Experimental Analysis of Residual Stress and Deformation in DH36 High-strength Ship Plate Steel Butt Welding. J. Wuhan Univ. Technol. 2023, 45, 104–111. [Google Scholar] [CrossRef]
  22. Prasad, M.J.H.; Sudhakar, I.; Adinarayana, S.; Rao, D.V.N.J.J. Simulation and Validation of Experimental Residual Stresses of Dissimilar AA2124 and AA7075 TIG Weld Joint Using ANSYS APDL. Int. J. Interact. Des. Manuf. 2024, 18, 71–82. [Google Scholar] [CrossRef]
  23. Wang, Z.Y.; Gong, M.C.; Zhou, L.Z.; Gao, M. A Review of Numerical Simulation of Laser-Arc Hybrid Welding. Materials 2023, 16, 3561. [Google Scholar] [CrossRef] [PubMed]
  24. Liu, W.; Zhu, Y.; Sun, A. Analysis of Dynamic Stress-Strain Characteristics of AH36 Steel Welded Joint. Trans. China Weld. Inst. 2024, 45, 50–58. [Google Scholar] [CrossRef]
  25. Ji, W.; Zhang, P. Simulation Analysis and Experimental Research on T-Joint Welding of Corrugated Steel Web Girders. J. Harbin Eng. Univ. 2024, 45, 691–698. [Google Scholar] [CrossRef]
  26. Lu, W.; Sun, J.; Su, H.; Gao, C.; Zhang, X.B. Experimental Research of Welding Residual Stress of Butt Welded Joint of Thick Steel Plate. Metals 2023, 13, 120. [Google Scholar] [CrossRef]
Figure 1. Robot welding model for curved penetration component.
Coatings 15 00923 g001
Figure 2. Schematic of weld seam for curved penetration component.
Coatings 15 00923 g002
Figure 3. Simplified model of curved penetration component.
Coatings 15 00923 g003
Figure 4. Interference curve model.
Coatings 15 00923 g004
Figure 5. Schematic of multi-layer multi-pass weld seam.
Coatings 15 00923 g005
Figure 6. Weld seam trajectory simulation.
Coatings 15 00923 g006
Figure 7. Gaussian 3D heat source.
Coatings 15 00923 g007
Figure 8. Schematic of 3D element e heat conduction.
Coatings 15 00923 g008
Figure 9. Force diagram of 3D element e.
Coatings 15 00923 g009
Figure 10. Segmented welding simulation flow for curved feedthroughs.
Coatings 15 00923 g010
Figure 11. Weld bead configurations for curved components of different thicknesses: (a) 10 mm; (b) 15 mm; (c) 20 mm.
Coatings 15 00923 g011
Figure 12. Segmental welding planning for curved penetrated components.
Coatings 15 00923 g012
Figure 13. Common segmented welding sequences for curved penetrated components: (a) N1; (b) N2; (c) N3; (d) N4.
Coatings 15 00923 g013
Figure 14. Properties of DH36 steel: (a) DH36 thermal physics; (b) DH36 thermodynamics.
Coatings 15 00923 g014
Figure 15. Mesh division of curved penetration component.
Coatings 15 00923 g015
Figure 16. Full-process temperature monitoring of segment a of the 15 mm curved plate: (a) N1 welding sequence; (b) N2 welding sequence; (c) N3 welding sequence; (d) N4 welding sequence.
Coatings 15 00923 g016aCoatings 15 00923 g016b
Figure 17. Total welding deformation of 15 mm curved penetration component throughout the welding process.
Coatings 15 00923 g017
Figure 18. Welding deformation and residual stress contours for 15 mm-thick curved component under different welding sequences: (a) N1 deformation; (b) N1 welding stress; (c) N2 deformation; (d) N2 welding stress; (e) N3 deformation; (f) N3 welding stress; (g) N4 deformation; (h) N4 welding stress.
Coatings 15 00923 g018aCoatings 15 00923 g018b
Figure 19. Full-process welding deformation status for curved plates of different thicknesses: (a) the entire welding deformation process of the 10 mm curved plate; (b) the entire welding deformation process of the 20 mm curved plate.
Coatings 15 00923 g019
Figure 20. Welding deformation and residual stress for 15 mm curved component under different experimental schemes: (a) welding distortion based on plan 1; (b) residual stress based on plan 1; (c) welding distortion based on plan 2; (d) residual stress based on plan 2; (e) welding distortion based on plan 3; (f) residual stress based on plan 3; (g) welding distortion based on plan 4; (h) residual stress based on plan 4; (i) welding distortion based on plan 5; (j) residual stress based on plan 5; (k) welding distortion based on plan 6; (l) residual stress based on plan 6; (m) welding distortion based on plan 7; (n) residual stress based on plan 7; (o) welding distortion based on plan 8; (p) residual stress based on plan 8; (q) welding distortion based on plan 9; (r) residual stress based on plan 9.
Coatings 15 00923 g020aCoatings 15 00923 g020b
Figure 21. Range chart of welding for curved plates with three different thicknesses.
Coatings 15 00923 g021
Table 1. Selected dimensions for curved penetrations.
Curved Panel
Thickness/Th (mm)
Curved Panel
Radius/b (mm)
Penetration
Radius/a (mm)
Penetration Plate
Thickness/th (mm)
10500016040
15500016040
20500016040
Table 2. DH36 Steel composition table.
Mass Fractions (%)CSiMnPSCuCrNbV
DH36≤0.18≤0.50.9–1.6≤0.025≤0.025≤0.35≤0.20.02–0.050.05–0.1
Table 3. Segmented welding parameter optimization for curved penetration component.
Horizontal WeldingVertical WeldingOverhead Welding
Voltage
U/V
Current
I/A
Speed
v/(mm/s)
Voltage
U/V
Current
I/A
Speed
v/(mm/s)
Voltage
U/V
Current
I/A
Speed
v/(mm/s)
125.22308.624.42108242007.7
225.62408.924.82208.324.42108
3262509.225.22308.624.82208.3
Table 4. Orthogonal experimental plan for segmented welding of curved penetrations.
Experimental PlanHorizontal WeldingVertical WeldingOverhead Welding
Voltage
U/V
Current
I/A
Speed
v/(mm/s)
Voltage
U/V
Current
I/A
Speed
v/(mm/s)
Voltage
U/V
Current
I/A
Speed
v/(mm/s)
125.22308.624.42108242007.7
225.62408.924.82208.3242007.7
3262509.225.22308.6242007.7
4262509.224.82208.324.42108
525.62408.924.4210824.42108
625.22308.625.22308.624.42108
725.22308.624.82208.324.82208.3
825.62408.925.22308.624.82208.3
9262509.224.4210824.82208.3
Table 5. Orthogonal simulation results of welding deformation and residual stress for 15 mm curved component.
Experimental Plan123456789
Distortion/mm0.816051.02641.29321.18790.97181.00420.954851.21031.1227
Residual stress/MPa511.18251.96272.21256.71248.06245.89233.7266.89256.04
Table 6. Orthogonal simulation results of welding deformation for 15 mm curved component.
15 mm Curved ComponentHorizontal WeldingVertical WeldingOverhead Welding
K1/mm2.7751 2.9106 3.1357
K2/mm3.2085 3.1691 3.1639
K3/mm3.6038 3.5077 3.2878
K 1 ¯ /mm0.9250 0.9702 1.0452
K 2 ¯ /mm1.0695 1.0564 1.0546
K 3 ¯ /mm1.2013 1.1692 1.0959
Rang/mm0.2762 0.1990 0.0507
Table 7. Orthogonal simulation results of welding deformation and residual stress for 10 mm and 20 mm curved components.
Experimental Plan123456789
10 mm Welding Distortion1.06231.27911.48271.37441.16951.30361.20481.41771.2666
10 mm Residual Stress236.07243.43261.52244.67231.97253.21240.43254.28240.26
20 mm Welding Distortion0.734180.893951.03150.990390.866320.93360.895861.03120.97106
20 mm Residual Stress421.74305.59336.44327.93321.5314.24286.82299.16335.6
Table 8. Orthogonal simulation results of welding deformation for 10 mm- and 20 mm-thick curved components.
Plate
Thickness
10 mm20 mm
Horizontal Welding c,dVertical
Welding b,e
Overhead
Welding a,f
Horizontal Welding c,dVertical
Welding b,e
Overhead
Welding a,f
K1/mm3.57073.49843.82412.56362.57162.6596
K2/mm3.86633.85833.84752.79152.78022.7903
K3/mm4.12374.20403.88912.99302.99632.8981
K 1 ¯ /mm1.19021.16611.27470.85450.85720.8865
K 2 ¯ /mm1.28881.28611.28250.93050.92670.9301
K 3 ¯ /mm1.37461.40131.29640.99770.99880.9660
Rang/mm0.18430.23520.02170.14310.14160.0795
Disclaimer/Publisher’s Note: The statements, opinions and data contained in all publications are solely those of the individual author(s) and contributor(s) and not of MDPI and/or the editor(s). MDPI and/or the editor(s) disclaim responsibility for any injury to people or property resulting from any ideas, methods, instructions or products referred to in the content.