Article

A Simple Setup for Thermoelectric Power Factor of Thermoelectric Coatings

by
Mingda Lv
1,*,
Chunzhu Jiang
1 and
Guangjun Zhang
2
1
AVIC Manufacturing Technology Institute, Beijing 100015, China
2
State Key Laboratory of Advanced Welding and Joining, Harbin Institute of Technology, Harbin 150001, China
*
Author to whom correspondence should be addressed.
Coatings 2025, 15(6), 679; https://doi.org/10.3390/coatings15060679
Submission received: 26 April 2025 / Revised: 26 May 2025 / Accepted: 3 June 2025 / Published: 5 June 2025

Abstract

Thermal spraying technique has potential in manufacturing economic, profitable thermoelectric coatings. In order to characterize the electrical performance of thermoelectric coatings more conveniently, a simple setup for thermoelectric power factor of thermoelectric coatings is designed and developed. The indigenously designed setup is simple and low-cost. The compact structure makes it easy to cooperate with existing heating furnace, allowing a fast measurement in a variable temperature range. The differential method and the off-axis four-point geometry are used in Seebeck coefficient and electrical resistivity measurement, respectively. The Spring-load unit and other details of construction of the setup are described specifically. The Seebeck coefficient of the plasma-sprayed higher manganese silicide (HMS) coating was measured to be approximately 132.35 μV/K at 150 °C, with measurements showing high linearity (R2 > 0.99). The setup demonstrated reliable electrical resistivity results for Cr20Ni80 alloy, closely matching published values (1.16 × 10⁻⁶ Ω·m vs. 1.10 × 10⁻⁶ Ω·m). HMS coating was also characterized from 50 °C to 500 °C to validate the setup on thermoelectric performance characterization across a wide temperature range. These results confirm the reliability of the developed setup.

1. Introduction

The increasing occurrence of energy shortages and drastic changes in climate, which mainly attributed to the use of fossil fuels for transport and energy generation, have driven widespread concerns over the efficient utilization of energy [1]. However, about two-thirds of all used energy is assumed to be wasted in the form of waste heat [2]. It is in this context that thermoelectric generators (TEGs) have attracted much attention of researchers due to their potential applications both in mass waste-heat recovery [3,4] and miniature power harvesting. At the moment, thermoelectric generators (TEGs) can recover up to 10% of waste heat in optimized systems [5].
Thermoelectric effects enable direct conversion between temperature differences to electric voltage and vice versa [6]. The efficiency of thermoelectric material is quantified by the dimensionless figure of merit ZT = (S2σ/κ)T, where S, σ, κ and T represent the Seebeck coefficient, electrical conductivity, thermal conductivity and absolute temperature, respectively. Among these parameters, the Seebeck coefficient and electrical conductivity are considered as the electrical properties and the quantity S2σ is defined as power factor (PF). In a thermoelectric converter, when variation in thermal conductivity is secondary to modulation in electrical properties, power factor is the key criterion to evaluate the thermoelectric performance appropriately [7,8]. Therefore, one of the essential thermoelectric characterizations is the measurement of Seebeck coefficient and electrical conductivity.
Though the figure of merit ZT for state-of-the-art thermoelectric materials can exceed 2.5 at high temperatures, the interdependence among the physical properties makes it challenging to optimize S, σ, κ separately for improving the ZT value [9]. Consequently, the applications of TEG were restrained on account of its low efficiency and high cost [10]. As a result, extensive research in thermoelectric science was carried out and appreciable progress has been made in the recent 15 years [11,12,13]. Compared to conventional bulk thermoelectric modules, the film-based thermoelectric generators are designed with a thickness in the micrometer to sub-millimeter range, therefore high densities of heat flux are attainable with proper heat sink and substrate [14], showing evident advantages in scalable and low-cost fabrication [15].
Major studies in thermoelectric film have been conducted from 2010 and occupied a certain proportion afterwards. Facing with the increasing research on thermoelectric films, a simple, fast and reliable technique for thermoelectric characterization is important to help the screening of thermoelectric films.
However, the most common used commercial Seebeck coefficient measurement devices, i.e., LSR-3 (Linseis, Selb, Germany), ZEM-3 (ULVAC-RIKO, Yokohama, Japan), and RZ2001i (Ozawa Science, Nagoya, Japan), are designed with static measurement method [16] for bulk thermoelectric materials. These instruments, in general, require prepared samples that are 2 to 4 mm (square or diameter) × 6 to 22 mm long. Unfortunately, there have been few reports on marketable measurement devices that are shown to be well capable of measuring thermoelectric films [17].
Given the above reasons, researchers developed laboratory home-built apparatus to evaluate thermoelectric films in most cases. Kedia et al. [18] developed a compact thermopower measurement system in-house. The measurement error of the setup was found to be less than 3% by extending the test on reference materials. Electron transport properties of reactively sputtered indium and nitrogen co-doped ZnO thin films have also been investigated in the temperature range of 40 to 300 K. Narjis et al. [19] also presented a simple lab-fabricated device to measure the Seebeck coefficient of materials. The obtained result for constantan (−39.5 μV/K) was found to be comparable to the literature data (−36 μV/K~−40 μV/K). This setup is low-cost, easy to implement and suitable for bulk material and thin films. However, both the devices aforementioned are not applicable for middle/high temperature range measurement for Teflon block and Kapton tape are used in the devices. Ravichandran et al. [20] designed an apparatus for simultaneous measurement of electrical conductivity and thermopower of thin films in the temperature range of 300 to 750 K. The high temperature environment was heated by a spiral heater in a home-built vacuum chamber. Given the lack of NIST standard reference sample for calibration of thermopower measurement apparatus at high temperature, an n-type SiGe alloy with dimensions 2.7 mm × 6.5 mm × 17.2 mm was used to perform the measurement. Fu et al. developed an experimental setup for measuring the Seebeck coefficient and the electrical resistivity of thin bar-shaped thermoelectric materials in a wide temperature range from 80 to 500 K [21]. The sample holder they developed is very compact, approximately 5 cm in diameter and 4 cm in height. Rouleau and Alleno [22] also established a high temperature apparatus to conduct the measurement from 300 to 1000 K in argon atmosphere. The Seebeck coefficient has also been measured on skutterudite samples as small as ∼7 × 1.5 × 0.5 mm3 with good agreement with the literature. The key feature of this apparatus is the disk-shaped junction of each thermocouple which improves the thermal contact with the sample.
Thermal spraying technique represents a potential on manufacturing economic profitable thermoelectric coatings [23], which attracted researchers to carry out exploratory attempts. In order to characterize the electrical performance of thermoelectric coatings more conveniently, a design of an apparatus for the measurement of the Seebeck coefficient and electrical resistivity for thermoelectric coating is reported in this paper. The indigenously designed apparatus is simple, low-cost, and flexible in sample dimensions, allowing a fast measurement in the range of temperature from 300 to 800 K. The differential method and the off-axis 4-point geometry are used in Seebeck coefficient and electrical resistivity measurement, respectively. In addition, the specific construction of the apparatus and details of the measurement procedure are described. Subsequently, plasma sprayed coating are measured in a variable temperature range to validate the setup on thermoelectric performance characterization for thermal sprayed coatings.

2. Method for Seebeck Coefficient and Electrical Conductivity Measurement

2.1. Electrical Conductivity

The four-probe method is the most widely used method in electrical conductivity measurement [24]. Figure 1 depicts the schematic arrangement of the liner four-probe method. The current passes through the outer probes from one end to the other, while the voltage is measured across the inner probes.
In the traditional 2-probe method, the potential difference U 2 p measured is given by U 2 p = I R s + R c + R l . It can cause errors, especially in measuring the contact resistance R c and the lead resistance R l which are not negligible compared with sample resistance R s . The 4-probe method can eliminate the effects of contact resistance between the sample and probes. The potential difference U 4 p measured in 4-probe method is given by the following:
U 4 p = I + I R s + I R c + R l = I R s + I R s + R c + R l
I is a small current for voltage measurement, as the I I , the contact resistance and the lead resistance do not contribute to the measurement. The potential difference can be expressed as U 4 p = I R s . The electrical conductivity is calculated as follows:
σ = 1 ρ = 1 R · D A = I U · D w t
A is the cross-sectional area that is perpendicular to electric current direction and D is the separation distance of the inner voltage probes. The four-probe method is employed for electrical conductivity measurement.

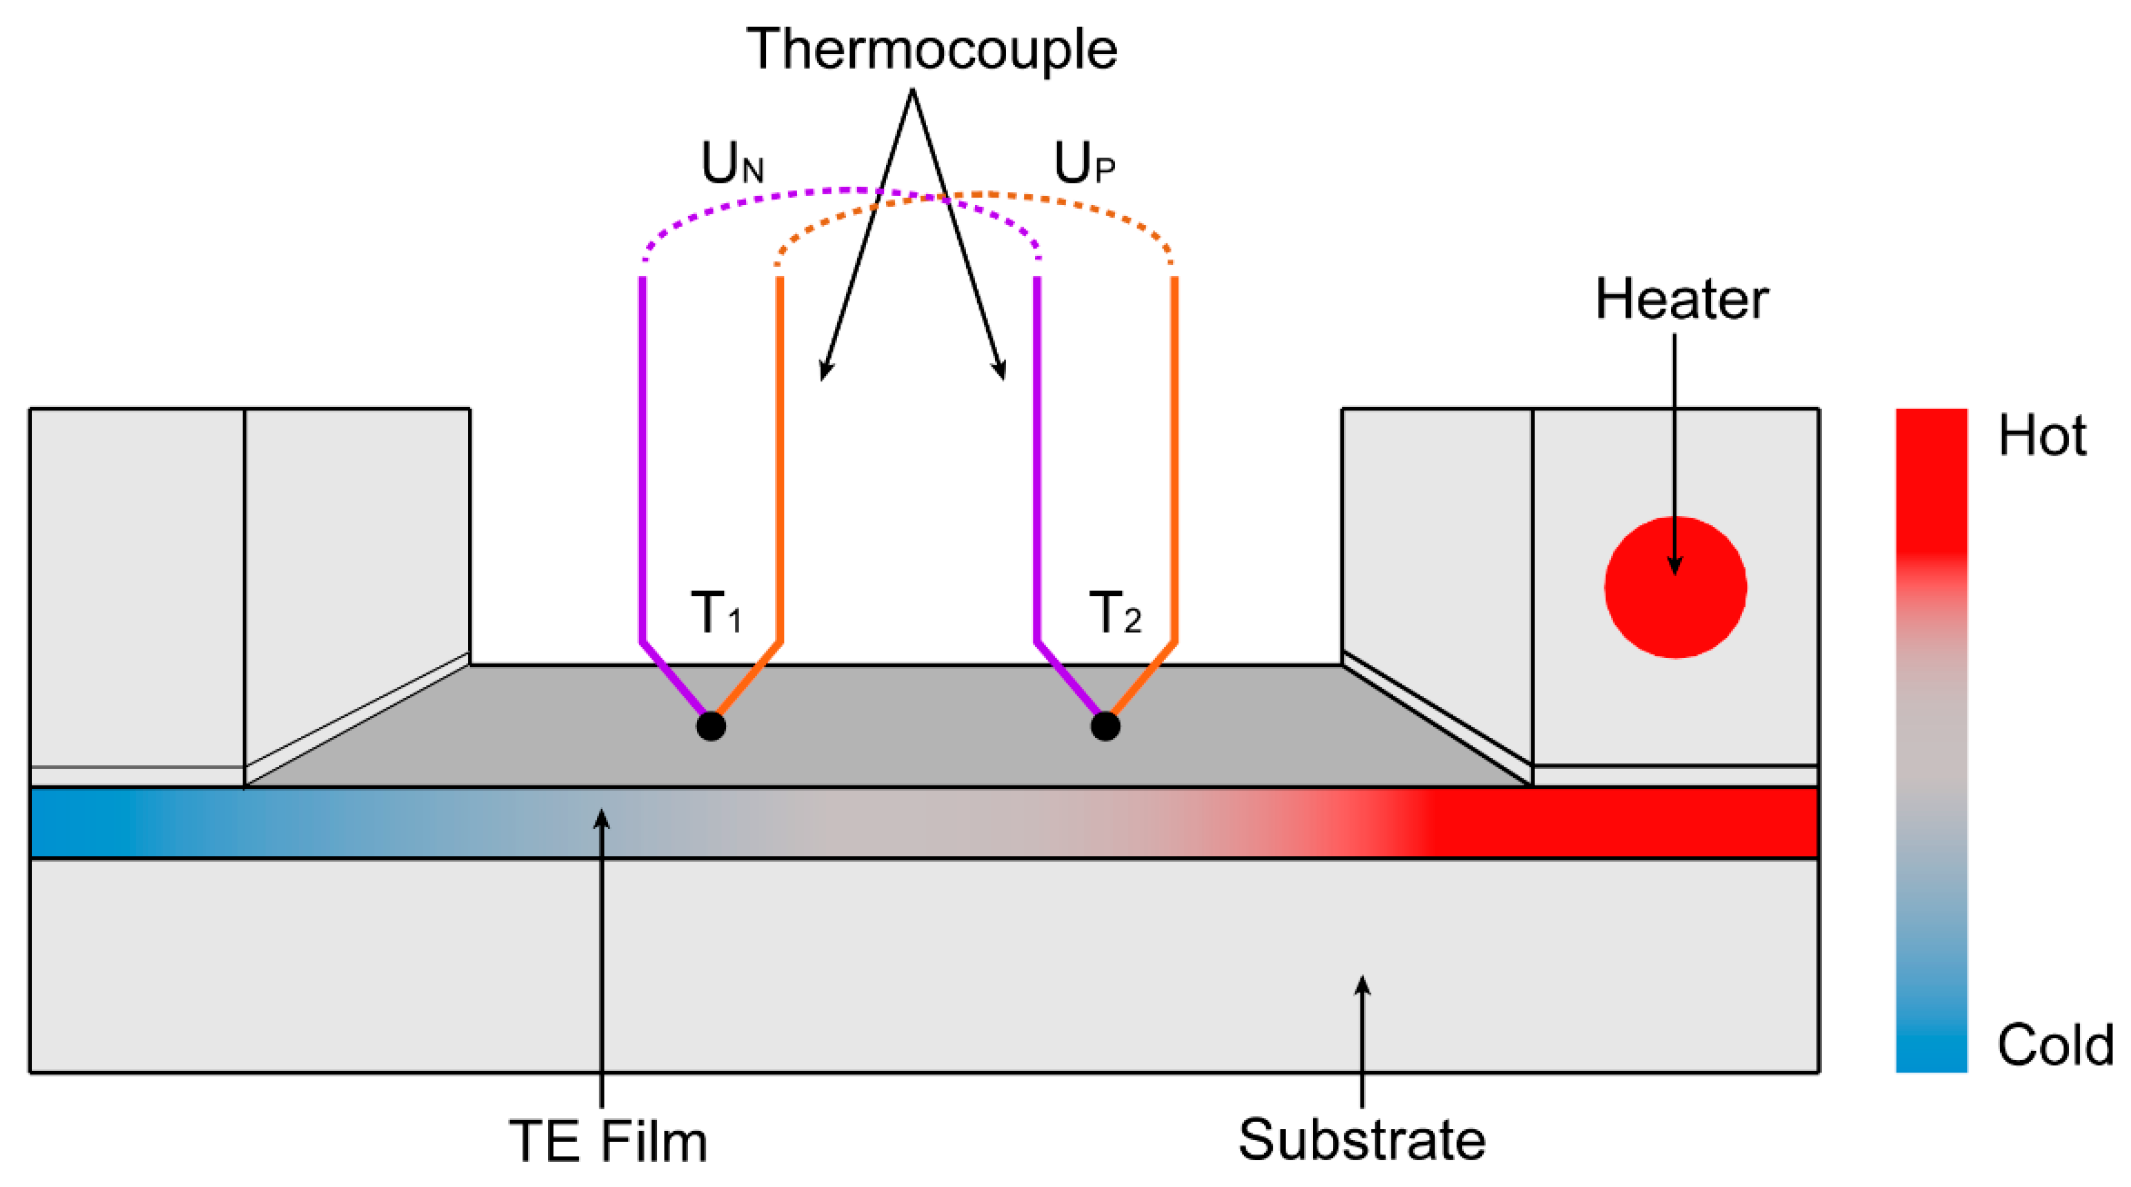
2.2. Seebeck Coefficient

In general, the measurement process of the Seebeck coefficient can be divided into three steps: (1) providing the temperature gradient; (2) acquiring ΔU and ΔT; (3) data analysis. According to the different ways used in each step, the Seebeck coefficient measurement can be subdivided into several methods. For example, it can be categorized into two methods depending on how the temperature gradient is provided, i.e., differential method and integral method.
In this work, a quasi-steady differential method is applied to obtain the Seebeck coefficient. The probe arrangement is the off-axis 4-point type which is commonly used in popular commercial instruments.
Figure 2 shows the schematic structure used in Seebeck coefficient measurement. The traditional way employed separates the probes to conduct the voltage or the temperature measurement exclusively. Though it is easier to implement in this case, strictly to say, the temperature and the Seebeck voltage measurement are not exactly the same point of the sample [25]. Here, two so-called integrated probes are pressed against the surface of the sample. Integrated probes are two thermocouples that measure the temperature T 1 and T 2 as well as the thermal voltages, thus allowing the temperature and voltage to be simultaneously measured at the same point in space. Compared to setups with thermocouples embedded in heat source and heat sink blocks, the acquired voltage and temperature readings with this placement have not to be corrected for thermal and electrical resistances in the respective blocks but give the voltage and temperature of the surface of the sample directly [26].
Two blocks are placed at each end of the sample to create the temperature gradient. In the differential method, a small temperature difference T = T 2 T 1 , usually 4–20 K, is set. It is significantly smaller than the average temperature T ¯ = T 1 + T 2 / 2 , i.e., T T ¯ . Under this condition, the voltage measured across the positive and the negative pair of legs are given by the following:
U p = T 1 T 2 S T S p T d T = ( T 2 T 1 ) × ( S T ¯ S p T ¯ )
U n = T 1 T 2 S T S n T d T = ( T 2 T 1 ) × ( S T ¯ S n T ¯ )
where S is the Seebeck coefficient of the sample and S p and S n are the Seebeck coefficient of the positive and negative leg of the thermocouple correspondingly. Based on the method of determination of the Seebeck coefficient discussed in reference [27], the calculation of Seebeck coefficient is defined as follows:
S T ¯ = U n U p U n S T C T ¯ + S n T ¯
To obtain the Seebeck coefficient from the raw measurement data more accurate, it is suggested that the slope method is more preferable than the single point method [28] to eliminate the effect of offsets. In this case, Equations (3)–(5) can be rewritten as follows:
S T ¯ = d U p d T + S p T ¯
S T ¯ = d U n d T + S n T ¯
S T ¯ = 1 1 d U p d U n S T C T ¯ + S n T ¯
where S T C = S p S n is the Seebeck coefficient of the employed thermocouple and the data of STC is taken from the ITS-90 table, and Sn is calculated by: S n T = 18.123 + 1.6420 × 10 2 T 2.6611 × 10 4 T 2 + 1.1925 × 10 6 T 3 2.1104 × 10 9 T 4 + 1.6948 × 10 12 T 5 5.1597 × 10 16 T 6 .

3. Measurement Setup and Procedure

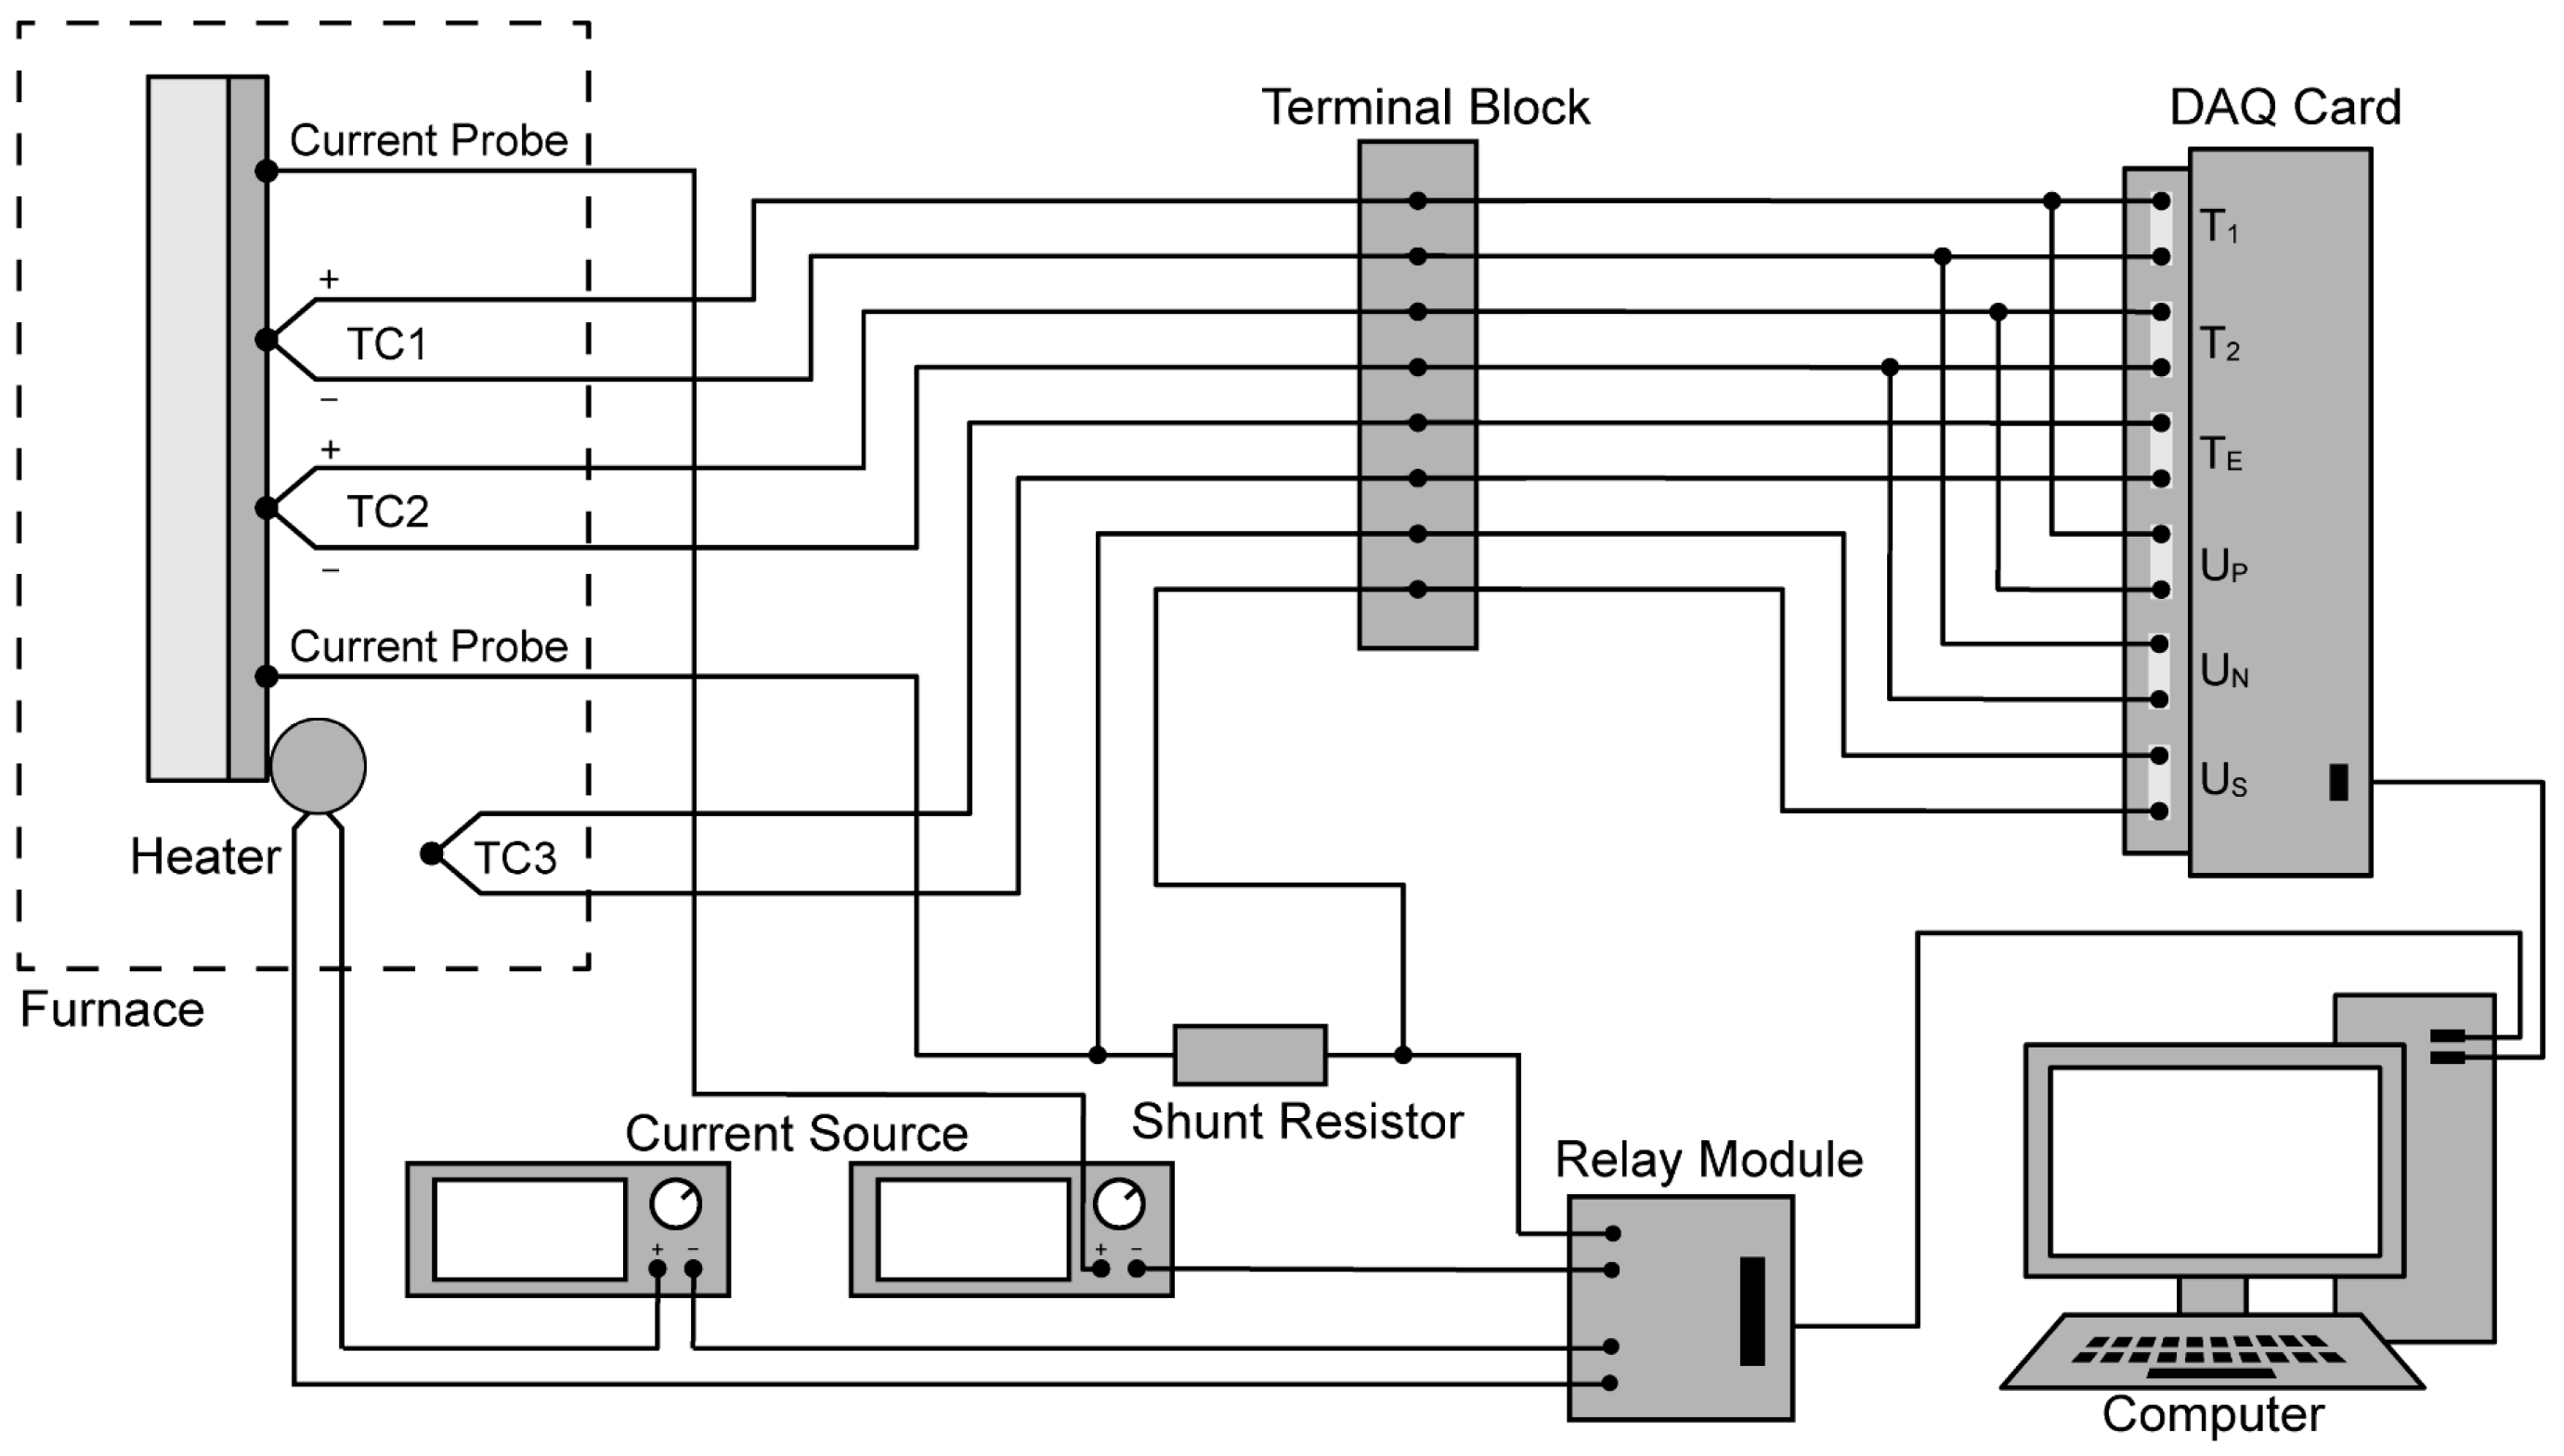
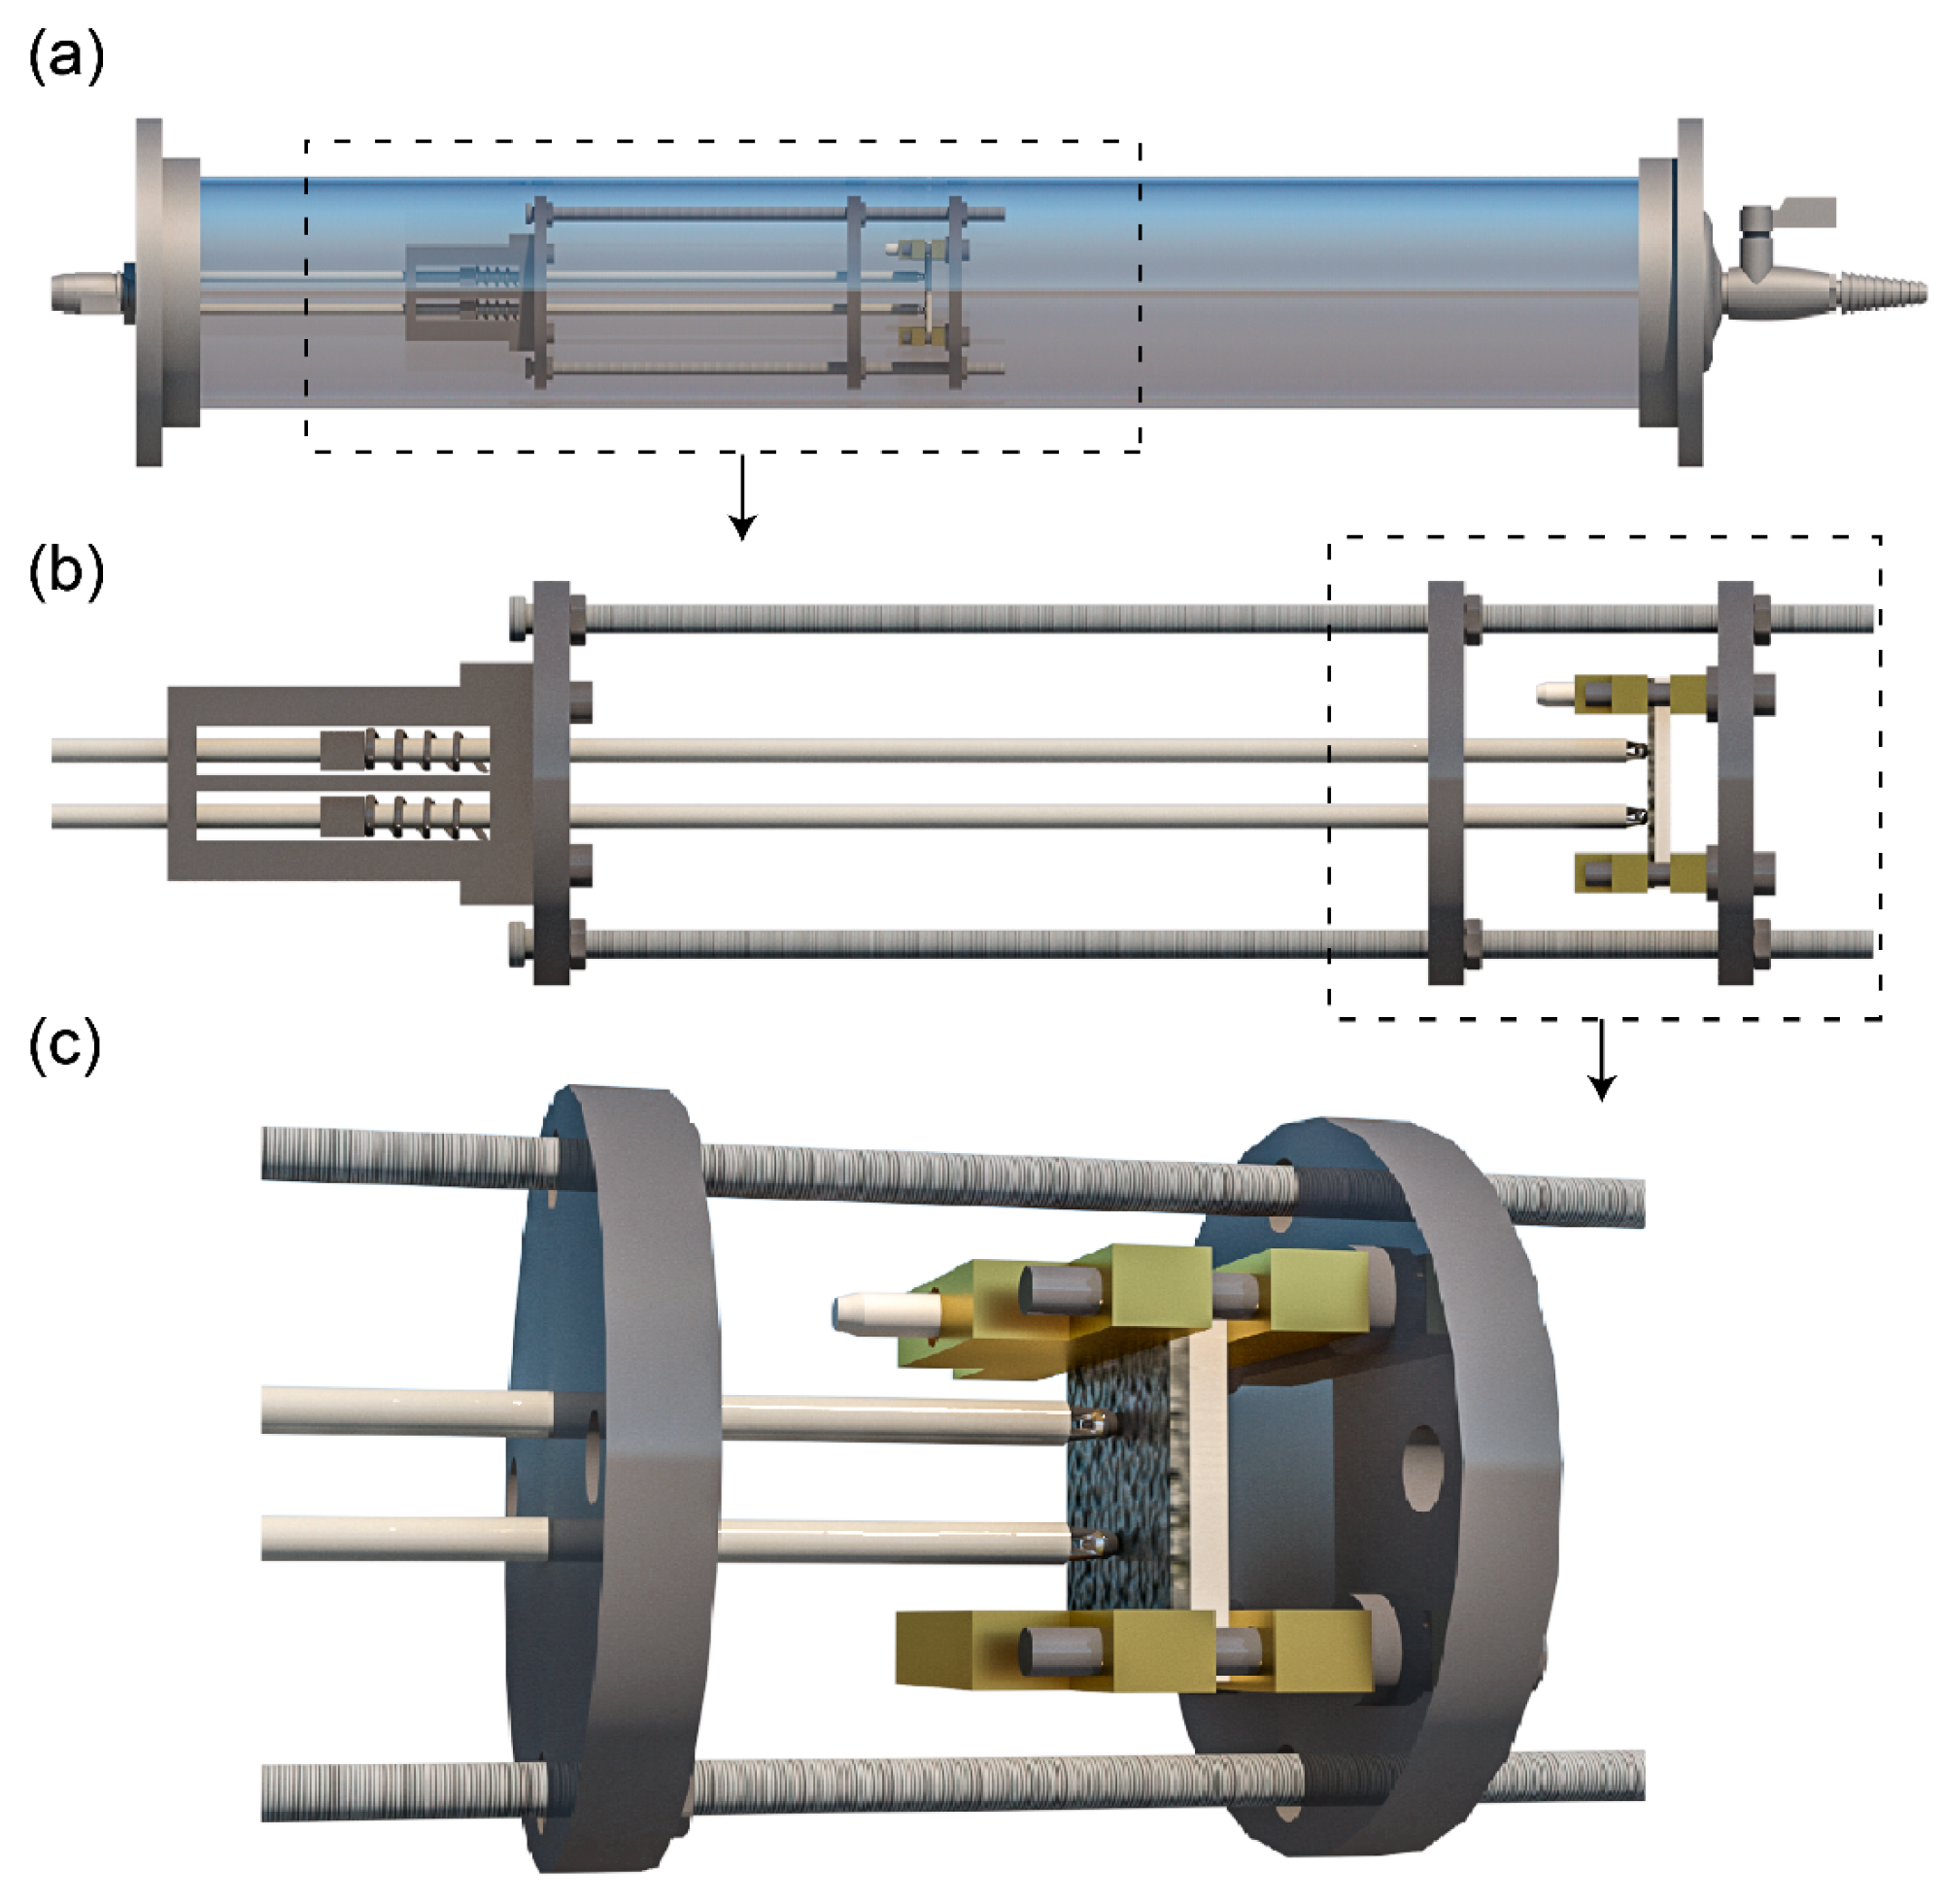
3.1. Setup Description

The general schematic of the experimental setup is shown in Figure 3. The whole setup is designed for allowing easy modifications as well as replacement of individual parts. The central control unit is a computer on which the measurement program based on C# programming language is running. The program controls the data acquisition system and a relay module which is responsible for switching the sample heater and the constant current source. Simultaneously, a real-time data processing is executed then the electrical conductivity and the Seebeck coefficient displayed in the program are refreshed.
The base temperature of the measurement is provided by a 5.5 kW cylindrical furnace (GSL-1600X, MTI-Kejing, Hefei, China). Most of the common thermoelectric materials work in the low-middle temperature range, therefore the furnace that can heat up to 1600 °C is sufficient. A thermocouple with an alumina tube protection is placed next to the molybdenum heating element to monitor the furnace temperature. In addition, the furnace temperature is controlled by a PID temperature controller to program the temperature of the furnace as a function of time. The measurements are conducted in a 60 mm diameter quartz tube installed in the furnace horizontally. The quartz tube is connected with stainless sealing flanges that allows to maintain a contaminant free and low pressurized inert gas condition.
Voltage and temperature measurements are made with a robust 8 channels thermocouple input module (Adam 4118, Advantech, Taipei, Taiwan). The resolution of the DC voltage is 0.5 μV and the quoted uncertainty for the acquisition module under standard measurement is ±30 μV. To accomplish a uniform reference temperature between all thermocouples, a connection terminal block is employed. A constant current source is connected with the sample through current probes. In order to avoid parasitic thermoelectric EMFs, the relay module inverts the direction of the current periodically when measuring the conductivity. The shunt resistor (RX70-0.5-0.5, Shagon Electronics, Nanjing, China) placed in series with the sample is used to measure the current for electrical conductivity calculation. Another direct current source is used to supply a ceramic heater for creating the temperature gradient.
The sample holder fixed in the tube for carrying out the measurement is schematically shown in Figure 4a. The whole sample holder consists of three parts: a stainless-steel framing, a sample platform and a spring-load unit. The details of the stainless-steel framing and the sample platform are given in Figure 4b,c, respectively.
The stainless-steel framing is constructed with three flat disks that assembled together by threaded rods and fasteners (washers and nuts). The left and right disks are used to fix the sample platform and the spring-load unit by screwing it separately. It is worth mentioning that ceramic screws and washers are used to insulate the sample platform and the disk. The middle one with two holes allows the probes to work at a constant interval.
The sample platform is composed of two symmetrical pairs. Each pair consists of a copper bar-shape base and a copper T-shape counterpart with the sample clamped between them. For electrical conductivity measurement, these two counterparts serve as current probes in the four-probe method. The wire from the current source is connected to the current probe by welding. Furthermore, conductive silver paste (GW-02, UVTM, Guangzhou, China) is daubed between the current probe and the sample to ensure a dependable electrical connection, also acting as a thermal diffusor and leading to a homogeneous temperature distribution. At one end of the sample, a metal ceramic heater (MCH) embedded in the T-shape counterpart is used to create a variable temperature gradient to measure the thermoelectric power. The heating power of the MCH is 28 W, which is capable of rapidly heating one end of the sample to create a stable temperature gradient across the sample. The temperature gradient (ΔT) is precisely controlled by a PID module programmed in the upper computer, which adjusts the effective heating time on real-time temperature feedback from the thermocouples. This ensures that the temperature difference between the two junctions can be fixed depending on the experimental requirements, typically in the range of 4–20 K.
Considering the brittleness and variety thickness of thermoelectric films, an alumina plate is placed under the sample to ensure the mechanical rigidity. The sample platform is designed to accommodate film sample configurations, especially for the sprayed thermoelectric film in this case. A 20 × 20 mm size is optimized to measure; however, it is also possible to mount samples of other geometries for the sample holder is designed with adjustable components, which allow for easy modifications to accommodate samples of different sizes and shapes. Specifically, samples can range in size from 20 mm × 20 mm to 40 mm × 40 mm, with larger samples being easily accommodated by adjusting the alignment of the heating elements. Additionally, the system can also handle non-rectangular shapes, as long as the sample fits within the sample platform and allows proper contact with the probes.
As mentioned above, in order to acquire a better precision data in practical utilization, both temperature and voltage should be measured at the same spot. In this apparatus, two K type thermocouples, TC1 and TC2, are used, acting as integrated probes that measure the temperature as well as the thermal voltages. Both TC1 and TC2 pass through the aligning holes of the middle disk, holding in position with a distance of 10 mm from each other. Meanwhile the third thermocouple TC3 is placed next to the sample without direct contact, providing the base temperature for the furnace control. To reduce the so-called “cold-finger” effect, that is the erroneous temperature reading resulting from the heat sinking along the thermocouple wires, measurement is accomplished by thin thermocouples with a diameter of 0.127 mm. The entire length of the thermocouple is embedded in a twin bore alumina tube to avoid strain and contamination. The thermocouple alumina tubes are fixed in sliders which are confined in the horizontal tracks of the spring-load unit and pressed by stainless-steel compression springs. To avoid the spring failure when exposed to the high temperature, the spring-load unit are placed at the end of the cylindrical furnace. Finally, two essential thermocouples are attached to the surface of the sample firmly by the spring-load unit.

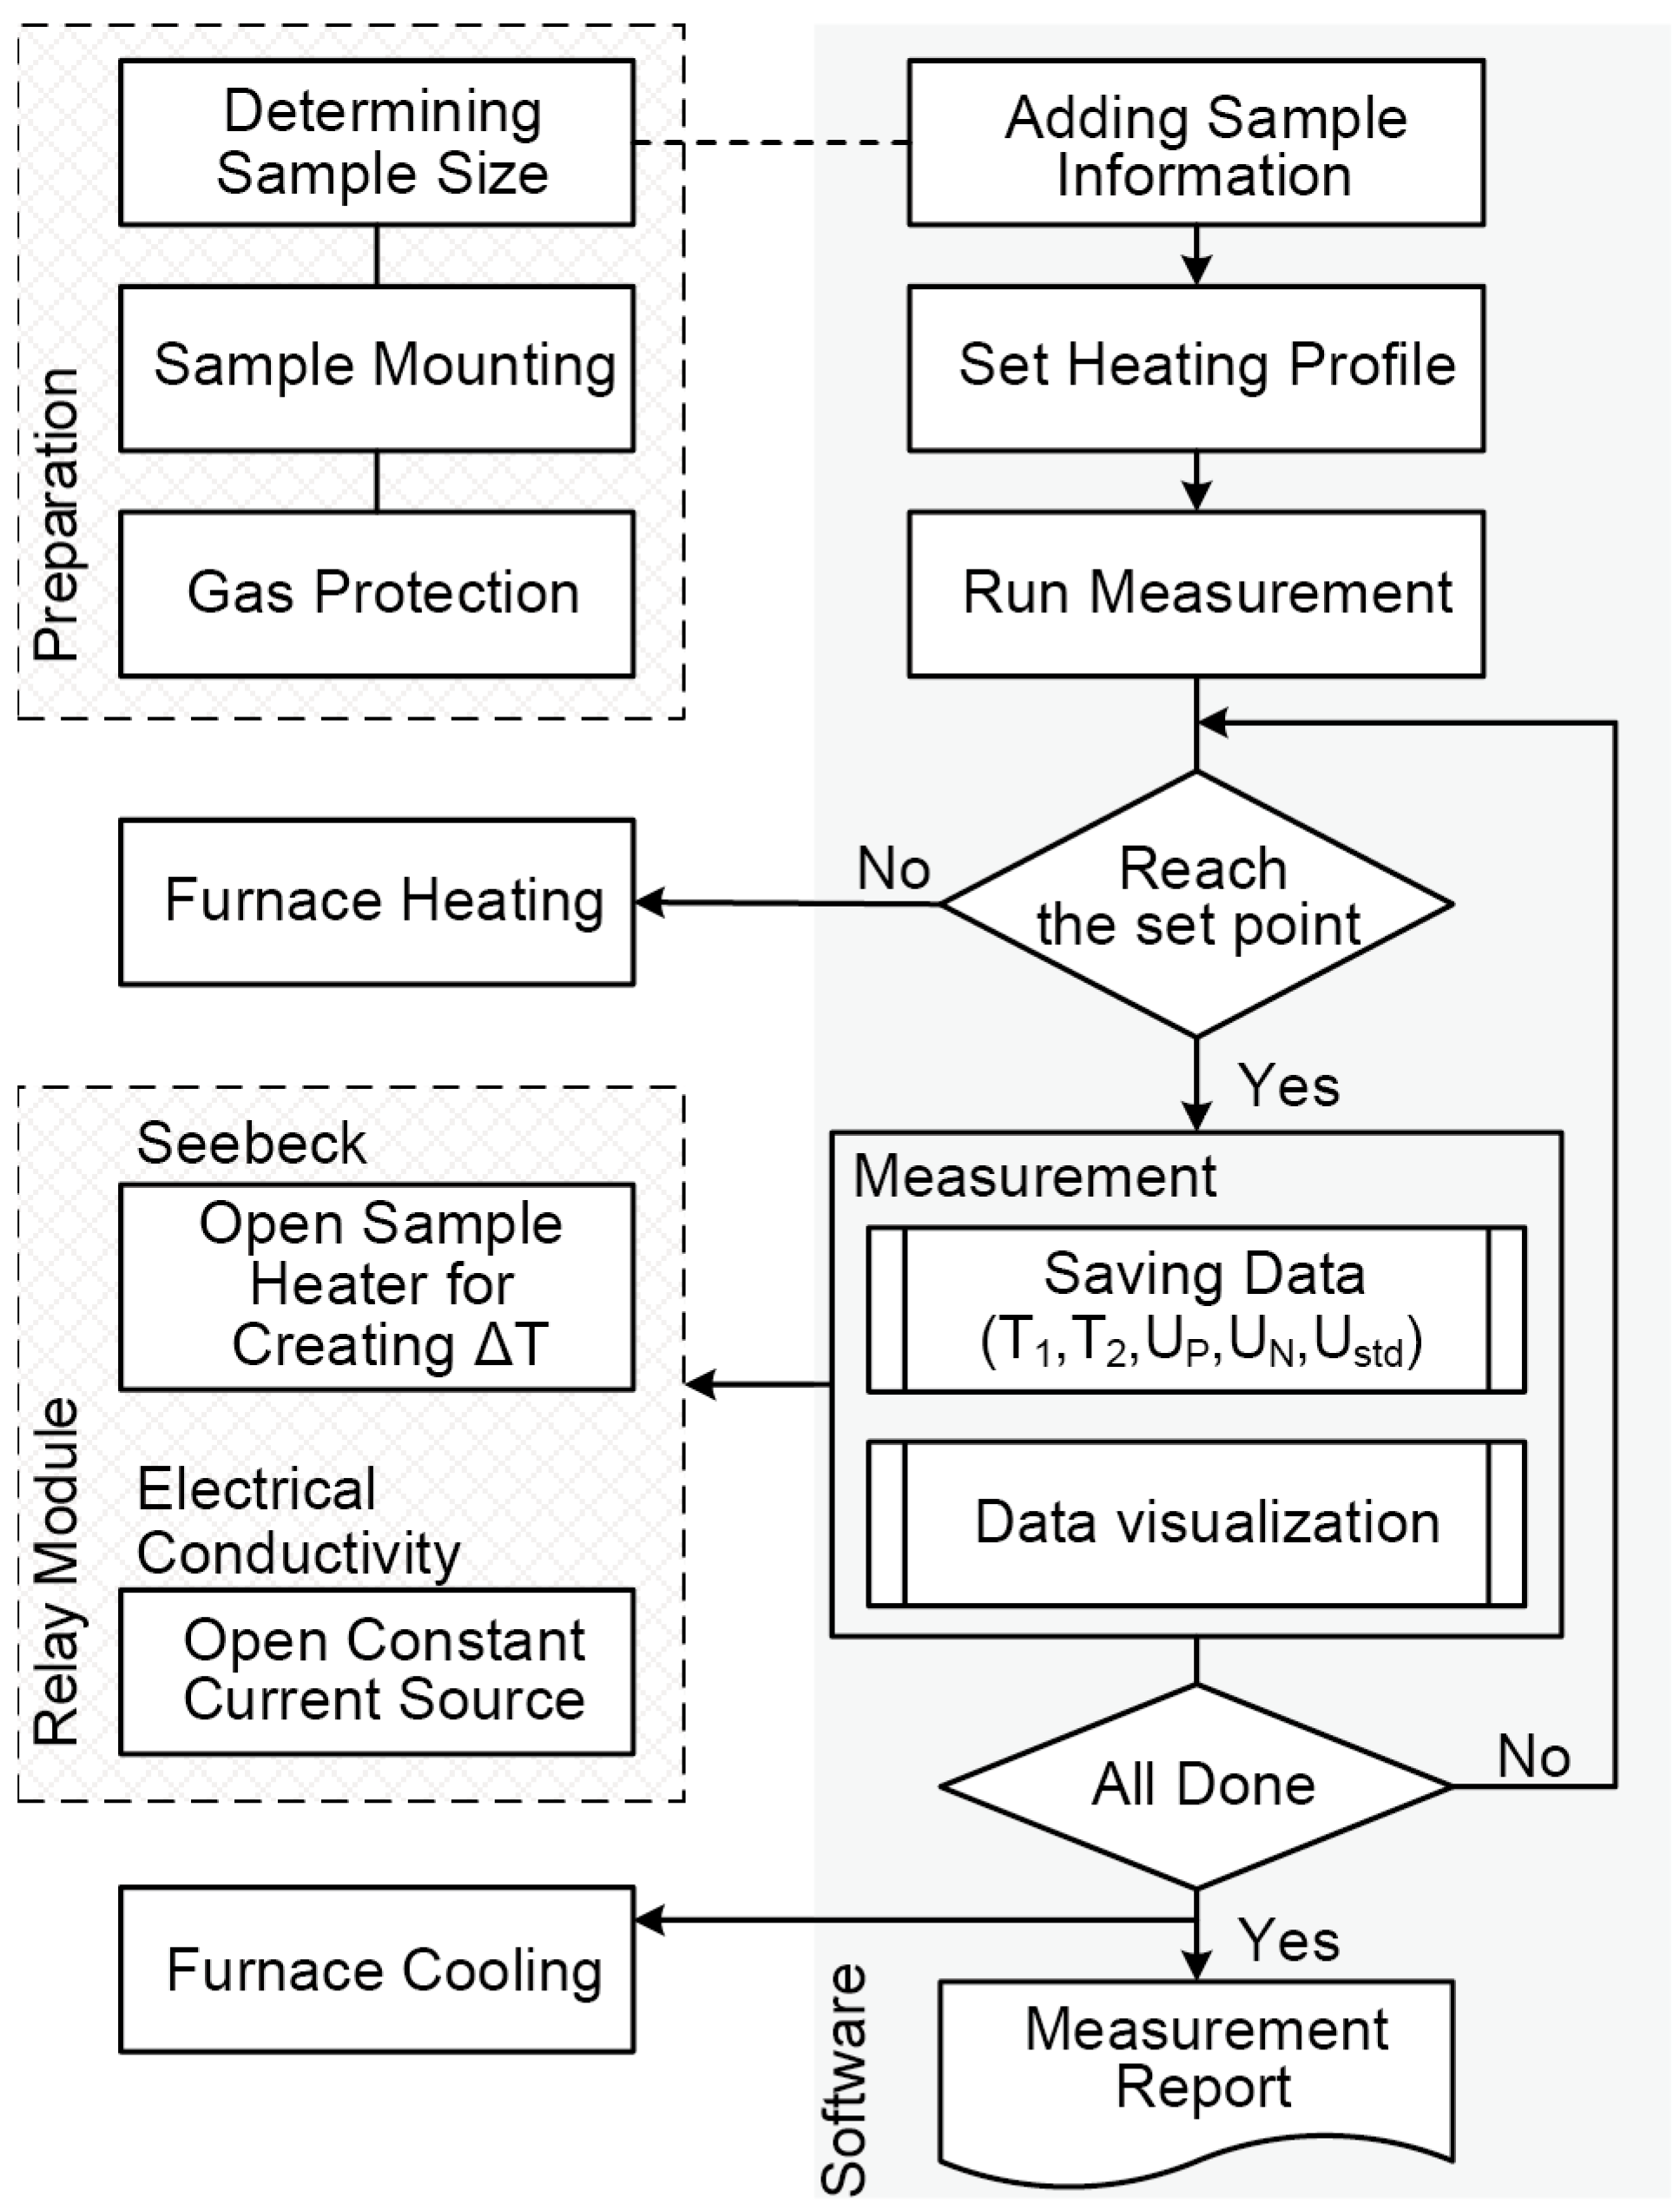
3.2. Measurement Procedure

The whole measurement procedure, as shown in Figure 5, is guided and controlled by the program to achieve a semi-automation process. Firstly, the size of the film sample is carefully determined. Then the sample holder is injected into the middle of the quartz tube after mounting the film on the sample platform. And the tube is first evacuated to −0.1 MPa with a mechanical vacuum pump, then flushed with Ar gas twice to exclude the possible air.
Once all the preliminary work is performed, the program begins warming up the furnace first and then heating up with a rate of 5 K/min. Upon reaching the desirable temperature, the measurement program is activated, acquiring the temperature and voltage data to estimate the Seebeck coefficient. Afterwards, the relay module switches on and the current flows through the sample. The voltage and current data for electrical conductivity calculation are collected. While all the measurements arranged in the temperature range are completed, the original data and measurement results are stored at a rate of 10 samples/sec and the furnace stops heating and cools down slowly.

4. Results and Discussion

This section is divided into two parts. Firstly, to validate the control effect of heating during the Seebeck coefficient measurement, two heating–cooling cycles are conducted on Cu65Ni15Zn20 alloy. Secondly, the measurement system was applied to the plasma sprayed higher manganese silicide (HMS) coating to help in analyzing the thermoelectric performance. Figure 6a shows the measured variations in the temperatures of two thermocouples (T1 and T2) for the Seebeck coefficient measurement. The temperature difference and the real-time voltage collected in the same period are shown in Figure 6b,c separately. Initially, the temperature at both the junctions was the same. Then with the heater powered, a temperature difference between T1 and T2 is established, which causes the voltage for Un and Up. When a certain temperature difference ∆T reaches 5 K in this measurement, the heater stops and the temperature gradient vanishes slowly, then the measured voltage tends to return to zero.
There are two heating cycling which are shown in Figure 6a. The corresponding phases are named H1, H2 for heating up and C1, C2 for cooling down, respectively. ΔT vs. ΔU data in two heating phases extracted from Figure 6 is shown in Figure 7. The obtained data almost matched and shows similar trend, indicating a good repeatability during the Seebeck coefficient measurement. The whole system being placed in the tube during the measurement helped to avoid the heat transfer by convection and radiations, which may cause temperature drift.
The measurement system was applied to the HMS coating at 150 °C. The coating sample is plasma sprayed with HMS powder a 20 mm × 25 mm ceramic plate. The thickness of the HMS coating is around 200 μm. The ΔT vs. ΔU and ΔUn vs. ΔUp data is shown Figure 8. All data show a linear behavior as indicated by the good agreement between measurement data and the corresponding linear fits. The goodness of fit (R-Square) are all beyond 0.99 which means a faithful measurement. The slope of ΔT vs. ΔUp and ΔT vs. ΔUn are −0.105 mV/K and −0.145 mV/K separately. According to Equations (6) and (7), the Seebeck coefficient are calculated as 128.64 μV/K and 127.37 μV/K, respectively. Data of ΔUn vs. ΔUp has a better liner fit with a R-Square as 0.999 and much smaller offset (0.028) compared with ΔT vs. ΔU (0.098 and 0.096). The Seebeck coefficient calculated from the fit with slope of 0.727 by Equation (8) is 132.35 μV/K. All values obtained from linear fit in Figure 9 are very similar and differ with a 2.11 standard deviation.
Nickel and Cr20Ni80 slices are used to test the electrical resistivity measurement. The results obtained and other data from the literature are listed in Table 1. Subjected to the data acquisition device in this setup, electrical resistivity measurement for high electrical conductive material like nickel represents an undesirable deviation. While the obtained result for Cr20Ni80 with lower electrical conductivity, which is a common material for precision resistance, is shown to be in good agreement with that found by other authors. The resistivity of common thermoelectric materials generally falls within the range of 10−6 to 10−3 Ω·m, with variations depending on the material type, doping and temperature conditions. Considering thermoelectric coatings thermal sprayed generally have higher resistivities than the Cr20Ni80 sample, the setup does not significantly impact its primary application in characterizing thermoelectric coatings, whereas its performance with highly conductive materials such as nickel could be a concern.
The measurement cycle was repeated for the whole measurement temperature range 50 °C–500 °C and both the Seebeck coefficient and electrical conductivity data are shown in Figure 9. The positive sign of Seebeck coefficient confirms the p-type conduction mechanism of HMS. It can be seen that the Seebeck coefficient trend is reversed compared with the temperature dependence of electrical conductivity. Seebeck coefficient increases within the temperature range used for measurement. All the trends of the measurement on HMS coating are consistent with bulk MnSi1.77 characterized by thermoelectric researchers [29], proving that the setup we built is competent for thermoelectric performance measurement of thermal sprayed coatings.

5. Conclusions

A simple setup for thermoelectric power factor of thermoelectric coatings is designed and developed indigenously. The setup has a compact structure which could be inserted into a tube furnace, measuring the Seebeck coefficient and electrical resistivity simultaneously in a variable temperature range. This makes it a low-cost device without additional investment on a vacuum chamber. A spring-load unit was used to press the thermocouple probe onto the sample surface, thereby ensuring good contact and acquiring temperature and voltage data from the same position. The setup was tested using the Cr20Ni80. The setup demonstrated reliable electrical resistivity results for Cr20Ni80 alloy, closely matching published values (1.16 × 10⁻⁶ Ω·m vs. 1.10 × 10⁻⁶ Ω·m). The Seebeck coefficient of the plasma-sprayed higher manganese silicide (HMS) coating was measured to be approximately 132.35 μV/K at 150 °C with measurements showing high linearity (R2 > 0.99), which was shown to validate the slope method for Seebeck coefficient calculation. HMS coating was also characterized from 50 °C to 500 °C to validate the setup on thermoelectric performance characterization across a wide temperature range. These results confirm the reliability of the developed setup.

Author Contributions

Writing—original draft, M.L.; Writing—review & editing, C.J.; Project administration, G.Z. All authors have read and agreed to the published version of the manuscript.

Funding

This work was supported by the National Key R&D Program of China (2018YFB1105800) and the foundation of Laboratory for High Energy Density Beam Processing Technology.

Institutional Review Board Statement

Not applicable.

Informed Consent Statement

Not applicable.

Data Availability Statement

Data are contained within the article.

Conflicts of Interest

The authors declare no conflicts of interest.

Nomenclature

Across-sectional area, mm2
C1the first cooling down phase in the measurement cycle
C2the second cooling down phase in the measurement cycle
Dseparation distance of the probes, mm
H1the first heating phase in the measurement cycle
H2the second heating phase in the measurement cycle
Llength of the sample, mm
Rccontact resistance, Ω
Rssample resistance, Ω
Rllead resistance, Ω
SSeebeck coefficient of the sample, μV/K
SpSeebeck coefficient of the positive leg of the thermocouple, μV/K
SnSeebeck coefficient of the negative leg of the thermocouple, μV/K
STCSeebeck coefficient of the employed thermocouple, μV/K
tthickness of the sample, mm
ΔTtemperature difference, K
T1the lower temperature reading of the two thermocouples, K
T2the higher temperature reading of the two thermocouples, K
U2ppotential difference measured with 2-probe method, V
U4ppotential difference measured with 4-probe method, V
Upvoltage measured across the positive pair of thermocouple wires, μV
Unvoltage measured across the negative pair of thermocouple wires, μV
wwide of the sample, mm

References

  1. Li, Y.; Yang, Y.; Ge, M.; Liang, Z.; Zhao, Y.; Wang, S. Performance Analysis of a Thermoelectric Generator Applied to Wet Flue Gas Waste Heat Recovery. Appl. Energy 2018, 228, 2080–2089. [Google Scholar] [CrossRef]
  2. Biswas, K.; He, J.; Blum, I.D.; Wu, C.I.; Hogan, T.P.; Seidman, D.N.; Dravid, V.P.; Kanatzidis, M.G. High-Performance Bulk Thermoelectrics with All-Scale Hierarchical Architectures. Nature 2012, 489, 414–418. [Google Scholar] [CrossRef] [PubMed]
  3. Zheng, X.F.; Liu, C.X.; Yan, Y.Y.; Wang, Q. A Review of Thermoelectrics Research—Recent Developments and Potentials for Sustainable and Renewable Energy Applications. Renew. Sustain. Energy Rev. 2014, 32, 486–503. [Google Scholar] [CrossRef]
  4. Snyder, G.J.; Toberer, E.S. Complex Thermoelectric Materials. Nat. Mater. 2008, 7, 105–114. [Google Scholar] [CrossRef]
  5. Selvan, K.V.; Mohamed Ali, M.S. Micro-Scale Energy Harvesting Devices: Review of Methodological Performances in the Last Decade. Renew. Sustain. Energy Rev. 2016, 54, 1035–1047. [Google Scholar] [CrossRef]
  6. Twaha, S.; Zhu, J.; Yan, Y.; Li, B. A Comprehensive Review of Thermoelectric Technology: Materials, Applications, Modelling and Performance Improvement. Renew. Sustain. Energy Rev. 2016, 65, 698–726. [Google Scholar] [CrossRef]
  7. Zhang, Q.; Sun, Y.; Xu, W.; Zhu, D. Organic Thermoelectric Materials: Emerging Green Energy Materials Converting Heat to Electricity Directly and Efficiently. Adv. Mater. 2014, 26, 6829–6851. [Google Scholar] [CrossRef]
  8. Carmo, J.P.; Antunes, J.; Silva, M.F.; Ribeiro, J.F.; Goncalves, L.M.; Correia, J.H. Characterization of Thermoelectric Generators by Measuring the Load-Dependence Behavior. Meas. J. Int. Meas. Confed. 2011, 44, 2194–2199. [Google Scholar] [CrossRef]
  9. Zhao, L.D.; Dravid, V.P.; Kanatzidis, M.G. The Panoscopic Approach to High Performance Thermoelectrics. Energy Environ. Sci. 2014, 7, 251–268. [Google Scholar] [CrossRef]
  10. Champier, D. Thermoelectric Generators: A Review of Applications. Energy Convers. Manag. 2017, 140, 167–181. [Google Scholar] [CrossRef]
  11. Ibáñez, M.; Luo, Z.; Genç, A.; Piveteau, L.; Ortega, S.; Cadavid, D.; Dobrozhan, O.; Liu, Y.; Nachtegaal, M.; Zebarjadi, M.; et al. High-Performance Thermoelectric Nanocomposites from Nanocrystal Building Blocks. Nat. Commun. 2016, 7, 10766. [Google Scholar] [CrossRef] [PubMed]
  12. Andrei, V.; Bethke, K.; Rademann, K. Thermoelectricity in the Context of Renewable Energy Sources: Joining Forces Instead of Competing. Energy Environ. Sci. 2016, 9, 1528–1532. [Google Scholar] [CrossRef]
  13. Heremans, J.P.; Wiendlocha, B.; Chamoire, A.M. Resonant Levels in Bulk Thermoelectric Semiconductors. Energy Environ. Sci. 2012, 5, 5510–5530. [Google Scholar] [CrossRef]
  14. He, R.; Schierning, G.; Nielsch, K. Thermoelectric Devices: A Review of Devices, Architectures, and Contact Optimization. Adv. Mater. Technol. 2018, 3, 1700256. [Google Scholar] [CrossRef]
  15. Han, C.; Tan, G.; Varghese, T.; Kanatzidis, M.G.; Zhang, Y. High-Performance PbTe Thermoelectric Films by Scalable and Low-Cost Printing. ACS Energy Lett. 2018, 3, 818–822. [Google Scholar] [CrossRef]
  16. Abadlia, L.; Gasser, F.; Khalouk, K.; Mayoufi, M.; Gasser, J.G. New Experimental Methodology, Setup and LabView Program for Accurate Absolute Thermoelectric Power and Electrical Resistivity Measurements between 25 and 1600 K: Application to Pure Copper, Platinum, Tungsten, and Nickel at Very High Temperatures. Rev. Sci. Instrum. 2014, 85, 095121. [Google Scholar] [CrossRef]
  17. Wang, C.; Chen, F.; Sun, K.; Chen, R.; Li, M.; Zhou, X.; Sun, Y.; Chen, D.; Wang, G. Contributed Review: Instruments for Measuring Seebeck Coefficient of Thin Film Thermoelectric Materials: A Mini-Review. Rev. Sci. Instrum. 2018, 89, 101501. [Google Scholar] [CrossRef]
  18. Kedia, S.K.; Singh, A.; Chaudhary, S. Design, Development, and Testing of a Thermopower Measurement System by Studying the Electron Transport Properties on Indium and Nitrogen Co-Doped Sputtered ZnO Films. Meas. J. Int. Meas. Confed. 2018, 117, 49–56. [Google Scholar] [CrossRef]
  19. Narjis, A.; Elyaagoubi, M.; Outzourhit, A.; Nkhaili, L. Design of a Simple Apparatus for the Measurement of the Seebeck Coefficient. Meas. J. Int. Meas. Confed. 2019, 133, 433–438. [Google Scholar] [CrossRef]
  20. Ravichandran, J.; Kardel, J.T.; Scullin, M.L.; Bahk, J.H.; Heijmerikx, H.; Bowers, J.E.; Majumdar, A. An Apparatus for Simultaneous Measurement of Electrical Conductivity and Thermopower of Thin Films in the Temperature Range of 300-750 K. Rev. Sci. Instrum. 2011, 82, 015108. [Google Scholar] [CrossRef]
  21. Fu, Q.; Xiong, Y.; Zhang, W.; Xu, D. A Setup for Measuring the Seebeck Coefficient and the Electrical Resistivity of Bulk Thermoelectric Materials. Rev. Sci. Instrum. 2017, 88, 095111. [Google Scholar] [CrossRef] [PubMed]
  22. Rouleau, O.; Alleno, E. Measurement System of the Seebeck Coefficient or of the Electrical Resistivity at High Temperature. Rev. Sci. Instrum. 2013, 84, 105103. [Google Scholar] [CrossRef] [PubMed]
  23. Berger, L.M.; Barbosa, M.M.; Martin, H.P.; Puschmann, R.; Scheitz, S.; Thiele, S.; Leyens, C.; Beyer, E.; Michaelis, A. Potential of Thermal Spray Technologies for the Manufacture of TEG. In Thermoelectrics Goes Automotive II; Jänsch, D., Ed.; Expert Verlag: Tübingen, Germany, 2013; pp. 260–272. [Google Scholar]
  24. Singh, Y. Electrical Resistivity Measurements: A Review. Int. J. Mod. Phys. Conf. Ser. 2013, 22, 745–756. [Google Scholar] [CrossRef]
  25. He, X.; Yang, J.; Jiang, Q.; Luo, Y.; Zhang, D.; Zhou, Z.; Ren, Y.; Li, X.; Xin, J.; Hou, J. A New Method for Simultaneous Measurement of Seebeck Coefficient and Resistivity. Rev. Sci. Instrum. 2016, 87, 124901. [Google Scholar] [CrossRef]
  26. Schrade, M.; Fjeld, H.; Norby, T.; Finstad, T.G. Versatile Apparatus for Thermoelectric Characterization of Oxides at High Temperatures. Rev. Sci. Instrum. 2014, 85, 103906. [Google Scholar] [CrossRef]
  27. De Boor, J.; Müller, E. Data Analysis for Seebeck Coefficient Measurements. Rev. Sci. Instrum. 2013, 84, 065102. [Google Scholar] [CrossRef]
  28. Liu, Y.; Fu, C.; Xie, H.; Zhao, X.; Zhu, T. Reliable Measurements of the Seebeck Coefficient on a Commercial System. J. Mater. Res. 2015, 30, 2670–2677. [Google Scholar] [CrossRef]
  29. Zamanipour, Z.; Shi, X.; Mozafari, M.; Krasinski, J.S.; Tayebi, L.; Vashaee, D. Synthesis, Characterization, and Thermoelectric Properties of Nanostructured Bulk p-Type MnSi1.73, MnSi1.75, and MnSi1.77. Ceram. Int. 2013, 39, 2353–2358. [Google Scholar] [CrossRef]
Figure 1. (a) Four-probe method for electrical conductivity measurement. Equivalent circuits of (b) two-probe method and (c) four-probe method.
Coatings 15 00679 g001
Figure 2. Schematic of Seebeck coefficient measurement.
Coatings 15 00679 g002
Figure 3. Schematic of measurement setup.
Coatings 15 00679 g003
Figure 4. (a) The sample holder fixed in the tube and the details of (b) the stainless-steel framing and (c) the sample platform.
Coatings 15 00679 g004
Figure 5. Measurement procedure controlled by the program.
Coatings 15 00679 g005
Figure 6. (a) The measured variations of T1 and T2, (b) the variation in the T , and (c) the measured voltage U n and U p for Seebeck coefficient measurement at 300 K.
Coatings 15 00679 g006
Figure 7. T vs. ΔU in two heating phases. Variables are labeled for better distinction, e.g., Up_H1 is the voltage acquired in H1 period.
Coatings 15 00679 g007
Figure 8. Seebeck coefficient measurement data (a) ΔT vs. ΔU and (b) ΔUn vs. ΔUp of HMS coating at 150 °C.
Coatings 15 00679 g008
Figure 9. The measured Seebeck coefficient and electrical conductivity of plasma sprayed HMS coating from 50 °C to 500 °C.
Coatings 15 00679 g009
Table 1. The obtained resistivity results and comparisons with literature data.
SampleObtained Electrical ConductivityData from Literature
Ni7.57 × 10−8 Ω·m6.99 × 10−8 Ω·m
Cr20Ni80(6J20)1.16 × 10⁻⁶ Ω·m1.10 × 10−6 Ω·m
Disclaimer/Publisher’s Note: The statements, opinions and data contained in all publications are solely those of the individual author(s) and contributor(s) and not of MDPI and/or the editor(s). MDPI and/or the editor(s) disclaim responsibility for any injury to people or property resulting from any ideas, methods, instructions or products referred to in the content.

