Article

Performance and Mechanism on Sand Mold Ultrasonic Milling

China Academy of Machinery Science and Technology Group, Beijing 100044, China
*
Author to whom correspondence should be addressed.
Coatings 2025, 15(6), 633; https://doi.org/10.3390/coatings15060633
Submission received: 31 March 2025 / Revised: 19 May 2025 / Accepted: 21 May 2025 / Published: 25 May 2025
(This article belongs to the Special Issue Cutting Performance of Coated Tools)

Abstract

:
Sand mold milling plays a critical role in digital mold-free casting, but it is prone to damage such as corner collapse, collapse, and cracks during the machining process. To address this issue, ultrasonic vibration was used for sand mold milling in this study. By incorporating the solid–liquid transition model for sand mold cutting and considering the deformation characteristics of the shear zone, a prediction model for ultrasonic milling forces in sand mold was developed and experimentally validated. The results demonstrate that increasing the spindle speed and decreasing the feed rate lead to a decrease in cutting force. At high speeds, there is a 15% error between the dynamic milling force model and experimental values. Compared with conventional processing methods, ultrasonic processing reduces cutting force by 19.5% at a frequency of 25.8 kHz and amplitude of 2.97 μm, minimizes defects like sand particle detachment pits on the surface of sand mold, significantly improves surface quality, and enables precise, stable, high-precision, and efficient sand mold processing.

1. Introduction

The sand mold, serving as the primary method for forming metal castings, presents numerous advantages, such as cost-effectiveness, process simplicity, and wide applicability. It finds extensive use across diverse industries, including aerospace, defense, automotive, and shipbuilding [1]. The patternless casting process has significantly reduced the manufacturing timeline and facilitated the rapid production of small batches through direct machining of sand molds. However, certain challenges persist, such as the inherent low strength of sand mold, which can result in defects like corner chipping, cracking, and fractures during processing. In particular, thin-walled sand mold structures are highly susceptible to breakage and structural collapse, posing a significant risk to the overall quality of the final castings [2,3]. However, sand molds typically exhibit low strength, making conventional machining processes prone to generating various manufacturing defects that can adversely affect the quality of final castings. This necessitates further research into optimizing the machining techniques [4,5].
Shan et al. [6] developed a predictive model for tool wear in patternless sand mold casting, effectively anticipating the impact of process parameter changes on sand milling tool wear. Zhang et al. [7] employed controlled variables in sand mold milling to analyze the influence of milling parameters on milling force, revealing that milling force increases with higher speeds, widths, and depths. In order to enhance the quality of sand mold processing, Rao et al. [8] established a mapping relationship between process parameters and milling force through multiple linear regression analysis and subsequently optimized the sand mold milling parameters accordingly. Rizal et al. [9] suggest that the quality of sand casting is influenced not only by the quality of the sand mold itself but also by multiple factors such as gate location, molding conditions, and pouring temperature. Current research on patternless casting for sand molds primarily focuses on tool wear and process parameter optimization, with limited attention given to specialized machining processes such as ultrasonic techniques.
Ultrasonic vibration serves as an effective auxiliary method. By applying ultrasonic vibration to the cutting tool, the tool achieves a periodic dynamic impact cutting effect during the cutting process, resulting in advantages such as low cutting force, high cutting efficiency, and extended tool life [10,11,12]. Through their analysis of the impact of high-frequency vibration on the milling surface, Kabri et al. [13] suggest that ultrasonic machining can reduce cutting forces in brittle materials, minimize surface damage during processing, and achieve better machining performance under low machining power and high rotational speed conditions. Zhu et al. [14] concluded that ultrasonic vibration enhances the stability of the cutting process and improves the surface quality of the workpiece. Huang et al. [15] conducted a study on mitigating tool wear in ultrasonic machining and posited that the contact-separation processing characteristics inherent to ultrasonic machining can enhance the processing environment and prolong tool longevity. Arroyo et al. [16] suggest that ultrasonic machining technology achieves better machining performance at low feed rates, which can effectively reduce cutting forces, improve surface finish quality, and minimize tool wear.

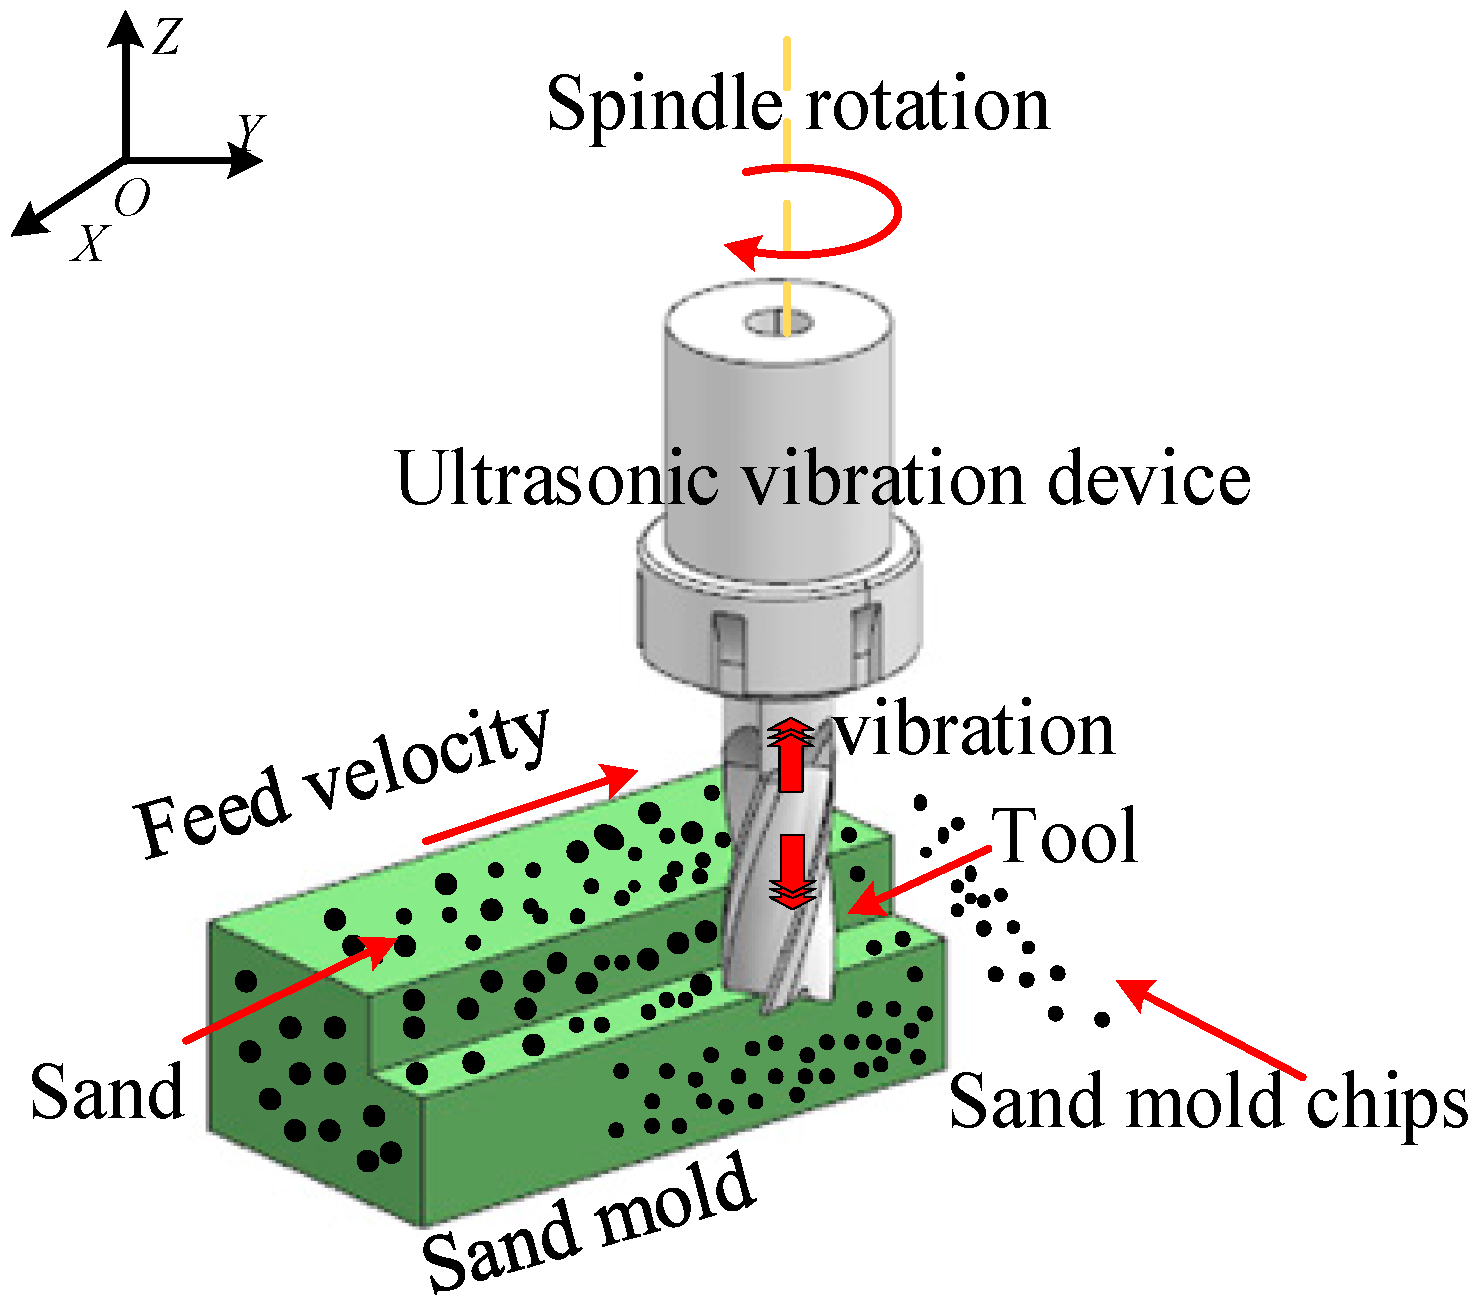
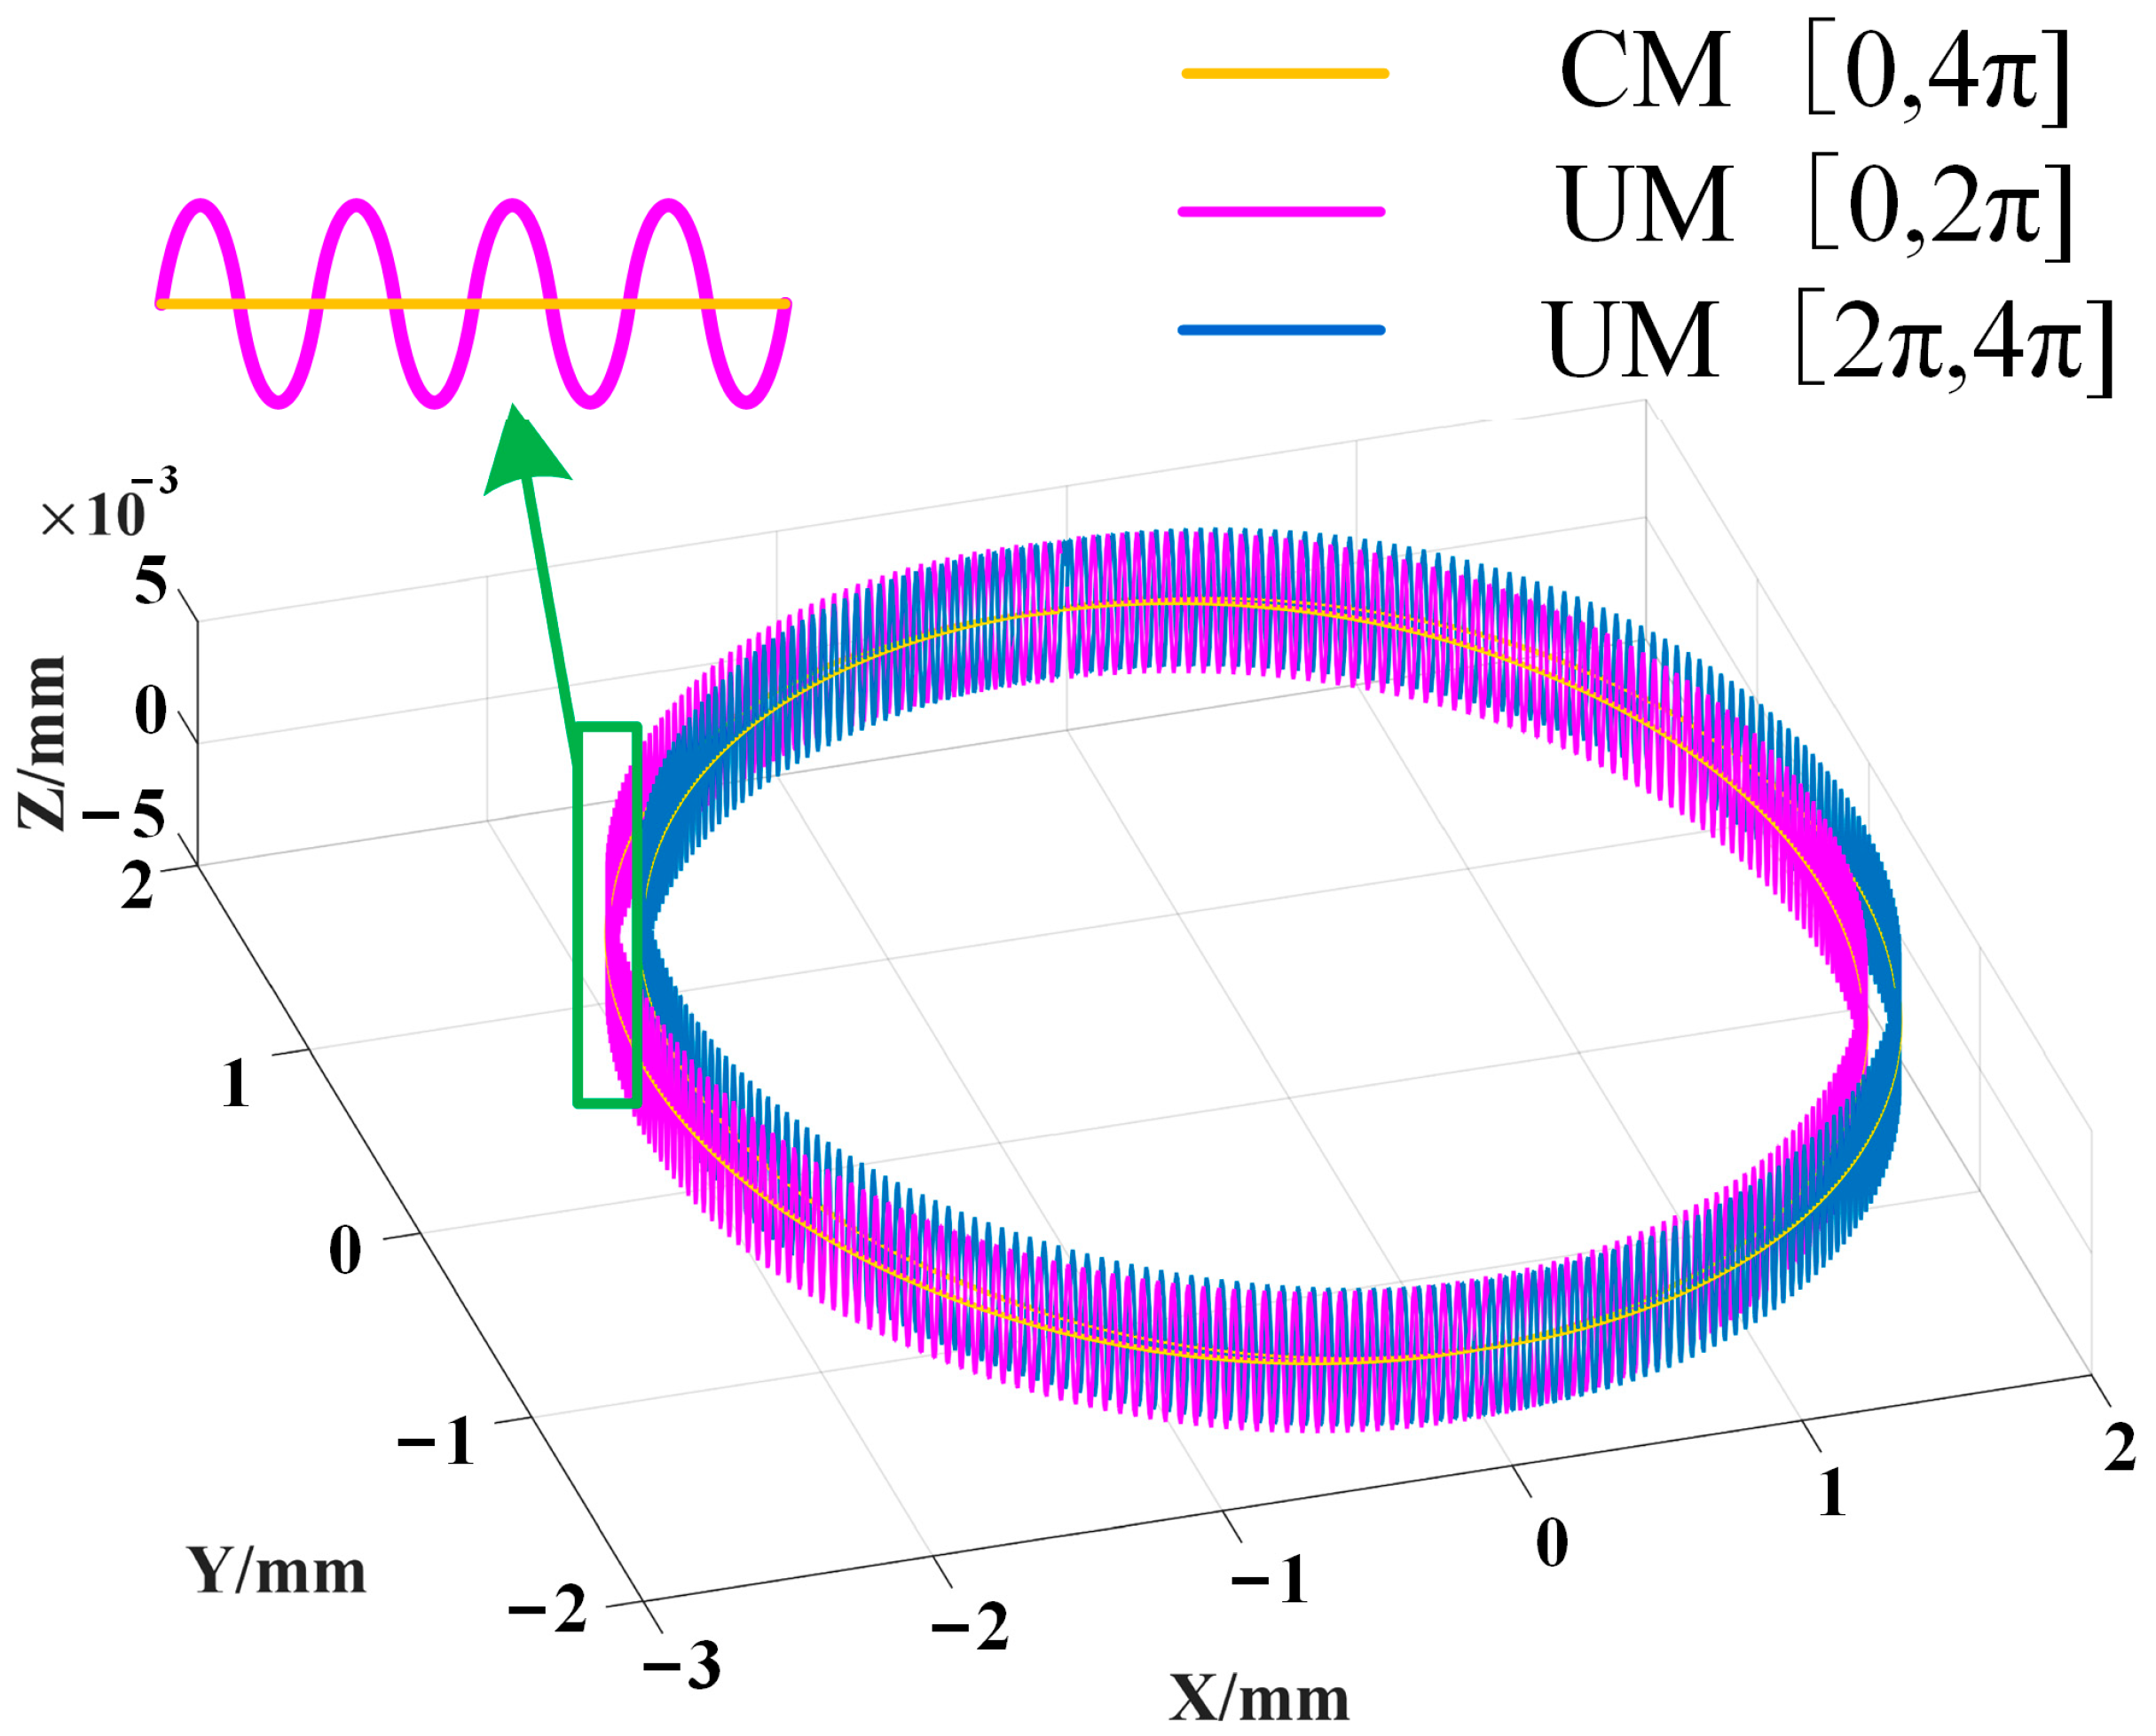
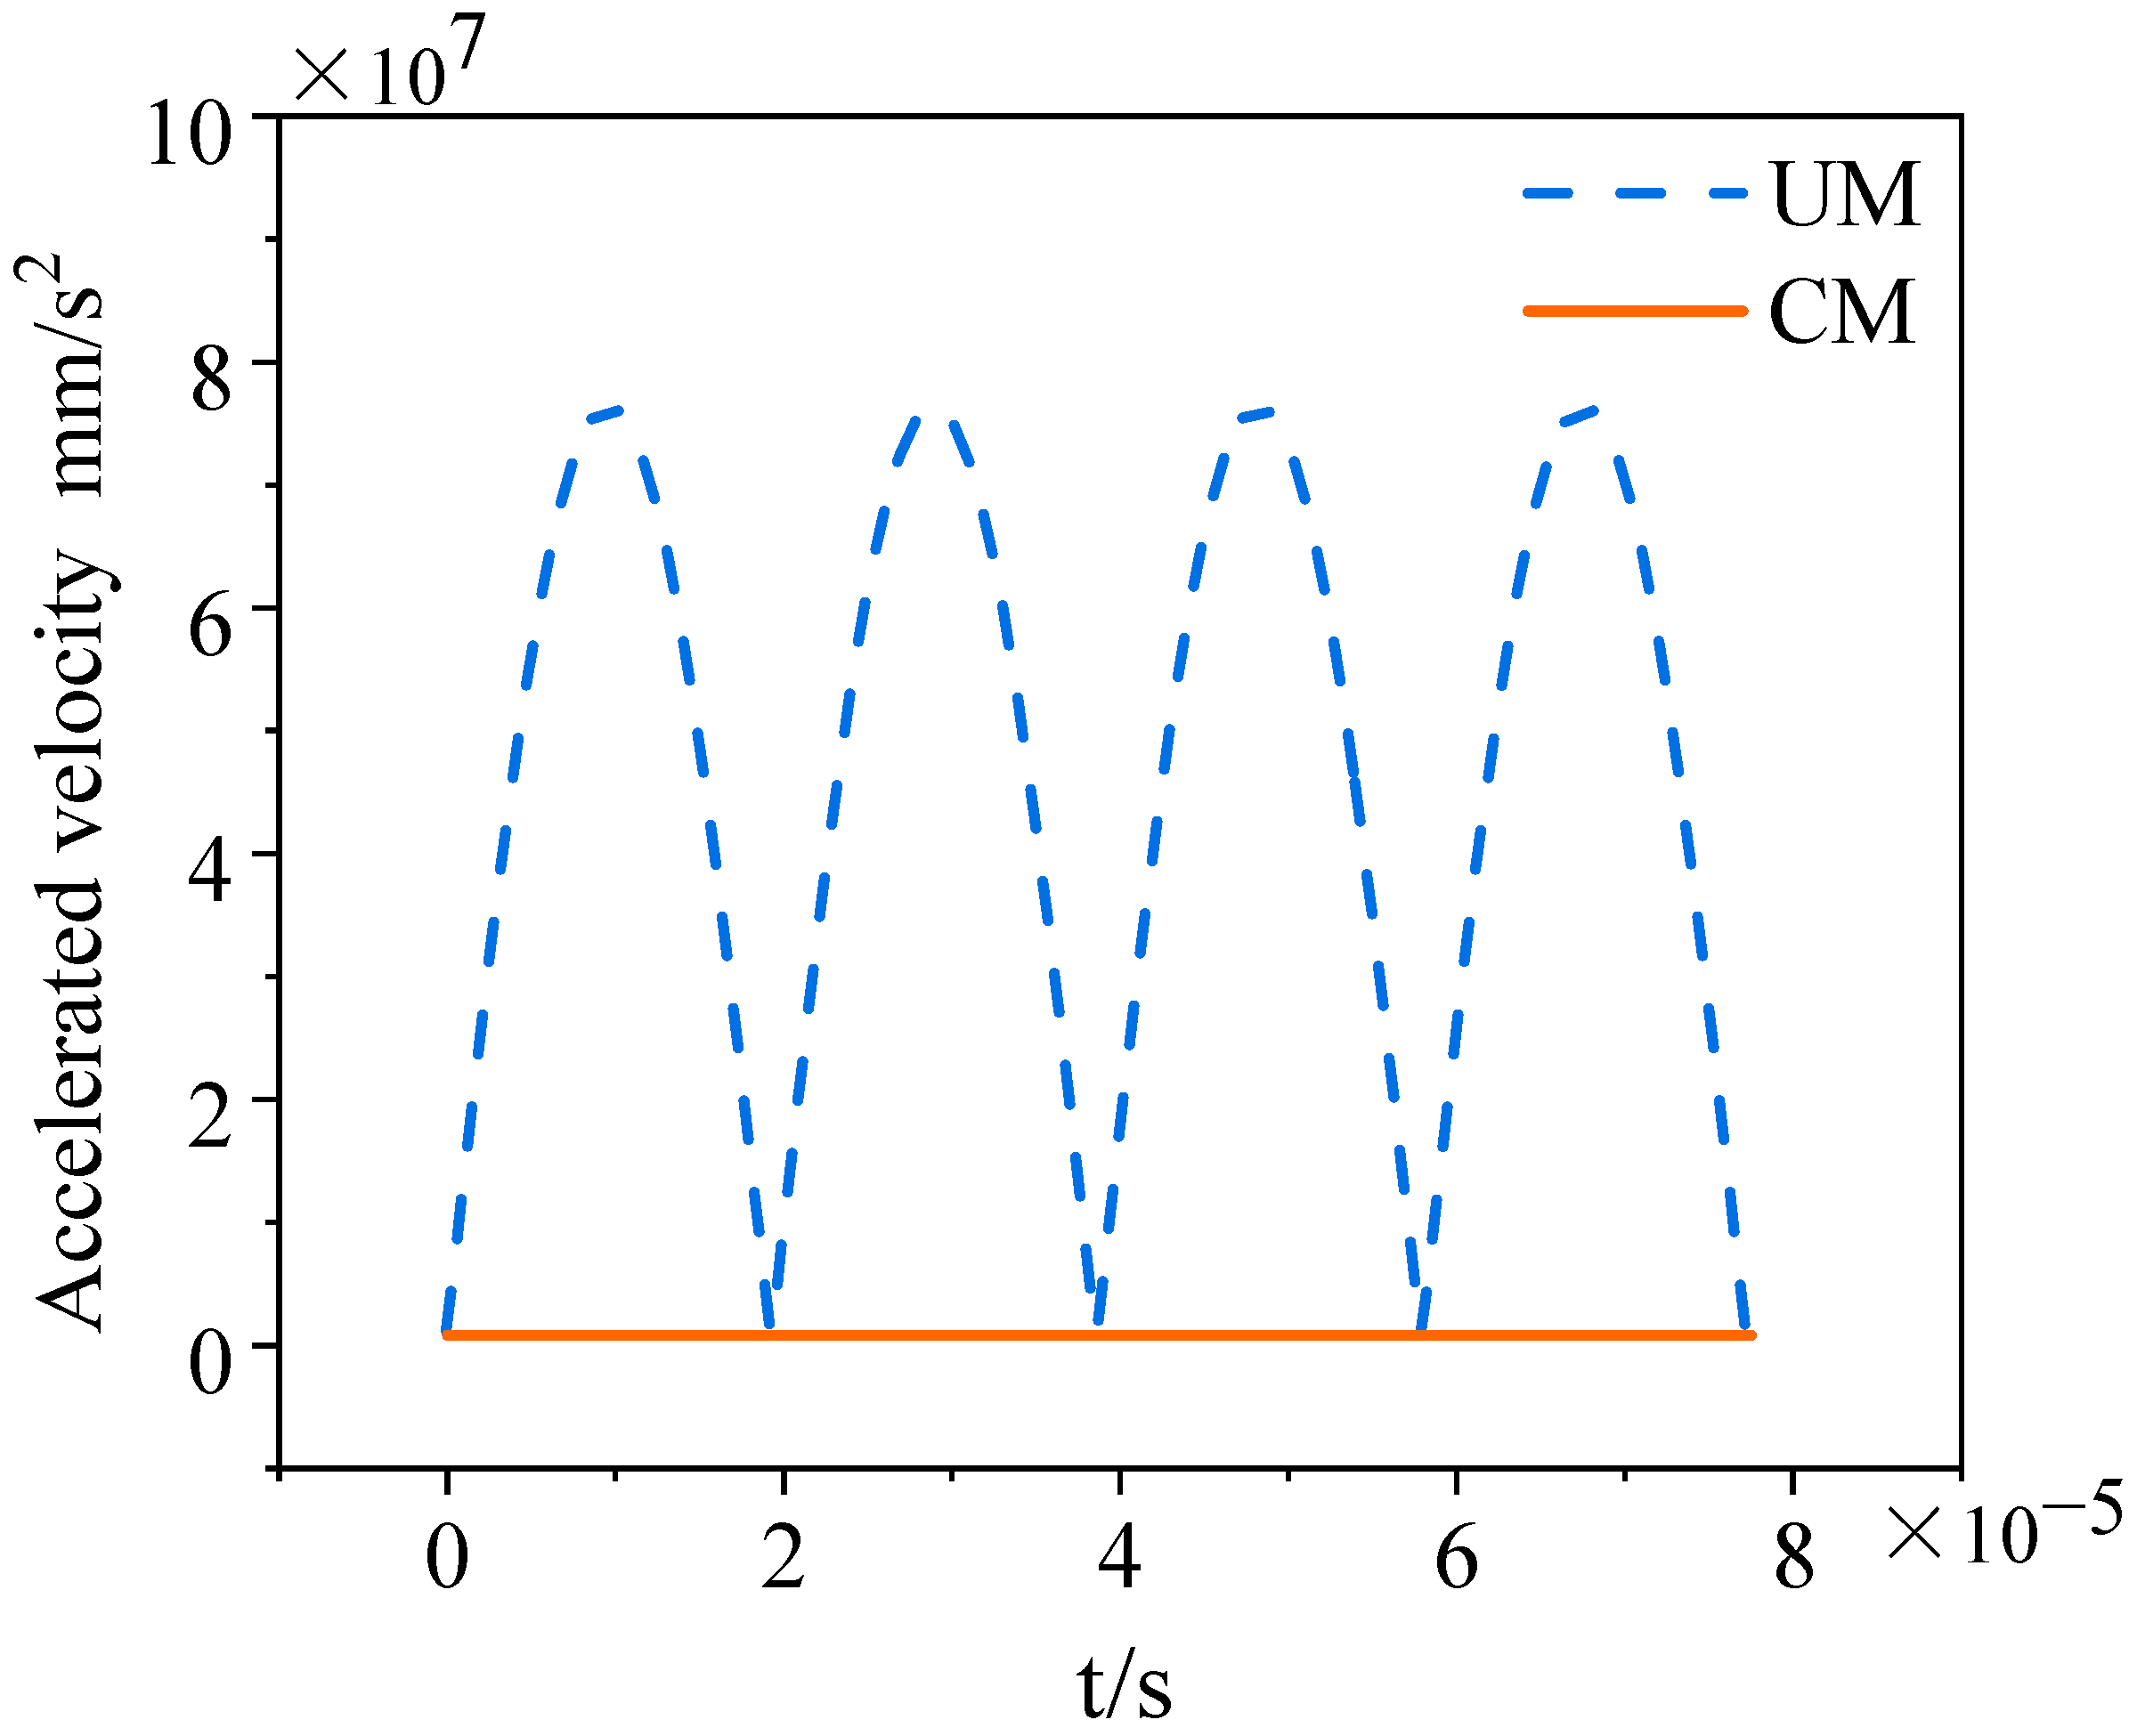
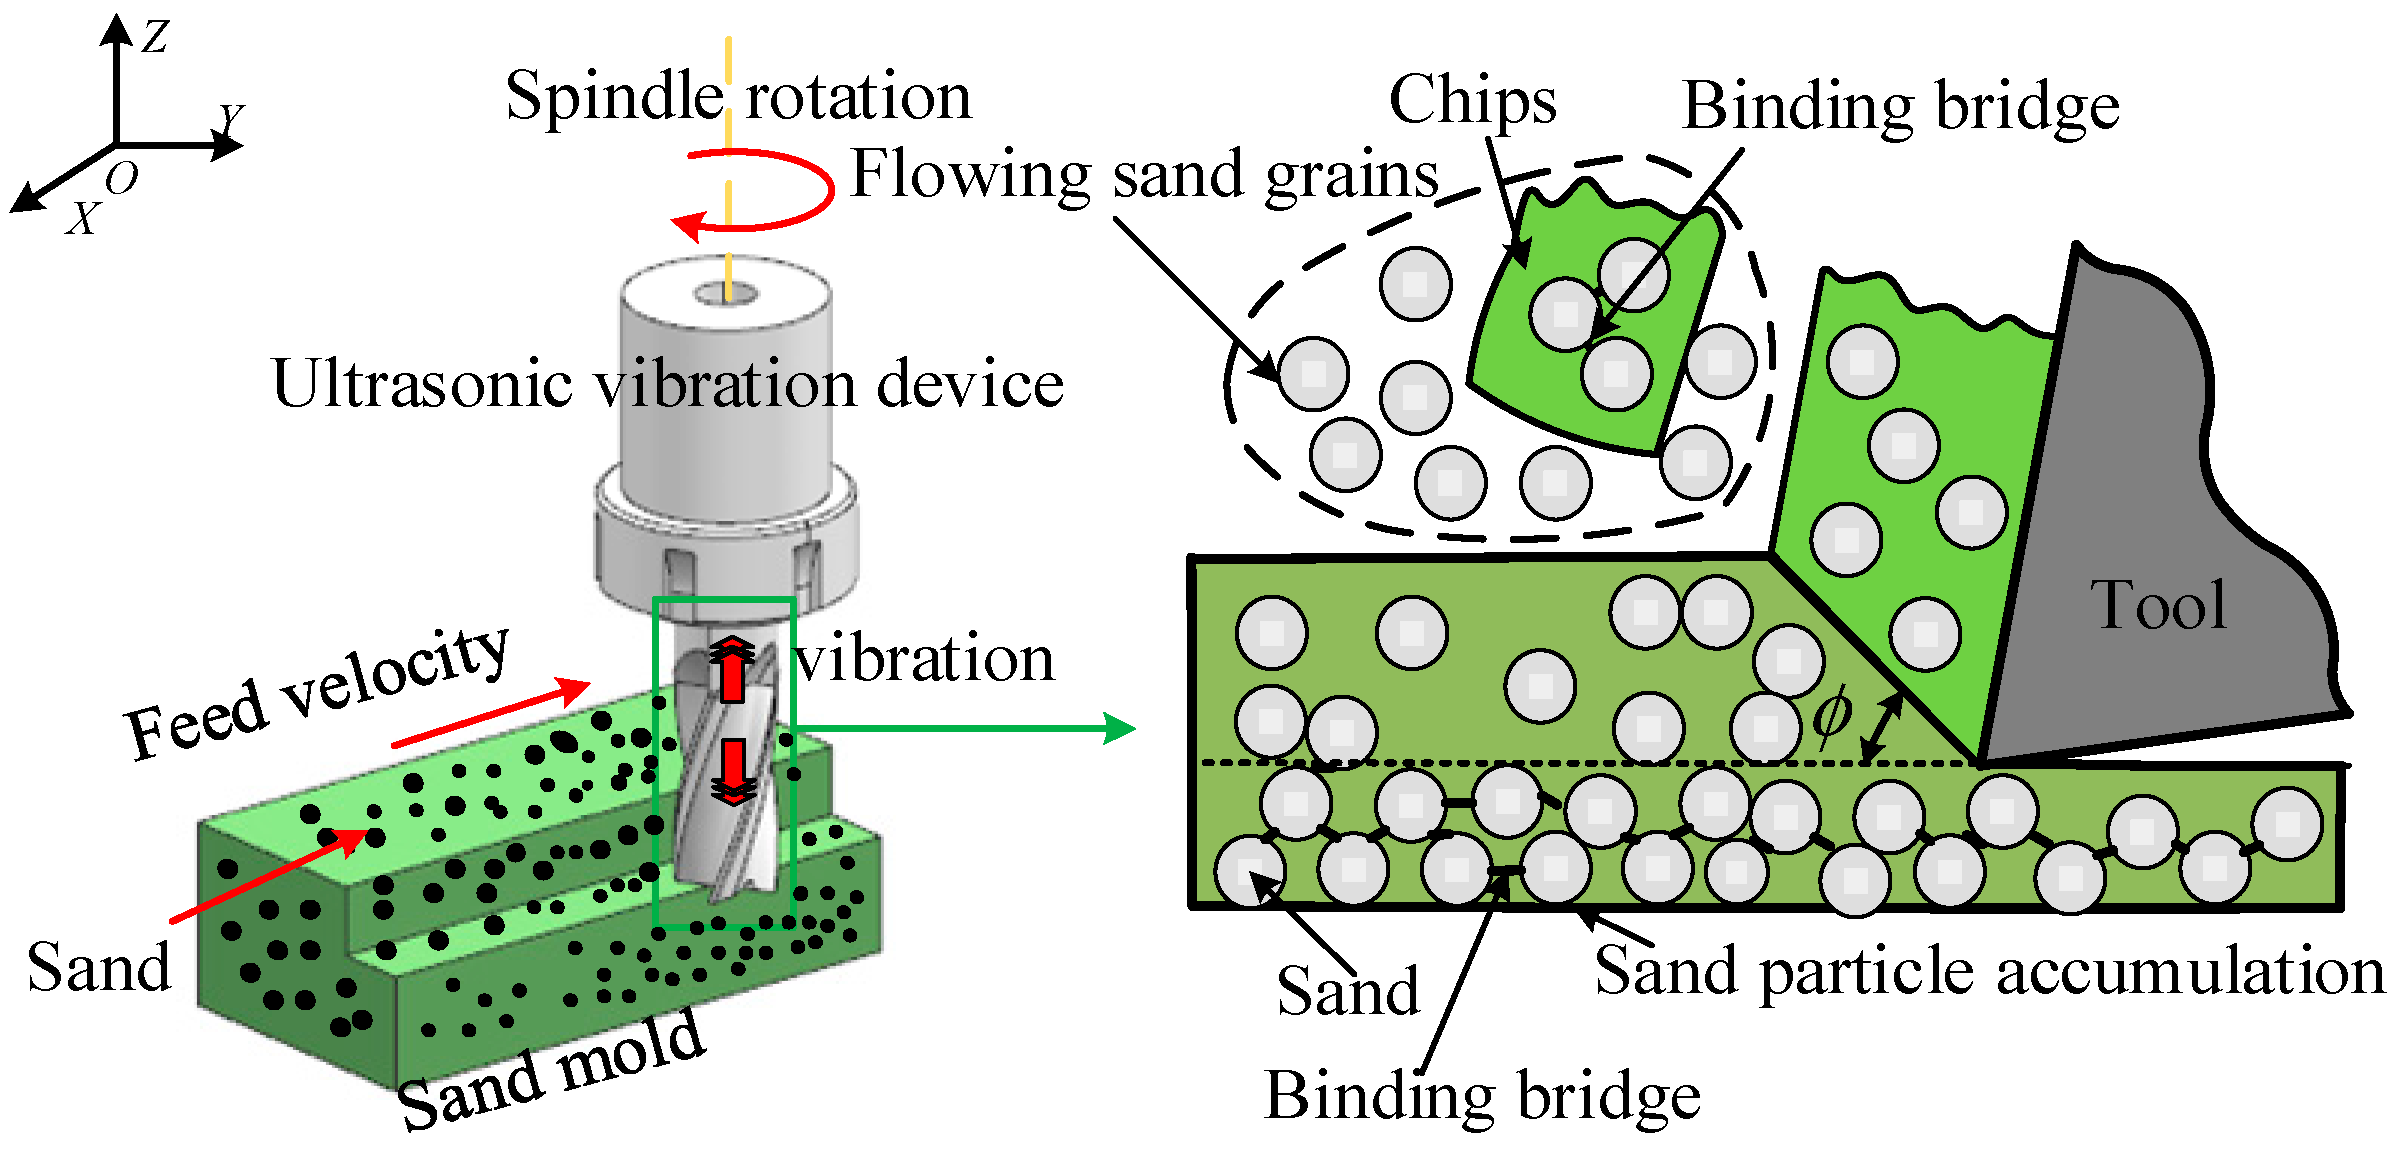
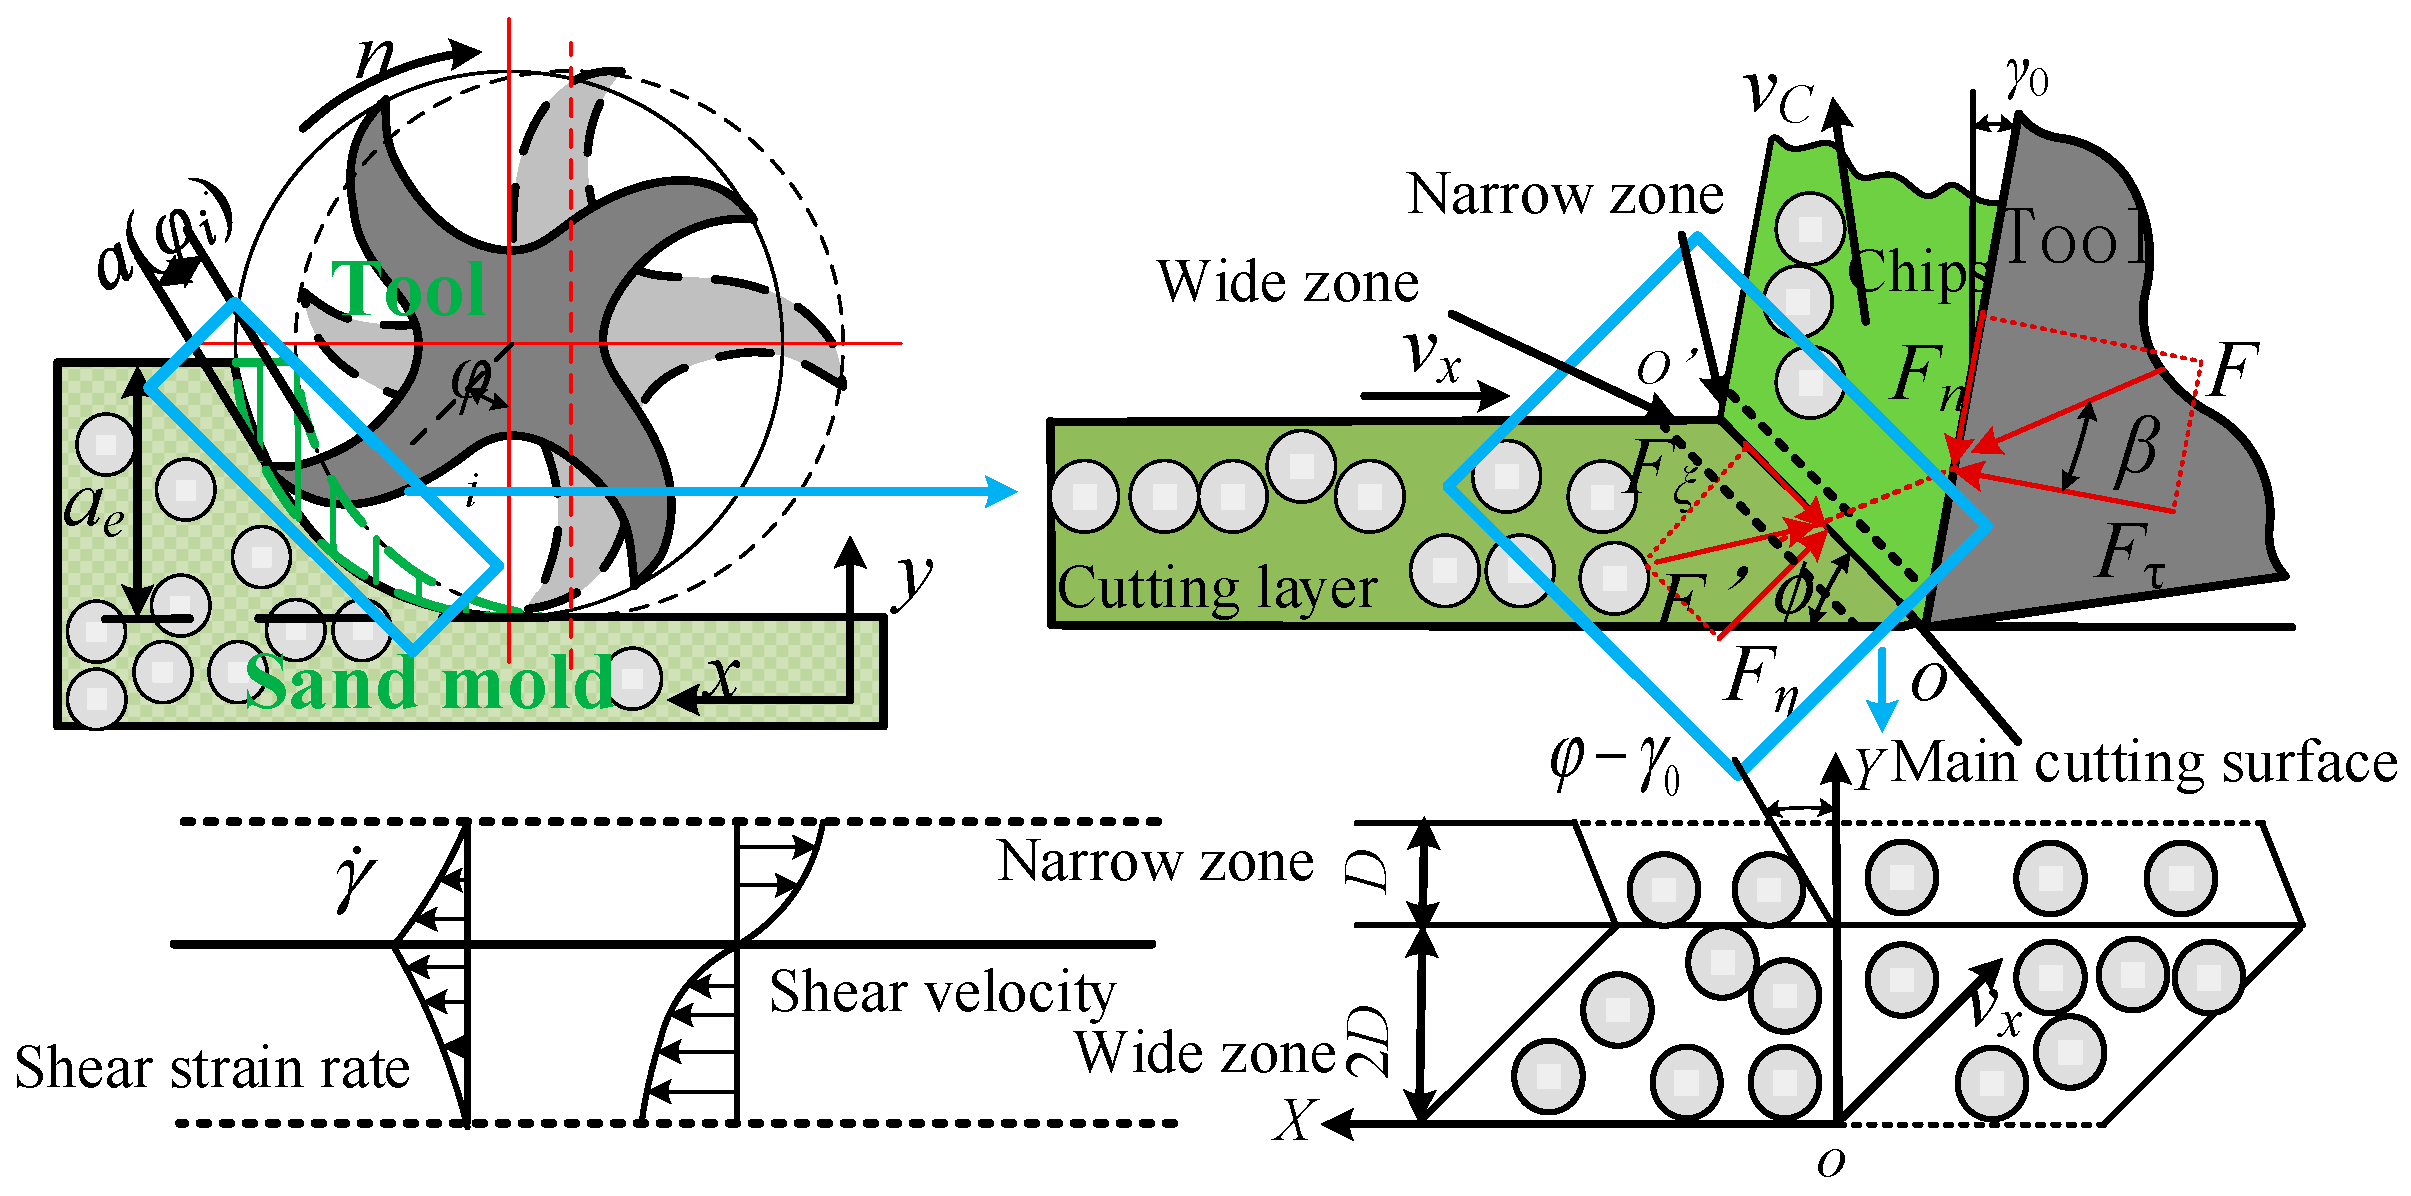
2. Characteristics of Sand Mold UM

In ultrasonic milling (UM), the application of high-frequency vibrations to the cutting tool results in periodic impact cutting on the sand mold, thereby promoting material fracture. The mechanism of the UM process is illustrated in Figure 1. Throughout this process, the motion trajectory of the cutting edge is determined by a combination of spindle speed, feed rate, and high-frequency vibration. The kinematic characteristics of the tool can be analyzed through examination of the motion trajectory of the cutting edge.
The kinematic characteristics of typical axial UM are analyzed using the horizontal plane where the tool contacts the sand mold as the reference plane. Modeling is conducted based on the motion trajectory of a point (x1, y1, z1) on the cutting edge:
x 1 ( t ) = v x t + r cos ( ω t ) y 1 ( t ) = r sin ( ω t ) z 1 ( t ) = A sin 2 π f t + φ 0
where A is the amplitude, f is the frequency, φ0 is the initial phase angle, i is the serial number of the milling cutter blade, r is the axial distance of a specific point, t is time, and ω is angular velocity. When the spindle speed n = 6000 r/min, the feed rate vx = 700 mm/min, A = 0.003 μm, f = 25.8 kHz, r = 4 mm, and φ0 = 0, the motion trajectories of the cutting edge rotating for two cycles in both conventional milling (CM) and UM can be calculated using formula (1), as shown in Figure 2.
Compared to the smooth curve of CM, the motion trajectory of UM is a spiral curve with periodic vibrations, exhibiting a distinct up-and-down vibration effect. For sand molds, the up-and-down vibration of the cutting edge reduces the contact time between the tool and the surface of the sand mold, helping to weaken the friction effect of sand particles on the tool. By taking the derivative of Formula (1), the resultant velocity (vr) of UM can be obtained.
v x 1 ( t ) = v x r ω sin ( ω t ) v y 1 ( t ) = r ω cos ( ω t ) v z 1 ( t ) = 2 π A f cos 2 π f t + φ 0 v r = v 2 x 1 + v 2 y 1 + v 2 z 1
The resultant acceleration (ar) of UM can be obtained by taking the derivative of Formula (2):
a x 1 ( t ) = r ω 2 cos ( ω t ) a y 1 ( t ) = r ω 2 sin ( ω t ) a z 1 ( t ) = A 2 π f 2 sin 2 π f t + φ 0 a r = a 2 x 1 + a 2 y 1 + a 2 z 1
By substituting the parameters of UM into Formulas (2) and (3), the variation graphs of the cutting edge’s velocity and acceleration can be obtained, as shown in Figure 3 and Figure 4.
Compared to CM, UM exhibits significant acceleration impacts and variable-speed cutting effects due to its periodically varying feed rate and acceleration. This feature greatly enhances the kinetic energy of the tool during the cutting instant, enabling rapid removal of the sand mold when it comes into contact with the cutting edge within a very short period of time. For sand molds formed by the accumulation of sand grains and their inter-grain adhesive bridges, the instantaneous impact of the cutting edge primarily acts on the surface layer of the mold, causing rapid rupture of the adhesive bridges between sand grains, thereby effectively promoting the stripping of sand grains from the mold. After the impact is applied, the kinetic energy of the tool quickly diminishes, minimizing damage to the interior of the sand mold and ultimately enhancing the overall quality of machining.

3. Dynamic Milling Force of Sand Mold UM

Sand molds, classified as heterogeneous discrete granular packing materials, are primarily fabricated by premixing sand particles with corresponding binders. At the microscale, the sand mold consists of particles coated with thin binder layers that are mutually compacted, forming interconnected binding bridges between adjacent sand grains. During machining processes, the higher strength and stiffness of sand particles enable them to retain their original morphology and structural integrity, while the binding bridges are prone to fracture, resulting in chip-like fragments composed of sand particles, as illustrated in Figure 5. Consequently, the chip formation mechanism in sand molds can be attributed to the progressive deformation and rupture of these binding bridges.
Based on the granular mechanics framework of bonded particle models, the strength of sand molds is directly governed by the integrity of binding bridges formed between sand particles [17,18]. At the micro-level, the cutting tool compresses the sand mold, causing shear deformation within the cutting layer, breaking the bonds, and removing the material. Macroscopically, the sand grains primarily undergo rigid body motion and are removed in large chunks, exhibiting shear characteristics similar to metal cutting. Reverse milling is often employed during the milling of sand molds to prevent sand particle splashes. Therefore, analyzing the dynamic milling forces of reverse milling in sand molds, as illustrated in Figure 6, requires a combination of metal cutting and particle dispersion system deformation mechanisms.
The essence of the sand cutting process lies in the transition from solid particle accumulation to a fluid state, which can be summarized based on the constitutive relation between solid and liquid [19,20]:
σ i j = p i j I i j + 2 k τ 1 ρ p d 3 2 g 1 2 + 4 k τ 2 ρ p d 2 J 2 D i j + 4 k p 1 ρ p d 3 2 g 1 2 J 2 + 2 k τ 2 ρ p d 2 D i j 2
where pij is the external load applied to the particle, Dij is the deformation rate, J’2 is the deviatoric tensor of the deformation rate, g is the gravitational acceleration, and kτ1, 2, kp1, and kp2 are coefficients corresponding to the particle concentration.
The shear failure in the milling process of sand mold follows the Mohr–Coulomb strength criterion, and its shear strength is expressed as [21]:
τ s = σ s sin 2 ϕ 2 sin 2 ϕ tan ϕ 0
where σs is the strength of uniaxial compression, ϕ0 is the static internal friction angle of the sand mold particle, and ϕ is the shear angle. The shear zone of sand mold milling can be regarded as a plane simple shear flow, and the shear stress τϕ and σϕ on the shear plane can be expressed as [5]:
τ ϕ = σ s sin 2 ϕ 2 - sin 2 ϕ tan ϕ 0         - k τ 1 ρ d 3 2 g 1 2 γ ˙ + k τ 2 ρ d 2 γ ˙ 2 sin 2 ϕ σ ϕ = σ s sin 2 ϕ + k p 1 ρ d 3 2 g 1 2 γ ˙ + k p 2 ρ d 2 γ ˙ 2           + k τ 1 ρ d 3 2 g 1 2 γ ˙ + k τ 2 ρ d 2 γ ˙ 2 cos 2 ϕ
The cutting force prediction model for sand molds can be established by integrating flow stress analysis within the shear zone and material constitutive equations. Macroscopically, sand mold cutting exhibits shear characteristics analogous to those of continuum materials. By incorporating the unequal partition shear zone model derived from cutting deformation theory, a coordinate system is defined based on the initial slip line at the shear zone boundary, as shown in Figure 7. Considering deformation mechanisms from both metal cutting and granular systems, the shear zone in sand mold cutting is divided into a wide region and a narrow region. The total shear zone thickness is generally considered to be half the undeformed chip thickness, with the wide region thickness defined as 2D and the narrow region as D, where D denotes the particle packing layer height. The shear zone thickness is influenced by the material strain rate, and the corresponding shear strain rate distribution can be determined through strain rate field modeling. By neglecting the dilatancy effect of the granular system, the expression for the shear strain rate can be simplified as:
γ ˙ = v x y + v y x = d v x d y
By taking the derivative of the shear strain rate, the expression for strain rate is:
γ ˙ = d γ d t = γ t + γ y y t = v sin φ d γ d y
During the sand mold milling process, the strain rate of sand particles within the same layer is identical and can be expressed as [5,22]:
γ ˙ = γ ˙ m 2 D q D 2 q , y 0 , D γ ˙ m 2 D q 3 D 2 q , y D , 2 D γ ˙ m D q D 2 q , y 2 D , 3 D
where q is the exponent parameter. By substituting this equation into Equation (8), the shear strain λ in the shear zone can be calculated. Substituting the resulting equation into Equation (7) gives the velocity vx in the shear zone. Since the maximum shear strain rate occurs at the shear plane OO’, the strain rates at the initial and final boundaries within the shear zone are zero. Therefore, it can be assumed that the tangential velocity vx (2D) is zero at this point, resulting in [23]:
v x 2 D = 1 4 q + 3 4 q γ ˙ m D - v cos φ = - 1 2 q γ ˙ m D + v sin φ tan φ γ 0 = 0
Further results can be obtained:
3 q + 1 2 q = 1 tan φ tan φ γ 0 γ ˙ m = 2 q v x sin φ tan φ γ 0 D D = 3 2 d
According to Figure 7, during the milling process, the force on the chip is directly proportional to the cutting force, expressed as F = F’. The milling force per unit area at any instant can be represented as [5]:
F n φ = C n K n a ϕ i a p F τ φ = C n K τ a ϕ i a p F = F = F η + F ξ = σ ϕ a ϕ i sin ϕ a p 2 + τ ϕ a ϕ i sin ϕ a p 2 K τ = σ ϕ 2 + τ ϕ 2 cos β sin ϕ K τ = σ ϕ 2 + τ ϕ 2 cos β sin ϕ a p = a p 0 + A sin 2 π f t + φ 0 a ϕ i = v p sin ϕ i , ϕ i [ 0 , π / 2 + arcsin a e / R 1 ]
where Kτ is the tangential cutting force per unit area, Kn is the normal cutting force per unit area, ap is the milling depth, a(ϕi) is the instantaneous cutting thickness, ϕi is the milling rotation angle, vp is the feed per tooth, ae is the milling width, R is the tool radius, β is the friction angle between the sand mold and the preceding tool surface, and Cn is the proportionality coefficient.
The cutting force can be obtained by projection transformation:
F x = cos ϕ i γ 0 F τ + sin ϕ i γ 0 F n F y = sin ϕ i γ 0 F τ cos ϕ i γ 0 F n

4. Sand Mold UM Experiment

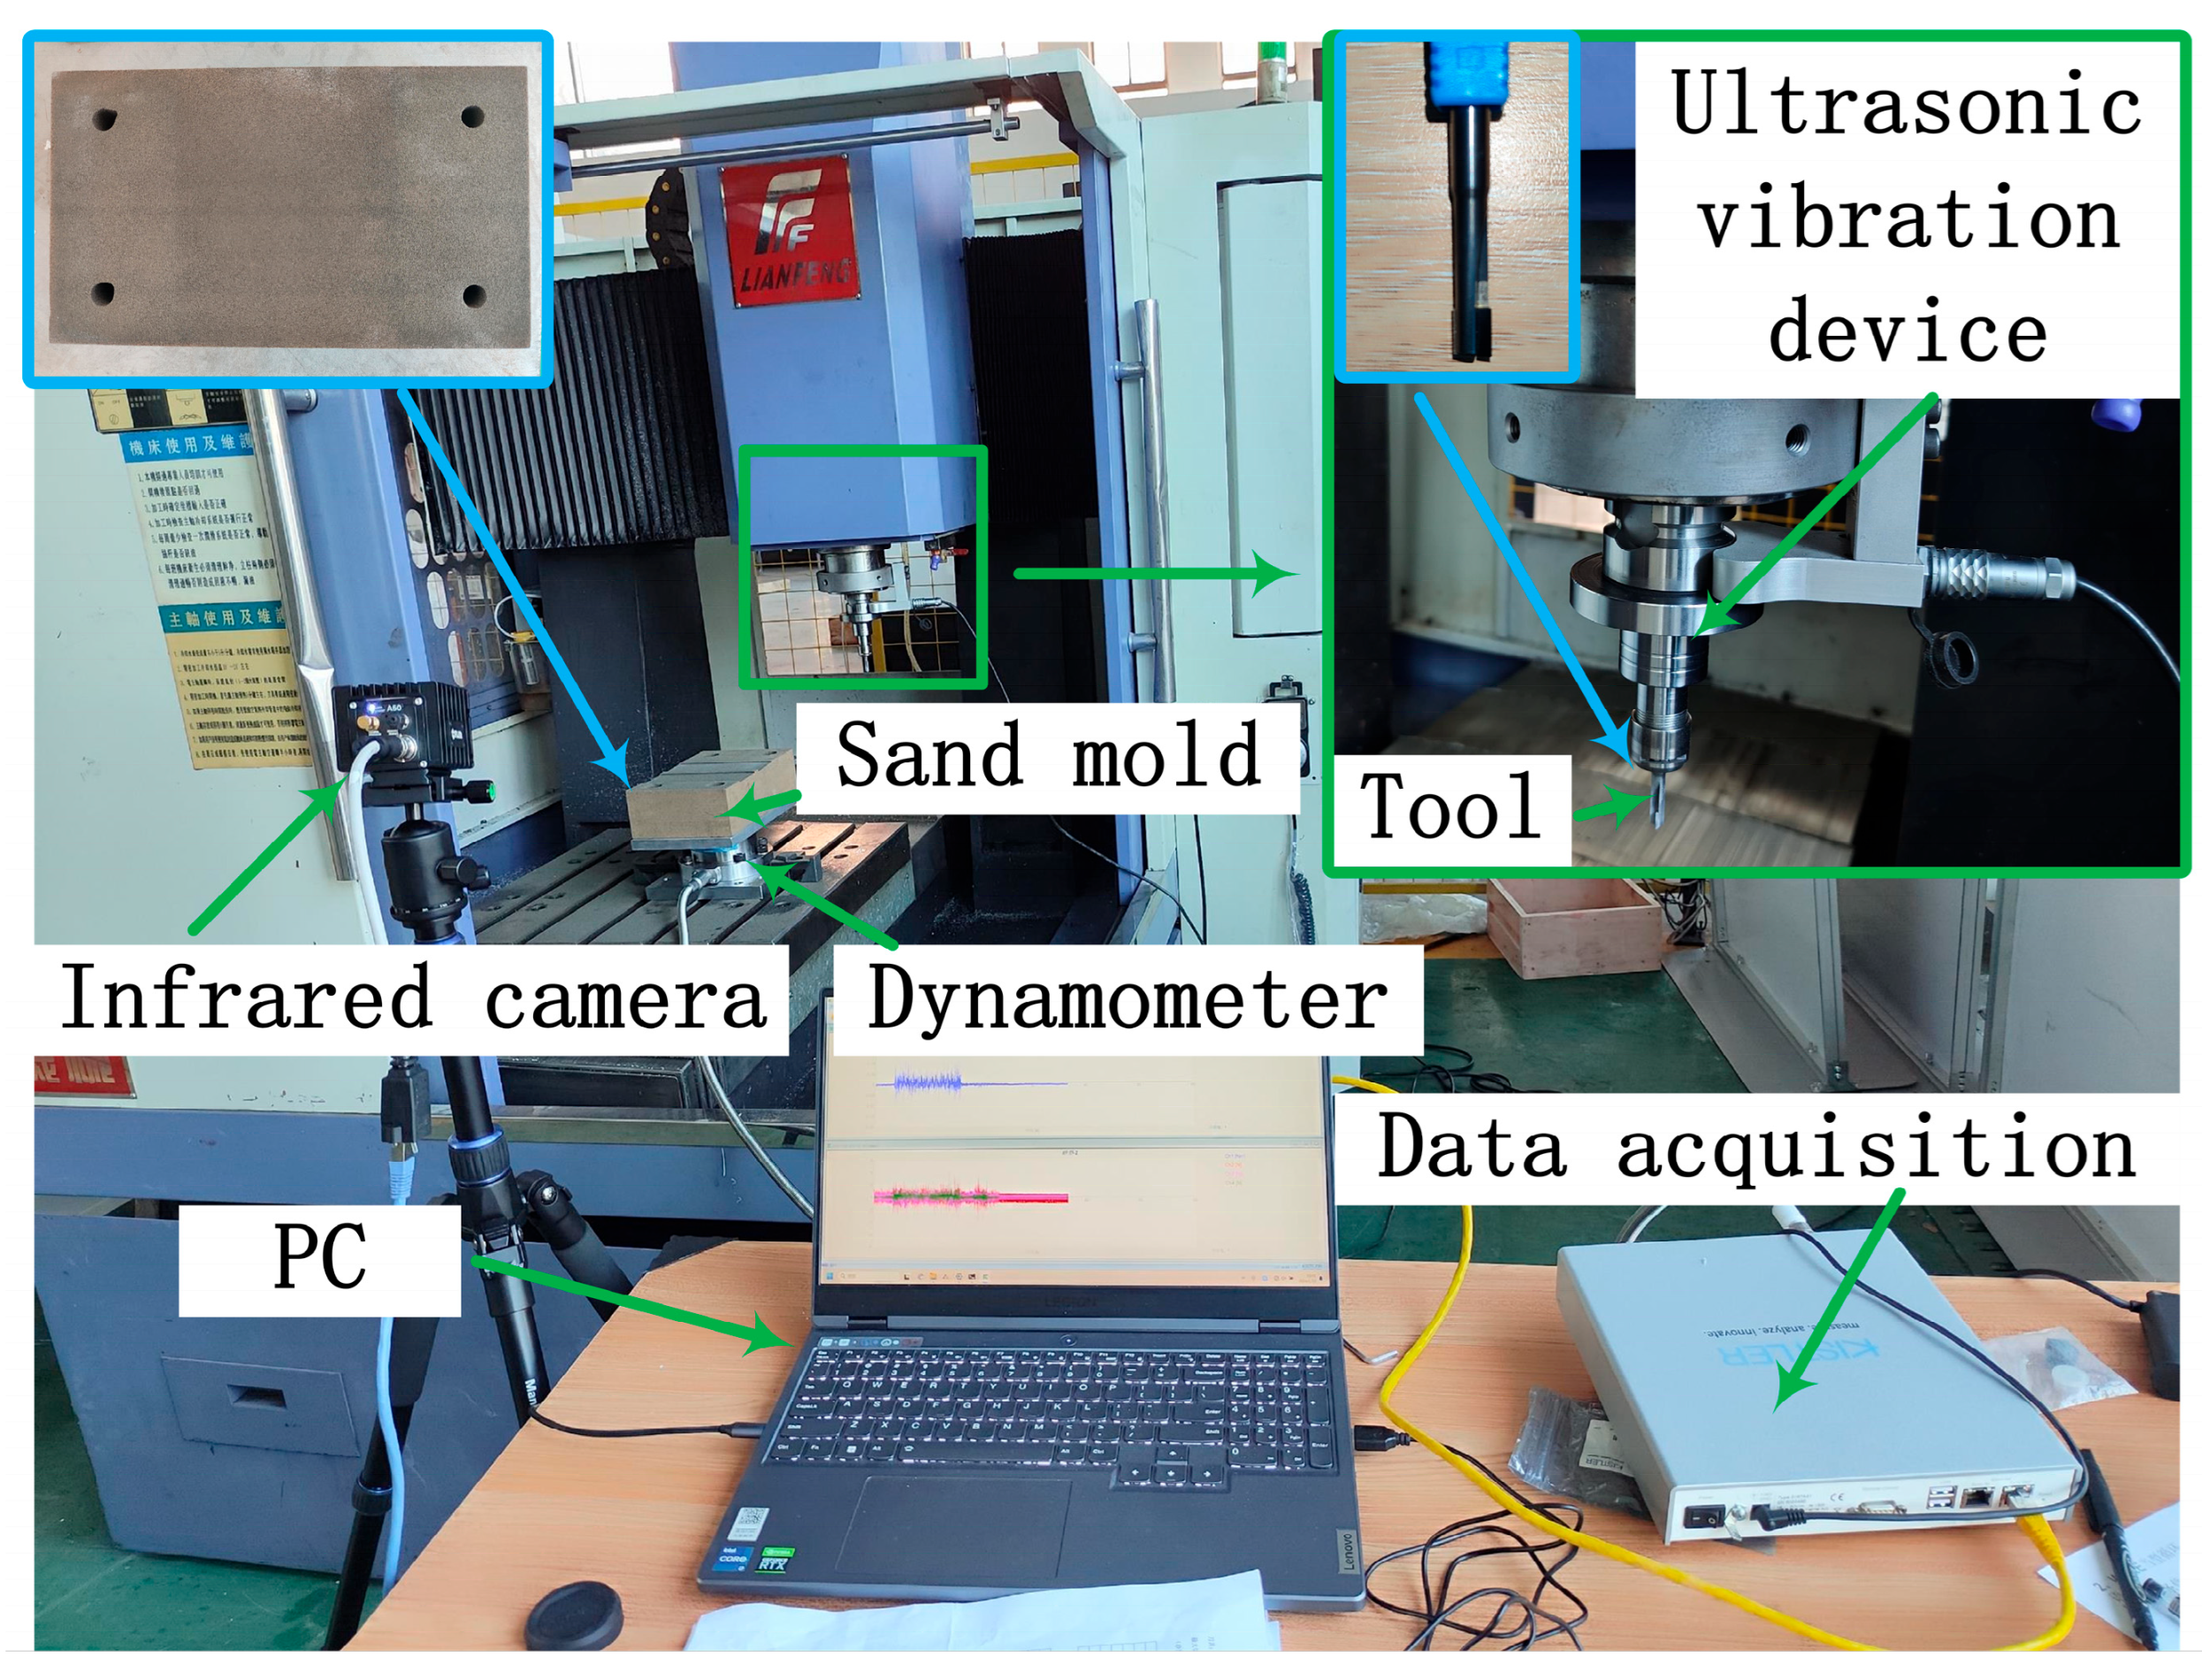
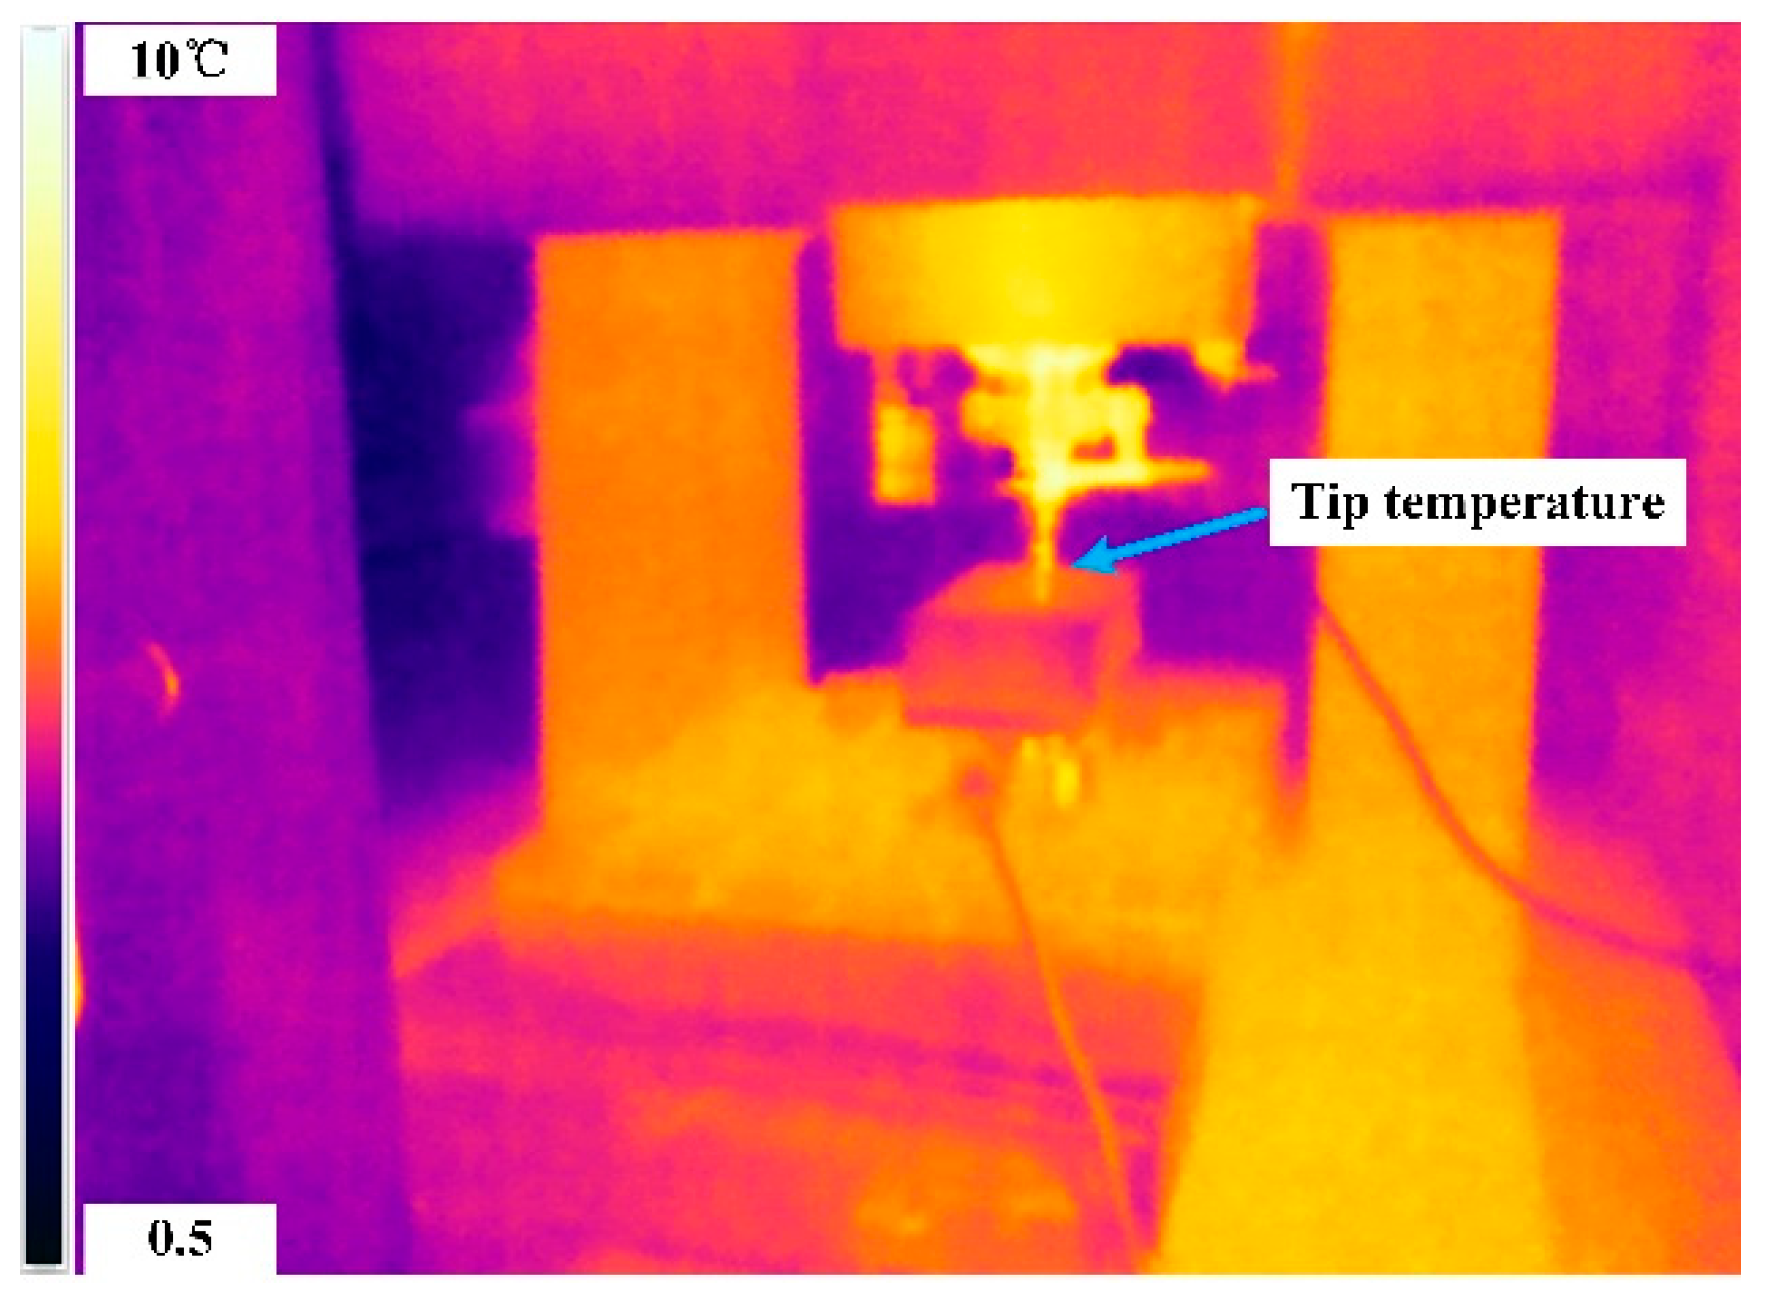
4.1. Experimental Setup and Procedure

To validate the effectiveness of the process and the dynamic milling force model for UM of sand mold, experiments were conducted using a setup as depicted in Figure 8. The resin sand mold was selected as the sand mold material for the experiment, with the particle size of 50/100 mesh (mixed), the resin content of 2.2%, the curing agent content of 0.4%, and the density of 1.381 kg/m3. The experimental tool utilized was An 8 mm straight-tooth double-edged PCD milling cutter, with a rake angle of 0°, blade length of 8 mm, and overall length of 75 mm, was utilized as the experimental tool. The ultrasonic vibration system employed in the experiment had a maximum resonant frequency of 28 kHz, and following tool matching and debugging, the ultrasonic toolholder operated stably at a frequency of 25.8 KHz. The amplitude at the tool tip was measured using a Kathmatic KVD-4525L Doppler laser vibrometer, and the peak-to-peak vibration amplitude of the tool tip was recorded as 2.97 μm. Force data collection was conducted using a Kistler 9257A dynamometer with a signal acquisition frequency of 100 kHz. The experimental environment temperature was maintained at −0.5 °C. Cutting thermal data acquisition was conducted using the Fire A50 thermal imager, with the infrared thermal imaging system calibrated through observation of a blackbody radiation source. The milling results of the sand mold were observed using a Keyence VHX-970 microscope. The sand mold cutting experiment employed reverse milling and was influenced by process parameters such as rotation speed, feed rate, cutting width, and cutting depth. Based on existing literature results, the cutting depth and width were kept constant in this experiment while varying the rotation speed and feed rate. The experimental parameters are summarized in Table 1, with relevant parameters for the dynamic milling force model assigned as shown in Table 2.

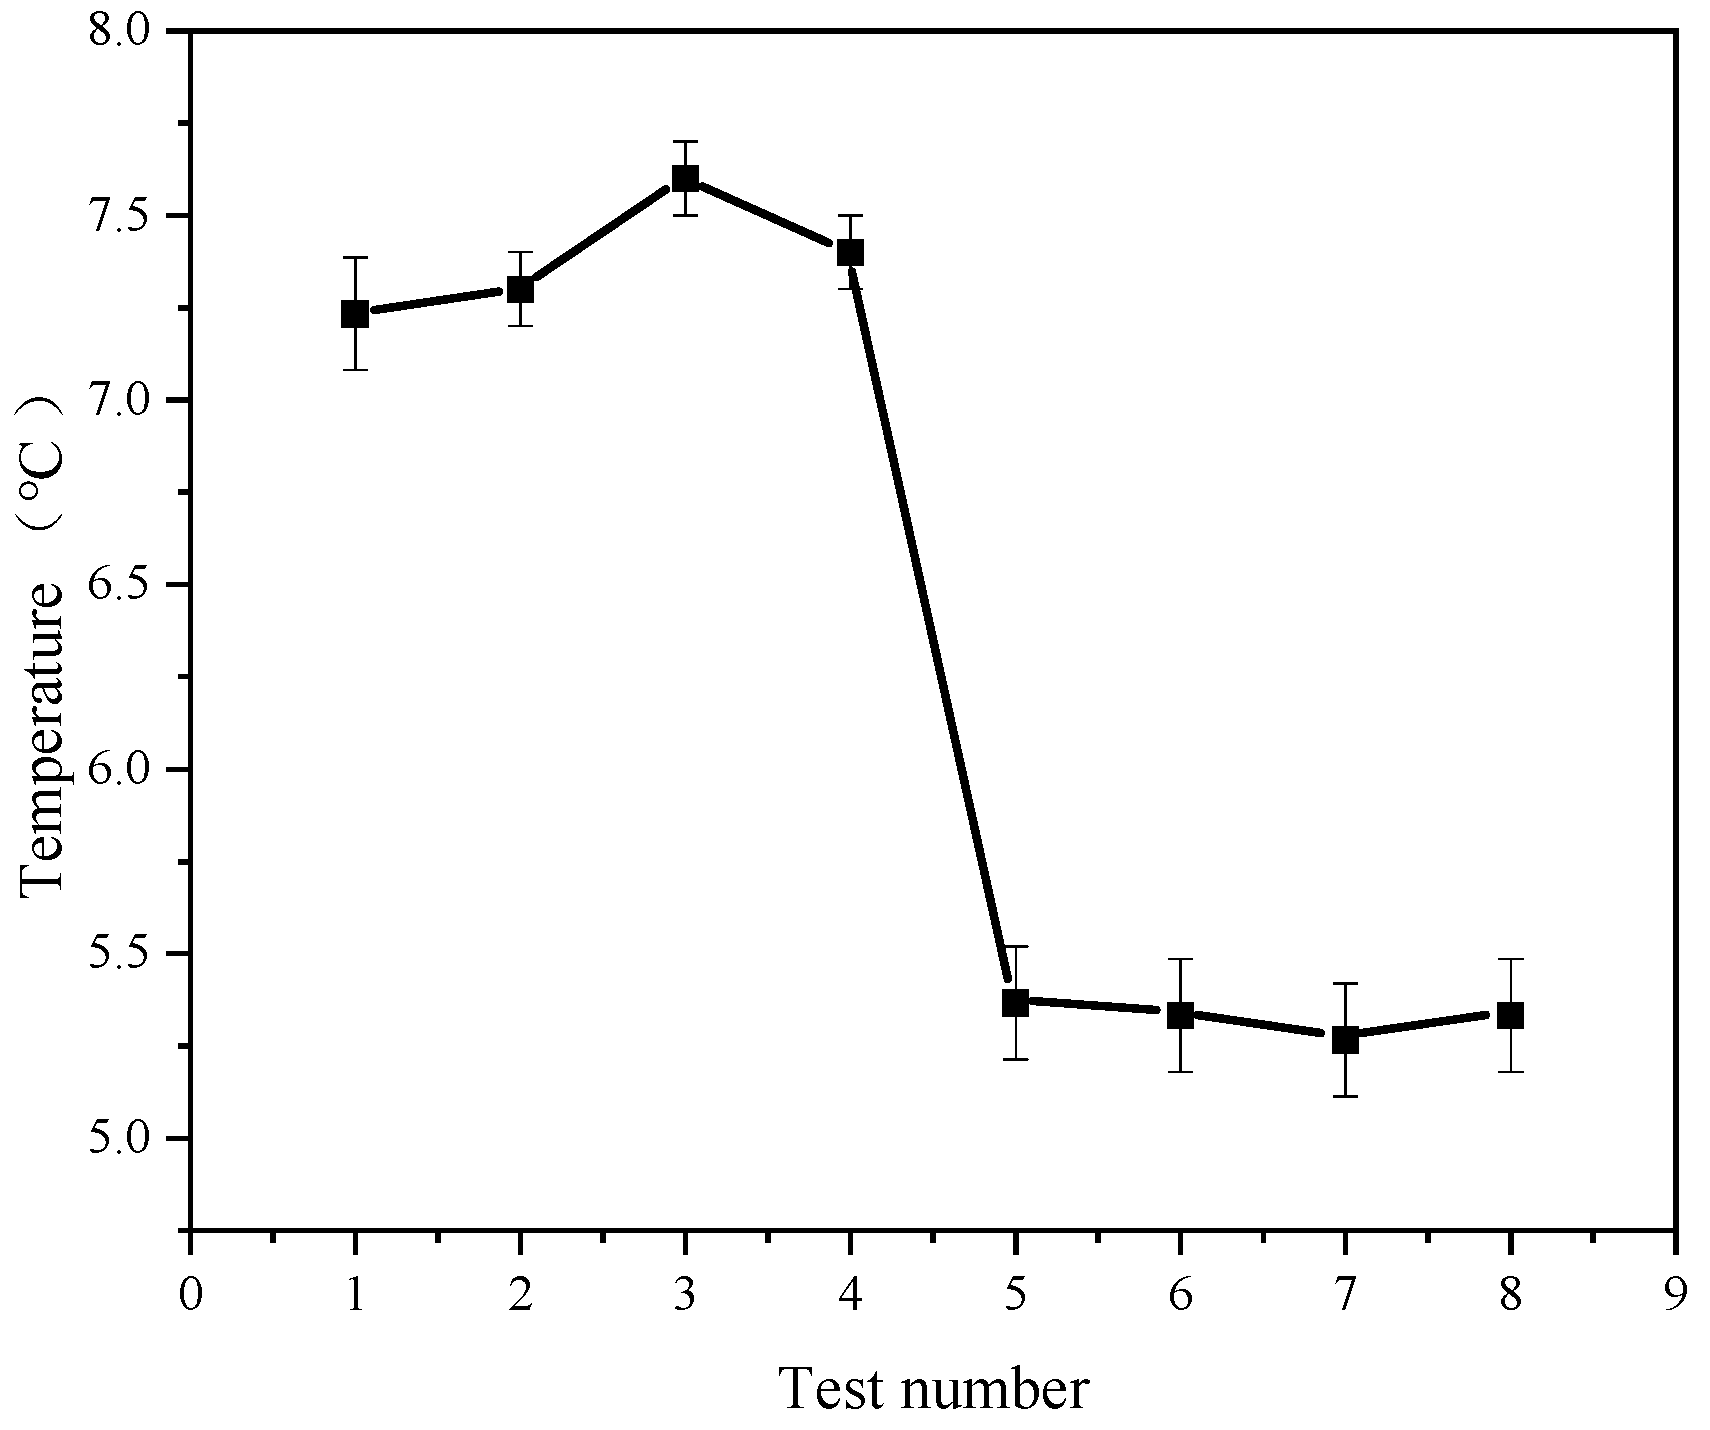
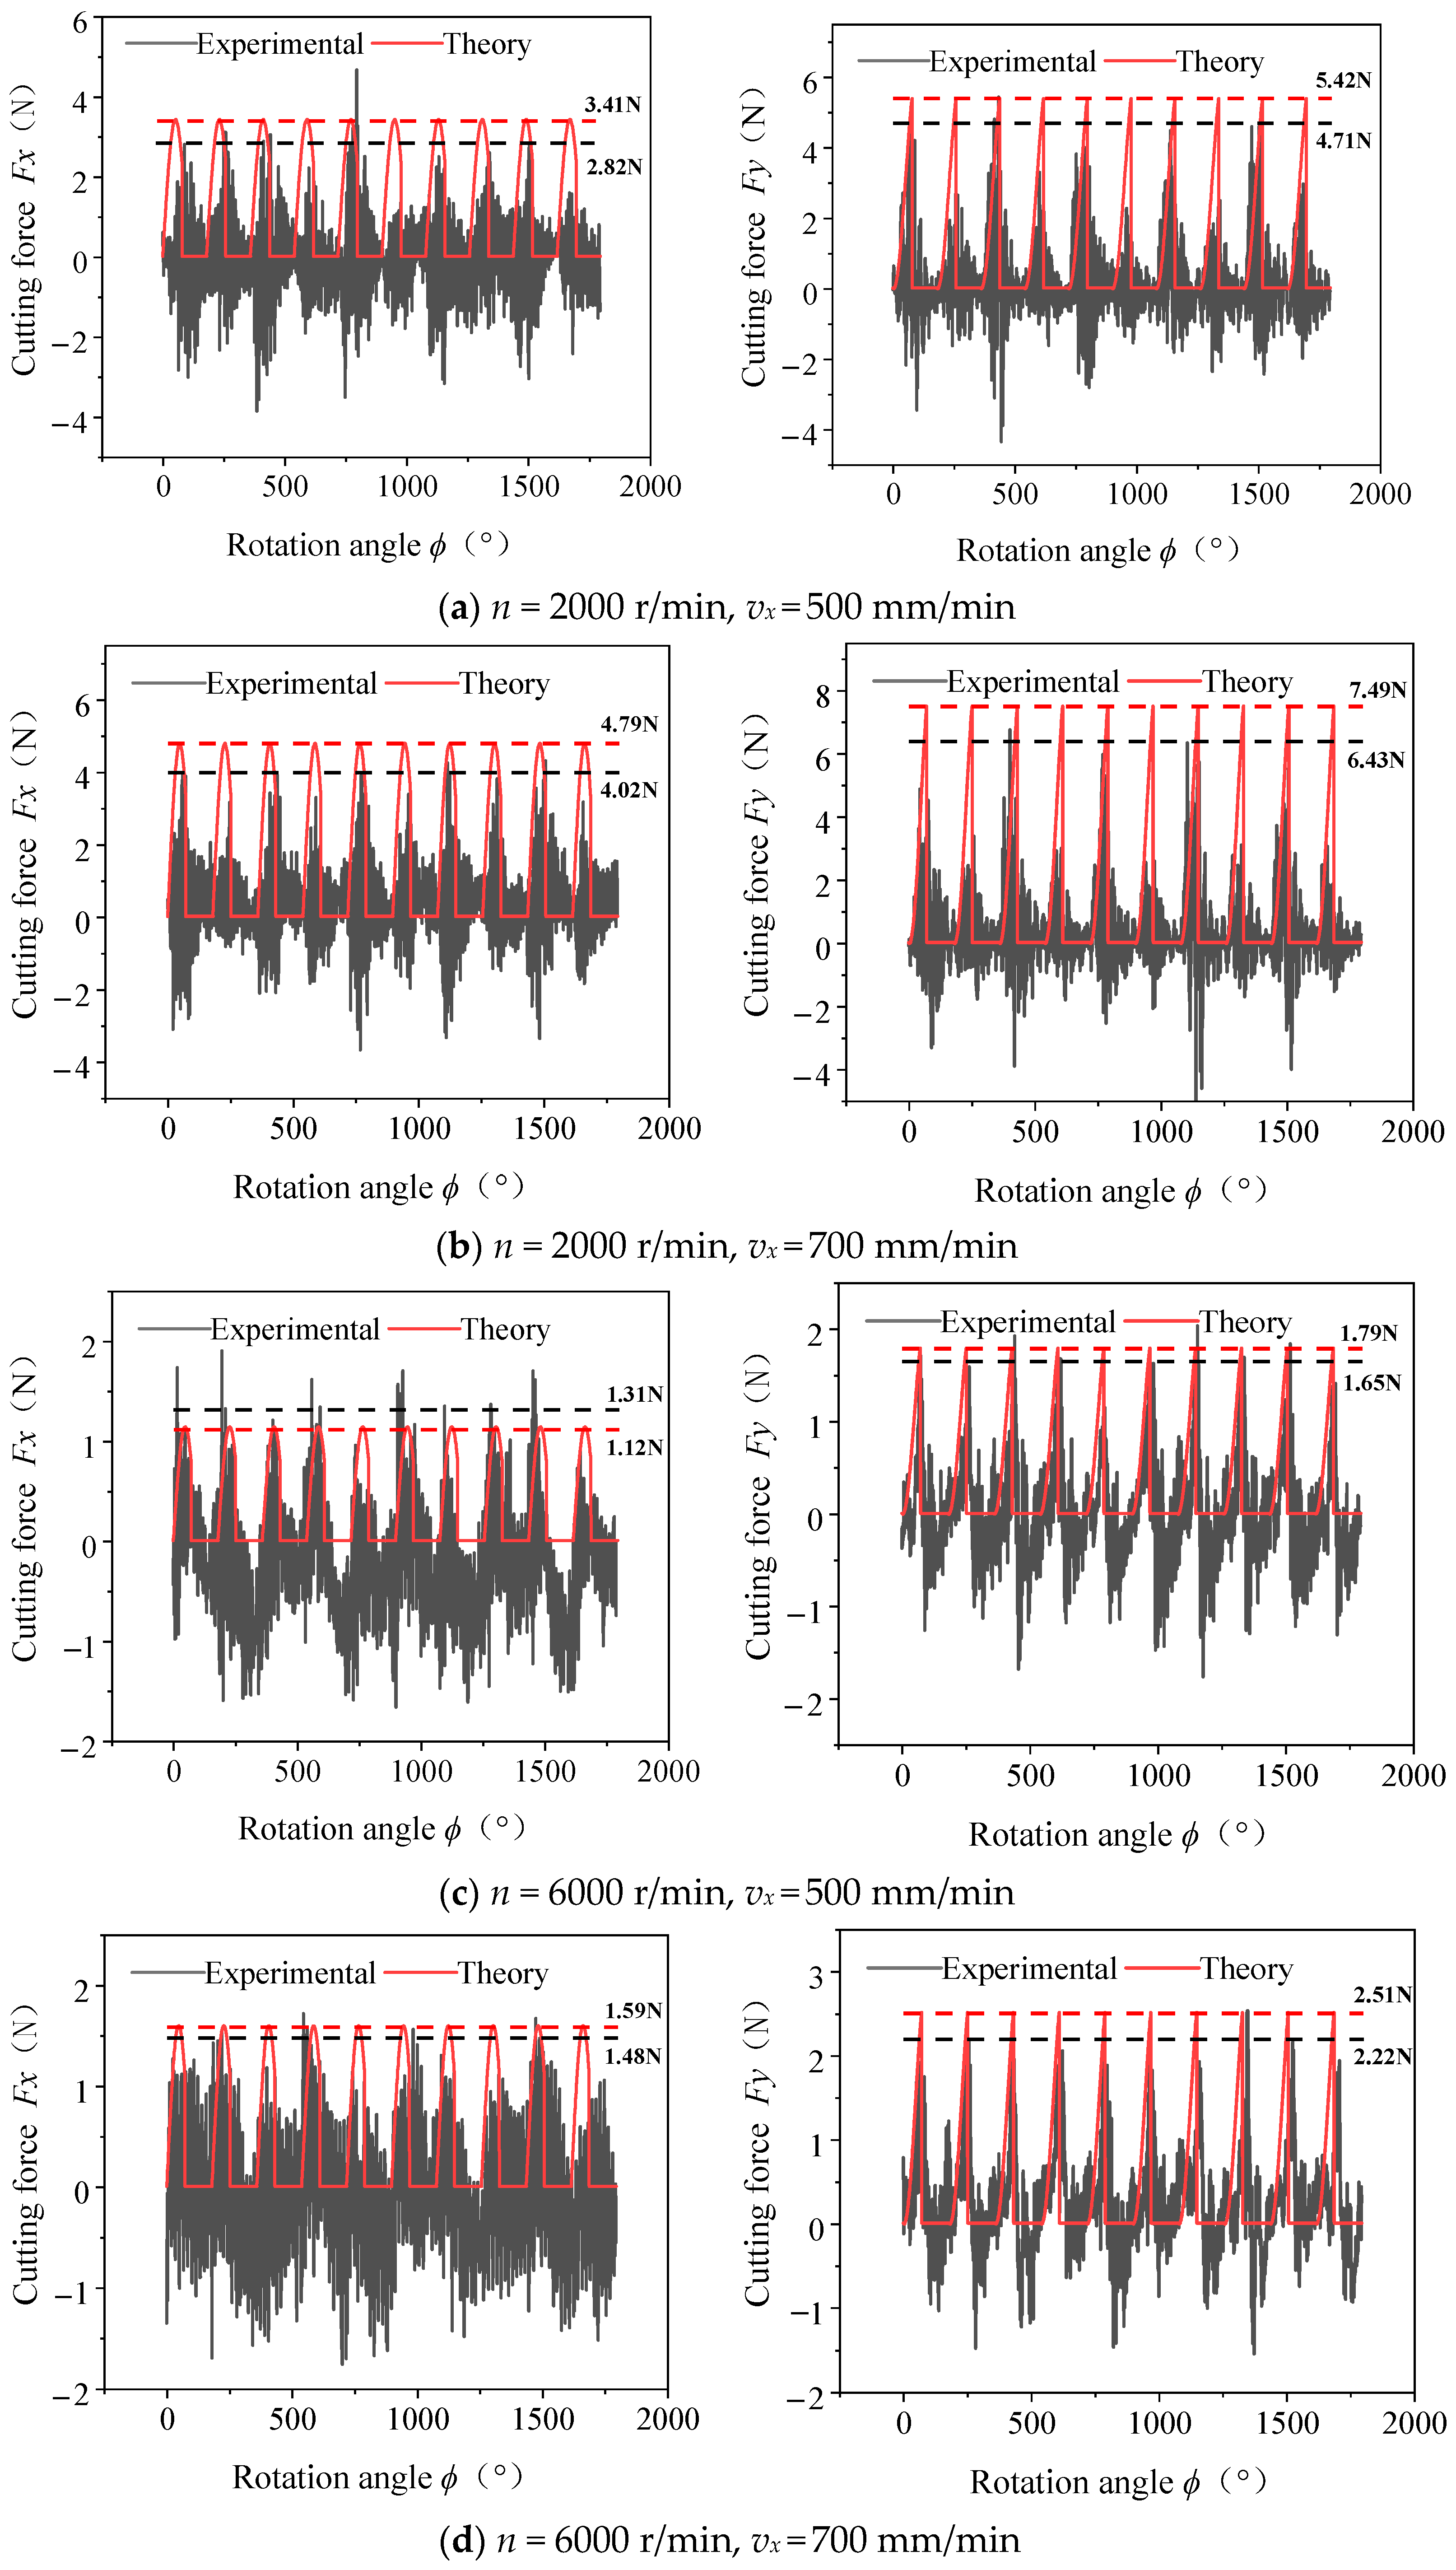
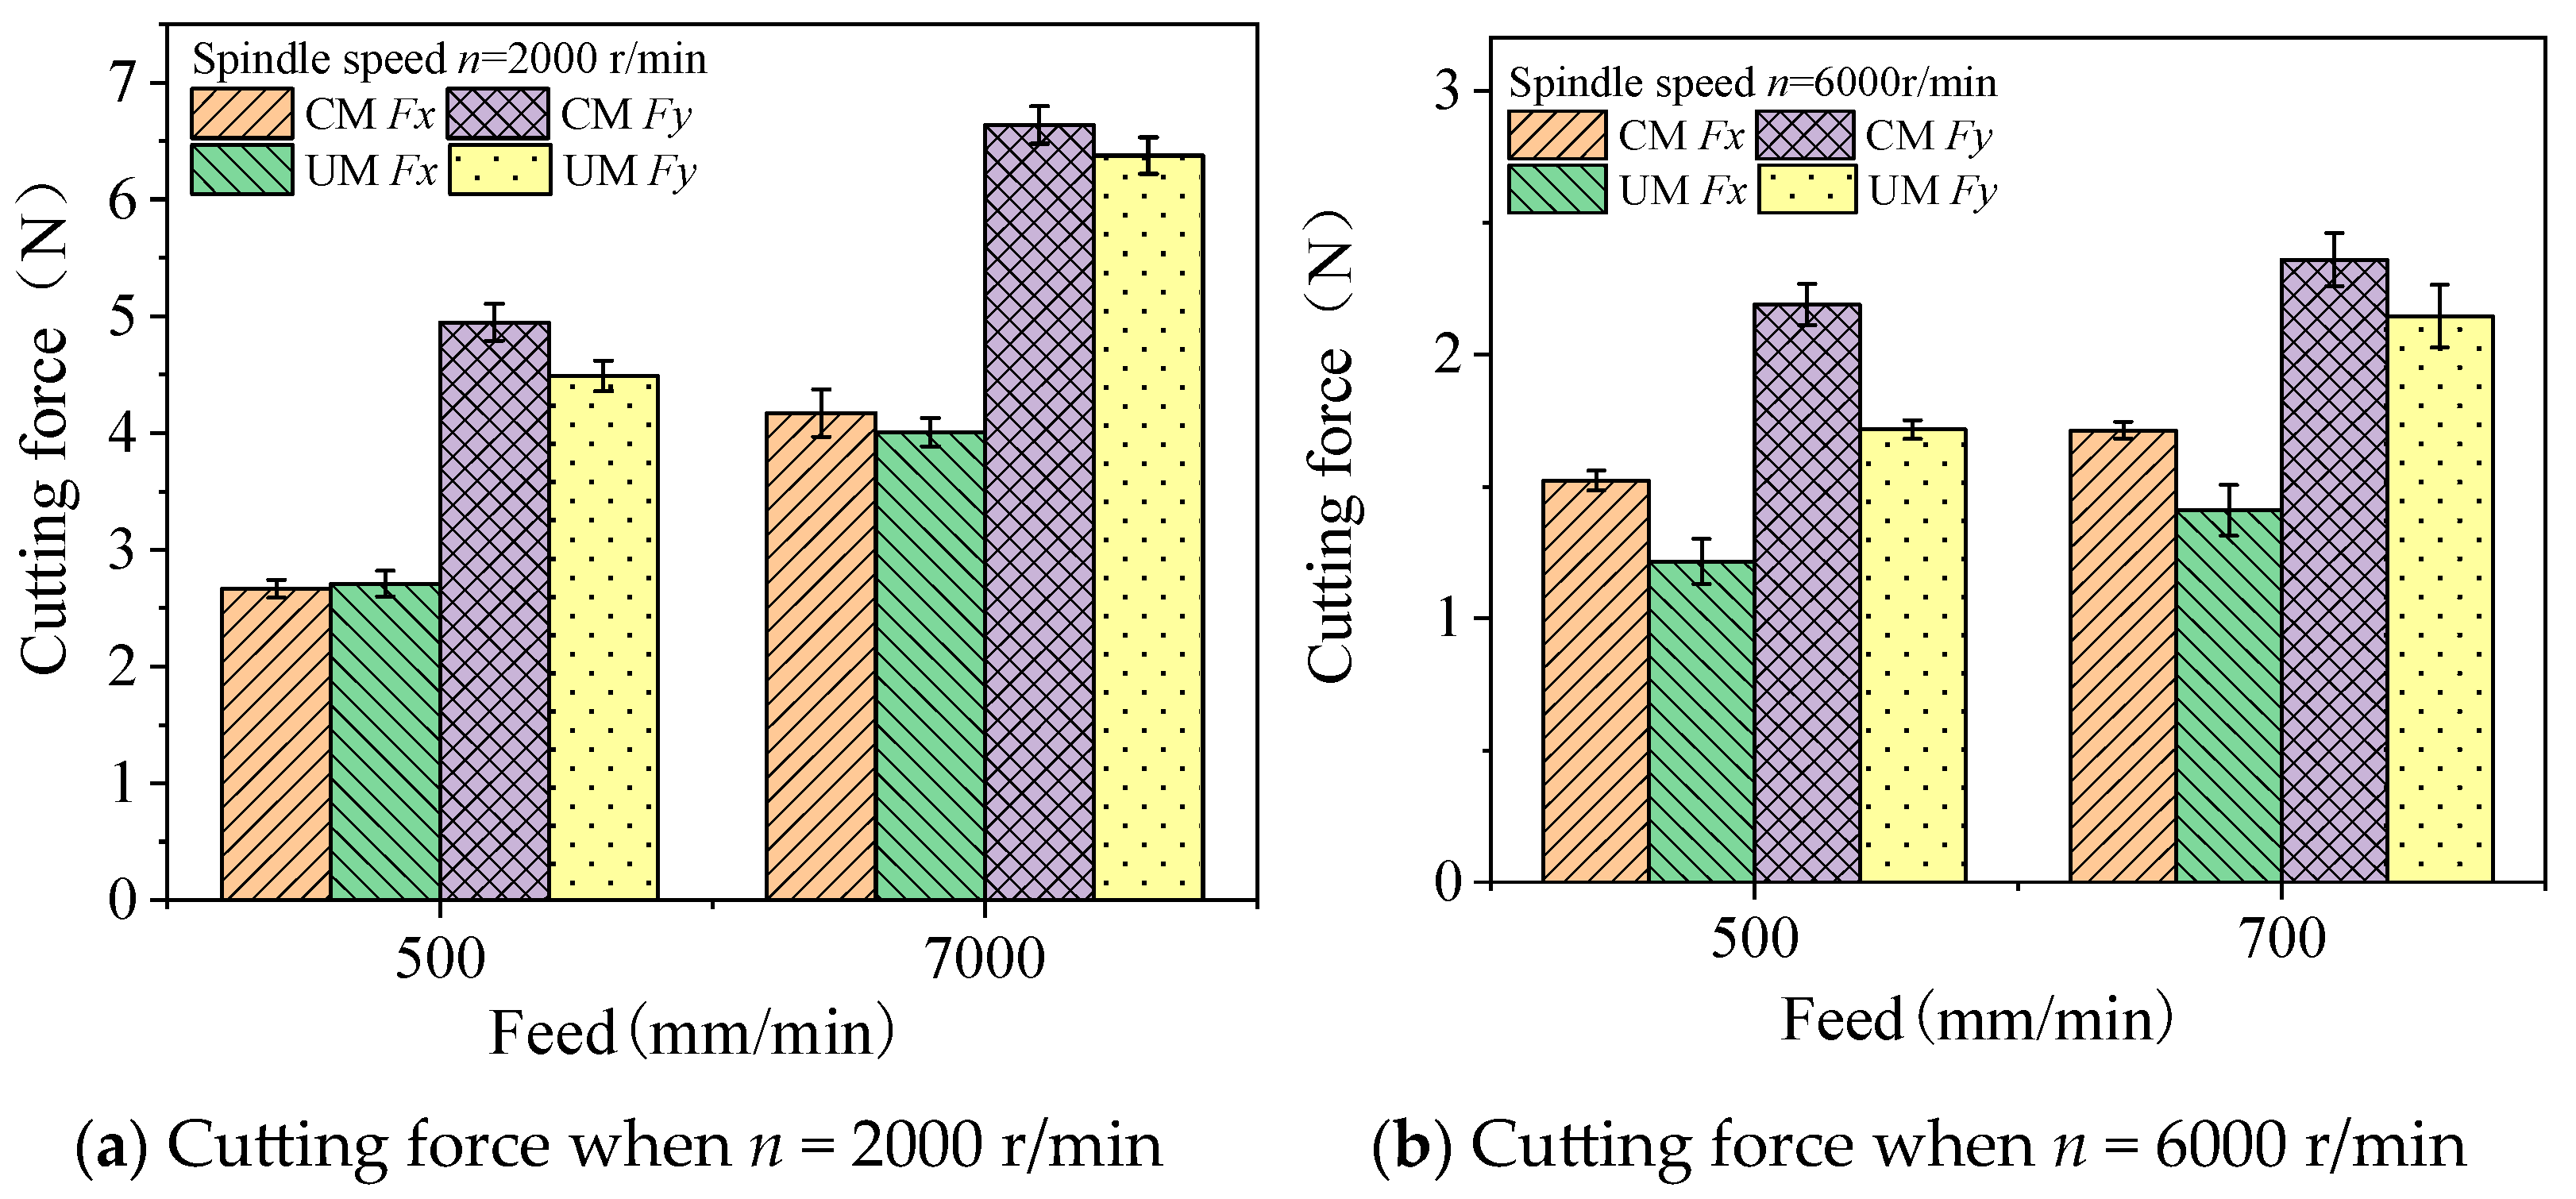
4.2. Analysis of the Milling Force on the Sand Mold

To validate the derived dynamic milling force model, stable periods of milling force signals were selected from the experimental data and subjected to low-pass filtering via the DynoWare analytical software (version 1.0) (Kistler, Winterthur, Switzerland) embedded in the dynamometer system to eliminate external signal interference. During the cutting experiments, the maximum spindle speed was 6000 r/min, with a tool rotation time of 0.010 s per revolution, which is much smaller than the single-point acquisition time of the force sensor (0.0001 s). This ensures that the tool does not experience simultaneous loading on both edges during rotation, guaranteeing that the collected cutting signals represent complete signals of double-edge cutting. Thermographic analysis of the sand mold cutting process was conducted using a thermal imager, as illustrated in Figure 9 and Figure 10. The generated heat predominantly concentrates on the tool holder, with maximum temperatures during machining not exceeding 10 °C and peak temperature fluctuations limited to 2.3 °C. These thermal levels remain significantly below the binder melting point, ensuring no structural alteration of binding bridges. This confirms the applicability of the sand milling process proposed earlier, where the transition from a granular aggregate solid to a granular flowing state occurs, suitable for the solid–liquid constitutive relationship model.
The comparison between the collected Fx and Fy results from the UM experiments and the theoretically predicted values is shown in Figure 11. By analyzing the peak points of the theoretical model and the maximum values recorded by the dynamometer, the cutting force signals collected during tool rotation at 1800° are evaluated. At a spindle speed of 6000 r/min, the theoretical model aligns closely with the experimental measurements, particularly at a feed rate of 700 mm/min, where the Fx cutting force data differ by only 0.11 N (7%). Overall, the results show good consistency. However, at a low rotational speed of 2000 r/min, there exists a certain discrepancy between the theoretical model and experimental test values, where the maximum error of 1.06 N occurs at 700 mm/min, resulting in an error rate of 14.1% between the experimental and model results.
From a broader perspective, both the experimental and theoretical predictions exhibit consistent trends in response to process parameters: cutting forces decrease with increasing spindle speed and decreasing feed rate. The magnitude of predicted and measured forces remains relatively close, with overall errors controlled within 15%. This validates the dynamic milling model’s ability to accurately predict both the trend and magnitude of cutting forces, demonstrating its reliability.
The discrepancies between the model and experimental data arise from the heterogeneous nature of the sand mold material. During machining, collisions between the cutting edge and larger sand particles or regions of higher strength generate localized high cutting forces, leading to non-uniform dynamometer signals. Additionally, previously machined sand particles may impact the tool and workpiece, causing fluctuations in the recorded cutting force signals. The sand mold is also prone to chipping and localized collapse during machining, further amplifying measurement errors. Furthermore, tool impacts, combined with potential inaccuracies in machine tool precision and signal drift in the dynamometer’s measurement system, contribute to deviations in the experimental data.
A comparison of cutting forces between CM and UM is shown in Figure 12. When the rotational speed is 2000 r/min, there is no significant difference in cutting forces between CM and UM; the cutting forces in the Fx direction were nearly identical, while the cutting force in the Fy direction showed a slight reduction of 5%. As the rotational speed increases to 6000 r/min, a distinct contrast emerges in cutting force performance. Ultrasonic machining demonstrates a notable downward trend in cutting forces, with a 19.5% reduction in the Fx direction and a 13.7% decrease in the Fy direction. In absolute terms, the magnitude of force reduction in ultrasonic machining remains relatively modest, showing a decrease of 0.31 N in the Fx direction and 0.5 N in the Fy direction. As the rotational speed increases, the cutting forces of both machining methods decrease. UM achieves better results at high rotational speeds due to reduced cutting resistance on the tool, which decreases the load on the transducer in the ultrasonic system, enhancing its dynamic effect and stability. This also indicates that sand milling should be performed at high rotational speeds.

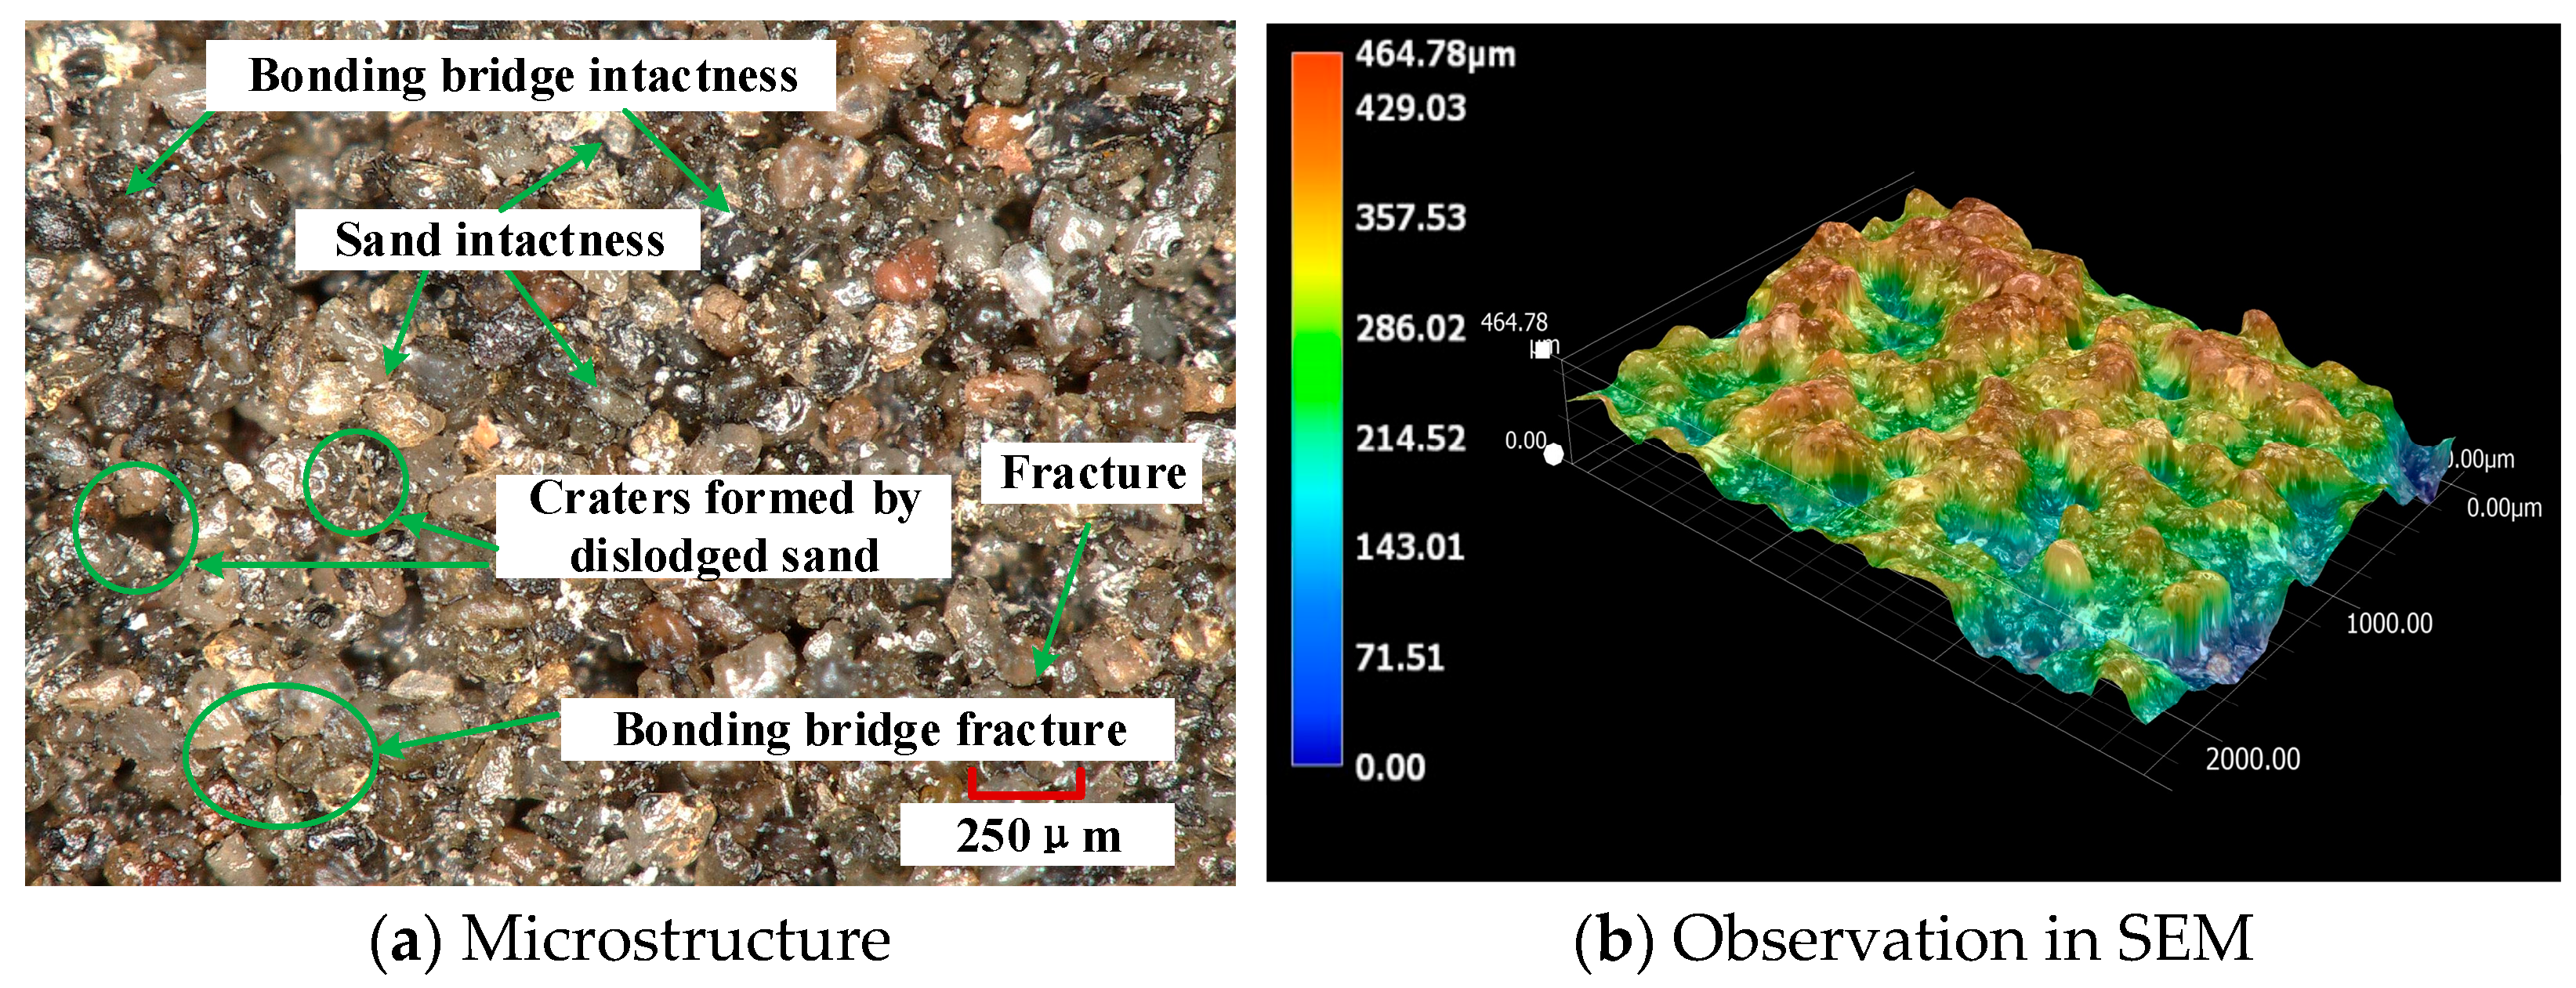
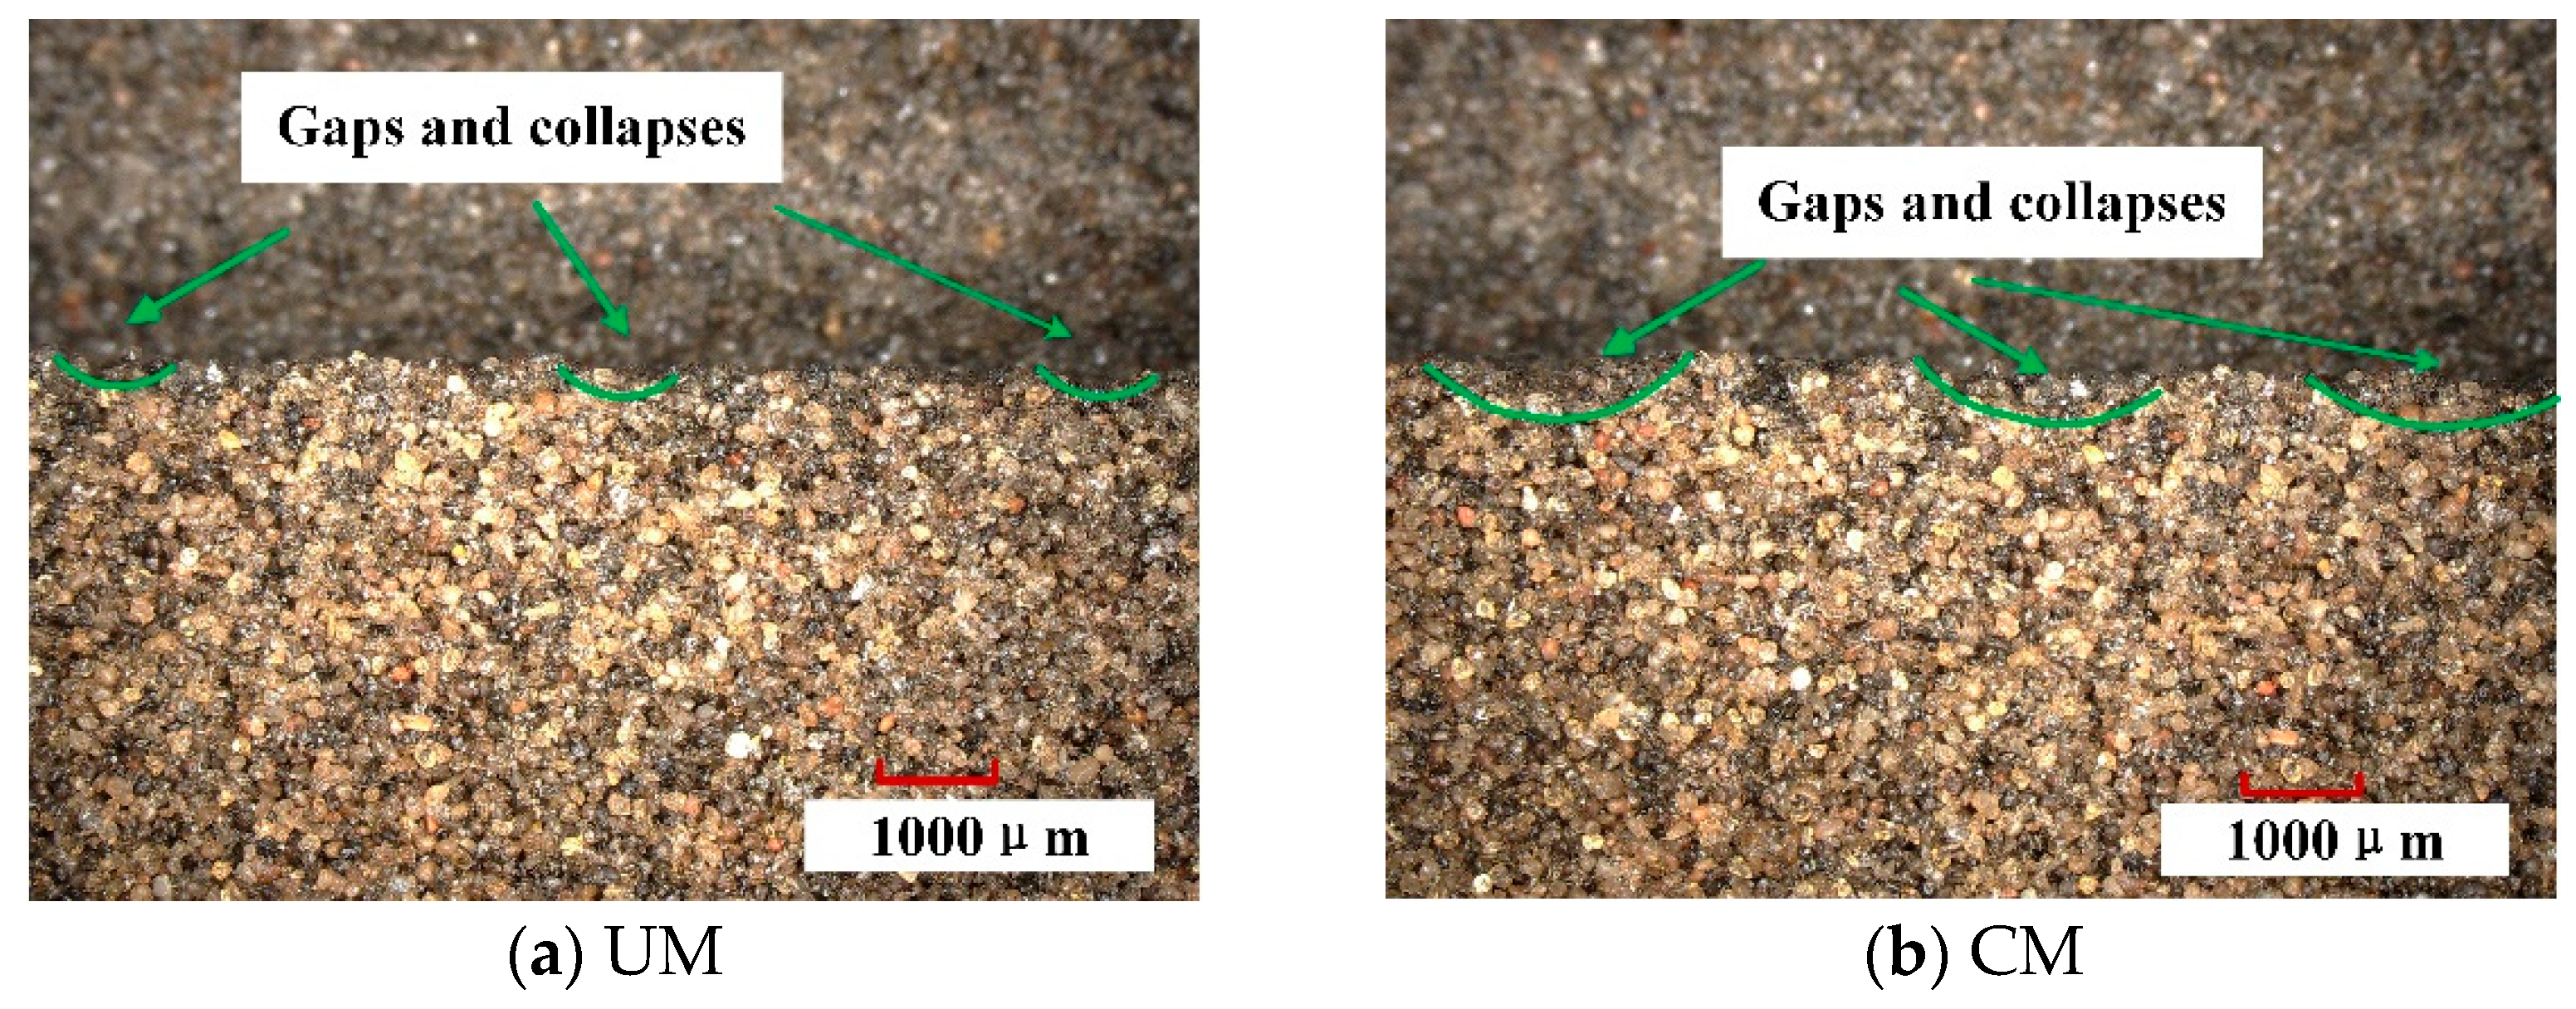
4.3. Analysis of the Microstructure After Milling

The microstructure of the processed sand mold surface is illustrated in Figure 13. As depicted in Figure 13a, the sand grains on the surface of the sand mold remain intact. During the cutting process, while the rigid small sand grains themselves are not compromised, fractures occur within the binder that wraps around them under stress, leading to cracks between adjacent sand grains. Consequently, these cracks facilitate direct detachment of individual sand grains, resulting in pit formation. In other words, it can be attributed to the failure of bonding bridges between adjacent sand grains during the cutting process. Figure 13b demonstrates that after milling, an unevenly distributed and discrete pattern of pits covers the surface of the cut sand mold. This phenomenon arises from a situation where kinetic energy gained by colliding and extruding with a cutting tool surpasses cohesive forces among neighboring sand grains during milling operations. Alternatively, when subjected to higher cutting forces and extrusion pressures, bonding bridges connecting adjacent sand grains rupture, causing their detachment from the surface of the molded material. Moreover, due to certain toughness exhibited by these bonding bridges before complete separation occurs, detached sand grains may slide across processed surfaces, leaving behind pits with varying sizes and thus contributing to a roughened texture characterized by protrusions and concavities.
The microstructure of sand mold surfaces between CM and UM is illustrated in Figure 14. On the sand mold surface, both ultrasonic and conventional machining exhibit distinct cutting marks resulting from the extrusion of the cutting edge. However, in CM, noticeable large-area gaps are observed where sand grains have fallen off, indicating significant damage caused by the machining process. In contrast, the surface processed by UM appears smoother with smaller gaps due to the detachment of sand grains. UM exerts a pronounced impact on the workpiece by accelerating fracture and removal of bonding bridges between sand grains while reducing friction time between the tool and sand mold. Axial vibration enables the refinement of the machined surface by allowing the cutting edge to minimize defects caused by sliding friction arising from the incomplete fracture of bonding bridges between sand grains. This effectively enhances overall machining quality.

5. Conclusions

(1) Compared to CM, kinematic analysis of ultrasonic milling indicates that the introduction of ultrasonic vibration enables the cutting edge to exhibit periodic variable speed and impact cutting effects, facilitating the fracture of bonding bridges between sand grains and improving the removal efficiency of sand mold material.
(2) The instantaneous cutting force model derived based on the constitutive model of solid–liquid transformation effectively predicts the numerical values and trends of cutting forces. In comparison with experimental test results, the consistency between them is good, especially in high-speed cutting at 6000 r/min, where the model predicts cutting force values with an error of less than 15% of the experimental values.
(3) During the sand mold cutting process, cutting forces exhibit a decreasing trend with increasing spindle speed and decreasing feed rate. Superior machining results are achieved at a spindle speed of 6000 r/min. In comparison to CM, UM reduces the cutting force in the Fx direction by 19.5% and in the Fy direction by 13.7%, reducing surface damage to the sand mold and improving machining quality.
(4) The microstructure of the sand mold surface reveals that milling results in the detachment of sand grains, leaving behind a rough texture with unevenly sized pits. In comparison to CM, UM demonstrates the ability to minimize extrusion of the cutting edge on the workpiece surface, thereby suppressing sand mold damage expansion and enhancing overall surface quality.

Author Contributions

Conceptualization, Z.S.; Methodology, B.Z.; Validation, Q.Z.; Formal analysis, B.Z., Z.Z. and D.D.; Investigation, B.Z.; Data curation, B.Z., Z.Z., D.D. and Q.Z.; Writing—original draft, B.Z.; Writing—review & editing, Z.S.; Supervision, Z.S.; Project administration, Z.S.; Funding acquisition, Z.S. All authors have read and agreed to the published version of the manuscript.

Funding

This research was funded by Jiangsu Provincial Department of Science and Technology grant number BE2022106, and funded by Changzhou Science and Technology Bureau grant number CE20220015.

Institutional Review Board Statement

Not applicable.

Informed Consent Statement

Not applicable.

Data Availability Statement

Data are contained within the article.

Acknowledgments

The authors are grateful for the facilities and other support given by the Key R&D Plan of Jiangsu Province (BE2022106) and the Key R&D Plan of Changzhou (CE20220015).

Conflicts of Interest

Authors Bailiang Zhuang, Zhongde Shan, Zhuozhi Zhu, Di Ding and Qi Zhao were employed by the company China Academy of Machinery Science and Technology Group. The remaining authors declare that the research was conducted in the absence of any commercial or financial relationships that could be construed as a potential conflict of interest.

References

  1. Li, K.; Xu, Z.; Zhang, S.; Xiao, W. Research Progress in Sand Casting Process for Titanium Alloy. Spec. Cast. Nonferrous Alloys 2023, 43, 1598–1606. [Google Scholar]
  2. Chen, X. Research on Manufacturing Technology of Die Casting Mold Based on Digital Forming. Master’s Thesis, Dalian University of Technology, Dalian, China, 2019. [Google Scholar]
  3. Xiang, Q.; Zhang, W.; Mao, J.; Qiu, K.; Li, R. Exploration and Practice of Applying the Digital No-Pattern Casting Technology to Produce Art Casting. Foundry Equip. Technol. 2014, 1, 15–18. [Google Scholar]
  4. Xie, D.; Yu, H.; Xu, Z.; Rao, J.; Nie, M.; Liang, X. Effect of NC Milling Process Parameters on Surface Quality of the Coated Sand Mold. Foundry Technol. 2018, 39, 1228–1232. [Google Scholar]
  5. Shan, Z.; Zhu, F. A Model for Predicting Dynamic Cutting Forces in Sand Mould Milling with Orthogonal Cutting. Chin. J. Mech. Eng. 2018, 31, 103. [Google Scholar] [CrossRef]
  6. Shan, Z.; Zhu, F. Wear Mechanism and Prediction Model of Polycrystalline Diamond Tool in Milling Sand Mould. J. Mech. Eng. 2018, 54, 124–132. [Google Scholar] [CrossRef]
  7. Zhang, G.; Shan, Z.; Liu, F.; Liu, L.; Liang, H.; Ming, Y. Influence of Milling Forming Parameters on the Milling Force of Frozen Sand Mold. Foundry Technol. 2023, 44, 665–670. [Google Scholar]
  8. Rao, J.; Xu, Z.; Xie, Y.; Zhao, K.; Nie, M.; Liang, X. Sand Model Milling Force Prediction Calculation and Fracture Surface Analysis. Foundry 2016, 65, 228–232+236. [Google Scholar]
  9. Rizal, S.M.; Suprayitno, S.; Aji, R.Y.P. Parameter Design of Sand Casting to Minimize Shrinkage Defects, Porosity Defects and Incomplete Defects. Mater. Sci. Forum 2024, 11223–11229. [Google Scholar] [CrossRef]
  10. Zhang, D.; Peng, Z.; Geng, D.; Jiang, X.; Liu, Y.; Zhou, Z.; Yin, X. Development of High-Speed Wave-Motion Ultrasonic Machining Technology with High Efficiency and Low Damage. Aeronaut. Manuf. Technol. 2022, 65, 22–33. [Google Scholar]
  11. Asmael, M.; Safaei, B.; Zeeshan, Q.; Zargar, O.; Nuhu, A.A. Ultrasonic Machining of Carbon Fiber-Reinforced Plastic Composites: A Review. Int. J. Adv. Manuf. Technol. 2021, 113, 3079–3120. [Google Scholar] [CrossRef]
  12. Bie, W.; Zhao, B.; Chen, F.; Wang, X.; Zhao, C.; Niu, Y. Progress of Ultrasonic Vibration-Assisted Machining Surface Micro-Texture and Serviceability. Diam. Abras. Eng. 2023, 43, 401–416. [Google Scholar]
  13. Kabir, S.; Ansary, R.S.; Li, Y.; Zhang, M.; Cong, W. Rotary ultrasonic surface machining of silicon: Effects of ultrasonic power and tool rotational speed. Manuf. Lett. 2024, 41, 518–525. [Google Scholar] [CrossRef]
  14. Zhu, S.; Sun, Y.; Wang, F.; Gong, H. Investigation on the Surface Integrity of 40Cr Steel Machined by Rotary Ultrasonic Flank Milling. Micromachines 2024, 15, 189. [Google Scholar] [CrossRef]
  15. Huang, W.; Cao, S.; Li, H.N.; Zhou, Q.; Wu, C.; Zhu, D.; Zhuang, K. Tool Wear in Ultrasonic Vibration-Assisted Drilling of CFRP: A Comparison with Conventional Drilling. Int. J. Adv. Manuf. Technol. 2021, 115, 1809–1820. [Google Scholar] [CrossRef]
  16. Delgado Arroyo, D.; Richter, T.; Schroepfer, D.; Boerner, A.; Rhode, M.; Lindner, T.; Preuß, B.; Lampke, T. Influence of Milling Conditions on AlxCoCrFeNiMoy Multi-Principal-Element Alloys. Coatings 2023, 13, 662. [Google Scholar] [CrossRef]
  17. Potyondy, D.O.; Cundall, P.A. A bonded-particle model for rock. Int. J. Rock Mech. Min. Sci. 2004, 41, 1329–1364. [Google Scholar] [CrossRef]
  18. Kazerani, T.; Zhao, J. Micromechanical parameters in bonded particle method for modelling of brittle material failure. Int. J. Numer. Anal. Methods Geomech. 2010, 34, 1877–1895. [Google Scholar] [CrossRef]
  19. Wang, G.; Xiong, G.; Fang, H. General Ontological Relationships for Particle Flow. Sci. China 1998, 28, 282–288. [Google Scholar]
  20. Zhang, D.Z.; Rauenzahn, R.M. Stress Relaxation in Dense and Slow Granular Flows. J. Rheol. 2000, 44, 1019–1041. [Google Scholar] [CrossRef]
  21. Zhang, K.; Liu, S. Soil Mechanics; China Architecture & Building Press: Beijing, China, 2001. [Google Scholar]
  22. Astakhov, V.P.; Osman, M.O.M.; Hayajneh, M.T. Re-evaluation of the Basic Mechanics of Orthogonal Metal Cutting: Velocity Diagram, Virtual Work Equation and Upper-Bound Theorem. Int. J. Mach. Tools Manuf. 2001, 41, 393–418. [Google Scholar] [CrossRef]
  23. Pu, X. Physical Simulation and Process Parameter Optimization of Nickel Base Superalloy Cutting. Master’s Thesis, Southwest Petroleum University, Chengdu, China, 2016. [Google Scholar]
  24. Hou, M.; Shan, Z.; Dong, X.; Ding, B. Prediction of Sand Mold Cutting Force and Identification of Cutting Force Coefficients. J. Phys. Conf. Ser. 2021, 1885, 042002. [Google Scholar]
Figure 1. The mechanism of sand mold UM.
Coatings 15 00633 g001
Figure 2. The motion trajectory of the cutting edge.
Coatings 15 00633 g002
Figure 3. The variation in the cutting edge’s velocity.
Coatings 15 00633 g003
Figure 4. The variation in the cutting edge’s acceleration.
Coatings 15 00633 g004
Figure 5. Sand mold chip micrograph.
Coatings 15 00633 g005
Figure 6. Reverse milling using ultrasonic on sand mold.
Coatings 15 00633 g006
Figure 7. Model of unequal shear zone in sand mold.
Coatings 15 00633 g007
Figure 8. Experimental platform for sand mold UM.
Coatings 15 00633 g008
Figure 9. Infrared thermogram.
Coatings 15 00633 g009
Figure 10. Thermal variation diagram.
Coatings 15 00633 g010
Figure 11. Dynamic milling force between the experimental data and the model in UM.
Coatings 15 00633 g011
Figure 12. Comparison of cutting force changes.
Coatings 15 00633 g012
Figure 13. The microstructure of sand mold at the sensor after milling.
Coatings 15 00633 g013
Figure 14. Surface morphology between UM and CM.
Coatings 15 00633 g014
Table 1. Experimental parameters.
NumberSpeedFeedCutDepthUltrasonic
(r/min)(mm/min)(mm)(mm)Open
1200050032.5Yes
2200050032.5No
3200070032.5Yes
4200070032.5No
5600050032.5Yes
6600050032.5No
7600070032.5Yes
8600070032.5No
Table 2. Parameters for the dynamic milling force model [5,19,24].
NumberParametersAssignmentNumberParametersAssignment
1kp10.4487d0.3 mm
2kp20.328σs12 MPa
3kτ10.2249Cv0.64
4kτ20.19210Cn0.028
5g9.8 m/s211ϕ026.5°
6β10°12 γ00
Disclaimer/Publisher’s Note: The statements, opinions and data contained in all publications are solely those of the individual author(s) and contributor(s) and not of MDPI and/or the editor(s). MDPI and/or the editor(s) disclaim responsibility for any injury to people or property resulting from any ideas, methods, instructions or products referred to in the content.

