Article

Research on the Influence of Surface Defects Under the Influence of Rail Corrosion on the Fatigue Damage of Wheel Rolling Contact

1
School of Materials Science and Engineering, East China Jiaotong University, Nanchang 330013, China
2
School of Transportation Engineering, East China Jiaotong University, Nanchang 330013, China
3
Network & Information Center, East China Jiaotong University, Nanchang 330013, China
4
Railway Industry Key Laboratory of Intelligent Operation and Maintenance of Rolling Stock, East China Jiaotong University, Nanchang 330013, China
*
Author to whom correspondence should be addressed.
Coatings 2025, 15(5), 589; https://doi.org/10.3390/coatings15050589
Submission received: 30 March 2025 / Revised: 7 May 2025 / Accepted: 14 May 2025 / Published: 15 May 2025
(This article belongs to the Special Issue Advancements in Surface Engineering, Coatings and Tribology)

Abstract

:
Heavy rolling contact fatigue (RCF) may be caused by wheel surface defects under the influence of rail corrosion, which threatens the operational safety of rail vehicles. To investigate the role of surface defects on wheel RCF damage under the influence of rail corrosion, a salt spray tester was used to corrode the rails, an impact testing machine was employed to create surface defects, and RCF tests were completed. The role of surface defects on wheel RCF damage was studied by monitoring the wheel defect surface and cross-section. The results indicate that the tendencies of the RCF crack extension of surface defects of different sizes are similar, and they all extend in a C-shape along the tangential force direction. However, the larger the defect size, the later the crack is initiated. The leading edge material is continuously squeezed into the defect by the tangential force, and a larger plastic deformation layer is formed, which causes the RCF at the leading edge to crack more severely. Meanwhile, under the effect of combined normal force and shear stress, the leading edge crack intersects with the middle edge crack, and the leading edge material is spalled off first. Wheel RCF damage and wear are aggravated by rail corrosion, the longer the corrosion time, the more serious the RCF damage and wear, and the earlier the material spalling time, the lower the fatigue life.

1. Introduction

RCF damage due to the periodic rolling contact of the wheel tread with the rail is a common form of damage during wheel–rail operation [1,2]. In particular, in order to address the growing need for faster and higher-capacity rail transport, advancements in both heavy-haul and high-speed rails have progressed significantly, and this mode of damage has become more and more common [3,4]. It may pose risks to railway operations and compromise the comfort of passengers [5].
The most common failure mode for mechanical parts due to rolling contact fatigue is surface failure [6]. Surface defects due to external hard objects (e.g., ballasting by rolling stock, cargo falling from rolling stock, etc.) during the wheel–rail rolling contact process can easily become stress generation points and subsequent failure nucleation points. Therefore, they may be the cause of RCF crack initiation [7,8]. To study the role of surface defects on wheel–rail material interaction, the rolling fatigue behavior of defective wheels and rails has been investigated in detail by a number of investigators. Gao et al. [9,10] found that defects of different shapes have different degrees of influence on rolling fatigue life. Rolling fatigue life was significantly affected by conical and pyramidal defects, but was basically not affected by linear indentations. This might be because higher shear stress would be induced by the convex indentation shoulders of conical and pyramidal defects and promote fatigue cracking, while no obvious convex indentation shoulders were found around linear indentations. Seo et al. [11] noted that RCF cracks initiate and spread only when the dent attains a particular magnitude. They also found that the material RCF life of the dent middle edge is shorter compared to that at the trailing edge and leading edge. Zhao et al. [12] further emphasized that small spherical dents had no significant impact on the RCF, and would be gradually eliminated under the effect of wear. To identify the defect size threshold influencing RCF life, the specimen size and the width of the wheel–rail contact line were determined by Zeng et al. [13] and, according to the wheel–rail size recorded in the field, the proportional coefficient between the sample and the actual wheel–rail size was considered [14,15] and RCF experiments on wheels with surface defects of different sizes were carried out. The defect size threshold influencing the RCF lifespan of the wheel sample was measured to be 2–4 mm, which is similar to the field observations by Zhao et al. [16].
With the advancement of computer hardware, wheel–rail rolling fatigue life and wear behavior have been studied extensively by many researchers through numerical methods. Innocenti et al. [17] developed a model for complex railway networks that was employed to assess changes in wheel–rail profiles caused by wear and predict wheel–rail service life. Zeng et al. [13] established a defective wheel–rail proportional size finite element simulation model and found that the edge contact stress increased with surface defects. The role of defect size on the RCF life change of pre-rolled wheel steel can be predicted by FS multi-axial fatigue parameters combined with TCD. Daves et al. [18] created a multiscale model to analyze deformation near the rail surface during wheel–rail rolling–sliding contact, incorporating the stick–slip behavior of the interaction and predicting the crack extension direction. Taraf et al. [19] found through numerical methods that low friction coefficients or surface defects may be the causes of deep subsurface fatigue crack initiation.
Furthermore, the role of surface defects on the RCF of wheel–rail systems in third-medium environments (e.g., lubricant, water) has also been investigated by researchers [20,21]. However, there are few reports about the role of surface defects under rail corrosion on wheel RCF damage. Since the railway service environment is open, rails usually need to operate under harsh natural conditions such as rain, fog, frost, and snow, and are easily corroded. Thus, it is essential to investigate the role of surface defects under rail corrosion on wheel RCF damage. In this study, a precision salt spray tester was used to treat the rail disc for corrosion, and RCF tests were completed together with wheels with surface defects. The defect surface and cross-section were observed to study the role of surface defects under rail corrosion on the RCF damage of wheels.

2. Experimental Methods and Details

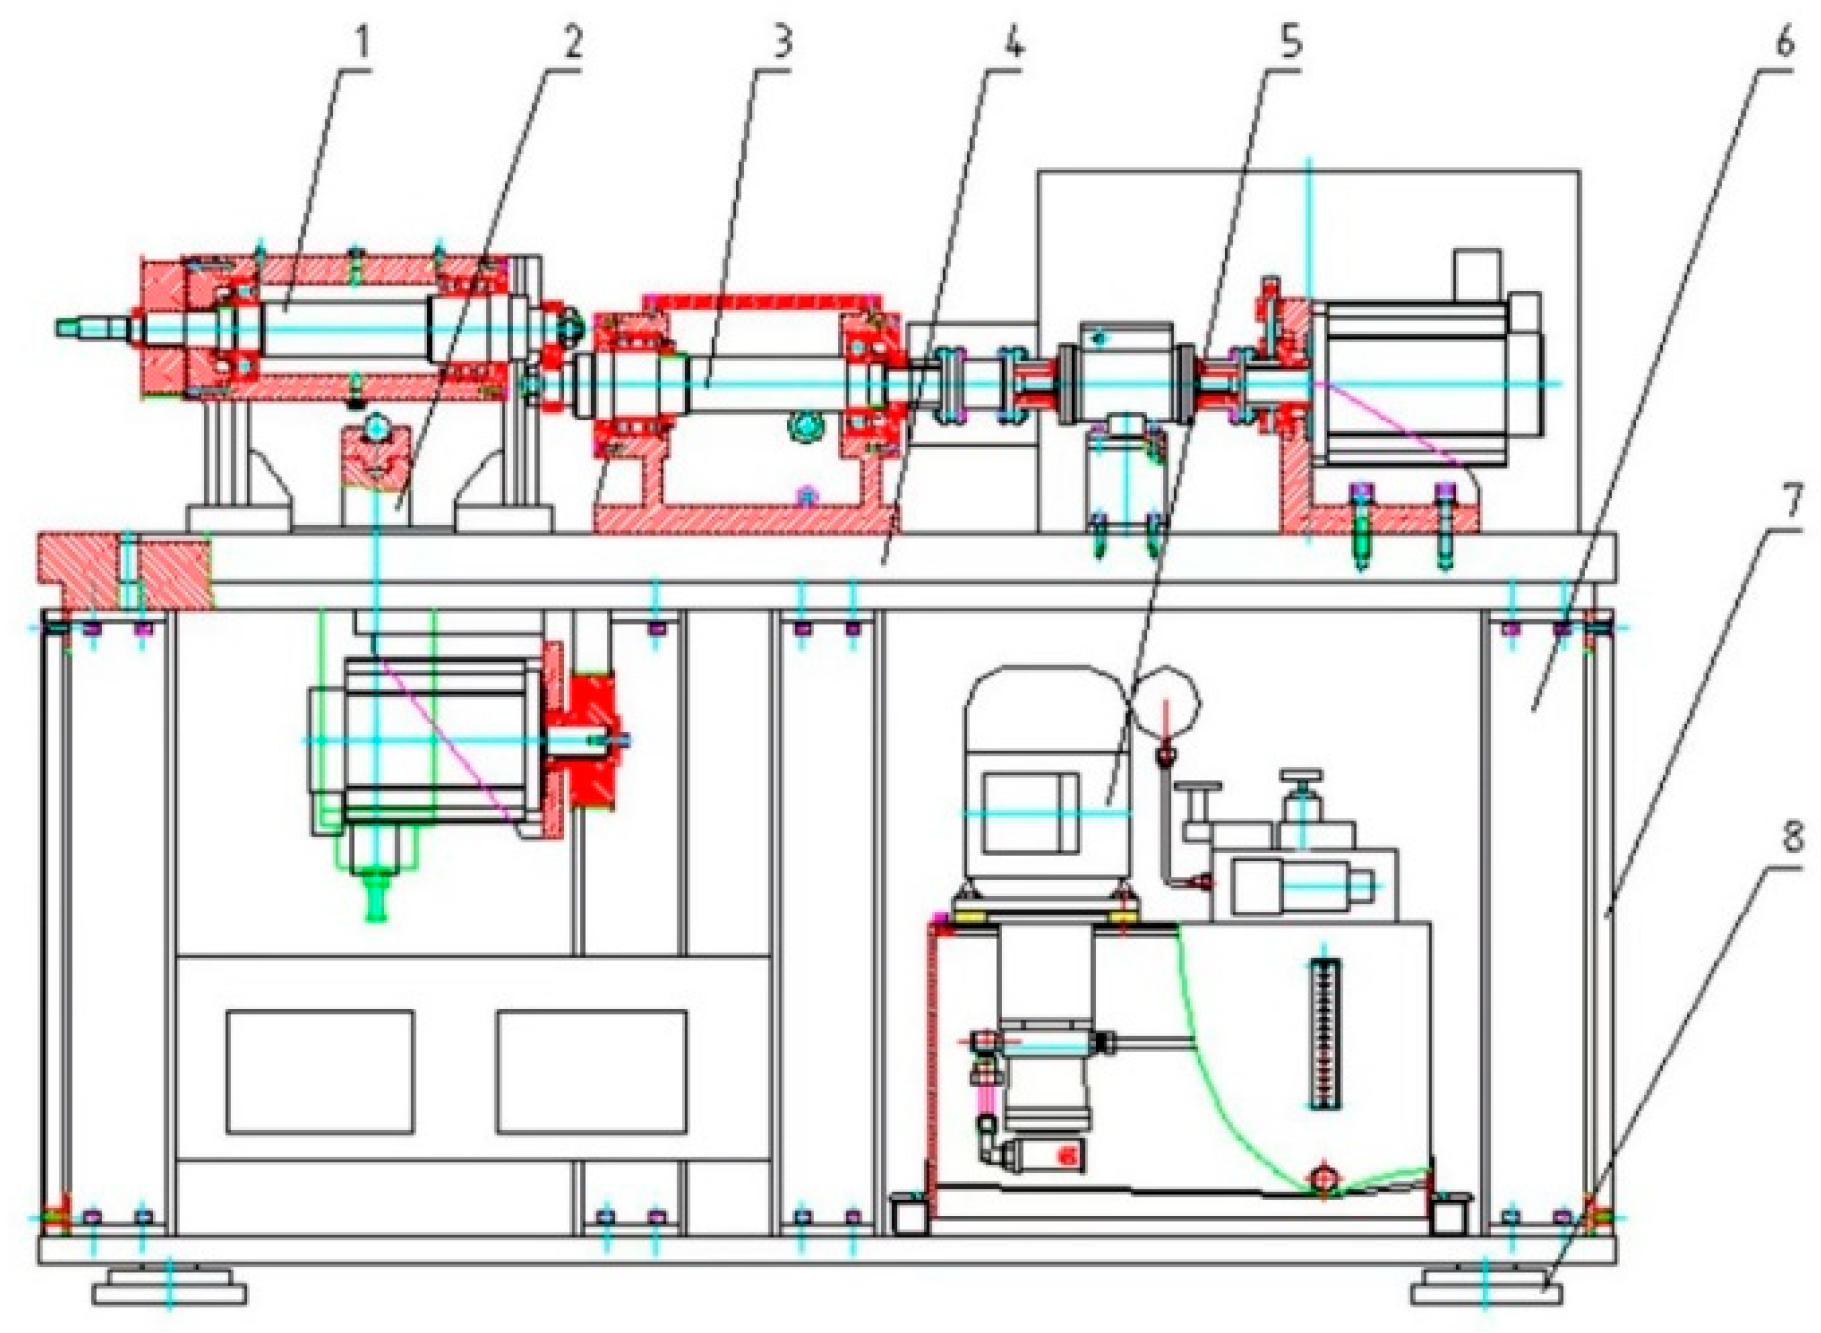
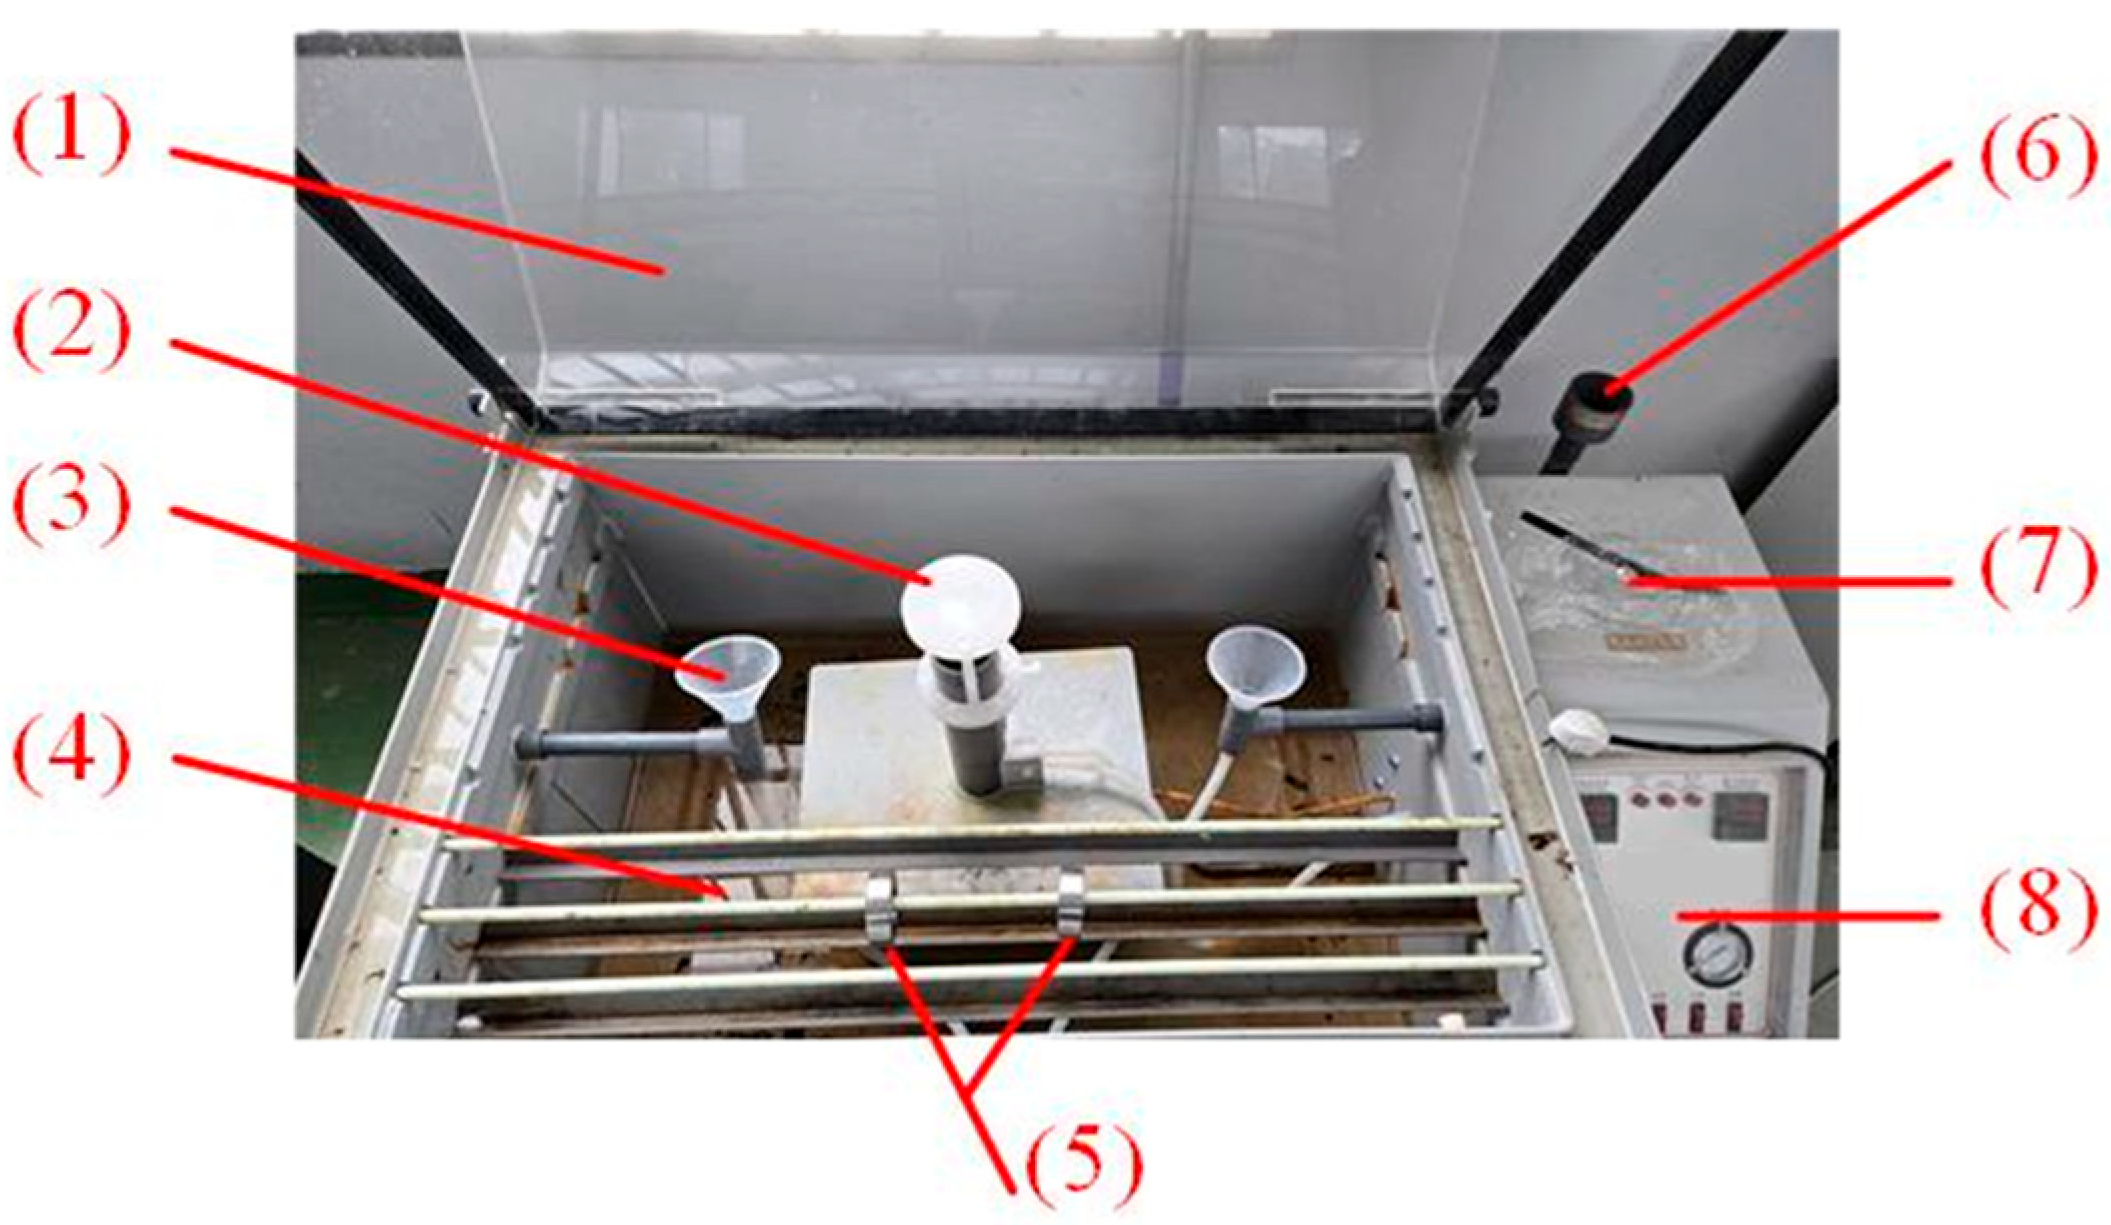
2.1. Experimental Machine

The purpose of this research is to examine the influence of surface defects under rail corrosion on wheel RCF. The RCF tests were completed by a wheel–rail testing machine (LGPJ-30C, BoYanHuaChuang, Jinan, China) (Figure 1). The wheel disc and the rail disc were respectively arranged on the front end of the driving shaft (3) and the driven shaft (1), rotated with the shaft at a certain speed, and the two shafts were driven and controlled by two independent servo motors. The normal force between the wheel and the rail was applied on the driven shaft by the hydraulic actuator (2) rising, and then was realized by the power transmission between the main and driven shafts.
The corrosion treatment of the rail disc was completed using the precision salt spray tester shown in Figure 2. The corrosion test liquid used was 5% NaCl solution, the water seal method was used for sealing, and the spray pressure was 1 kg/cm2. One rail disc corroded for 2 h and one rail disc corroded for 4 h were prepared, and one rail disc not corroded (i.e., corroded for 0 h) was prepared for the control group test. The morphology and roughness of the corroded rail disc are shown in Figure 3. As the corrosion time increases, the more rust spots there are on the rail surface, and the roughness increases, measured at 0.37833, 1.025, and 1.8675 μm, respectively. Additionally, the linear fitting results of the roughness are shown in Figure 3b. The roughness was determined using a roughness measuring instrument (TR120, SaiBoRuiXin Company, Beijing, China). The normality of standard residuals is a key indicator for assessing the linearity of data fitting analysis. The accompanying picture in Figure 3b illustrates a normal probability plot, where the horizontal axis represents the standard residuals, measured by subtracting the predicted values from the observed values. The vertical axis depicts the probability values of these residuals on a normal probability scale, which can be directly determined without further manipulation. The scatter points of standard residuals in the plot cluster around the normal distribution line, suggesting that the residuals after linear fitting closely follow a normal distribution. Therefore, roughness increases in a roughly linear trend.
The surface defects on the wheel were fabricated utilizing a simple drop hammer impact machine, which is shown in Figure 4. The size of the surface defect was determined by the original height of the drop hammer. With reference to previous research [8], three surface defects of different sizes were created by applying different levels of impact energy. Subsequently, this study introduced small, medium, and large defects, which were prepared by a drop hammer at H = 0.3 m, 0.45 m, and 0.6 m. The surface morphology and the profile curve along the rolling direction of the defect are shown in Figure 5a,b. Two defects of each size were prepared, and the defect distribution of the wheel disc is shown in Figure 5c.

2.2. Experimental Parameters

The sampling position and sampling size of the samples are shown in Figure 6. Both the wheel disc and rail disc, each with a diameter of 60 mm, were machined from the rail head and wheel rim, respectively. The contact trace line width between the rail and wheel disc was 5 mm. ER8 steel was selected for the wheels and U75V carbon steel was selected for the rails. Table 1 shows the wheel–rail samples’ chemical composition.
The testing machine’s driving shaft speed was fixed at 1000 r/min, with the maximum contact stress (based on Hertz theory [22]) rounded to 1200 MPa. The loading force P that used Equation (1) from Lewis et al. [23] was determined to be 2941 N as shown below:
P = σ H max 2 π L 1 μ 1 2 E 1 + 1 μ 2 2 E 2 1 R 1 + 1 R 2
where σHmax represents the maximum contact stress, L denotes the length of the contact rectangle, E1 and E2 are the elastic moduli of the rail and wheel samples, μ1 and μ2 are the Poisson’s ratios for the rail and wheel, and R1 and R2 are the radii of curvature for the rail and wheel samples.
In this study, three groups of RCF tests were conducted. The rail corrosion times of 0 h, 2 h, and 4 h were defined as the first, second, and third tests in turn. Table 2 shows the details related to the three sets of tests. The second set of tests was conducted first, with 5000 cycles as the interval to observe the defect. After 150,000 cycles, when there were signs of peeling around the defect, the test was stopped, and then the remaining two sets of tests were also run for 150,000 cycles.
In this work, following defect preparation and testing, the wheel and rail discs were carefully cleaned with ethanol and dried. Post-test, the areas around the defects were sectioned along the rolling direction (Figure 5c). Surface damage and RCF crack formation were examined using a white light confocal microscope (VT600, CHOTEST, Shenzhen, China) and scanning electron microscopy (SEM, SU8010, Tokyo, Japan).

3. Results

3.1. Changes in Wheel–Rail Contact Vibration Velocity
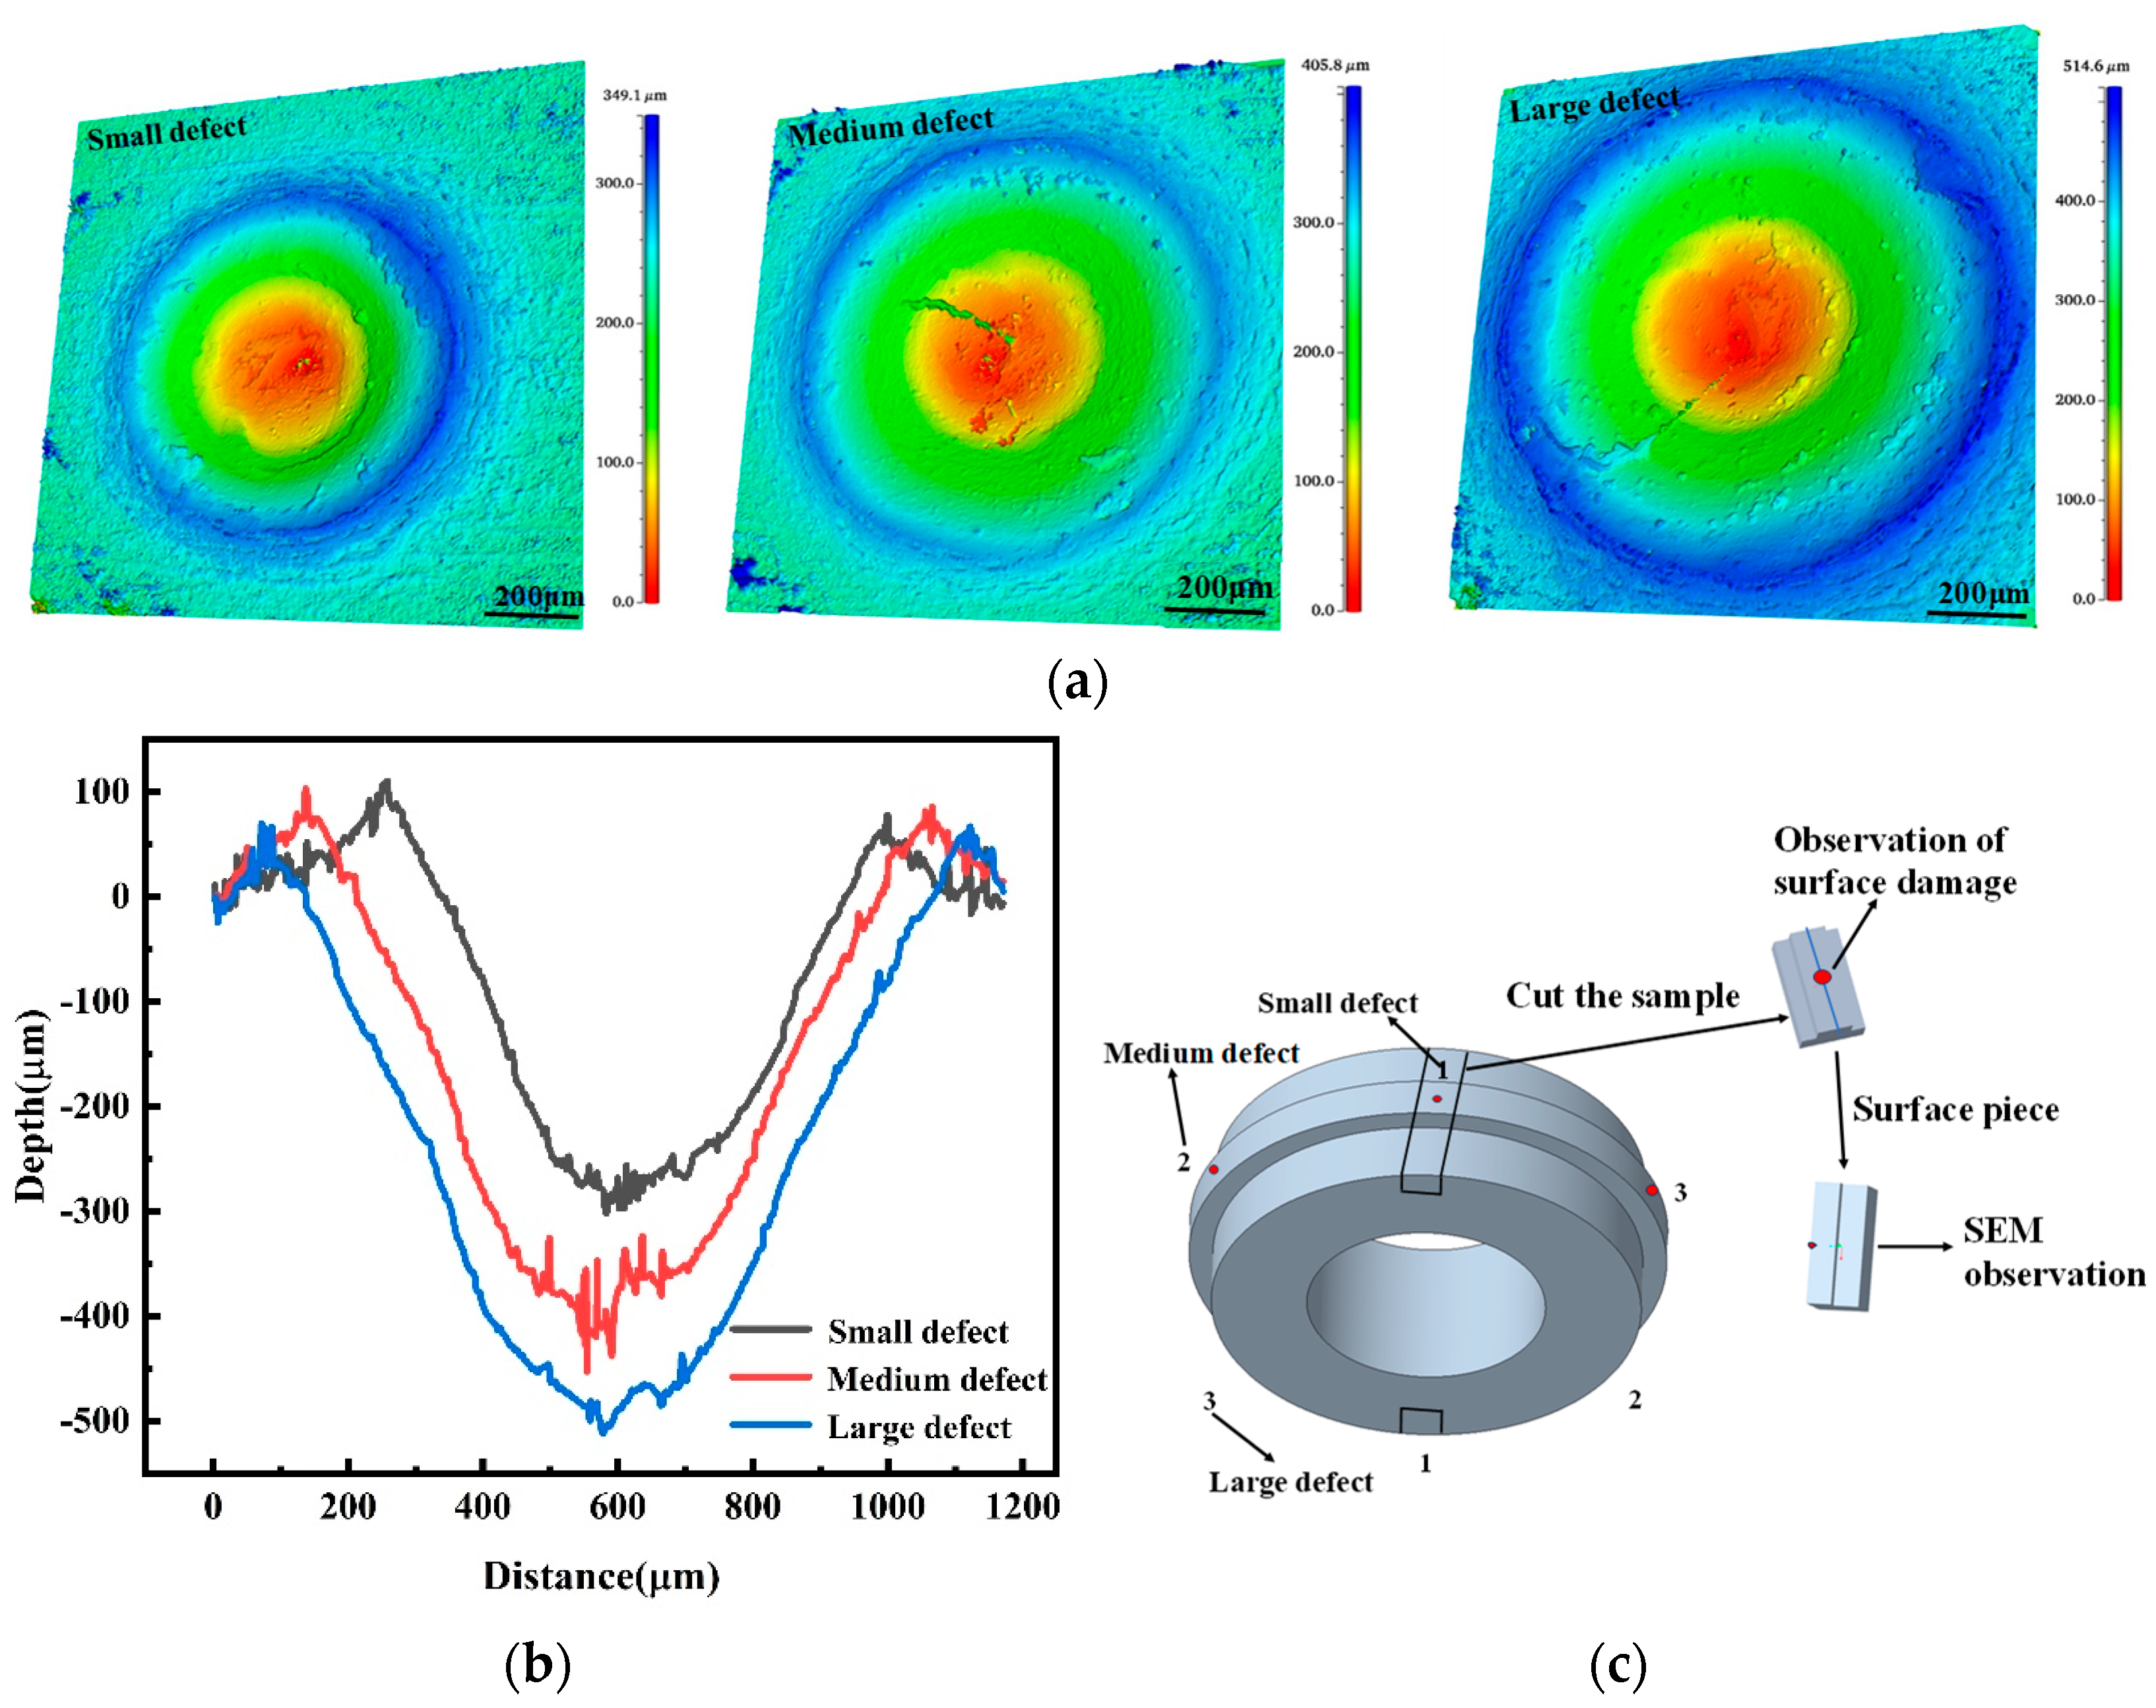
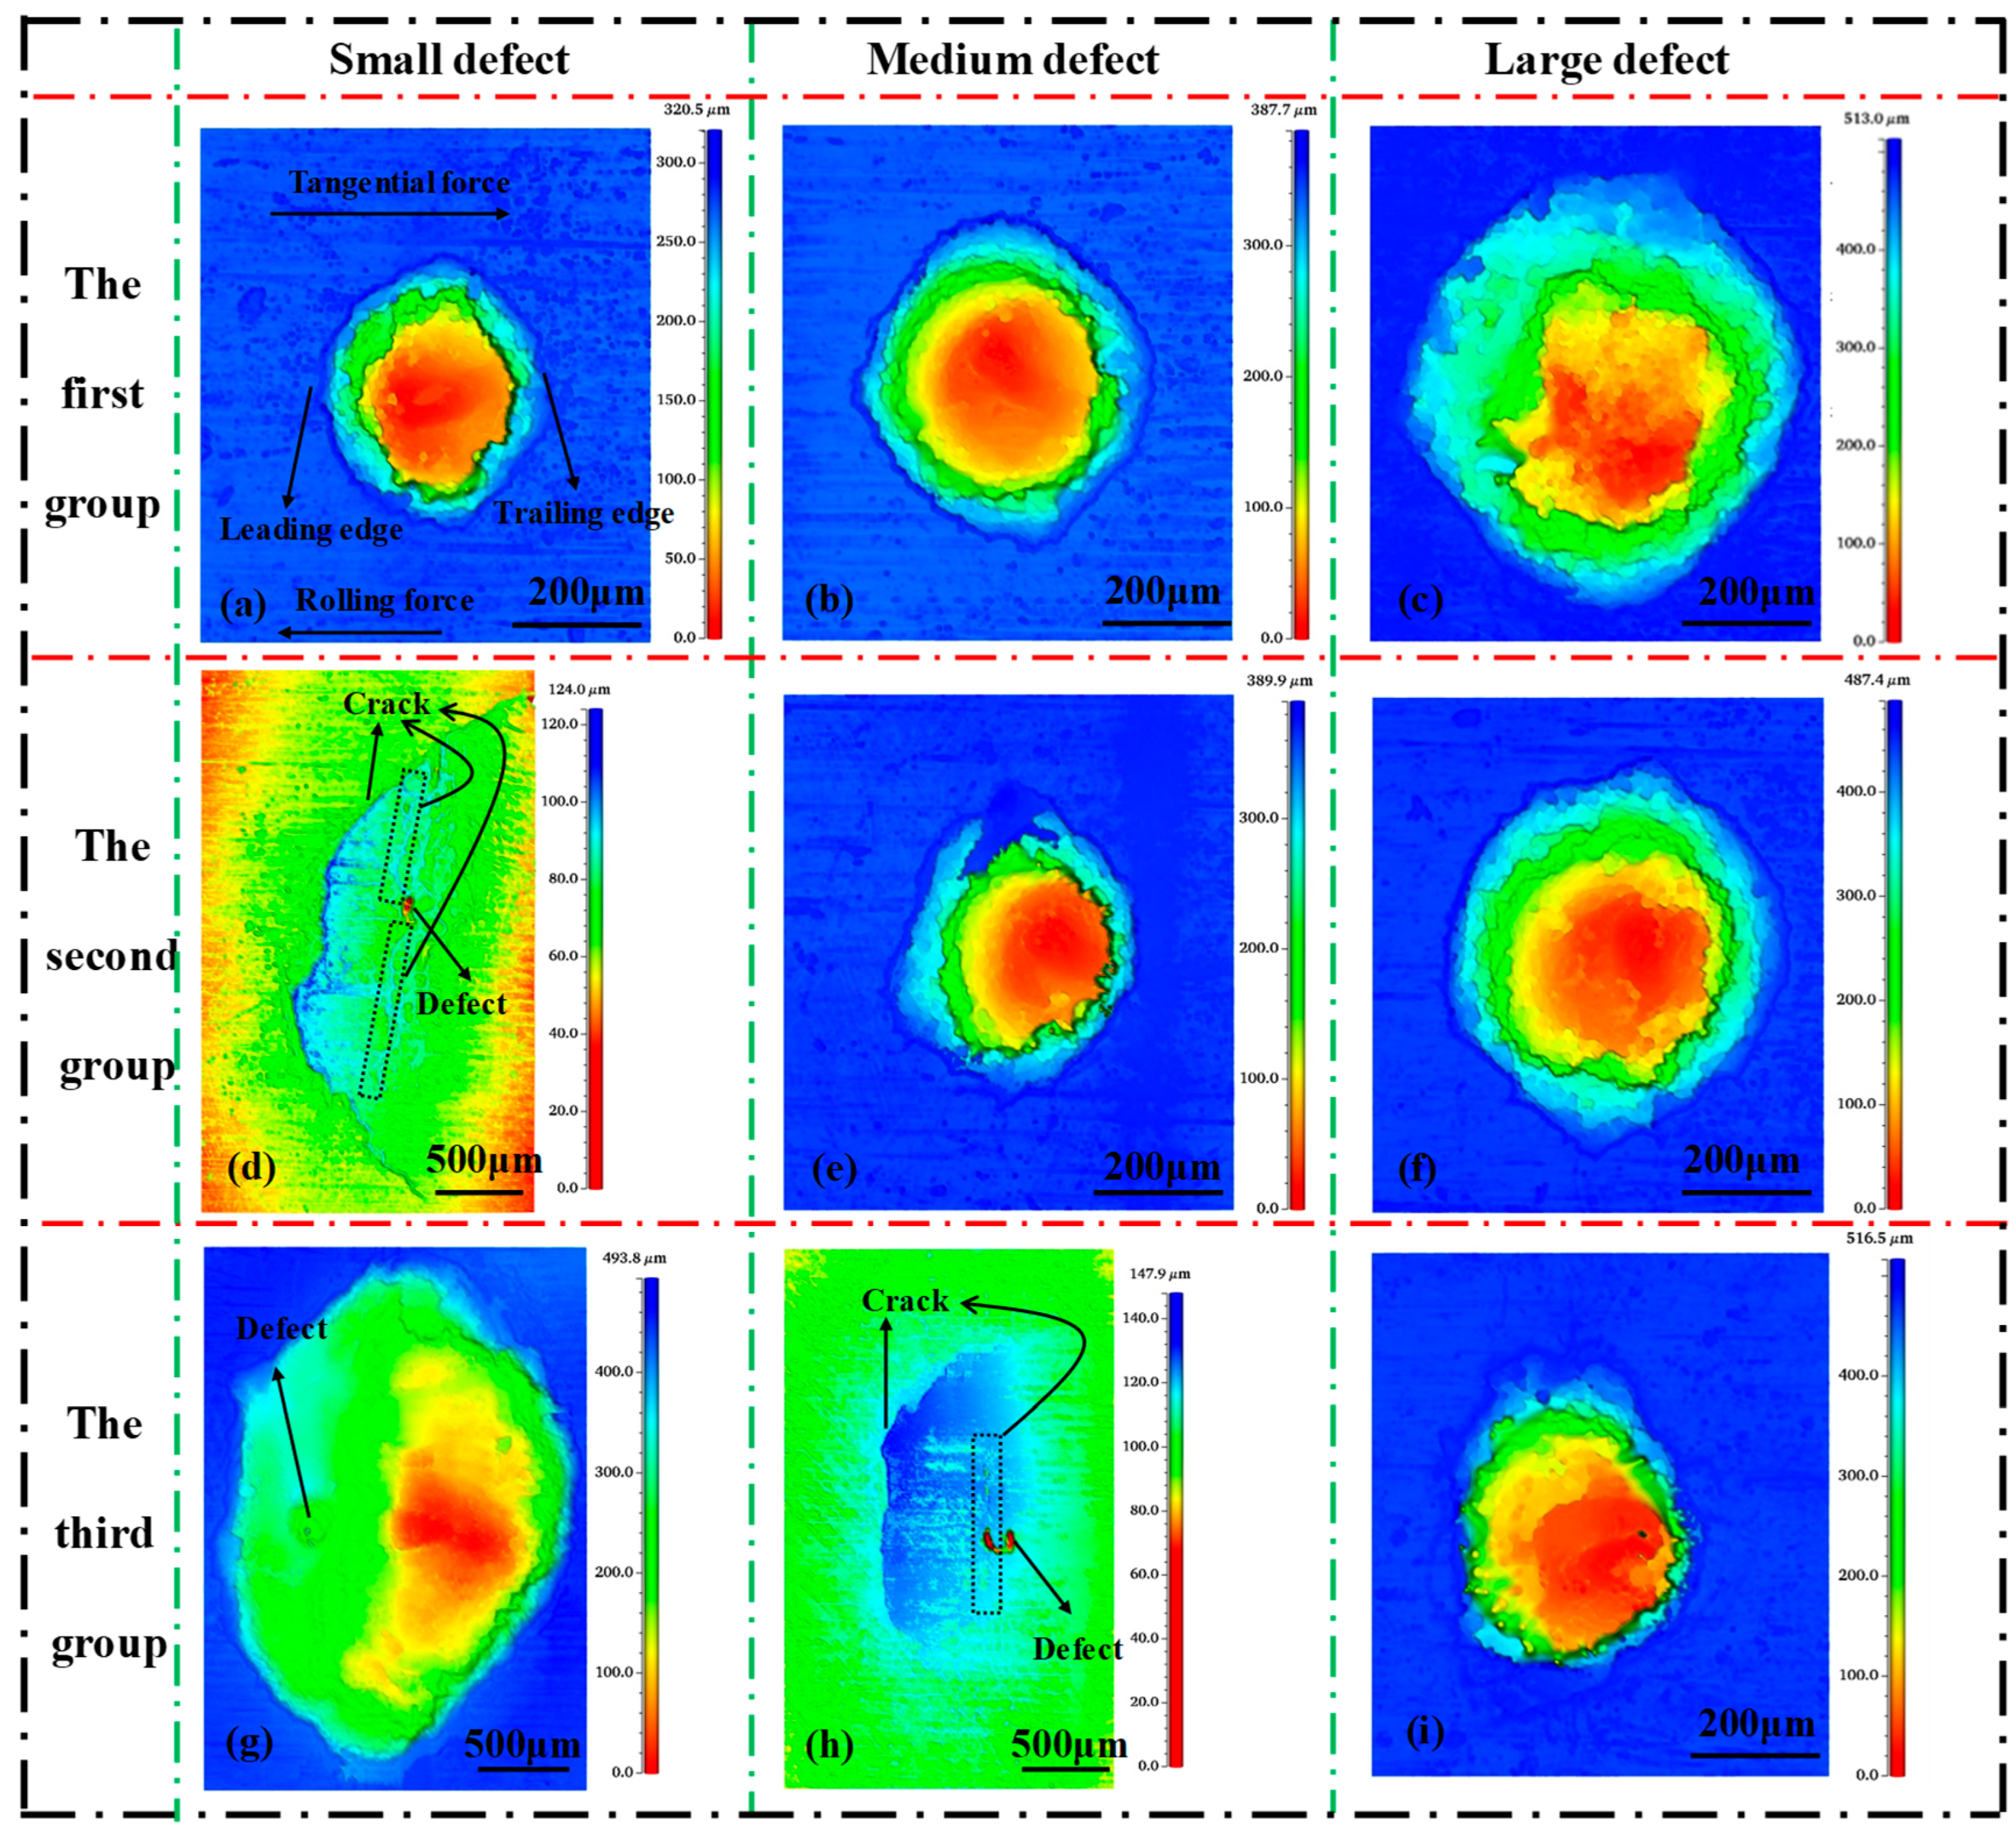
During the test, the waveform of the vibration speeds of the wheel and rail specimens collected by the dual-disk machine with time changes and the time domain diagram obtained by processing is shown in Figure 7. It can be seen from the vibration speed waveform diagram of the vibration speed in Figure 7 that the vibration speed between the wheels and rails increases with the increase of the rail corrosion time. During the stable period, the vibration velocities of the three groups of tests fluctuated at 0.3, 0.6, and 1.28 mm/s, respectively. Moreover, the vibration speed of the first group was always relatively stable, while the vibration speeds of the second and third groups were stable in the early stages, but rose sharply at 8278 and 7670 s, respectively, and the amplitude increase in the third group was even greater. It can be seen from the time frequency diagram that the vibration energy and vibration frequency of the first group of tests were always very low, while the vibration energy and vibration frequency of the second and third group of tests were low in the early stages, but began to jump approximately at 8278 and 7670 s. At this time, the vibration speed, vibration energy, and vibration frequency of the wheel rail all increase sharply, because material peeling occurs at this time. Vibration fatigue theory points out that vibration speed is positively correlated with fatigue damage [24]. Therefore, as the corrosion time of the rail increases, the fatigue damage of the wheel and rails intensifies. The earlier the peeling time occurs, the lower the fatigue life.

3.2. Surface Damage

Figure 8 shows the surface morphologies of small, medium, and large defects of the wheel disc after the three groups of tests completed 150,000 cycles. The region around the wheel sample’s defect is split into the leading and trailing edges based on the RCF test’s rolling direction. The side that passes through the contact area first is the leading edge, as shown in Figure 8a. In the first group of tests, the three types of defects (Figure 8a–c)—small, medium, and large—showed no signs of spalling, and no cracks were initiated on their surfaces. In the second group of tests, there were signs of spalling near the small defect (Figure 8d), with cracks initiating and extending at the front and middle edges, while no cracks appeared near the medium and large defects (Figure 8e,f). In the third group of the test, large-scale material spalling occurred near the small defect (Figure 8g), and slight spalling signs appeared near the medium defect (Figure 8h). Similar to the small defects in the second group, cracks initiated and expanded near the leading edge and the middle edge, but the spalling signs were milder. No cracks were initiated near the large defect (Figure 8i). Obviously, the initiation and extension of surface cracks would be accelerated by rail disc corrosion, and the rates of crack initiation and extension would increase with the increase of corrosion time, because the initiation of RCF cracks induced by the wheel–rail surface is mainly affected by the frictional shear stress at the contact interface [25]. When plastic deformation on the contact surface exceeds the material’s strain limit due to frictional shear stress, RCF cracks begin to appear. The longer the rail disc is corroded, the more serious the rust spots on the surface become, and the surface becomes rougher than the original sample before corrosion, which increases the friction shear stress on the wheel–rail contact interface, thereby accelerating the initiation and expansion of cracks on the wheel disc surface. Additionally, the second set of test cracks appeared near the small defects (Figure 8d), the third set of test cracks appeared near the small and medium defects (Figure 8g,h), and the cracks near the small defects also appeared significantly before the medium defects, so the larger sized defects exhibited budding surface cracks later. The surface cracks of the small defects in the second group (Figure 8d) and the medium defects in the third group (Figure 8h) were both C–type. The C–type of the former was more obvious than that of the latter, and the morphologies of the two were very similar. This shows that the RCF crack change trends around different defects are similar, that is, they extend in a C–shape along the tangential force direction.
The defects without signs of spalling (Figure 8a–c,e,f,i) are smaller than the initial morphology (Figure 5a), and their surface morphology was also elliptical. It is evident that during wheel–rail rolling, the defect becomes smaller and transitions from a circular shape to an elliptical shape, and the size of the defects decreases fastest in the rolling direction. This is because the wheel disc rolling direction is parallel to the friction shear stress direction, and plastic deformation accumulates in the friction shear stress direction. At the same time, the morphologies of medium defects (Figure 8b,e,h) and large defects (Figure 8c,f,i) in the three groups of experiments were observed. For defects of the same size, the first group was the largest and the third group was the smallest. To more intuitively show the changes of defects after the end of the test, the three initial defects and nine defect volumes after the end of the test were calculated using White light Confocal microscope 3D Optical Profiler CHOTEST (Chotest Technology Inc., Shenzhen, China) (it should be noted that this volume is an approximation of the exact volume). The volume changes of the nine defects after the end of the test are shown in Figure 9. As mentioned above, the number of defects of the same size is greatest in the first group and lowest in the third group. The defect volume changes in the three groups of tests confirmed that the greater the rail disc corrosion, the faster the defect reduction rate. This is because as the rail disc corrosion time increases, the wheel–rail rolling wear rate increases [26], which accelerates the defect reduction rate.

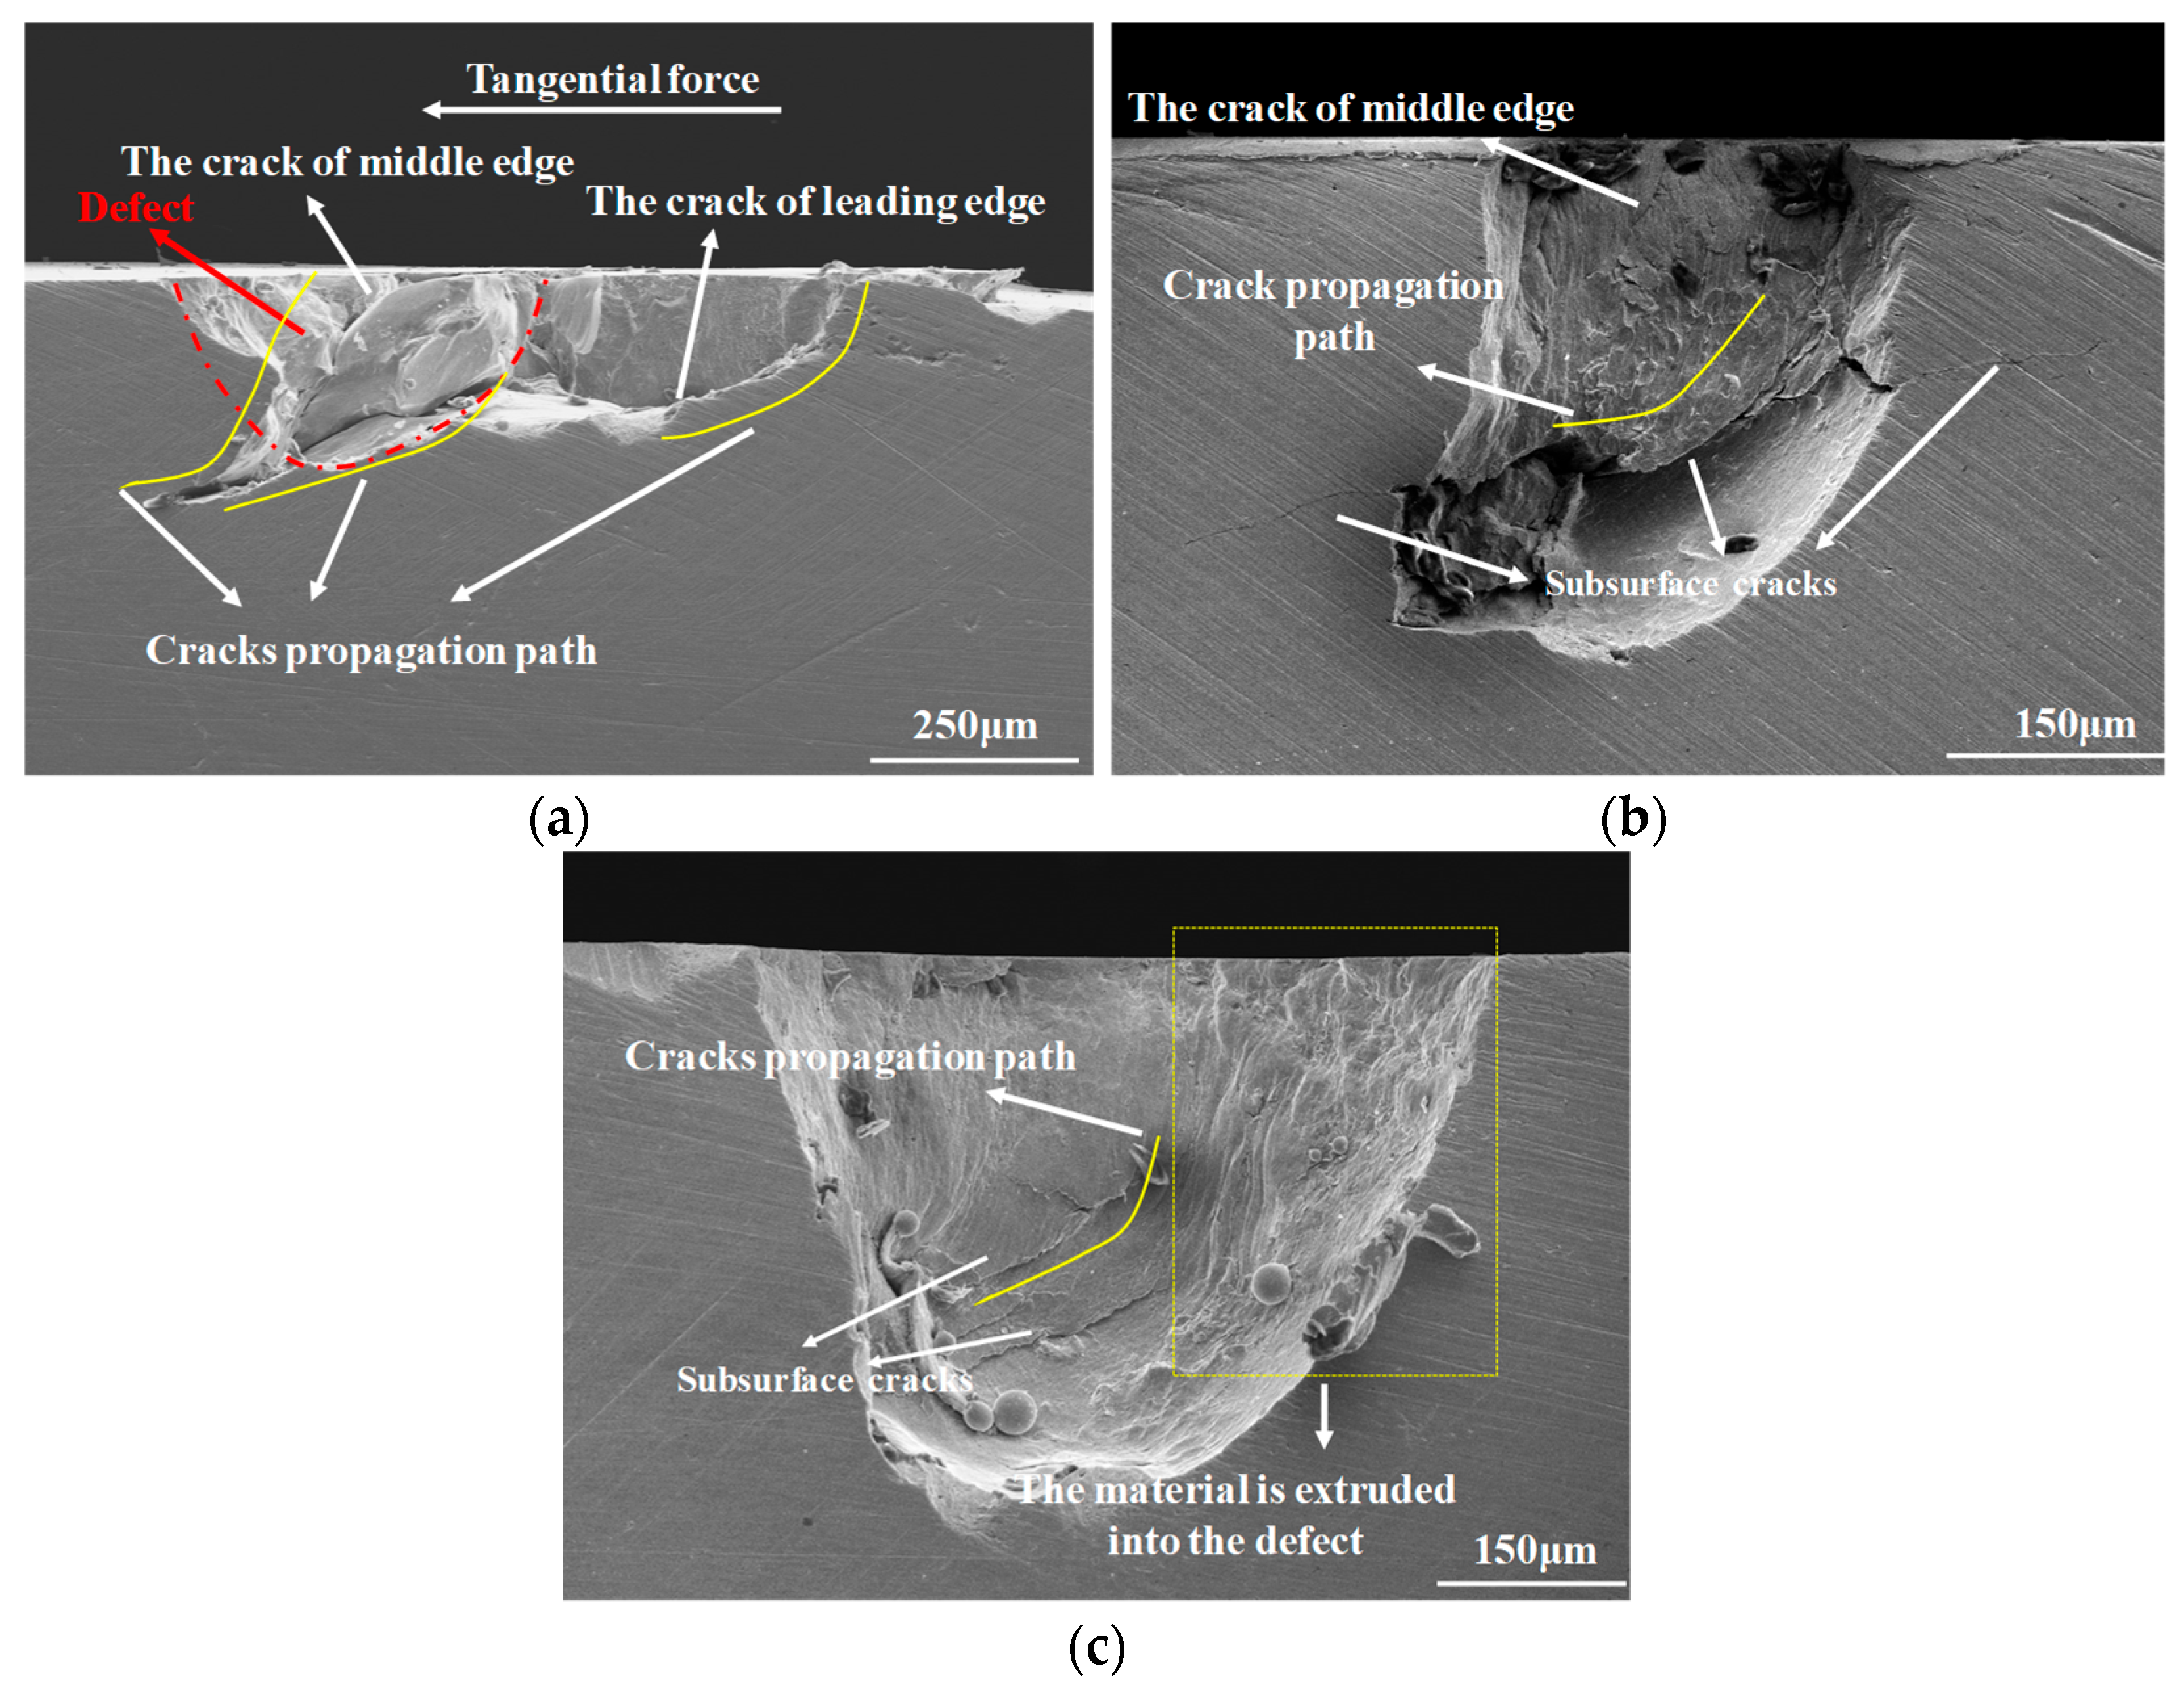
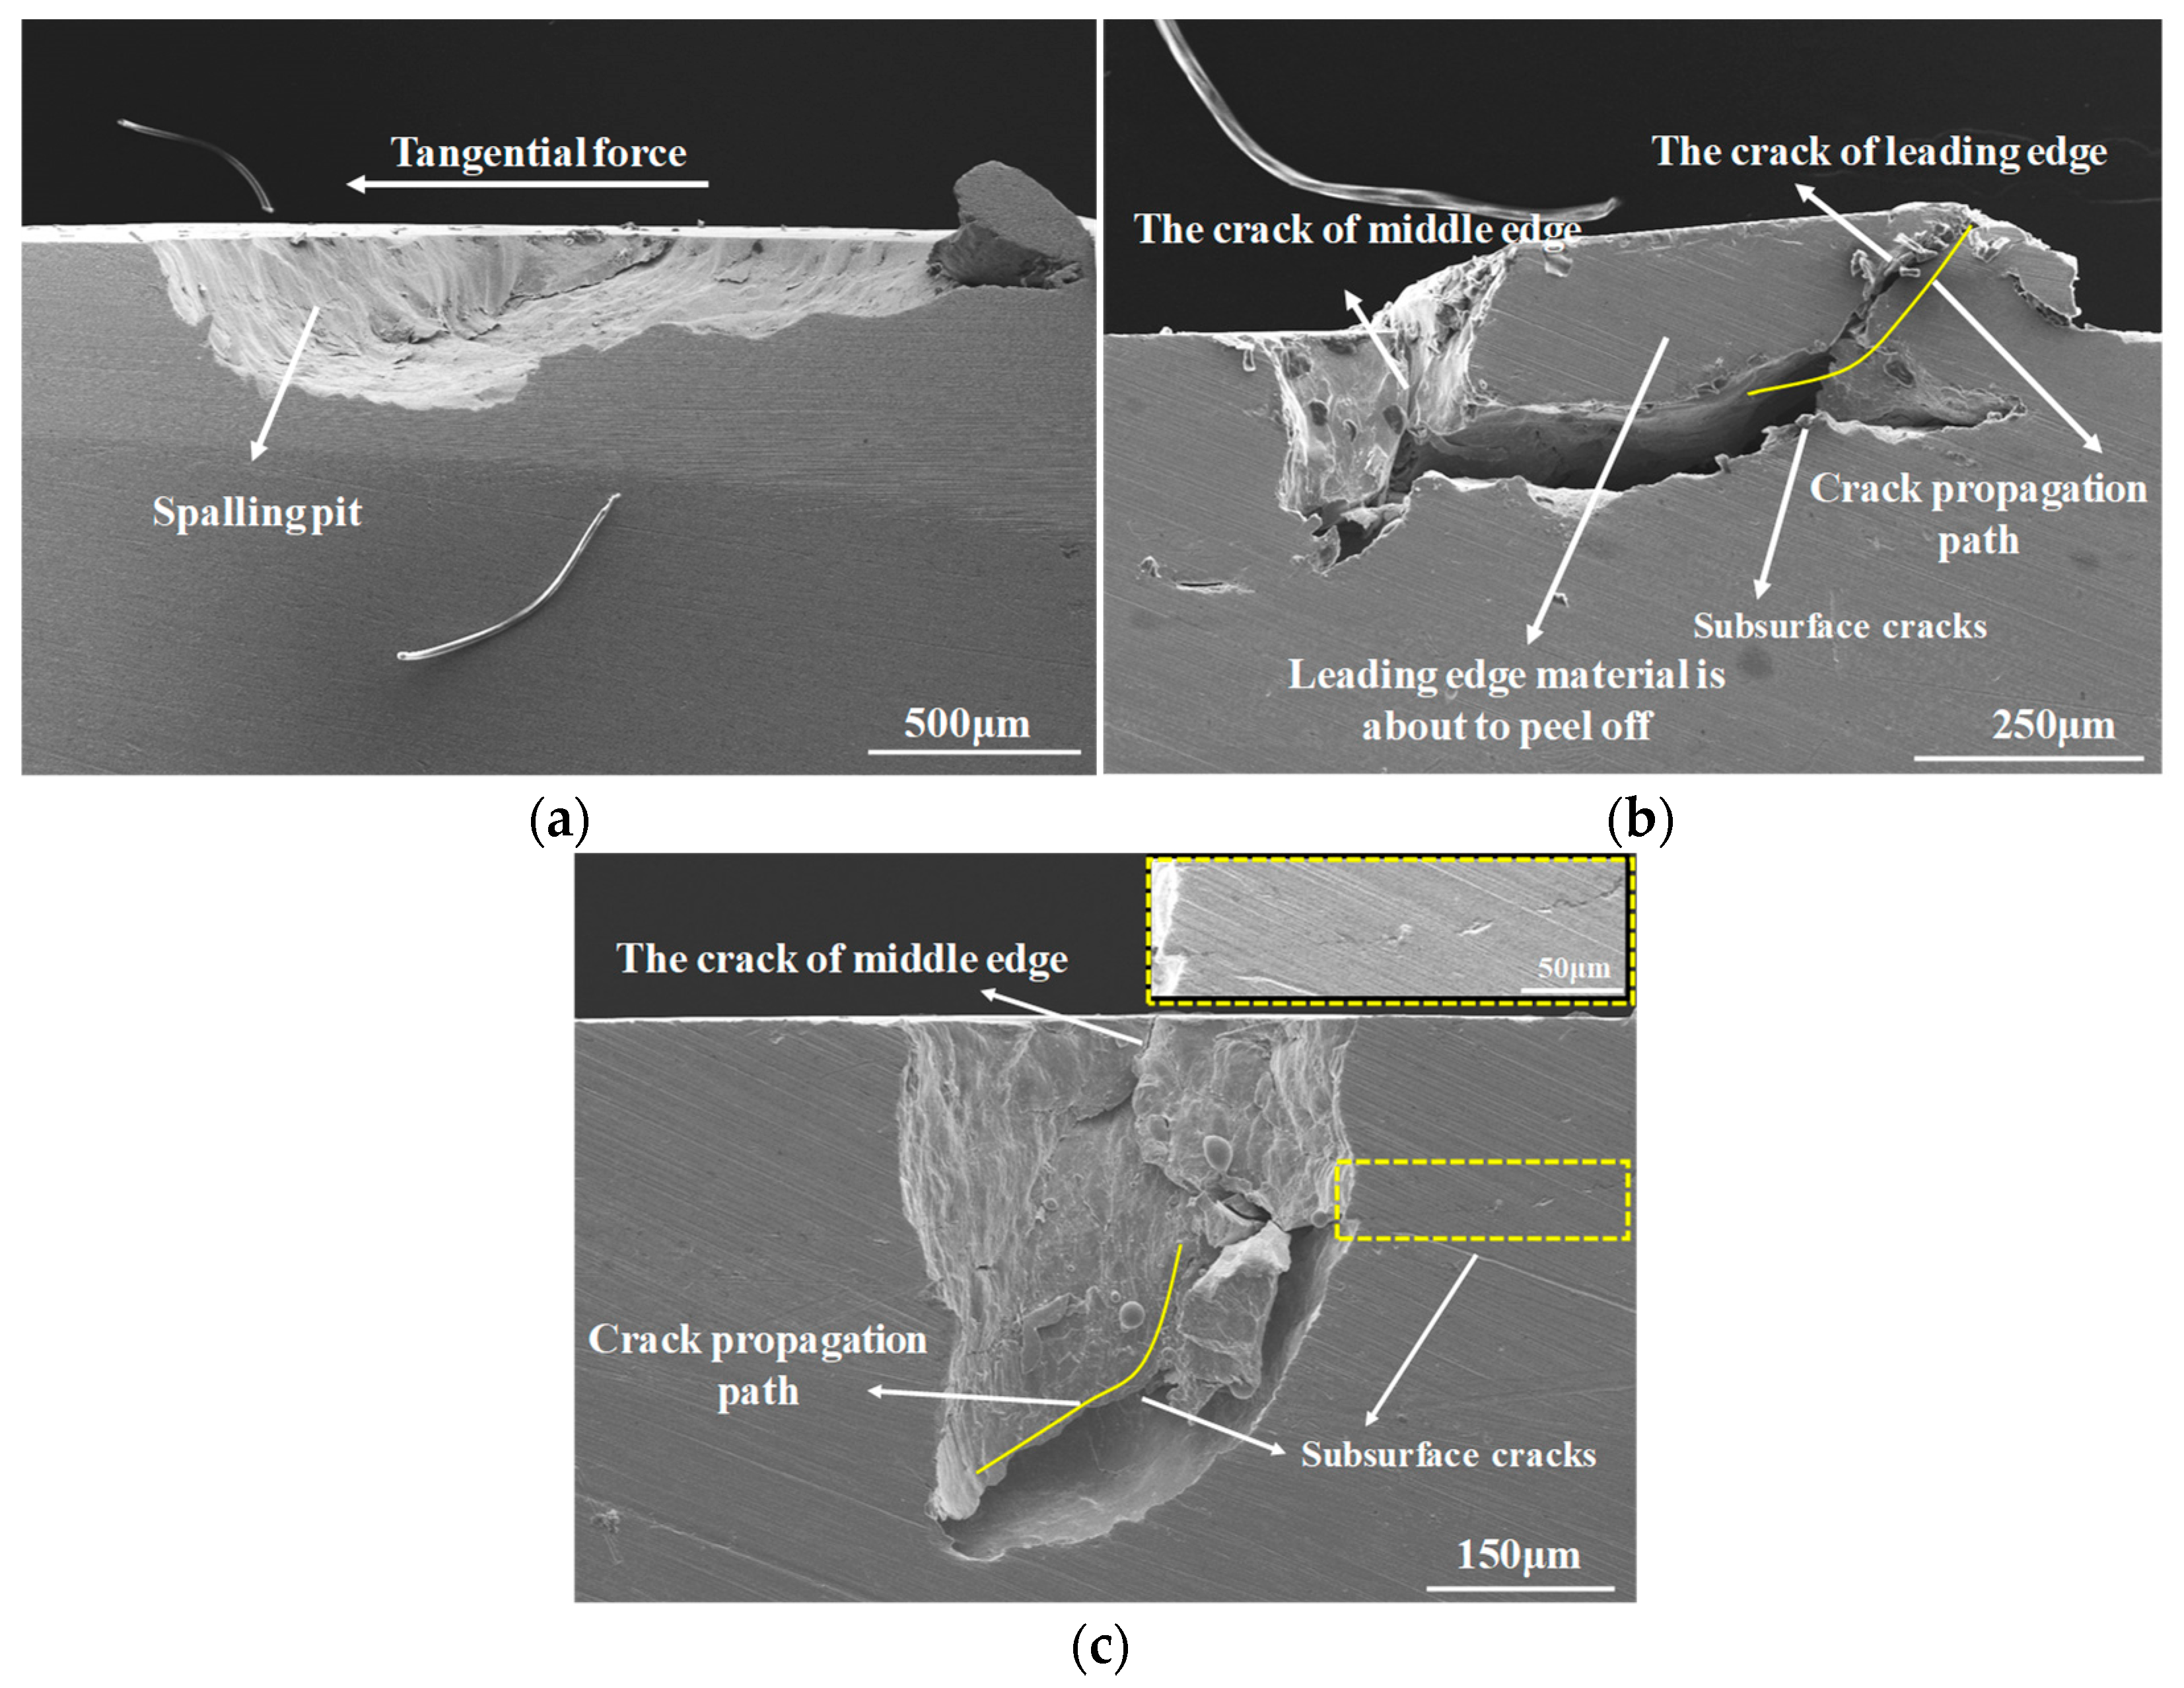
3.3. Subsurface Damage

The cross-sectional morphology characteristics near the wheel defect after the three groups of RCF tests are shown in Figure 10, Figure 11 and Figure 12. For small defects, only cracks were seen in the first group (Figure 10a); in the second group (Figure 11a), the cracks extended deeper and spalling occurred at the front edge; and in the third group (Figure 12a), the entirety of the material near the defect was spalled off. For medium defects, the first group (Figure 11b) had cracks that were shallower and less widely distributed than small defects; for the second group (Figure 11b), the cracks extended beyond the defects; and for the third group (Figure 12b), the leading edge material was about to spall off. For large defects, there were no cracks in the first group (Figure 10c); in the second group (Figure 11c), subsurface cracks were initiated and extended; in the third group (Figure 12c), subsurface cracks extended to form cracks, and cracks originated at the mid-edge surface and extended toward the leading edge. In all three tests, the severity of crack expansion in the defects intensified with extended rail corrosion duration. For defects of the same size, the longer the rail corrosion time, the stronger the crack expansion of the defect. This is similar to what is found in the surface morphology of defects, where the size of the defect influences the time of crack initiation, with larger defects cracking later. The corrosion of the rail accelerates crack extension, and the cracks’ spread accelerates as rail corrosion extends over time.
Among the three groups of tests, only the large defects in the first group (Figure 10c) did not show obvious subsurface cracks, while subsurface cracks were initiated and extended in the remaining defects. However, only the small defects in the second group and the small and medium defects in the third group had cracks on the defect surface (Figure 8). Therefore, the cracks were initiated and extended first on the subsurface because the maximum shear stress occurs on the underside of the rolling contact zone [27]. The cracks were initiated near the middle edge of the defect (mid-edge subsurface, Figure 10a and Figure 11c; mid-edge surface, Figure 11b and Figure 12c), because when the defect passes through the rolling contact area, the stress near the edge is the greatest [11,13,28]. The subsurface crack extended in a C–shape along the direction of the tangential force and was extended deeper by the normal force (Figure 11a). However, some cracks extended toward the surface in the direction contrary to the tangential force (the cracks of the leading edge) (Figure 11b and Figure 12c), and intersected at the leading edge with the cracks that extended in the direction of the tangential force, causing the material at the leading edge to be spalled off first (Figure 11a and Figure 12b). The crack in this direction is caused by the material of the leading edge flowing into the defect along the tangential force direction (Figure 10c and Figure 11c). The accumulation of plastic strain due to material flow makes the fatigue resistance of this area relatively weak. The middle edge shoulder is an area of stress concentration, and the cracks that form there result from the material in that zone being depressed downward under the normal force of the wheel–rail, so that the cracks extend toward the relatively weak anti-fatigue area. This also results in the leading edge material bulging upward (Figure 13), resulting in the leading material edge being spalled first (Figure 11a and Figure 12b). Since the crack extending along the tangential force direction extends deeper under the effect of the normal force, the peeling depth at the leading edge is shallower than it is at the trailing edge (Figure 8g and Figure 12a). In addition, at the defects of three sizes, there are signs of peeling at the leading edge first (Figure 11a and Figure 12b,c), which further indicate that the crack extension trends near defects of different sizes are similar.

4. Discussion

The roles of surface defects of different sizes on wheel RCF damage under rail corrosion are revealed in this study. In the RCF test, the defect gradually decreases, and under the effect of shear force, the rate of reduction is fastest along the rolling direction, thus changing from a circle to an ellipse. As reported by Ekberg et al. [27], RCF cracks were first initiated on the subsurface where the maximum shear stress was located in the rolling contact area. In the case of grooved samples with pre-existing tensile stress, according to some previous test results, the initiation of new cracks was promoted and accelerated by the residual tensile stress at the notch [29]. Therefore, the cracks begin at the shoulder of the defect (Figure 12c) and then extend outward.
In addition, during wheel–rail rolling, the material of the leading edge is squeezed into the bottom of the defect along the direction of the tangential force (Figure 10c and Figure 11c), and the accumulation of plastic deformation accompanied by material flow becomes the cause of the initiation of cracks at the leading edge. Zhao et al. [2,7] observed that the plastic deformation layer at the defect’s leading edge is significantly thicker compared to that of the trailing edge. The uneven deformation distribution caused by the yield strain of the trailing edge is half that of the leading edge. As a result, RCF cracks are more severe at the leading edge. Additionally, the material near the middle edge’s crack is concave downward under the normal force, which makes the material on the leading edge’s side convex, which also improves the extension of the leading edge crack, so the surface RCF crack near the leading edge of the defect is the most serious. Meanwhile, the leading edge crack expands in a C–shape along the tangential direction and intersects with the middle edge crack, causing the material surrounding the leading edge to be spalled off first. As the crack continues to grow, the entirety of the material that is in the vicinity of the defect is eventually spalled off, and because the crack continues to extend downward under the effect of the normal force, the spalling depth at the trailing edge is greater. However, there is no trend of further crack expansion at the edge of the large spalling (Figure 8a and Figure 12a). This may be because of significant plastic deformation near the diamond spalling area following wear and indentation, resulting in large residual stress in this area, and the prevention of further crack expansion [21]. The RCF crack evolution surrounding the defect is shown in Figure 14.
The role of defect size on RCF damage is reflected in the crack initiation time. Larger cracks are initiated later, while the variation trends of their crack extensions are similar. Rail corrosion promotes the initiation and expansion of cracks. The longer the corrosion time, the faster the cracks initiate and expand, and the earlier spalling occurs. This is because as corrosion duration increases, the rail surface becomes rougher (Figure 3b), resulting in greater friction shear stress being generated in the wheel–rail rolling contact zone, accelerating the cracks’ expansion. For the same rail corrosion duration, smaller wheel defects result in a larger contact zone, more rust spots caused by corrosion are contained in the contact zone (Table 3), and more areas with greater friction shear force are generated; the faster the crack extension rate is, small defects are more likely to be cracked first. Therefore, the fatigue spalling of small defects is more serious. In addition, wear is aggravated by rail corrosion. As the rail corrosion time increases, the greater shear force causes the material of the leading edge to be squeezed into the defect, thereby increasing the wheel–rail wear rate and accelerating the defect reduction rate. Therefore, under rail corrosion, wheel RCF damage and wear both increase.
In summary, rail corrosion and surface defects have an impact on the wheel–rail rolling contact process, RCF damage is aggravated by these phenomena, and the fatigue life of the wheel is reduced. Therefore, to avoid serious RCF damage to the wheel–rail caused by surface defects, maintenance techniques like the use of grinding wheels can help eliminate rust spots caused by defects and corrosion as much as possible.

5. Conclusions

This study conducts RCF tests to explore how surface defects affect wheel RCF performance under rail corrosion. The key findings are summarized as follows:
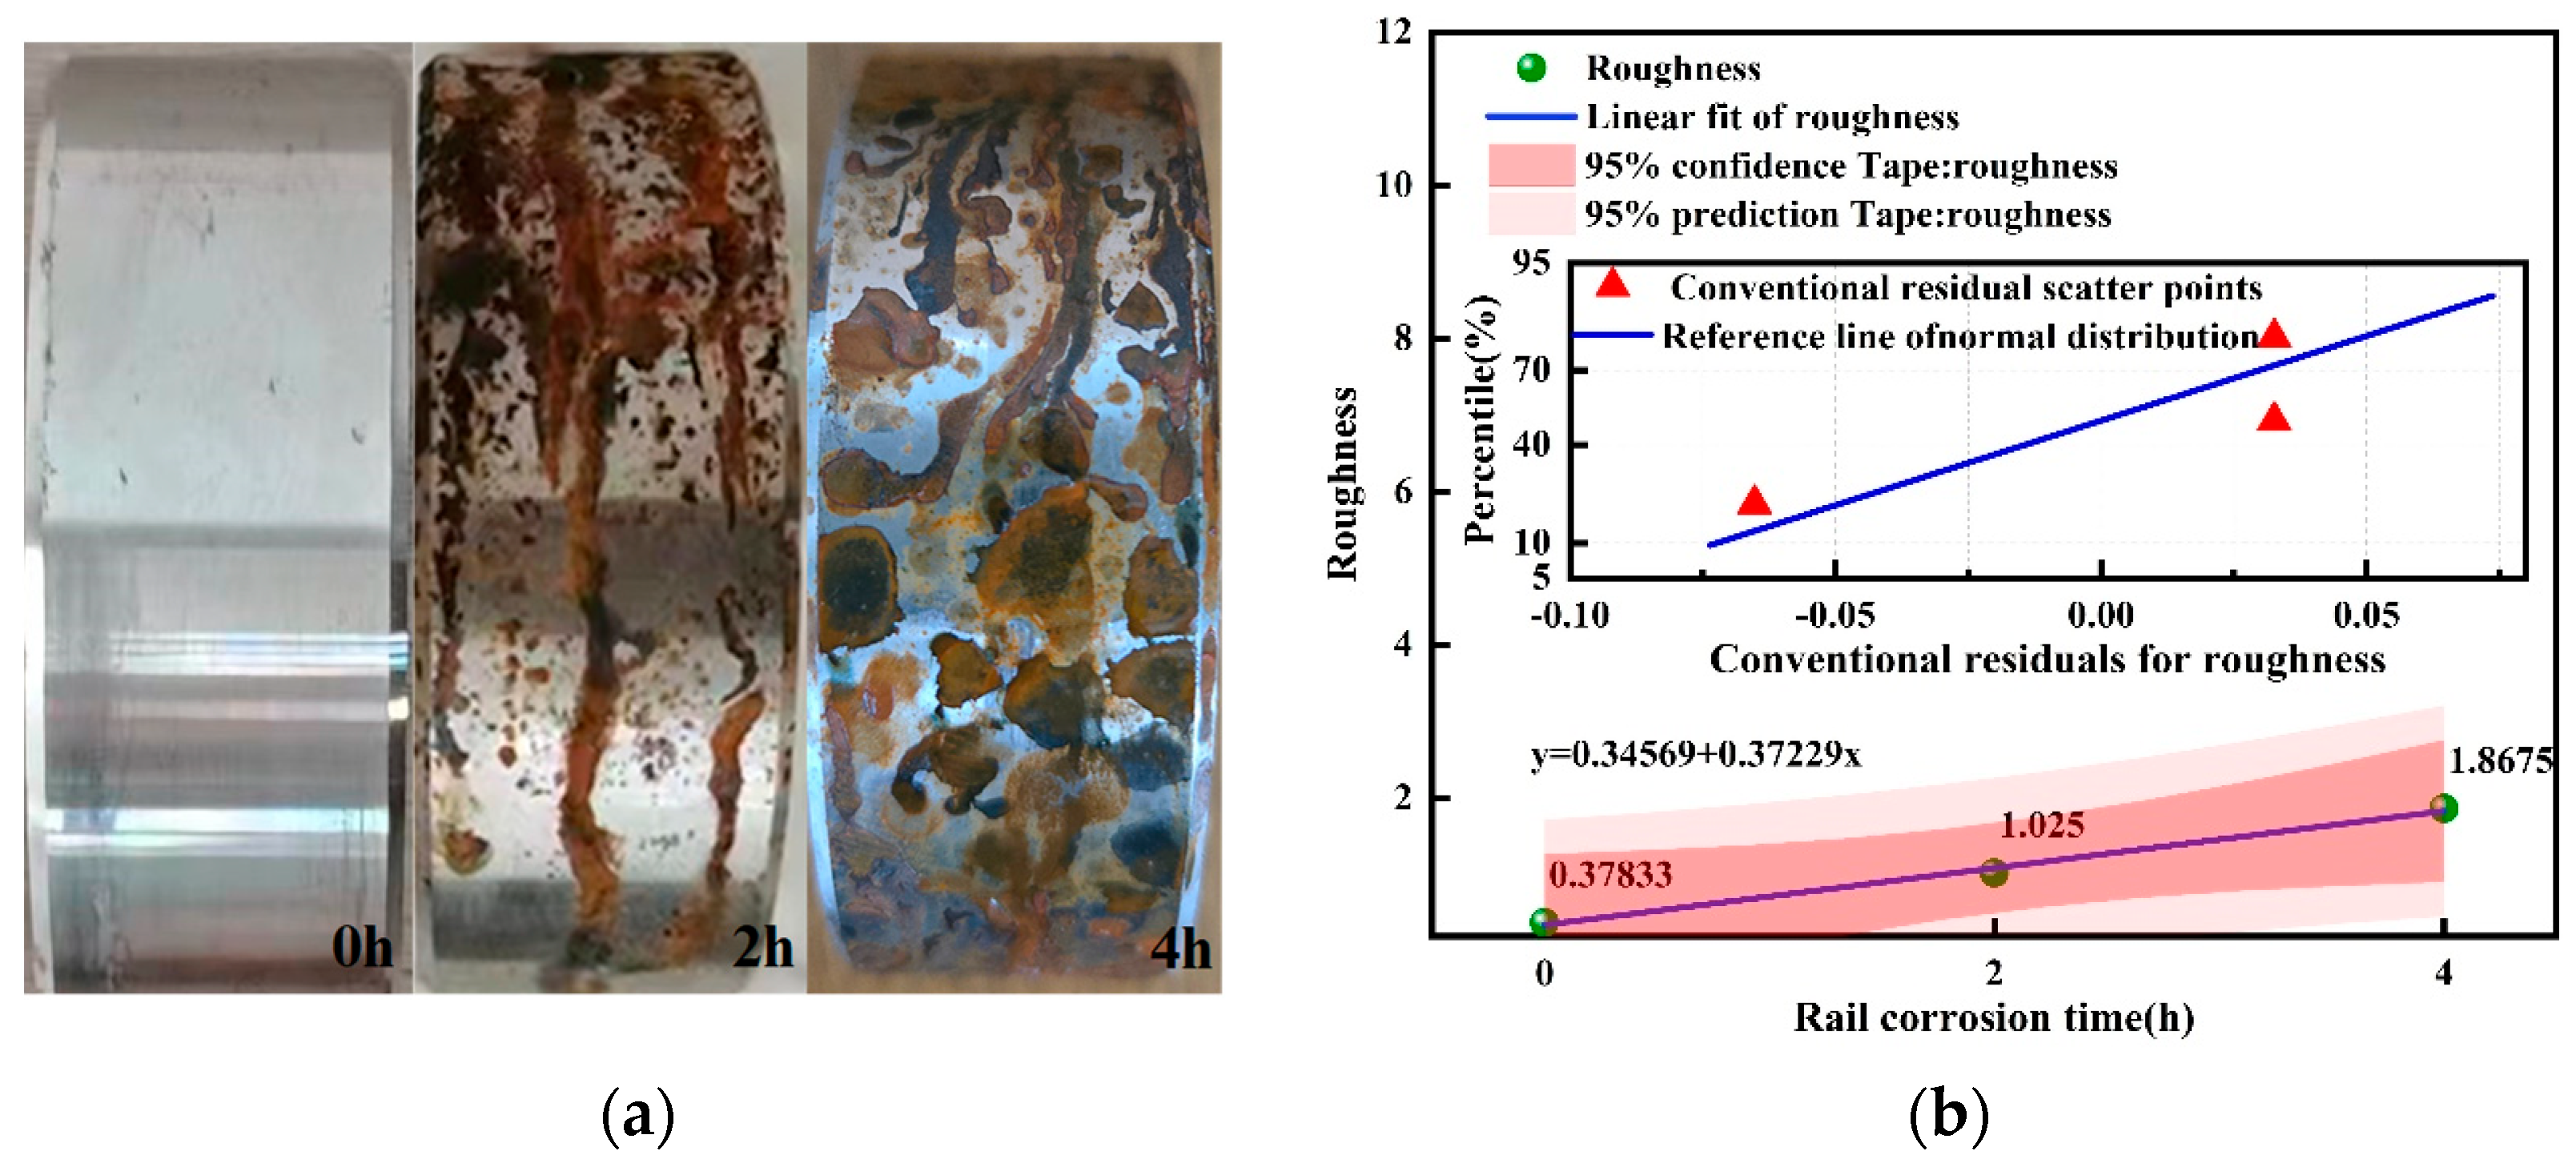
  • The surface roughness of the rail after 0, 2, and 4 h of corrosion was measured at 0.37833, 1.025, and 1.8675 μm, respectively. Standard residual analysis confirmed an approximately linear increasing trend in roughness over time;
  • The larger the surface defect size, the later the RCF crack in its neighborhood is initiated;
  • The RCF crack growth trends of surface defects of different sizes are similar, and they all extend in a C–shape along the tangential force direction;
  • The material near the leading edge is progressively compressed into the defect under the effect of the tangential force, forming a larger plastic deformation layer, which leads to more severe cracking of the RCF at the leading edge. In the meantime, under the combined effect of normal force and shear stress, the leading edge crack intersects with the middle edge crack, causing spalling to occur first at the defect’s leading edge;
  • Among the three test groups, no spalling occurred in the first group, while the second and third groups exhibited spalling at 8278 and 7670 s, respectively. Taking large defects as an example, the wear volumes measured 0.068, 0.077, and 0.089 mm3 for the three groups. These results demonstrate that rail corrosion aggravates wheel wear and RCF damage. The longer the corrosion duration, the more severe the RCF damage and wear, leading to earlier material spalling and reduced fatigue life.

Author Contributions

Conceptualization and methodology, L.Z.; data curation and writing—original draft, M.M.; visualization, investigation, and funding acquisition, D.C.; supervision, M.Z. All authors have read and agreed to the published version of the manuscript.

Funding

This research was sponsored by the National Natural Science Foundation of China (52202468), and the Natural Science Foundation of Jiangxi, China (20232BAB204104).

Institutional Review Board Statement

Not applicable.

Informed Consent Statement

Informed consent was obtained from all subjects involved in the study.

Data Availability Statement

The data that has been used is confidential.

Conflicts of Interest

The authors declare that they have no known competing financial interests or personal relationships that could have appeared to influence the work reported in this paper.

References

  1. Hu, Y.; Zhou, L.; Ding, H.H.; Lewis, R.; Liu, Q.Y.; Guo, J. Microstructure evolution of railway pearlitic wheel steels under rolling-sliding contact loading. Tribol. Int. 2021, 154, 106685. [Google Scholar] [CrossRef]
  2. Zhang, S.Y.; Zhao, X.J.; Ding, H.H.; Spiryagin, M.; Guo, J.; Liu, Q.Y.; Wang, W.J.; Zhou, Z.R. Effects of dent size on the evolution process of rolling contact fatigue damage on defective rail. Wear 2021, 477, 203894. [Google Scholar] [CrossRef]
  3. Ding, H.; Mu, X.; Zhu, Y.; Yang, W.; Xiao, Q.; Wang, W.; Liu, Q.; Guo, J.; Zhou, Z. Effect of laser claddings of Fe-based alloy powder with different concentrations of WS2 on the mechanical and tribological properties of railway wheel. Wear 2022, 488–489, 204174. [Google Scholar] [CrossRef]
  4. Donzella, G.; Faccoli, M.; Mazzù, A.; Petrogalli, C.; Roberti, R. Progressive damage assessment in the near-surface layer of railway wheel–rail couple under cyclic contact. Wear 2011, 271, 408–416. [Google Scholar] [CrossRef]
  5. Zhang, S.Y.; Liu, Q.Y.; Wang, W.J.; Spiryagin, M.; Lin, Q.; Ding, H.H.; Wu, Q.; Zhou, Z.R. Implications of water medium for the evolution of rolling contact fatigue under rail surface defect conditions. Tribol. Int. 2022, 175, 107870. [Google Scholar] [CrossRef]
  6. Gao, N.; Dwyer-Joyce, R.S.; Beynon, J.H. Effects of surface defects on rolling contact fatigue of 60/40 brass. Wear 1999, 225–229, 983–994. [Google Scholar] [CrossRef]
  7. Zhao, X.J.; Guo, J.; Liu, Q.Y.; Butini, E.; Marini, L.; Meli, E.; Rindi, A.; Wang, W.J. Effect of spherical dents on microstructure evolution and rolling contact fatigue of wheel/rail materials. Tribol. Int. 2018, 127, 520–532. [Google Scholar] [CrossRef]
  8. Zhang, S.-Y.; Spiryagin, M.; Lin, Q.; Ding, H.-H.; Wu, Q.; Guo, J.; Liu, Q.-Y.; Wang, W.-J. Study on wear and rolling contact fatigue behaviours of defective rail under different slip ratio and contact stress conditions. Tribol. Int. 2022, 169, 107491. [Google Scholar] [CrossRef]
  9. Gao, N.; Dwyer-Joyce, R.S. The effects of surface defects on the fatigue of water-and oil-lubricated contacts. Proc. Inst. Mech. Eng. Part J. 2000, 214, 611–626. [Google Scholar] [CrossRef]
  10. Gao, N.; Dwyer-Joyce, R.S.; Grieve, D.G. Disc machine testing to assess the life of surface-damaged railway track. Proc. Inst. Mech. Eng.-Part F J. Rail Rapid Transit. 2001, 215, 261–275. [Google Scholar] [CrossRef]
  11. Seo, J.; Kwon, S.; Lee, D. Effects of surface defects on rolling contact fatigue of rail. Proc. Eng. 2011, 10, 1274–1278. [Google Scholar] [CrossRef]
  12. Zhao, X.J.; Guo, L.C.; Guo, J.; Liu, Q.Y.; Butini, E.; Marini, L.; Meli, E.; Rindi, A.; Wang, W.J. Effect of spherical and ballast dents on rolling contact fatigue of rail materials. Wear 2020, 450–451, 203254. [Google Scholar] [CrossRef]
  13. Zeng, D.; Xu, T.; Liu, W.; Lu, L.; Zhang, J.; Gong, Y. Investigation on rolling contact fatigue of railway wheel steel with surface defect. Wear 2020, 446–447, 203207. [Google Scholar] [CrossRef]
  14. Kráčalík, M.; Trummer, G.; Daves, W. Application of 2D finite element analysis to compare cracking behaviour in twin-disc tests and full scale wheel/rail experiments. Wear 2016, 346–347, 140–147. [Google Scholar] [CrossRef]
  15. Carroll, R.I.; Beynon, J.H. Rolling contact fatigue of white etching layer: Part 1: Crack morphology. Wear 2007, 262, 1253–1266. [Google Scholar] [CrossRef]
  16. Zhao, X.; An, B.; Zhao, X.; Wen, Z.; Jin, X. Local rolling contact fatigue and indentations on high-speed railway wheels: Observations and numerical simulations. Int. J. Fatigue 2017, 103, 5–16. [Google Scholar] [CrossRef]
  17. Innocenti, A.; Marini, L.; Meli, E.; Pallini, G.; Rindi, A. Development of a wear model for the analysis of complex railway networks. Wear 2014, 309, 174–191. [Google Scholar] [CrossRef]
  18. Daves, W.; Kubin, W.; Scheriau, S.; Pletz, M. A finite element model to simulate the physical mechanisms of wear and crack initiation in wheel/rail contact. Wear 2016, 366–367, 78–83. [Google Scholar] [CrossRef]
  19. Taraf, M.; Zahaf, E.H.; Oussouaddi, O.; Zeghloul, A. Numerical analysis for predicting the rolling contact fatigue crack initiation in a railway wheel steel. Tribol. Int. 2010, 43, 585–593. [Google Scholar] [CrossRef]
  20. Kaneta, M.; Murakami, Y. Effects of oil hydraulic pressure on surface crack growth in rolling/sliding contact. Tribol. Int. 1987, 20, 210–217. [Google Scholar] [CrossRef]
  21. Diab, Y.; Coulon, S.; Ville, F.; Flamand, L. Experimental investigations on rolling contact fatigue of dented surface using artificial defects: Subsurface analyses. In Proceedings of the 29th Leeds-Lyon Symposium on Tribology, Leeds, UK, 3–6 September 2002. [Google Scholar]
  22. Hertz, H. The contact of elastic solids. J. Reine. Angew. Math. 1881, 92, 156–171. [Google Scholar]
  23. Lewis, R.; Magel, E.; Wang, W.-J.; Olofsson, U.; Lewis, S.; Slatter, T.; Beagles, A. Towards a standard approach for the wear testing of wheel and rail materials. Proc. Inst. Mech. Eng. Part F J. Rail Rapid Transit. 2017, 231, 760–774. [Google Scholar] [CrossRef]
  24. Manson, S.S. Behavior of Materials Under Conditions of Thermal Stress; Manson BehaviorOM: Ann Arbor City, MI, USA, 1953. [Google Scholar]
  25. Ekberg, A.; Kabo, E.; Andersson, H. An engineering model for prediction of rolling contact fatigue of railway wheels. Fatig. Fract. Eng. Mater. Struct. 2002, 25, 899–909. [Google Scholar] [CrossRef]
  26. Su, X.; Xu, G.; Zhu, M.; Zhang, Q.; Cai, F.; Liu, M. Investigation on the interaction between corrosion and wear of U68CuCr rail steel with different corrosion periods. Wear 2023, 516–517, 204598. [Google Scholar] [CrossRef]
  27. Ekberg, A.; Kabo, E. Fatigue of railway wheels and rails under rolling contact and thermal loading—An overview. Wear 2005, 258, 1288–1300. [Google Scholar] [CrossRef]
  28. Chen, D.; Zhong, M.; Mou, M.; Xiao, Q.; Liu, X.; Yang, W.; Zhu, S.; Liu, B.; Lin, F.; Shi, X. Research on the damage mechanism of the rolling contact fatigue of a wheel–rail contact system under the influences of surface defects. Eng. Fail. Anal. 2024, 164, 108631. [Google Scholar] [CrossRef]
  29. Xu, K.W.; He, J.W.; Zhou, H.J. Effect of residual stress on fatigue behaviour of notches. Int. J. Fatig. 1994, 16, 337–343. [Google Scholar] [CrossRef]
Figure 1. RCF testing machine structure diagram: (1) driven shaft motion system, (2) hydraulic actuator, (3) driving shaft motion system, (4) work table, (5) hydraulic power station, (6) frame, (7) case, and (8) adjusting shims.
Coatings 15 00589 g001
Figure 2. Precision salt spray test machine, (1) corrosion chamber cover, (2) salt spray recovery device, (3) salt spray nozzle, (4) sample rack, (5) rail sample to be corroded, (6) pressure tank water inlet, (7) corrosion solution inlet, and (8) operation panel.
Coatings 15 00589 g002
Figure 3. (a) Surface appearance and (b) roughness of the corrosion-treated rail.
Coatings 15 00589 g003
Figure 4. Schematic diagram of the drop hammer impact testing apparatus: (1) positioning plate, (2) hammer body, (3) wheel disc, (4) punch, and (5) test bench.
Coatings 15 00589 g004
Figure 5. Surface defect (a) surface morphology, (b) size, and (c) distribution and cross-sectional sampling position.
Coatings 15 00589 g005
Figure 6. Wheel–rail disc (a) sampling position and (b) dimensions.
Coatings 15 00589 g006
Figure 7. Time-domain waveform diagram and time–frequency diagram of wheel–rail contact vibration velocity in three groups of tests: (a) the first group, (b) the second group, and (c) the third group.
Coatings 15 00589 g007
Figure 8. Defect surface morphologies for the first group of tests: (a) small defect, (b) medium defect, and (c) large defect; the second group of tests: (d) small defect, (e) medium defect, and (f) large defect; the third group of tests: (g) small defect, (h) medium defect, and (i) large defect.
Coatings 15 00589 g008
Figure 9. Defect volume change.
Coatings 15 00589 g009
Figure 10. SEM micrographs of cross-sections of three kinds of defects in the first group of tests: (a) small, (b) medium, and (c) large.
Coatings 15 00589 g010
Figure 11. SEM micrographs of cross-sections of three kinds of defects in the second group of tests: (a) small, (b) medium, and (c) large.
Coatings 15 00589 g011
Figure 12. SEM micrographs of cross-sections of three kinds of defects in the third group of tests: (a) small, (b) medium, and (c) large.
Coatings 15 00589 g012
Figure 13. Surface morphology of (a) small defects in the second group and (b) medium defects in the third group.
Coatings 15 00589 g013
Figure 14. RCF crack evolution process around the defect.
Coatings 15 00589 g014
Table 1. Chemical compositions of samples (wt.%).
CPMn SSiMnV
ER80.520.0160.0020.260.73≤0.06
U75V0.71–0.80≤0.03≤0.030.50–0.800.70–1.050.12
Table 2. Details of the three RCF trials.
No. of GroupsRail DiscWheel DiscRotating SpeedLoading ForceMaximum Contact Stress
1Corrosion time 0 hThere are 2 small defects, 2 medium defects, and 2 large defects1000 r/min2945 N1200 MPa
2Corrosion time 2 h
3Corrosion time 4 h
Table 3. Distribution of rust spots in the wheel–rail contact zone.
DefectDescription
Coatings 15 00589 i001When the contact zone contains small defects, the contact area has the most rust spots.
Coatings 15 00589 i002When the contact zone contains medium defects, the rust spots in the contact area are moderate
Coatings 15 00589 i003When the contact zone contains large defects, the rust spots in the contact area are minimal.
Disclaimer/Publisher’s Note: The statements, opinions and data contained in all publications are solely those of the individual author(s) and contributor(s) and not of MDPI and/or the editor(s). MDPI and/or the editor(s) disclaim responsibility for any injury to people or property resulting from any ideas, methods, instructions or products referred to in the content.

