Abstract
High-purity tantalum plates form inhomogeneous microstructures and texture gradients along the thickness through conventional rolling, which seriously affects the sputtering performance of the target. In this work, tantalum plates with a random microstructure were used on different rolling paths, such as those in unidirectional rolling (UR) and cross rolling (CR). The microstructure of the rolled tantalum plates was characterized using electron backscatter diffraction (EBSD), X-ray diffraction (XRD), and Vickers hardness (HV). The results indicated that the UR specimen exhibited the highest hardness values, with a gradual increase in hardness across the entire thickness layer from the surface to the center. Furthermore, specimens with different rolling directions demonstrated distinct texture gradient distributions throughout the thickness. The unidirectional rolling (UR) sample had a {110} (<110>//ND) texture on the surface and a {111} (<111>//ND) texture on the rest of its thickness. Compared with UR, cross rolling introduces more shear deformation, increases the content of the {100} (<100>//ND) texture, and weakens the {111} texture intensity everywhere except the center region. An increase in the rolling direction is beneficial for weakening the inhomogeneity between microstructures.
1. Introduction
Tantalum (Ta) is an excellent material for blocking the diffusion of copper and silicon in integrated circuits [1,2,3]. The diffusion barrier is produced by physical vapor deposition. A barrier layer with uniform thickness is a prerequisite for ensuring the stability of copper wiring and is also key in determining the yield rate and service performance of a chip [4,5]. Thickness uniformity is mainly affected by grain size and orientation [6,7,8]. Controlling both microstructural and textural homogeneity is key to ensuring the reliability of Ta targets. The sputtering yield of tantalum varies with orientation as S(110) > S(100) > S(111) [6]. The {111} (<111>//ND) texture is not desired in target sputtering, but the {111} texture is easy to produce in conventional rolling deformation processing and strengthened during the subsequent annealing [9,10]. Therefore, exploring the effects of rolling on the microstructure of tantalum plates is important.
During plastic deformation, the slip plane and slip direction of each grain in a polycrystalline material will rotate to the main deformation direction and form texture. High-purity tantalum has few heterogeneous atoms and high stacking fault energy, and the deformation condition of tantalum plates shows differences in terms of thickness during the rolling process. A change in the direction of deformation causes the microstructure to change as well [11]. Investigations on the evolution of deformed and recrystallized structures in body-centered cubic (BCC) tantalum have been performed, especially for clock cross rolling with a strain path turn of 135°. Zhiqing Zhang et al. [12] studied the texture evolution in the surface layer of high-purity tantalum plates fabricated by the unidirectional and 135° circumferential rolling processes. The results show that the unidirectional- and clock-rolled materials exhibit different textures. The unidirectional-rolled plate recrystallized more quickly than the clock-rolled plate. Y. H. Liu et al. [13] analyzed unidirectional-rolled (UR) and clock-rolled (CR) high-purity tantalum sheets with an emphasis on the microstructural difference in surface layers. The misorientation characteristics of deformed grains with different orientations were analyzed in detail by visualizing the misorientation angle based on an electron backscatter diffraction dataset. Haiyang Fan et al. [14] found that 135° clock rolling can largely alleviate the orientation-dependent stored energy caused by the different subdivision behaviors of grains with a γ-fiber texture (<111> direction//normal direction (ND)) and θ-fiber texture (<100> direction//ND) during unidirectional rolling. Jialin Zhu et al. [15] investigated the effects of strain on the deformation microstructure and texture as well as the subsequent recrystallization microstructure in 135° clock-rolled Ta sheets. The results show that after the annealing of the sample rolled 87%, a smaller average grain size and variation and relatively homogeneous texture distribution can be obtained.
Despite extensive surface layer analyses, the through-thickness evolution of texture gradients in rolled tantalum and their correlation with anisotropic mechanical properties remain unexplored. Studying the evolution and distribution of texture in tantalum sputtering targets along the thickness direction is a critical link connecting material preparation processes, microstructure regulation, and end-use application performance. By optimizing texture, it is possible to enhance both the service performance and cost-effectiveness of targets while also advancing the theoretical development of the design of high-end functional materials.
Therefore, the evolution of textures through the thickness of tantalum plates and the deformation mechanism in different orientations of grains were studied by changing the rolling direction in this work. To quantitatively analyze the changes in grain orientation and characterize the influence of the rolling direction on the sample, systematic characterization methods were used, including electron backscatter diffraction (EBSD), X-ray diffraction (XRD), and Vickers hardness (HV) testing.
2. Materials and Methods
The high-purity (99.995 wt.%) Ta ingot used in this experiment was obtained from Ningxia Orient Tantalum Industry Co., Ltd., Shizuishan, China, and was produced through electron beam melting. The main impurities were detected by a glow discharge mass spectrometer (GDMS) with a detection limit of parts per billion (ppb), and these impurities are listed in Table 1. The initial tantalum ingot was forged in multiple directions and annealed at 1200 °C for 60 min to obtain the sample, and then the sample was cut into plates with a thickness of 20 mm. A uniform loading force of 1 kg was used so that the hardness point could be loaded on one or a few deformed grains.

Table 1.
Impurity contents of high-purity Ta ingot (wt ppm).
Three 20 mm thick tantalum plates were prepared from the same ingot; another plate with the same thickness was unidirectional-rolled (UR), one plate was rolled using 90° cross rolling (CR1), and one plate was rolled using 45° clock rolling (CR2), as illustrated in Figure 1. All deformations were conducted at room temperature on a two-high rolling mill. The numbers indicate the rolling sequence. The total thickness reduction was 70% after 8 rolling passes (Table 2).
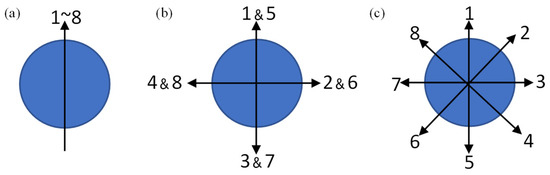
Figure 1.
A sketch of the rolling direction applied in the three samples. The numbers indicate the rolling sequence. (a) UR; (b) CR1; (c) CR2.
Table 2.
The rolling parameters of the three samples.
X-ray diffraction technology was used to measure the texture of the TD-RD plane. The maximum inclination angles of the (110), (200), and (211) pole figures were measured up to 90°. The orientation distribution function (ODF) was calculated from these pole diagrams using the arbitrarily defined unit (ADC) method.
The microstructure in the ND×RD plane was characterized by an EBSD (a scanning electron microscopy-based technique for crystallographic orientation analysis) detector mounted on a scanning electron microscope (SEM). The measurements were conducted at an accelerating voltage of 20 kV, and the corresponding data were post-processed using Channel 5 software (5.12.74.0., Oxford Instrument NanoAnalysis, Oxford, UK). Each texture component was defined with a spread of 0~15°. The texture and full-thickness microstructure test areas of the rolled sample are shown in Figure 2.

Figure 2.
Schematic diagram of test area for XRD, EBSD, and HV test.
The hardness of the rolled plates was tested using a hardness tester (THV-30MDT, Beijing Shengda Keyi Testing Equipment Co., Ltd., Beijing, China) at a load of 5 kg and dwell time of 15 s. Three measurements for each data point on the ND × RD plane were performed, and the average value was taken.
3. Results
3.1. Microstructure Distribution Through Thickness
The microstructure of the material before rolling was determined by sectioning a small sample along the thickness of the plate. An EBSD IPF map, which shows there is a relatively random orientation distribution before rolling, shown in Figure 3a, was generated with a step size of 15 µm. Figure 3b shows equiaxed undeformed grains, with an average grain size of 150 µm, and the grain sizes are distributed in 50–450 µm.
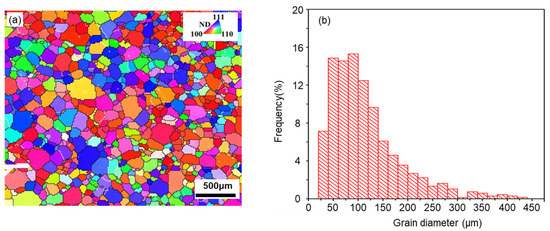
Figure 3.
Before rolling tantalum plate: (a) EBSD map of initial deformed sample, (b) grain size distribution.
A series of EBSD maps was collected along the thickness of the deformed sample using a 5 µm step size and merged by Channel 5 software. Figure 4 shows the entire through-thickness microstructures and orientation distribution of the tantalum plates. The entire through-thickness EBSD map was divided into 10 equal horizontal parts, with each one belonging to Parts 1–10. Most grains were rolled into elongated shapes. The orientation distribution of the grains in the entire through-thickness was inhomogeneous, and different regions showed different texture intensities.

Figure 4.
The merged map of the EBSD of the rolled microstructure of the tantalum plates after being 70% rolled. (a) UR; (b) CR1; (c) CR2.
Compared with the sample before rolling, the grain orientation distribution after rolling presents obvious characteristics. Rolling causes the splitting and rotation of grains, which can significantly change the grain orientation distribution of the initial sample. The surface layer (Part 1 and Part 10) of the UR sample mainly has a {110} texture, and the rest mainly has a {111} texture. The closer to the center layer, the greater the proportion of the {111} texture. The {110} texture is seen in the surface layer of the CR1 sample, and the {100} and {111} textures are alternately distributed with an increase in thickness. The orientations of the CR2 sample in Part 1 to Part 4 are relatively evenly distributed, and the center layer (Part 5) shows a strong {111} texture, but the thickness range is very narrow. The textures of the CR2 sample are slightly asymmetric, which may be due to the tilting of the tantalum plate during rolling. This makes the strain distribution asymmetric, resulting in asymmetric textures [16].
In order to quantify the variation in texture in the entire through-thickness, the area fractions of differently oriented grains with a misorientation of 0–15° were calculated as the corresponding texture proportion. The results are shown in Figure 5. There is shear deformation and friction on the surface of the rolled samples. During the compressive deformation process, it is easy for the {111} texture to appear. Cross rolling increases the shear deformation and makes the shear deformation go deeper. A change in the strain path is beneficial for reducing the {111} texture strength and increasing the {100} texture strength [17,18,19,20]. However, in this study, through the EBSD scanning of the whole thickness, some differences were found, and an increase in the rolling direction enhanced the {111} texture of the central layer. Compared with CR1, the rolling direction of CR2 increased. Due to the high stacking fault energy of tantalum, the shear deformation transmission thickness is limited, and compressive strain is generated in the center layer of the sample, causing the central layer grains to rotate to {111}, forming strong and stable {111} textures.
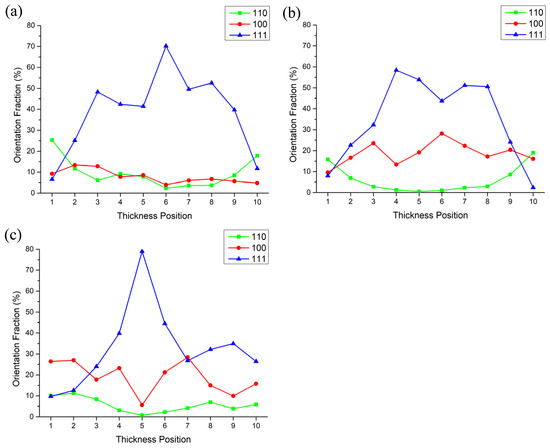
Figure 5.
Variation in {110}, {100}, and {111} textures with tantalum plate thickness after 70% rolling. (a) UR; (b) CR1; (c) CR2.
3.2. Hardness Distribution
The hardness of a material is related to grain size and dislocation density. Testing a material’s hardness can reflect the degree of deformation and hardening of the material [21]. The hardness distribution in the thickness direction of the UR, CR1, CR2, and initial samples is shown in Figure 6. The hardness value of the initial sample is uniform, with an average value of 70 HV5, which is mainly affected by the grain size. After rolling, the hardness value of the material increases with an increase in dislocation density. The hardness values of the UR sample are the highest. This shows that the hardness values of the entire thickness layer of a sample increase gradually from the surface layer to the center layer.

Figure 6.
Distribution of hardness values in thickness direction of rolled samples.
4. Discussion
4.1. Gradient of Local Misorientation Across Thickness Layers
A grain local misorientation analysis and statistical calculations were carried out using EBSD. Local misorientation refers to the misorientation between any data point inside each grain and adjacent data points in the EBSD scan data and is sensitive to subtle changes in the orientation within the grain. The orientation change within the grains in plastically deformed metals can be studied by using the local misorientation. Although dislocation density cannot be directly measured, the relative size of the dislocation density can be measured using the orientation change. Through the statistical analysis of Part 1–Part 5, that is, the local misorientation from the surface layer to the center, the difference in the degree of deformation of the rolled samples with different thickness layers is analyzed, and the results are shown in Figure 7. The deformation inhomogeneity between the surface layer and the center layer of the UR sample is large, which is weakened by cross rolling [14,22,23,24]. Part 5 of CR2 has a significantly higher value than the other parts, which also corresponds to the texture distribution in Figure 4.

Figure 7.
Distribution of local misorientation in thickness direction. (a) UR; (b) CR1; (c) CR2.
4.2. Correlation Between Local Misorientation and Grain Orientation
Notably, the inhomogeneity of local misorientation in the thickness direction is due to the non-uniform texture distribution and the accumulation of the difference between the deformed textures [25]. Dislocation substructures can be found in the {111} deformed grains, and almost no substructures are observed in the {100} deformed grains. EBSD scans with 0.5 µm steps for several deformed grains in Part 1 and Part 4 of the CR1 and CR2 samples are presented in Figure 8 and Figure 9, and there are clear differences in the local misorientation of different textures [26]. The local misorientation values in {100} deformed grains are mostly less than 1°, while in {111} and {110} deformed grains, the local misorientation has a higher value and density. Compared with the CR1 sample, the CR2 sample weakens the difference between {111} and {100} deformed grains by increasing the rolling direction. The local misorientation degree distribution of the deformed grains is related to the orientation. Orientation dependence can be attenuated by changing the strain path.

Figure 8.
Orientation (a,c) and local misorientation (b,d) maps of deformed grains from CR1 sample. (a,b) Surface layer, (c,d) center layer, (e,f) corresponding misorientation values in map.
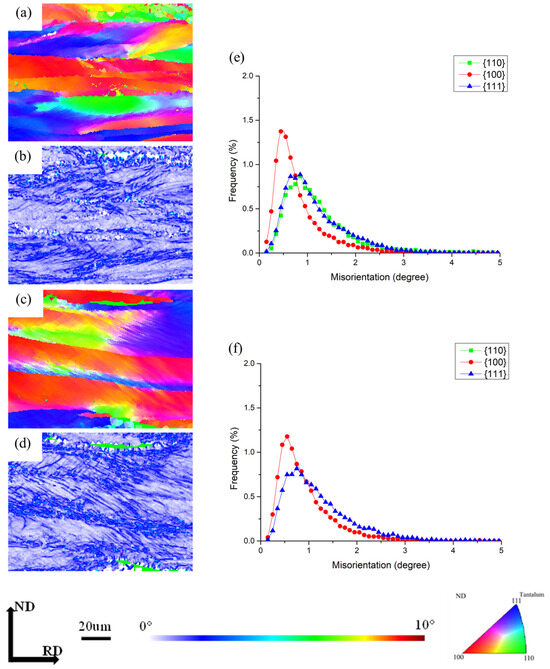
Figure 9.
Orientation (a,c) and local misorientation (b,d) maps of deformed grains from CR2 sample. (a,b) Surface layer, (c,d) center layer, (e,f) corresponding misorientation values in map.
The splitting gap of grains with different orientations and the uneven distribution of orientation in the thickness lead to a gradient change in the overall local misorientation inhomogeneity, which causes asynchronous recrystallization nucleation and grain growth in different regions of the sample during the subsequent annealing process. Cross rolling can increase the {100} texture, CR1 can effectively increase the depth of shear deformation along the thickness, and there is a large deformation difference between the {111} and {100} textures, which is further amplified in the subsequent annealing.
4.3. Correlation Between Microhardness of Deformed Grains and Crystal Orientation
In order to further verify the dependence of grain deformation degree on orientation, the orientation map and local misorientation map of the deformed grains around the hardness testing points were characterized by EBSD. As shown in Figure 10, apparently, the hardness of {111} deformed grains is larger than that of {100} deformed grains.

Figure 10.
Orientation maps (a–c) and the corresponding local misorientation maps (d–f) of some of the Vickers hardness test points in the deformed grains.
5. Conclusions
High-purity tantalum sheets were deformed by three rolling methods (i.e., UR, CR1, and CR2), and their microstructure and texture, especially the orientation-related microstructure in the surface and center layers, were analyzed in detail. The following main conclusions are drawn:
- A change in the rolling direction can control the texture type and distribution of tantalum plates. The increased {111} texture fraction from unidirectional rolling was confirmed by the higher hardness of {111} deformed grains versus their {100} counterparts, directly explaining the UR specimen’s maximum hardness. Cross rolling increases the depth of shear strain and improves the {100} texture. Through the reasonable matching of rolling methods, the required tantalum target microstructure can be produced.
- The rolled tantalum plate has a large texture gradient from the surface layer to the center layer, and the deformation degree of each thickness layer is also inhomogeneous. Compared with CR1, CR2 can effectively weaken the gradient in a certain thickness range, but it will increase the {111} texture strength of the center.
- The crystallographic orientation of tantalum is related to plastic deformation. After deformation, the degree of deformation of {100} grains is significantly lower than that of {111} grains. Increasing the rolling direction is beneficial for weakening the deformation difference between {111} grains and {100} grains.
Author Contributions
Conceptualization, Z.Z., J.L. and J.H.; Funding acquisition, Z.Z. and J.H.; Investigation, Z.Z. and J.L.; Methodology, Z.Z., J.L. and J.H.; Project administration, J.L and J.H.; Validation, Y.J.; Resources, J.L.; Supervision, J.H.; Visualization, J.G., Y.J. and J.B.; Writing—original draft, J.G., H.L. and J.B.; Writing—review & editing, Z.Z., J.G. and H.L. All authors have read and agreed to the published version of the manuscript.
Funding
This research received no external funding.
Institutional Review Board Statement
Not applicable.
Informed Consent Statement
Not applicable.
Data Availability Statement
Data is contained within the article.
Conflicts of Interest
Author Jianghao Bai was employed by the company Jiang Su Leader-Tech semiconductor Co. Ltd. Other authors were employed by the company Grikin Advanced Materials (Shandong) Co. Ltd.
References
- Kuo, Y.L.; Huang, J.J.; Lin, S.T.; Lee, C.; Lee, W.H. Diffusion barrier properties of sputtered TaNx between Cu and Si using TaN as the target. Mater. Chem. Phys. 2003, 80, 690–695. [Google Scholar] [CrossRef]
- Murarka, S.P. Advanced materials for future interconnections of the future need and strategy: Invited lecture. Microelectron. Eng. 1997, 37–38, 29–37. [Google Scholar] [CrossRef]
- Oku, T.; Kawakami, E.; Uekubo, M.; Takahiro, K.; Yamaguchi, S.; Murakami, M. Diffusion barrier property of TaN between Si and Cu. Appl. Surf. Sci. 1996, 99, 265–272. [Google Scholar] [CrossRef]
- Kurkuchekov, V.V.; Atlukhanov, M.G.; Burdakov, A.V.; Danilov, V.; Popov, S.; Skovorodin, D.; Trunev, Y.; Kholopov, M.; Popov, A.; Lemzyakov, A.; et al. Soft X-ray radiography for measurements of a dense metal plasma created by intense relativistic electron beam on a tantalum target. J. Instrum. 2022, 17, P06019. [Google Scholar] [CrossRef]
- Chen, W.C.; Wang, Z.Y.; Yu, C.Y.; Liao, B.-H.; Lin, M.-T. A study of the phase transformation of low temperature deposited tantalum thin films using high power impulse magnetron sputtering and pulsed DC magnetron sputtering. Surf. Coat. Tech. 2022, 436, 128288. [Google Scholar] [CrossRef]
- Michaluk, C.A. Correlating discrete orientation and grain size to the sputter deposition properties of tantalum. J. Electron. Mater. 2002, 31, 2–9. [Google Scholar] [CrossRef]
- Zhang, Z.; Kho, L.; Wickersham, C.E. Effect of grain orientation on tantalum magnetron sputtering yield. J. Vac. Sci. Technol. A 2006, 24, 1107–1111. [Google Scholar] [CrossRef]
- Michaluk, C.A.; Field, D.P.; Nibur, K.A.; Wright, S.I.; Witt, R.A. Effects of Local Texture and Grain Structure on the Sputtering Performance of Tantalum. Mater. Sci. Forum. 2002, 408–412, 1615–1620. [Google Scholar] [CrossRef]
- Fan, H.Y.; Liu, S.S.F.; Deng, C.; Wu, X.D.; Cao, L.F.; Liu, Q. Quantitative analysis: How annealing temperature influences recrystallization texture and grain shape in tantalum. Int. J. Refract. Met. Hard Mater. 2018, 72, 244–252. [Google Scholar] [CrossRef]
- Briant, C.L.; MacDonald, E.; Balliett, R.W.; Luong, T. Recrystallization textures in tantalum sheet and wire. Int. J. Refract. Met. Hard Mater. 2000, 18, 1–8. [Google Scholar] [CrossRef]
- Suwas, S.; Singh, A.K. Role of strain path change in texture development. Mater. Sci. Eng. A 2003, 356, 368–371. [Google Scholar] [CrossRef]
- Zhang, Z.Q.; Chen, D.D.; Zhao, H.; Liu, S.F. A comparative study of clock rolling and unidirectional rolling on deformation/recrystallization microstructure and texture of high purity tantalum plates. Int. J. Refract. Met. Hard Mater. 2013, 41, 453–460. [Google Scholar] [CrossRef]
- Liu, Y.H.; Liu, S.F.; Zhu, J.L.; Deng, C.; Fan, H.Y.; Cao, L.F.; Liu, Q. Strain path dependence of microstructure and annealing behavior in high purity tantalum. Mater. Sci. Eng. A 2017, 707, 518–530. [Google Scholar] [CrossRef]
- Fan, H.Y.; Liu, S.F.; Li, L.J.; Deng, C.; Liu, Q. Largely alleviating the orientation dependence by sequentially changing strain paths. Mater. Des. 2016, 97, 464–472. [Google Scholar] [CrossRef]
- Zhu, J.L.; Liu, S.F.; Yang, S.; Long, D.D.; Liu, Y.H.; Yuan, X.L.; Orlov, D. Strain dependence of deformation and recrystallization microstructure homogeneity in clock-rolled tantalum sheets. Mater. Charact. 2020, 161, 110165. [Google Scholar] [CrossRef]
- Bhattacharyya, A.; Knezevic, M.; Abouaf, M. Characterization of Crystallographic Texture and Intra-Grain Morphology in Cross-Rolled Tantalum. Metall. Mater. Trans. A 2015, 46, 1085–1096. [Google Scholar] [CrossRef]
- Deng, C.; Liu, S.F.; Fan, H.Y.; Hao, X.B.; Ji, J.L.; Zhang, Z.Q.; Liu, Q. Elimination of Elongated Bands by Clock Rolling in High-Purity Tantalum. Metall. Mater. Trans. A 2015, 46, 5477–5481. [Google Scholar] [CrossRef]
- Liu, Y.H.; Liu, S.F.; Fan, H.Y.; Deng, C.; Cao, L.F.; Ni, H.T.; Liu, Q. Orientation-dependent grain boundary characteristics in tantalum upon the change of strain path. Mater. Charact. 2019, 154, 277–284. [Google Scholar] [CrossRef]
- Zhu, J.; Liu, S.; Yuan, X.; Liu, Q. Comparing the Through-Thickness Gradient of the Deformed and Recrystallized Microstructure in Tantalum with Unidirectional and Clock Rolling. Materials 2019, 12, 169. [Google Scholar] [CrossRef]
- Bhattacharjee, P.P.; Joshi, M.; Chaudhary, V.P.; Zaid, M. The effect of starting grain size on the evolution of microstructure and texture in nickel during processing by cross-rolling. Mater. Charact. 2013, 76, 21–27. [Google Scholar] [CrossRef]
- Baton, J.; Geslin, W.; Moussa, C. Influence of crystallographic orientation on the recrystallization of pure tantalum through microstructure-based estimation of the stored energy. Int. J. Refract. Met. Hard Mater. 2022, 104, 105786. [Google Scholar] [CrossRef]
- Pokross, C. Controlling the texture of tantalum plate. JOM 1989, 41, 46–49. [Google Scholar] [CrossRef]
- Kang, J.Y.; Seong, W.; Jun, Y.; Seong, J.; Song, Y.H.; Sung, T.; Kim, G.; Kyeong, W. Effect of Cross Rolling on the Development of Textures in Tantalum. J. Korean Soc. Heat Treat. 2018, 31, 275–282. [Google Scholar] [CrossRef]
- Godfrey, A.; Cao, W.Q.; Liu, Q.; Hansen, N. Stored energy, microstructure, and flow stress of deformed metals. Metall. Mater. Trans. A 2005, 36, 2371–2378. [Google Scholar] [CrossRef]
- Sandim, H.R.Z.; Martins, J.P.; Pinto, A.L.; Padilha, A.F. In-grain and Grain-to-Grain Textural Inhomogeneities in Coarse-Grained Tantalum. Mater. Sci. Forum 2004, 467–470, 507–512. [Google Scholar] [CrossRef]
- Michaluk, C.A.; Nowell, M.M.; Witt, R.A. Quantifying the recrystallization texture of tantalum. JOM 2002, 54, 51–54. [Google Scholar] [CrossRef]
Disclaimer/Publisher’s Note: The statements, opinions and data contained in all publications are solely those of the individual author(s) and contributor(s) and not of MDPI and/or the editor(s). MDPI and/or the editor(s) disclaim responsibility for any injury to people or property resulting from any ideas, methods, instructions or products referred to in the content. |
© 2025 by the authors. Licensee MDPI, Basel, Switzerland. This article is an open access article distributed under the terms and conditions of the Creative Commons Attribution (CC BY) license (https://creativecommons.org/licenses/by/4.0/).