Article

Impact of Scanning Speed on Microstructure and Mechanical and Thermal Expansion Properties of Fe-36Ni Alloy Fabricated by Selective Laser Melting

1
Hebei Short Process Steelmaking Technology Innovation Center, School of Materials Science and Engineering, Hebei University of Science and Technology, Shijiazhuang 050018, China
2
Juli Rigging Co., Ltd., Baoding 072550, China
3
HBIS Group Technology Research Institute, Shijiazhuang 052165, China
*
Authors to whom correspondence should be addressed.
Coatings 2025, 15(5), 572; https://doi.org/10.3390/coatings15050572 (registering DOI)
Submission received: 12 April 2025 / Revised: 30 April 2025 / Accepted: 8 May 2025 / Published: 10 May 2025
(This article belongs to the Special Issue Laser Surface Engineering: Technologies and Applications)

Abstract

:
The Fe-36Ni alloy, with ultra-low thermal expansion and stable properties, is essential for aerospace remote sensors and aircraft load-bearing structures, widely used in aerospace. Additive Manufacturing, an emerging rapid prototyping technology with short cycles, high efficiency, and flexibility, addresses complex structural fabrication challenges. While selective laser melting (SLM) enables complex geometry fabrication, post-process treatments (e.g., annealing-induced homogenization, thermal aging for stress relief, surface polishing) remain critical for attaining metallurgical stability in as-built components. The impact of different laser scanning speeds (500 mm/s, 1000 mm/s, 1500 mm/s, 2000 mm/s) on the microstructure and mechanical and thermal expansion properties of the Fe-36Ni alloy fabricated by selective laser melting was studied. The results indicate that all Fe-36Ni alloys predominantly exhibit the γ-phase. Interestingly, a small amount of α precipitates was also observed, which is primarily attributed to the formation of a supercooled region. Notably, at a scanning speed of 1000 mm/s, the Fe-36Ni alloy samples exhibit optimal mechanical properties, with a tensile strength of 439 MPa and an elongation of 49.0%. This improvement is primarily attributed to the enhanced molding quality and grain refinement. The minimum coefficient of thermal expansion occurs at a scanning speed of 2000 mm/s, likely due to the elevated defect density.

1. Introduction

The Fe-36Ni alloy, commonly known as Invar, is a low-expansion alloy within the Fe-Ni system, characterized by its exceptionally low coefficient of thermal expansion and stable physical properties [1,2,3]. These attributes make it an ideal material for applications in space remote sensors, space optical measurement systems, structural components in waveguides, satellite positioning apparatuses, and even the primary bearing structures of aircraft. As a result, the Fe-36Ni alloy is extensively used in the aerospace industry [2,4,5]. However, in traditional manufacturing processes for Invar alloys, the generation of high-toughness swarf on the cutting surface presents significant challenges. This not only accelerates tool wear but also reduces productivity and increases production costs, particularly when machining geometrically complex Fe-36Ni alloy components [6,7,8].
Selective laser melting (SLM), a laser-based rapid prototyping technology, offers high molding precision and enables the direct fabrication of difficult-to-machine materials and complex, high-precision parts [9,10,11,12]. This capability effectively addresses several challenges associated with conventional machining, positioning SLM as one of the most promising and efficient technologies for precision alloy manufacturing [13,14,15]. Harrison et al. [16] demonstrated that the coefficient of thermal expansion of an Fe-36Ni alloy fabricated by SLM significantly outperformed that of conventionally forged samples, remaining negative up to 100 °C. This behavior is primarily attributed to the residual stresses induced during the SLM process. The study of residual stresses on material properties is particularly important. Residual stresses are an inevitable consequence of manufacturing processes, with complex interactions between their generation mechanisms and material performance. While compressive stresses often enhance fatigue and wear resistance, tensile stresses generally degrade structural integrity. Effective management—through process optimization (e.g., controlled cooling), post-treatment (e.g., stress relief annealing), or surface engineering (e.g., laser shock peening)—is critical to harnessing their benefits. Future research should focus on the multi-scale modeling of residual stress evolution and their synergistic effects with environmental factors [17,18]. Asgari et al. [19] investigated the effects of varying laser power parameters on the microstructure, porosity, and thermal expansion characteristics of an SLM-formed Fe-36Ni alloy. Their results revealed that as laser power increased from 250 W to 400 W, the melting mode transitioned from the conduction mode to the keyhole mode, leading to a reduction in pore volume fraction and a corresponding increase in thermal expansion displacement. Li et al. [20] investigated the optimization of post-heat treatment on the microstructure and properties of an SLM-formed Fe-36Ni alloy. They found that a ‘solution + tempering + aging’ composite heat treatment resulted in elongation at break values of 44% and 48.5% in the transverse and longitudinal directions, respectively. This enhancement in plasticity, compared to as-printed SLM samples, is closely linked to the influence of heat treatment processes on the formation and evolution of internal voids and other defects within the specimens. Overall, these findings highlight the significant impact of both SLM processing parameters and heat treatment procedures on the microstructure, mechanical properties, and thermal expansion behavior of the Fe-36Ni alloy.
It is well known that various parameters, such as scanning speed, layer thickness, spot diameter, laser power, and scanning spacing, among others [21,22,23], significantly influence the microstructure, fabrication, and mechanical properties of metal parts during the SLM process. Improper process parameters lead to high susceptibility to the formation of internal defects, such as unfused regions, shrinkage voids, pores, and thermal cracks [24,25,26,27]. Among them, scanning speed is a key and fundamental process parameter in the SLM process, which has a significant impact on the molding quality, microstructure, and properties of alloys. It has been shown in a number of studies that a variation in scanning speed directly affects the action time and energy input density of the laser energy on the powder layer, which in turn affects the dynamic behavior of the melt pool, the solidification process, and the final microstructure morphology [28]. However, current studies on the preparation of Fe-36Ni alloys using SLM methods remain limited and lack comprehensive analysis. Therefore, it is essential to systematically investigate the effects of process parameters on SLM-formed Fe-36Ni alloys. In this study, Fe-36Ni alloys were fabricated using the SLM method under varying scanning speed parameters. In order to more clearly analyze the effects of a single factor on Fe-36Ni alloys and to avoid the interference of complex interactions caused by the simultaneous changes in multiple parameters, we chose to fix the other parameters and change only the scanning speed. In the preliminary pre-experiment and related literature research [29], it was found that it is difficult to accurately determine the specific contribution of each parameter to the final results when multiple parameters are varied at the same time. By focusing on a single variable, the scanning speed, through the controlled variable method, the relationship between it and the microstructure and properties of the alloy can be more directly observed and analyzed, thus providing clearer guidance for process optimization. Through an in-depth analysis of the evolution of microstructure, mechanical properties, and thermal expansion behavior, the mechanisms underlying microstructure and performance optimization were thoroughly explored. These findings address a critical knowledge gap in parameter–performance relationships, overcome the traditional trade-off between defect reduction and mechanical enhancement, and provide a solid theoretical and technical foundation for the fabrication of Fe-36Ni alloy components with complex structures via SLM.

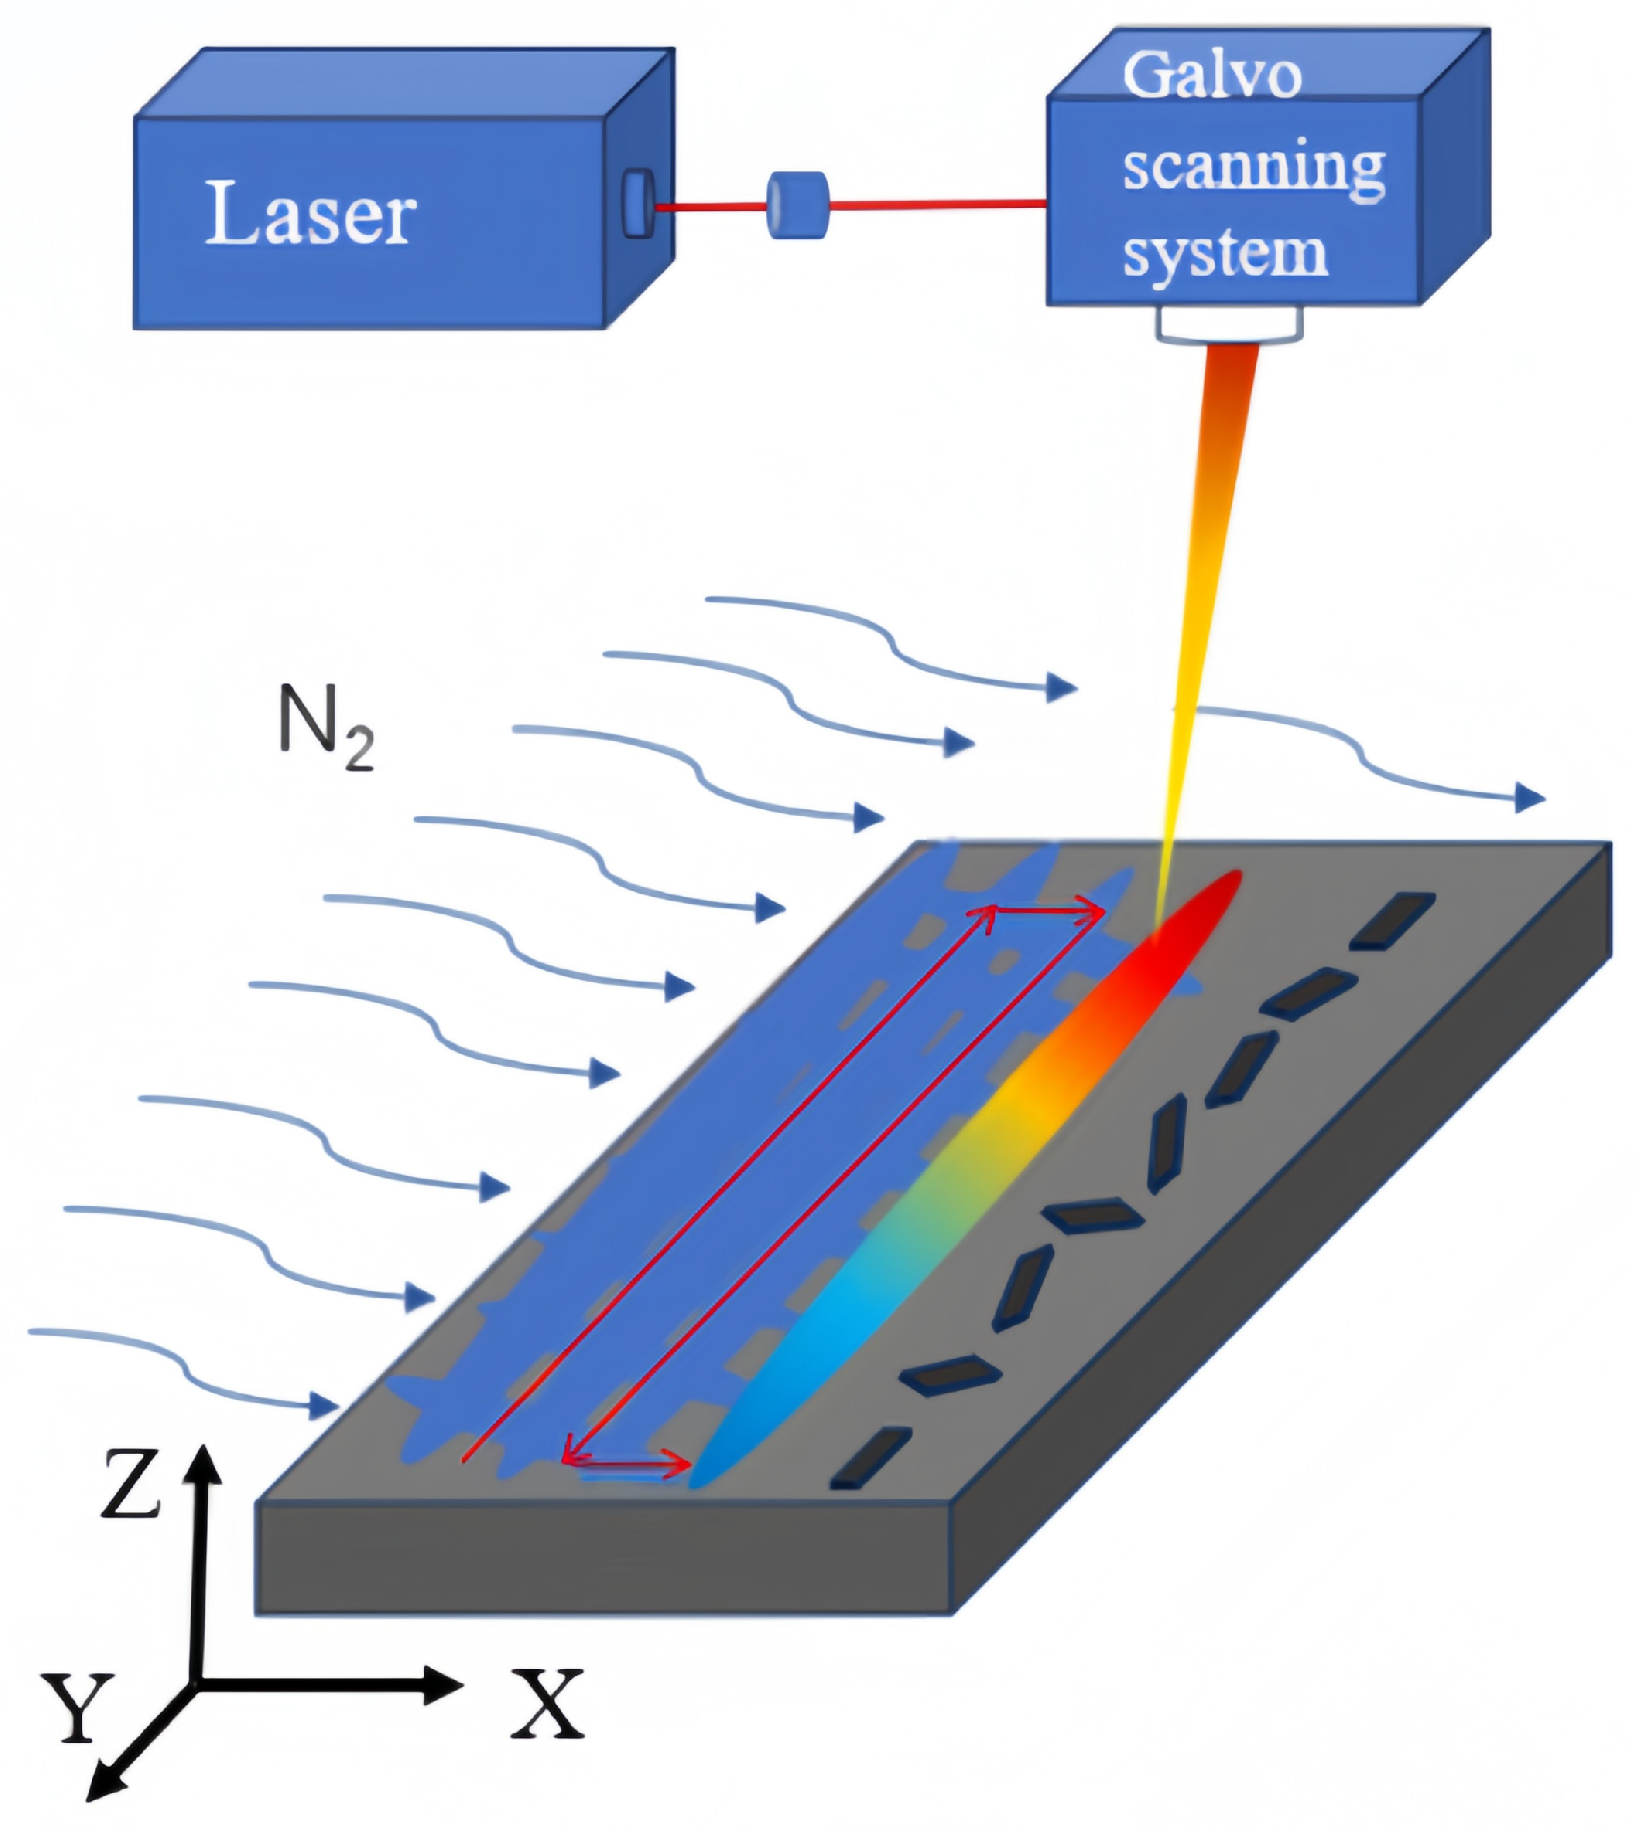
2. Materials and Methods

The raw material used in this study is Fe-36Ni alloy powder, which was produced using the vacuum air atomization method and supplied by Hebei Jingye Additive Manufacturing Technology Co., Ltd. in Shijiazhuang of China The detailed composition of the powder is provided in Table 1. The SEM morphology of the Invar alloy powder is shown in Figure 1, where it can be seen that the powder is almost spherical, with a smooth surface and no obvious defects; the particle size distribution is narrow between 15 and 53 μm; and the average diameter (D50) is 28.65 μm. The results from the Hall flowmeter show that the powder has a good flowability, and the flow time for 50 g of the powder is 27.4 s. The apparent density and vibrational density of the powder are found to be 4.51 g/cm3 and 5.20 g/cm3, and they were also measured to calculate the Hausner ratio. The apparent and solidified densities of the powder were found to be 4.51 g/cm3 and 5.20 g/cm3, which were also measured to calculate the Hausner ratio. The Hausner ratio was found to be about 1.15, which indicates that the powder has excellent flowability.
SLM experiments were conducted using an EOS M290 machine supplied by Tornens Technology (Shanghai) Co. in Shanghai of China, which operates with a laser wavelength of 1070 nm and a spot size of 84 μm. The substrate material was 316 L stainless steel, with dimensions of 200 mm × 200 mm × 30 mm. The substrate was first polished using sandpaper and subsequently cleaned ultrasonically with anhydrous ethanol. To eliminate moisture from the alloy powder, it was placed in a DZF-6050 vacuum drying oven supplied by Yangzhou Sanfa Electronics Co. in Yangzhou of China, prior to the SLM process, where it was subjected to a drying treatment at 140 °C for 2 h. The SLM experiments were conducted using a row-by-row alternating scanning mode, under an argon atmosphere for protection. A meander scan strategy was employed, in which the raster pattern was rotated by 90° after each layer to fabricate the samples. During the fabrication process, parameters such as hatch spacing, point distance, and exposure time were maintained constant for all samples. Ultimately, a thin rectangular specimen with dimensions of 10 mm (X) × 10 mm (Y) × 100 mm (Z) was produced, and the machining schematic diagram is shown in Figure 2. Based on the parameters, such as laser power ( P ), scanning speed ( V ), exposure hatch spacing (h), layer thickness ( t ), and so on, the laser energy density ( E v ) can be calculated, and the specific formula can be expressed as E v = P V · h · t [30]. In this work, several scanning speed parameters were selected to realize different values of E v . The corresponding laser parameters and their associated values are presented in Table 2.
A D/MAX-2500 X-ray diffractometer (XRD) supplied by Rigaku Corporation in Tokyo of Japan was used to analyze the phase composition of the samples. The radiation source employed was a Cu-Kα target, operating at a voltage of 40 kV and a current of 200 mA, with a scanning range of 30° to 100° and a scan speed of 4°/min. Samples of the required dimensions were sectioned along the horizontal cross-section (X-Y plane) and the side-view cross-section (X-Z plane) using a wire cutter. Subsequently, they were polished and etched with a solution consisting of 4 g CuSO4, 20 mL HCl, 12 mL H2SO4, and 25 mL H2O for approximately 5 s. The optical microstructure (OM) of all samples on the X-Y plane was examined using a Zeiss metallographic microscope supplied by Carl Zeiss Vision (China) Co. in Guangzhou of China. Grain size measurements were performed using Image-Pro Plus 6.0 software, with at least 25 sets of data collected from each specimen to calculate the average grain size. To further investigate the microstructure on the X-Z plane, electron backscatter diffraction (EBSD) analysis was conducted using a TESCAN MAIA3 microscope supplied by Tyscan Trading (Shanghai) Co. in Shanghai of China to obtain the grain size distribution in 1 μm increments.
Tensile properties along the Z-axis direction at room temperature were tested using an INSTRON-5982 universal mechanical testing machine supplied by Instron (Shanghai) Test Equipment Trading Co. in Shanghai of China according to ASTM standard E8M. Bone-shaped sheet specimens were selected, with a machined initial gauge length of 3 mm × 2 mm × 21 mm, and the tensile strain rate was set to 5 × 10⁻⁴ s−1. Each process parameter was tested three times to ensure data accuracy. Thermal expansion measurements were performed on cylindrical samples with dimensions of 20 mm in length and 6 mm in diameter, with specimen ends polished to smooth, flat surfaces to eliminate oxide layer effects prior to testing, within a temperature range of −100 °C to 200 °C, using the mechanical expansion measurement technique according to ASTM standard E831. The density of cubic samples was measured at room temperature and atmospheric pressure using the Archimedes method. Each sample was weighed directly on a density balance and immersed in distilled water. The density of water at room temperature is 1 g/cm3, and the bulk density of the Fe-36Ni alloy is 8.05 g/cm3. The density ( ρ ) and relative density ( ρ r ) of each sample can be obtained using the equations ρ = W 1 W 1 W 2 · ρ w and ρ r % = ρ ρ 1 % [31].

3. Results and Discussion

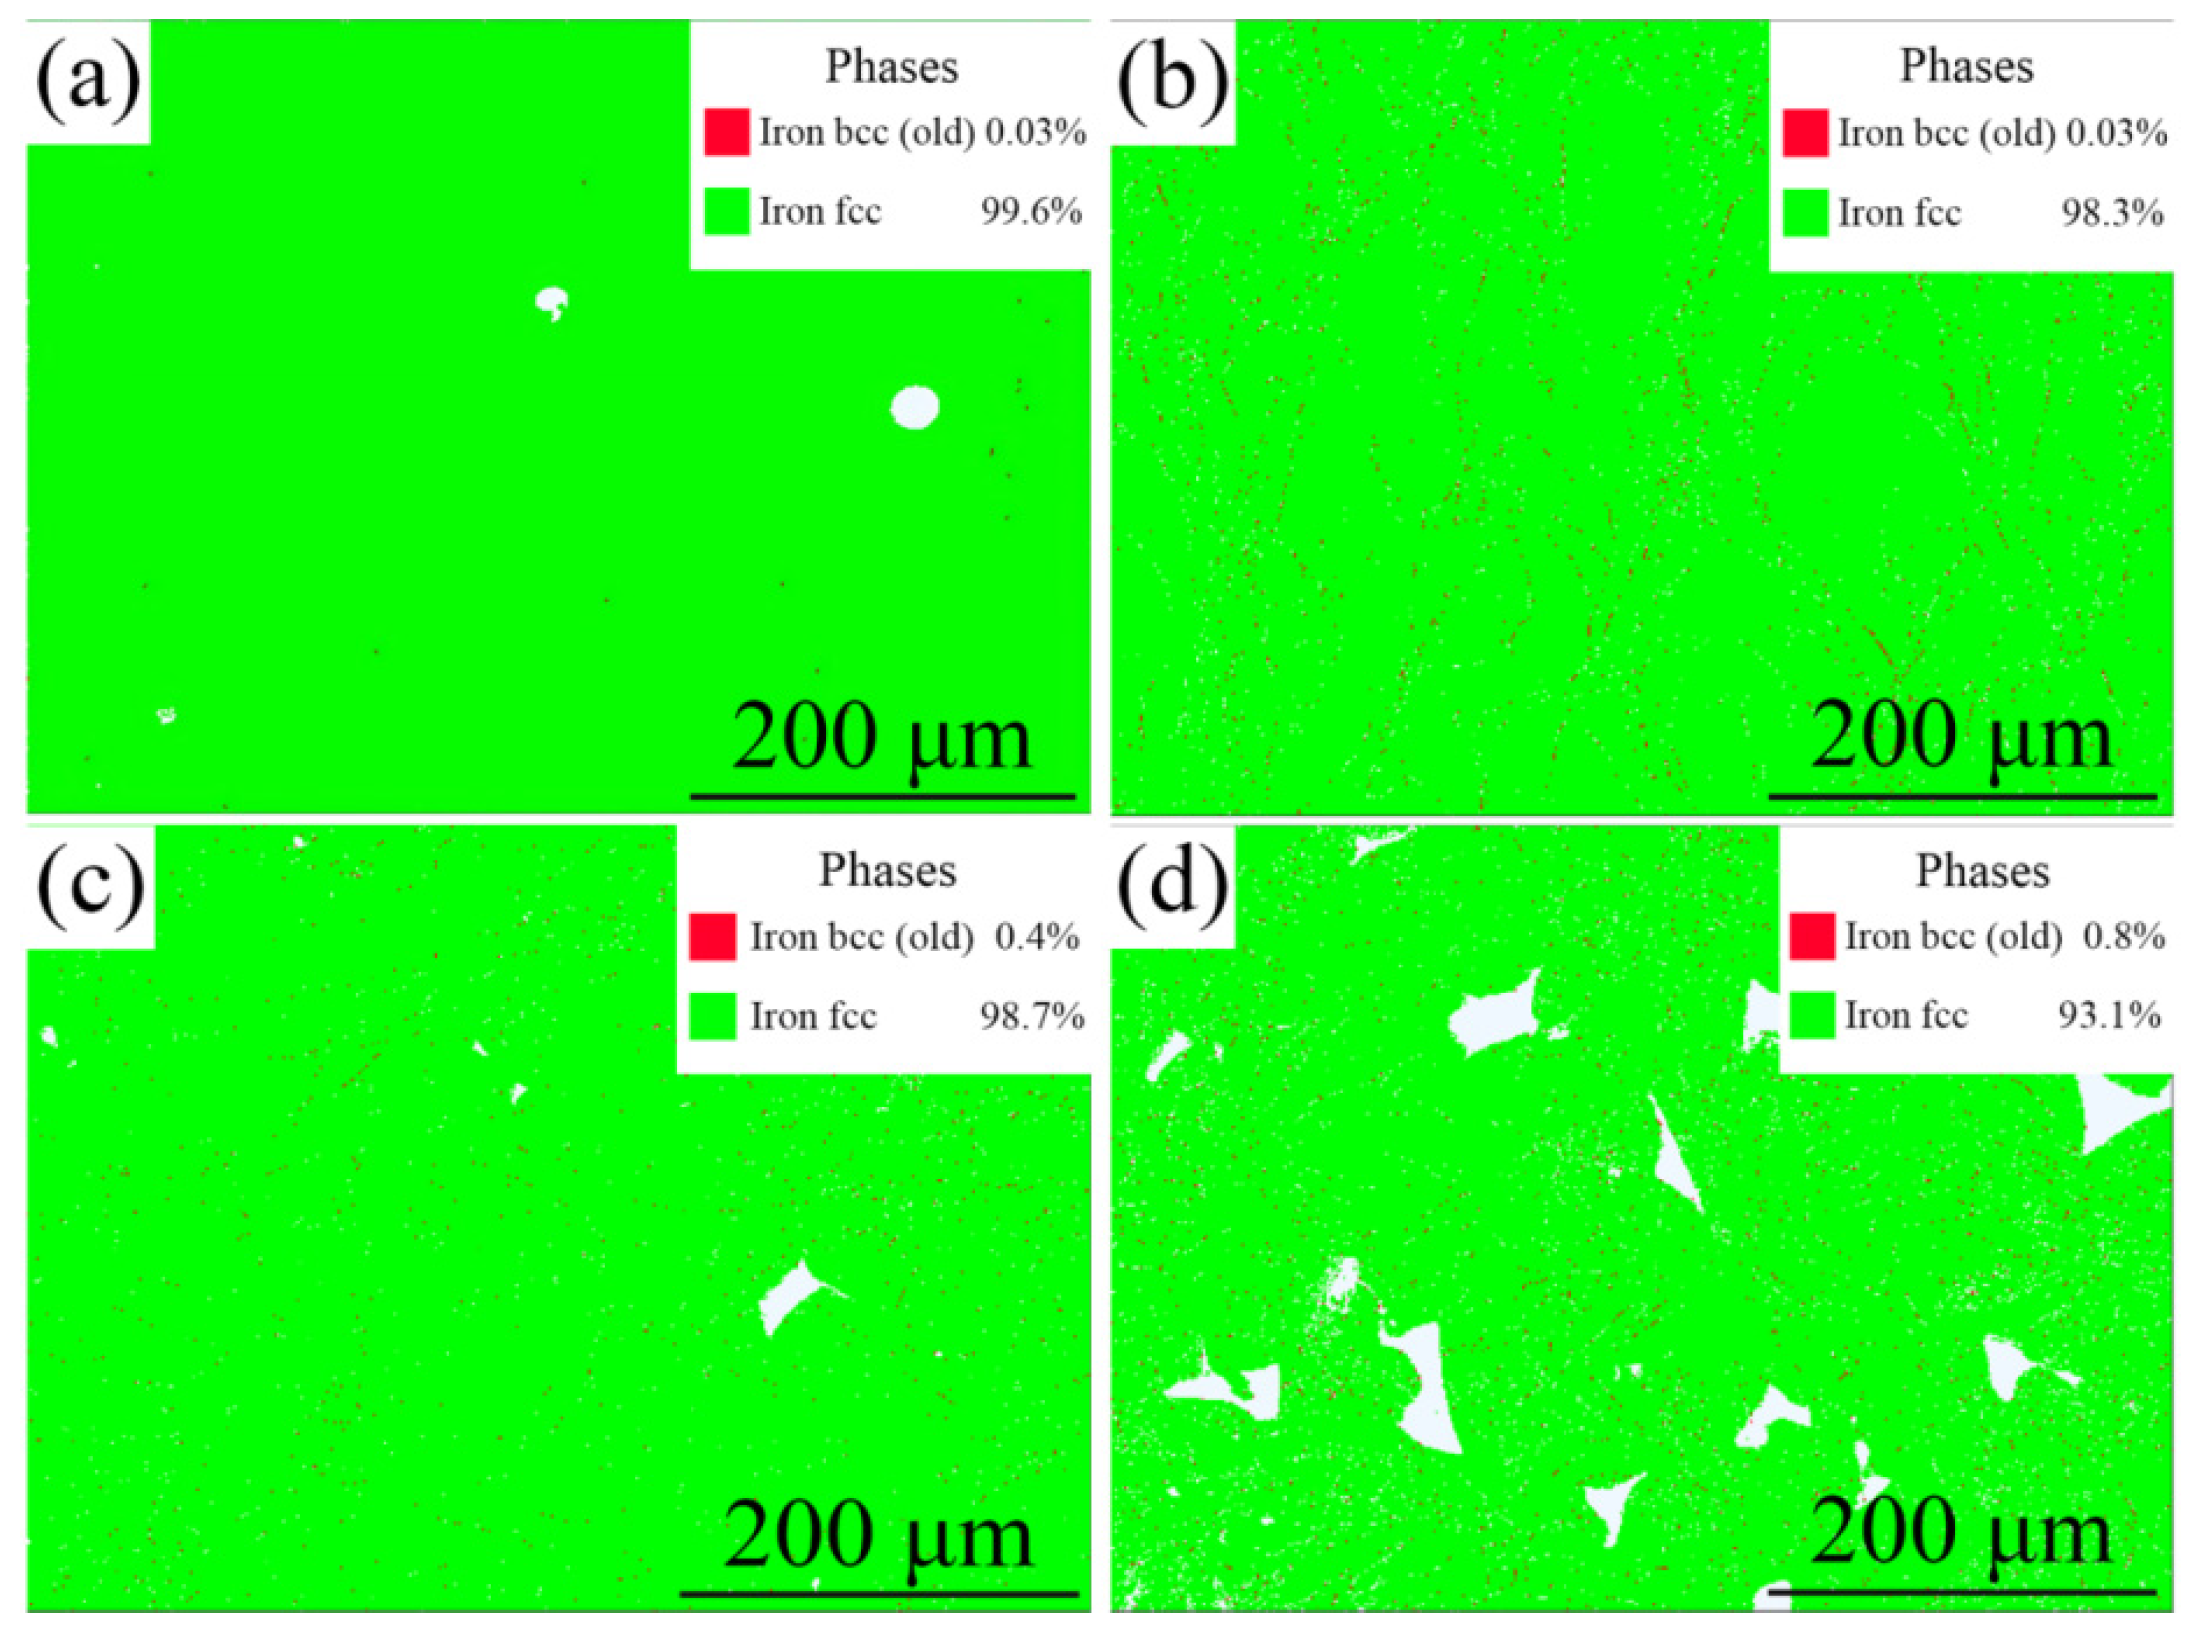
3.1. Phase and Microstructure

The XRD patterns of the SLM-formed Fe-36Ni alloy at different scanning speeds are presented in Figure 3. A comparison of the XRD peaks with the corresponding PDF cards reveals that the Fe-36Ni alloy predominantly exhibits the γ-phase (austenite phase) with a face-centered cubic (FCC) structure, with no detectable peaks corresponding to the α-phase (body-centered cubic, BCC, structure) in any of the samples. This suggests that the scanning speed has minimal influence on the phase composition of the SLM samples within the energy density range applied in this study. The absence of α-phase peaks in the XRD patterns of all SLM samples may be attributed to the absence of phase transformation during the SLM process. Alternatively, it is possible that the volume fraction of the α-phase in the samples was too low to be detected by XRD. In the earlier literature, researchers focused on the effects of laser energy density (VED) on the phase composition of Fe-36Ni 36 alloys, where the alloys showed excellent metallurgical bonding and a single γ (Fe, Ni)-phase at a VED of 89.29 J/mm, resulting in the best molding quality. In this study, we focus on the effects of laser scanning speed on SLM-molded Fe-36Ni alloys. In spite of the different variables studied, they show consistent results in terms of phase composition: no deleterious α-Fe phase is detected, indicating that Fe-36Ni alloys tend to form a stable γ-phase under different process parameter modulations [32].
The microscopic morphologies of the horizontal cross-section (X-Y plane) of the SLM-formed Fe-36Ni alloy specimens, processed under varying scanning speed parameters, are shown in Figure 4. Distinct white stripes, representing melt pool traces, are observed across all samples. Additionally, Figure 3 reveals that the grain boundaries predominantly exhibit a rounded or polygonal shape. This morphology suggests that the rounded or polygonal boundaries correspond to the cross-sectional structure of the columnar γ grains, which form due to the tendency of γ grains to grow along the direction of the maximum temperature gradient during the rapid SLM process.
Furthermore, Figure 4 highlights variations in porosity among the SLM alloy samples subjected to different scanning speed conditions. A minimal number of small, rounded pores are observed in the V-500 sample, as indicated by the circles in Figure 4a. Previous studies have shown that the Fe-36Ni alloy, which consists predominantly of Fe and Ni, undergoes the vaporization of a small amount of nickel during the SLM process when the laser scanning speed is insufficient [4].
This is attributed to the relatively low boiling point of nickel. Vaporization occurs because the energy absorbed by the powder becomes excessive, causing porosity formation as nickel fails to escape during the rapid melting and solidification process. The V-1000 sample exhibits strong bonding between the melt pools, with no detectable pore defects (see Figure 4b), suggesting that laser scanning speed plays a critical role in influencing powder fluidity and, consequently, the development of porosity. In contrast, the V-1500 and V-2000 samples contain numerous unfused pores (highlighted within circles in Figure 4c,d), with the V-1500 sample displaying elongated, strip-like pores, while the V-2000 sample shows a more polygonal or elongated morphology, accompanied by a significantly higher number of pores, indicating the highest porosity level. This increase in laser scanning speed appears to substantially enhance the flow rate and instability of the molten pool. An unstable melt pool tends to disperse material away from the build surface rather than advancing steadily along the laser scanning direction, leading to a marked increase in porosity.
Figure 5 presents Inverse Pole Figure (IPF) images of Fe-36Ni alloy specimens fabricated by SLM, showing the lateral (X-Z plane) side under various scanning speed conditions. The multicolored grains in the IPF maps represent different crystallographic orientations, with the variation in grain color indicating the absence of a preferred crystallographic orientation in the Fe-36Ni alloy. As shown in Figure 4, the austenite grain morphology across all samples predominantly exhibits a columnar or cupular shape, which is closely associated with the melt pool’s solidification pattern during the SLM process [33].
The earlier literature indicated an increase in grain size with an increase in VED due to the fact that an increase in VED reduces supercooling and decreases nucleation density, resulting in a stronger tendency for grain growth. In our study, austenite grain size decreases significantly with increasing laser scanning speed. The average grain size is about 93 µm at a scanning speed of 500 mm/s, decreases to about 51 µm at an increased scanning speed of 1500 mm/s, and further increases to 2000 mm/s, resulting in the formation of a pronounced fine grain structure. This shows that the effects of scanning speed and VED on grain size show opposite trends. An increase in scanning speed accelerates the cooling rate of the melt pool, which increases the subcooling degree and the nucleation rate, thus inhibiting the growth of the grains and leading to a decrease in grain size, while an increase in VED reduces the subcooling degree and promotes the growth of the grains [34].
A thorough examination of the IPF images reveals a significant reduction in the size of austenite grains with increasing laser scanning speed. The statistical distribution of grain sizes for the different samples is shown in Figure 6. In the V-500 sample, the average grain size is approximately 93 μm. However, when the scanning speed is increased to 1500 mm/s, the average grain size in the V-1500 sample decreases substantially to about 51 μm. Further increasing the scanning speed to 2000 mm/s results in the formation of a notably fine grain structure, which is predominantly concentrated around the pores.
The phase distributions of the SLM samples prepared under varying laser scanning speed conditions are presented in Figure 7. It is apparent that the phases are distinctly identified as the FCC γ-phase and the BCC α-phase. The green region represents the FCC γ-phase, which occupies an area fraction ranging from 93.1% to 99.6%, while the red points correspond to the BCC α precipitates, which comprise approximately 0.03% to 0.8% of the area fraction. Therefore, it can be concluded that the Fe-36Ni alloy produced by SLM is predominantly characterized by the austenitic FCC phase. Additionally, due to the rapid cooling during the SLM process, the undercooled regions foster the formation of small amounts of α precipitates within the γ grains. Previous studies have also reported the presence of precipitates in other engineering materials, such as Al alloys, Ni-based superalloys, steels, and high-entropy alloys [35]. The mechanical properties of alloys can be optimized by effectively controlling the precipitate content. A comprehensive analysis of the phase distribution and XRD results indicates that the low volume of α precipitates is responsible for the absence of a distinct α-phase characteristic peak in the XRD pattern. Additionally, the bright white areas in the phase distribution map primarily correspond to the pores formed during the SLM fabrication process of the Fe-36Ni alloy.

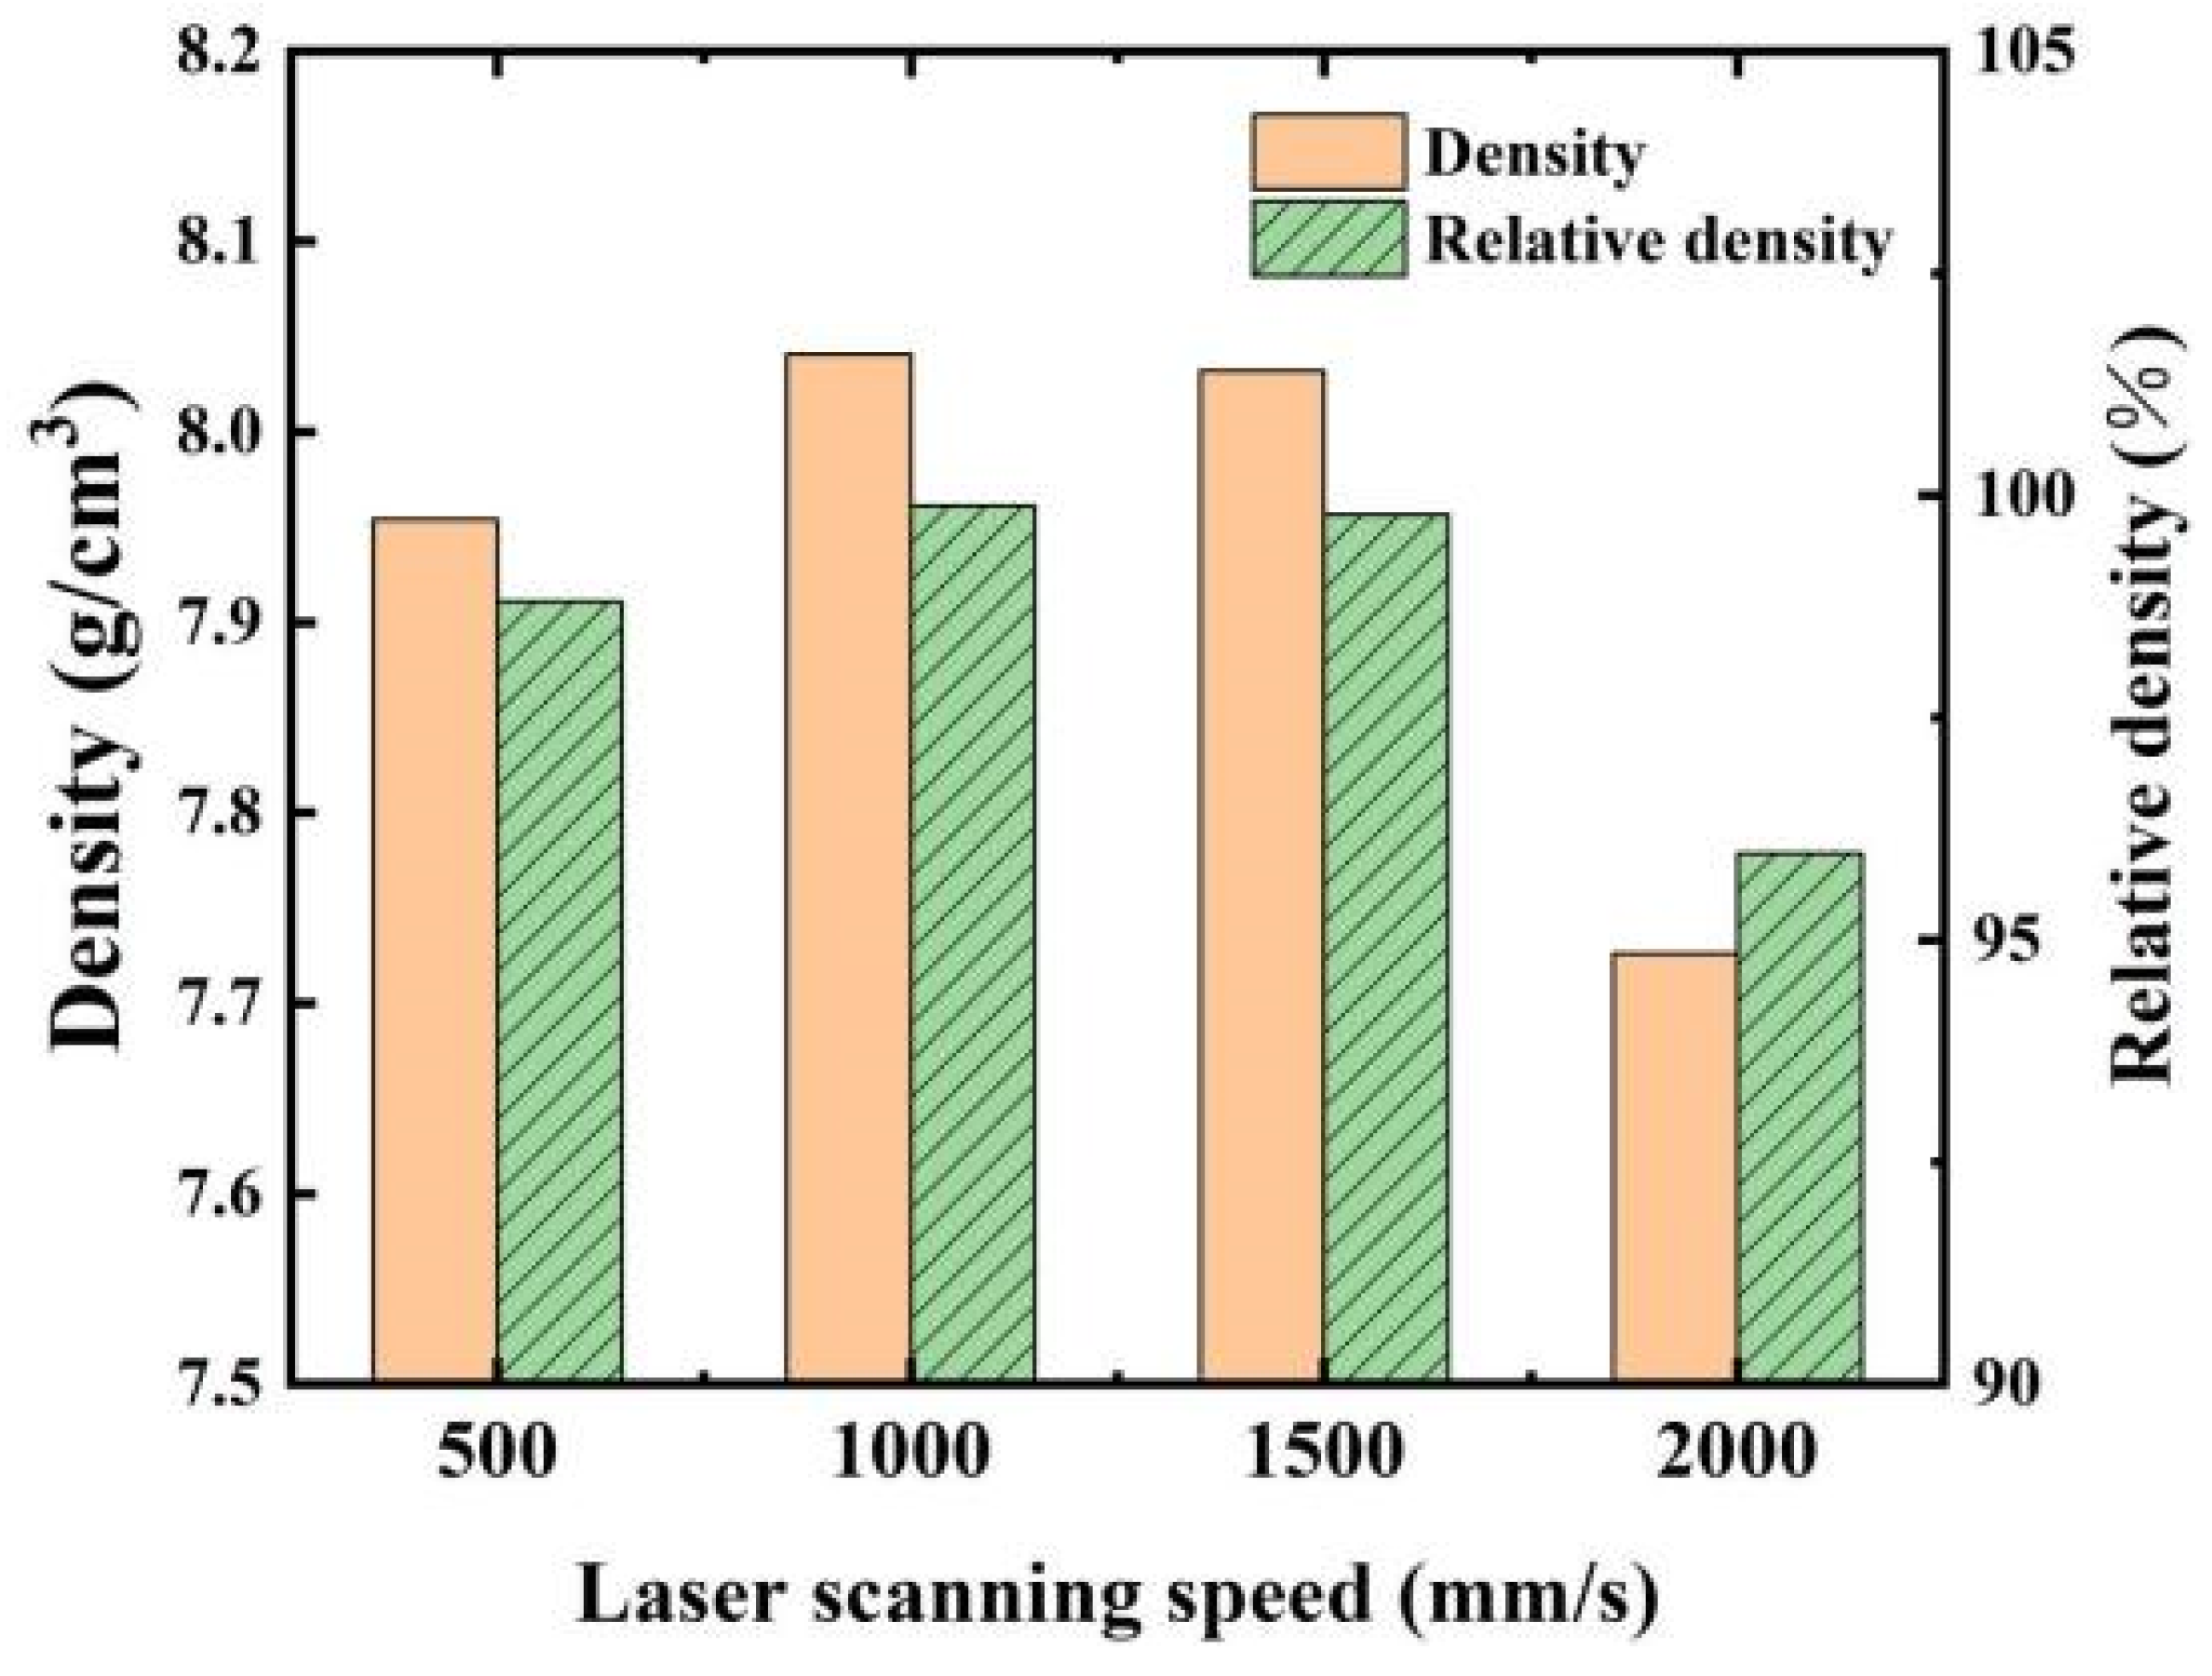
3.2. Relative Density and Mechanical Properties

The relative densities of the SLM samples were measured using a density balance, and the results are presented in Figure 8. As shown, the relative densities of all SLM samples exceeded 95.9% across the range of selected laser scanning speeds. Moreover, the densification values were significantly influenced by the laser scanning speed. Specifically, the relative densities of the Fe-36Ni samples initially increased and then decreased as the laser scanning speed was progressively increased from 500 mm/s to 2000 mm/s. At a scanning speed of 500 mm/s, the density of sample V-500 was measured to be 7.95 g/cm3. When the scanning speed increased to 1000 mm/s, the density of sample V-1000 increased to 8.04 g/cm3, representing the highest density observed. At a scanning speed of 1500 mm/s, the density of sample V-1500 remained relatively constant at approximately 8.03 g/cm3. However, as the scanning speed further increased to 2000 mm/s, the density of sample V-2000 significantly decreased to around 7.72 g/cm3. This trend, along with the data presented in Figure 6, indicates that porosity has a notable impact on the relative densities of the samples [4,30]. Additionally, the relative densities of the samples are influenced by both excessively high and low laser scanning speeds. Specifically, scanning speeds that are too high or too low can lead to a reduction in sample density. In the case of sample V-500, the laser energy density exceeded the threshold, causing the vaporization of certain nickel elements and resulting in the formation of pores. On the other hand, the excessively high scanning speed of sample V-2000 led to increased pore formation, as the energy provided was insufficient to fully melt the powder, thereby significantly reducing the density.
Mostafa Yakout et al. showed that increasing the laser power at high scanning speeds resulted in an increase in part density, which could be attributed to a decrease in void formation, while increasing the laser power at low scanning speeds resulted in a decrease in part density when using a small hatch spacing, which could be attributed to the loss of mass and compositional variations at high laser energies. An analysis of variance (ANOVA) also pointed out that part density significantly depends on the interaction between the three process parameters in the laser energy density equation [36].
There are some connections and differences between our study and the above. In terms of connections, both focus on the effects of process parameters on part properties (density) in the SLM process. The effects of scanning speed on density in our study reflect the role of a single parameter change, whereas the effects of multi-parameter interactions such as laser power, scanning speed, and hatch spacing on density in other studies provide a more comprehensive view of understanding the combined effects of process parameters. In terms of phase composition, although we did not explore the effects of laser power and hatch spacing on phase, it can be hypothesized that variations in these parameters may also play a role in phase composition, as in the case of the effects on density, which are the result of the interaction of multiple factors.
Figure 9 presents the engineering stress–strain curves of Fe-36Ni alloy samples fabricated under different laser scanning speeds, while Figure 10 depicts the corresponding evolution of mechanical properties. At a scanning speed of 500 mm/s, the V-500 sample exhibited a tensile strength of approximately 374 MPa and an elongation of ~45%. As the scanning speed increased, both tensile strength and elongation initially improved, reaching optimal values in the V-1000 sample, with a tensile strength of ~439 MPa and an elongation of 49%. However, further increasing the scanning speed to 1500 mm/s led to a reduction in mechanical properties, with the tensile strength and elongation decreasing to 406 MPa and 35%, respectively. At 2000 mm/s, the V-2000 sample experienced brittle fracture, yielding a tensile strength of 296 MPa and a significantly reduced elongation of 7%.
In this study, the evolution of the mechanical properties of Fe-36Ni alloy samples is primarily attributed to the combined effects of excessive melting-induced porosity, fine grain strengthening, and the presence of pores. Using the V-500 sample as a representative case, it was observed that although a slower laser scanning speed allows for the sufficient melting of the alloy powder, the excessive energy density leads to the partial vaporization of the metal powder. This vaporization results in pore formation, thereby reducing the strength and elongation of the V-500 sample compared to the V-1000 sample. When the scanning speed is increased to 1000 mm/s, an appropriate energy input density enhances the bonding between melt pools, significantly reducing the occurrence of unfused holes and thereby improving the overall forming quality. This optimization in turn leads to enhanced tensile strength and elongation. It can be seen that density and tensile properties are closely related, while porosity is the central factor affecting both. From the experimental results, it can be seen that the density and tensile properties of the samples prepared at different scanning speeds vary significantly, such as the V-500 sample at a scanning speed of 500 mm/s; due to the high laser energy density, some of the nickel elements are vaporized to form pores, resulting in a density of 7.95 g/cm3, a tensile strength of only about 374 MPa, and an elongation of about 45%. The presence of pores not only reduces the density of the material but also seriously weakens its tensile properties.
Furthermore, as illustrated in Figure 9 and Figure 10, the smaller grain size observed in the V-1000 sample contributes to its superior strength and elongation due to the effects of fine grain strengthening. With an increase in the laser scanning speed to 1500 mm/s and 2000 mm/s, the tensile strength and elongation of the samples exhibited a decreasing trend. Specifically, at a scanning speed of 2000 mm/s, both properties significantly deteriorated, with brittle fracture occurring. This decline is attributed to the insufficient melting of the Fe-36Ni alloy powder due to the lower laser energy density, which leads to the formation of irregular pores during the SLM process. These defects exacerbate the initiation and propagation of cracks during the tensile test, resulting in reduced strength and elongation.

3.3. Coefficient of Thermal Expansion

Figure 11 presents the thermal expansion strains and coefficients of thermal expansion (CTEs) for Fe-36Ni alloy samples, measured over a temperature range from −100 °C to 200 °C and prepared under varying scanning speed conditions. The thermal expansion strain data reveal that the relative displacements (dL/L0) of all samples follow a consistent trend across the entire temperature range. Specifically, between −100 °C and approximately 50 °C, the thermal expansion strains of all samples initially decrease, before increasing, with only minimal fluctuation observed within this interval. The thermal expansion strains of all samples exhibit a marked increase when the temperature exceeds 50 °C. However, the absolute thermal expansion displacements of the various samples at each temperature show only slight variations. Among the samples, V-500 demonstrates the largest thermal expansion strain, while V-2000 has the lowest value. As shown in Figure 11b, the CTEs of all samples exhibit a parabolic variation across the −100 °C to 200 °C range. Notably, the CTE values of these samples remain lower than those of the forged samples (2.0 × 10⁻⁶ °C−1) up to 100 °C. The lowest CTE value appears in the V-2000 sample, which is only about 1.4 × 10⁻⁶ °C−1. The reduced CTEs observed in samples V-1500 and V-2000 are primarily attributed to the presence of increased defects, such as pores, within these samples. The pores create additional space for thermal expansion in the surrounding microstructures, thereby reducing the overall macroscopic expansion and lowering the CTE.

4. Conclusions

In this study, an Fe-36Ni alloy was fabricated using the SLM technique. The effects of varying scanning speeds on the microstructure and properties were systematically investigated, yielding the following conclusions:
(1)
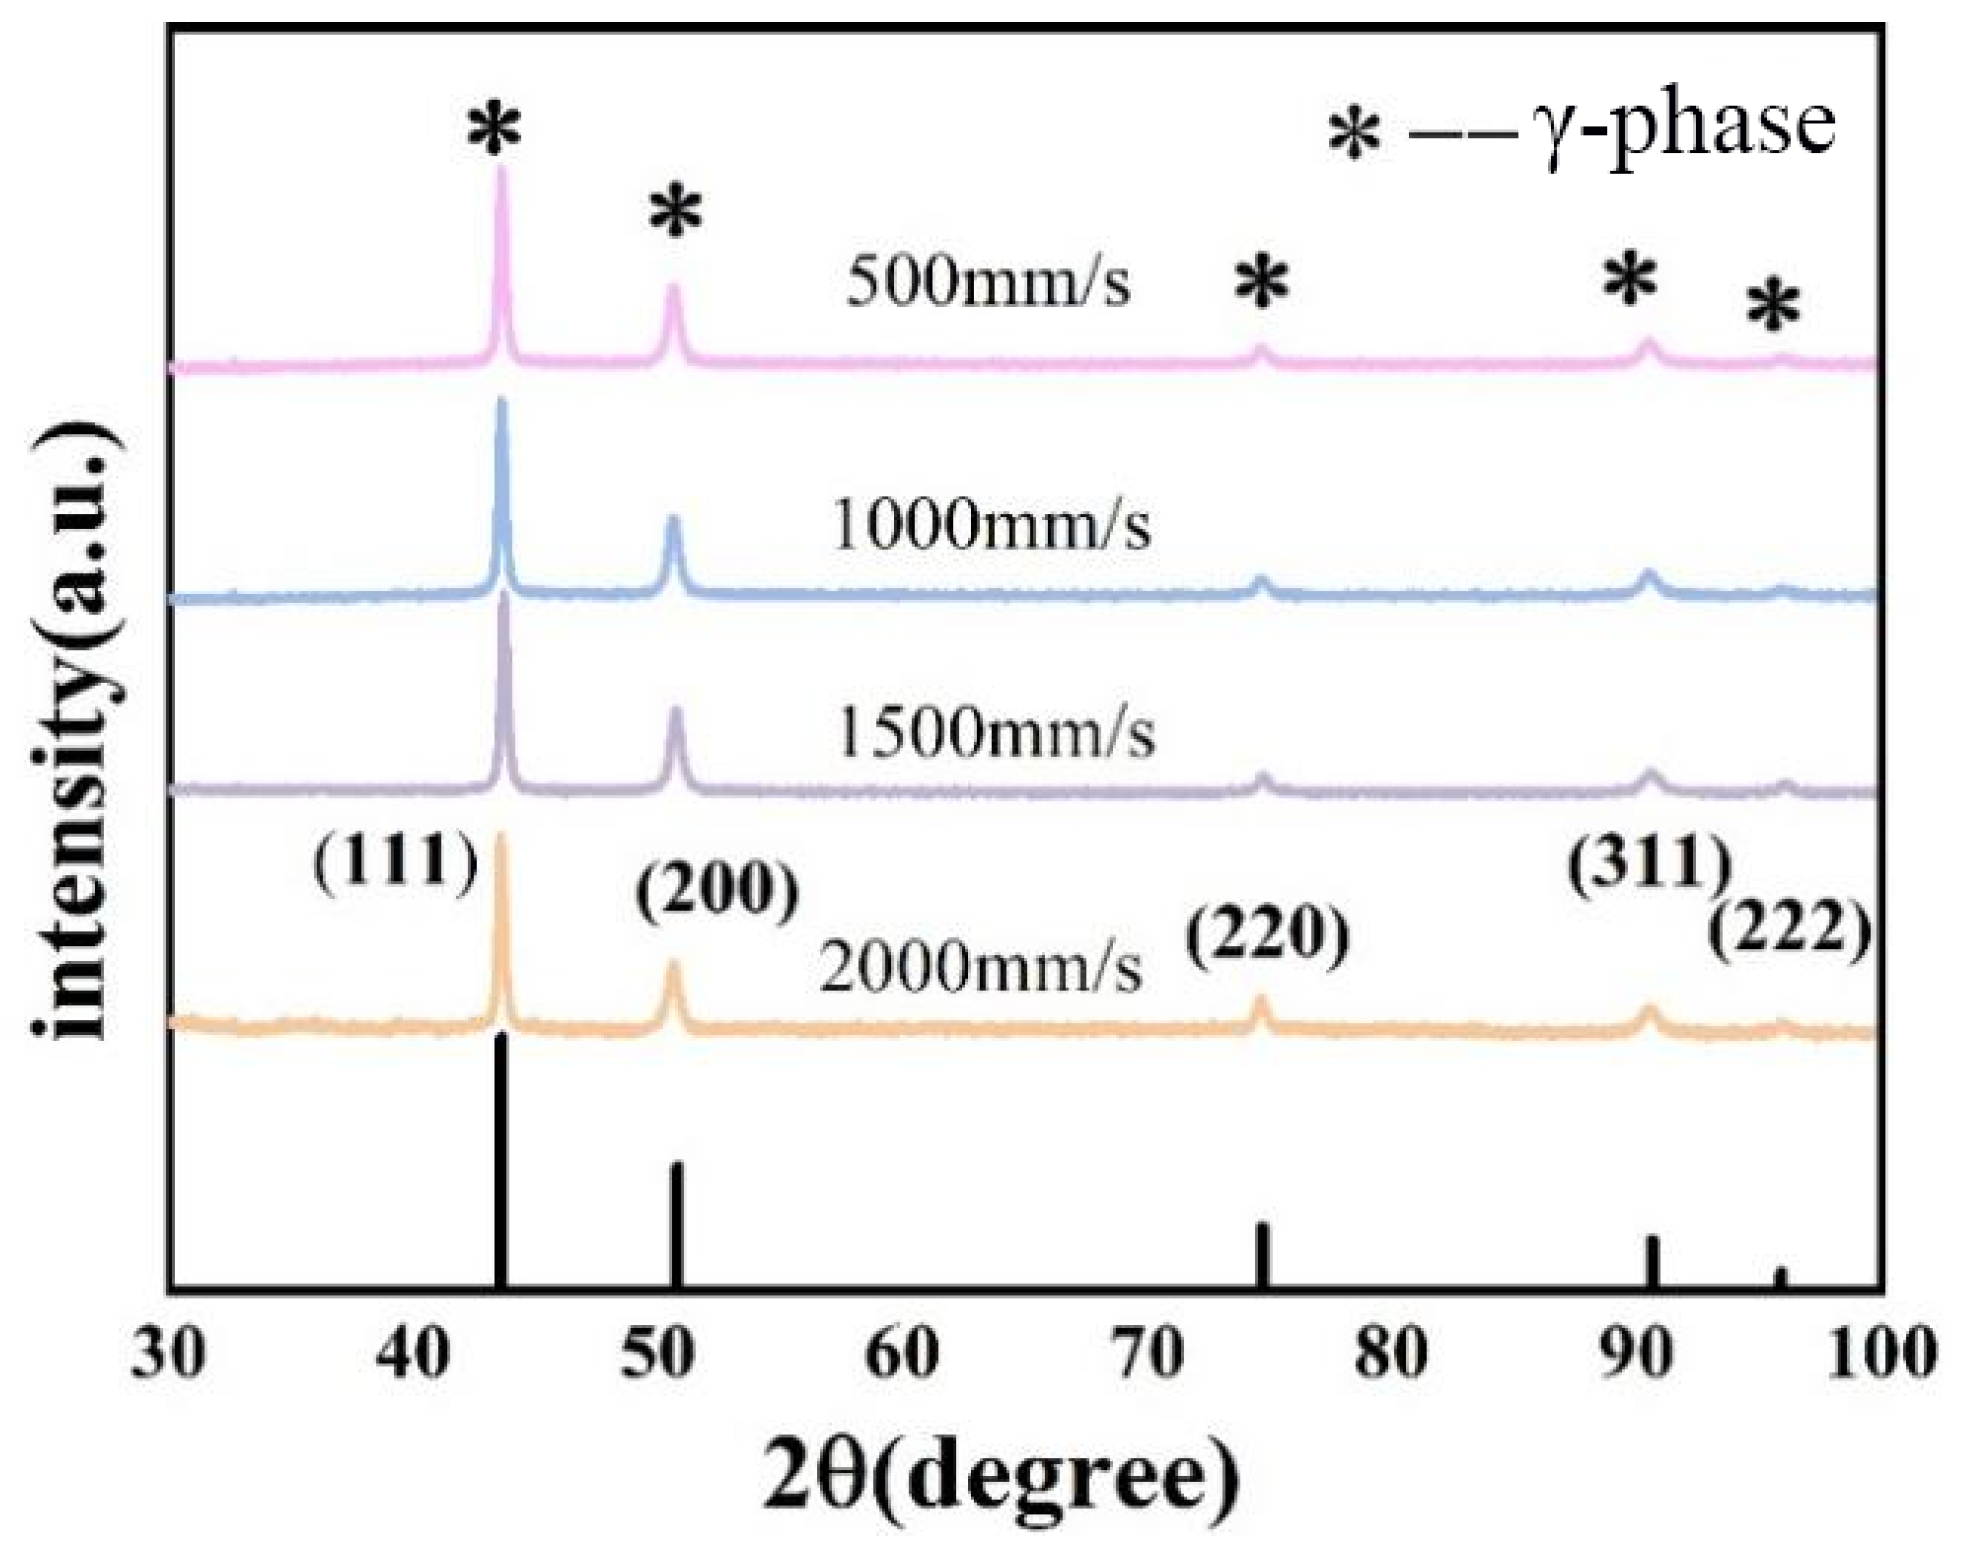
The Fe-36Ni alloy predominantly exhibits the γ-phase, with a small amount of α precipitates observed. This is primarily attributed to the formation of a supercooled region during the rapid cooling process inherent to SLM.
(2)
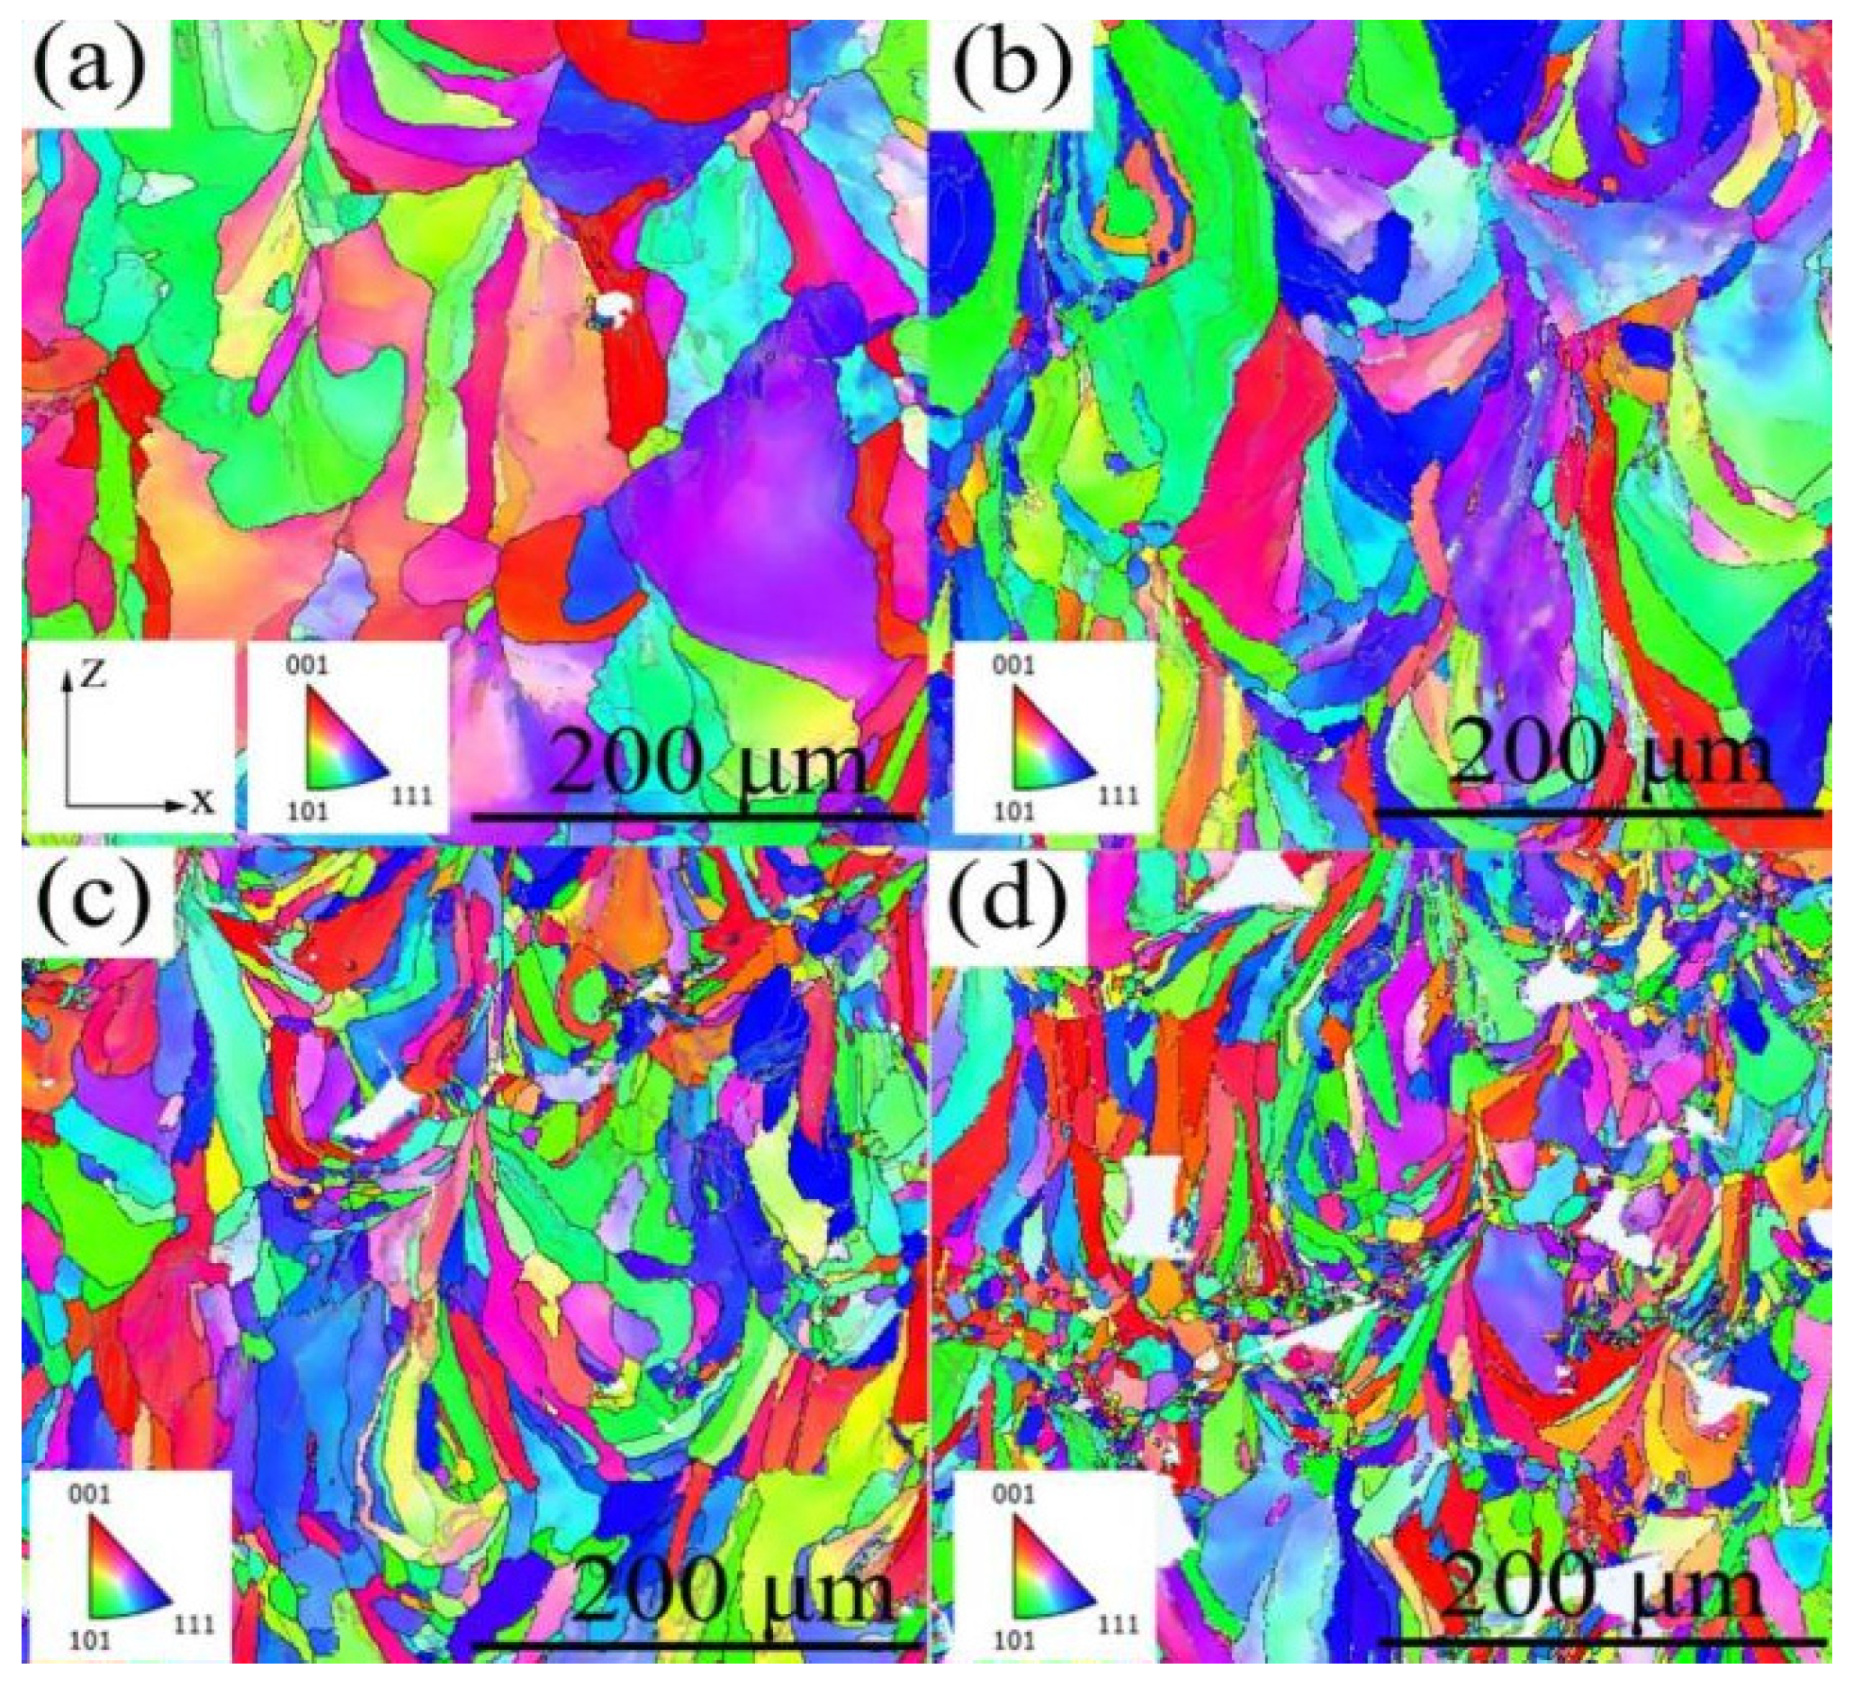
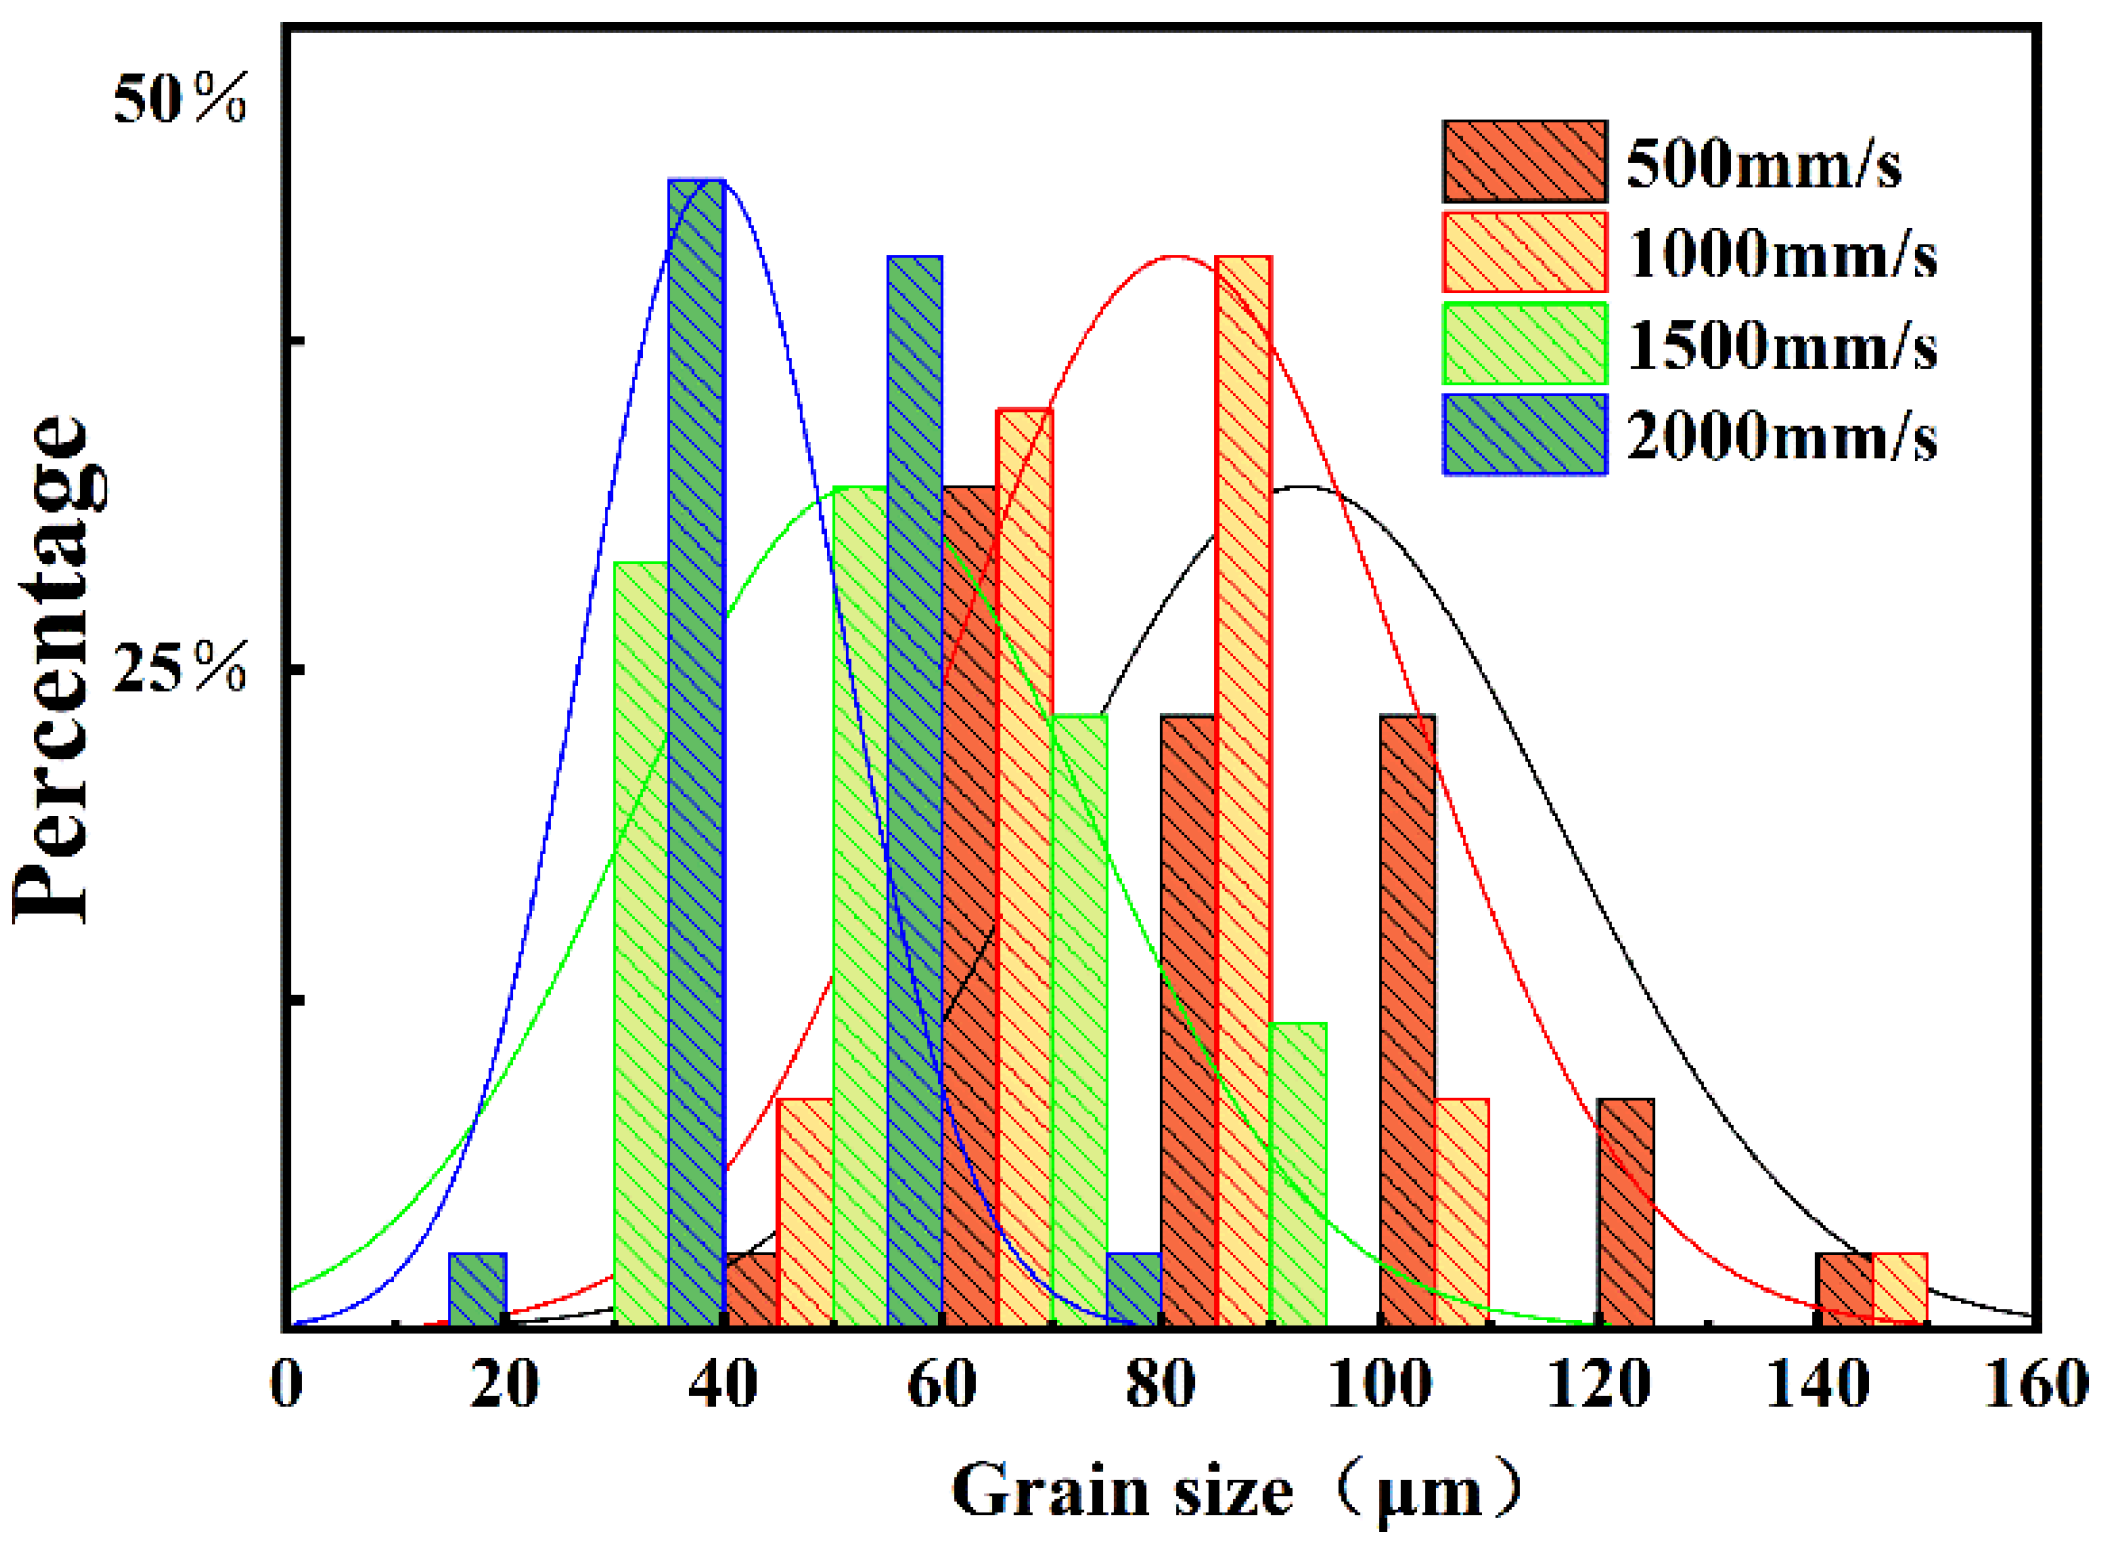
The grain size of the Fe-36Ni alloy samples decreased progressively with increasing laser scanning speed, while porosity initially decreased and subsequently increased with higher scanning speeds. The sample exhibiting the optimal microstructure was obtained at a scanning speed of 1000 mm/s.
(3)
At a laser scanning speed of 1000 mm/s, the Fe-36Ni alloy demonstrated the most favorable mechanical properties, with a tensile strength of approximately 439 MPa and an elongation of about 49%. This can be attributed to the superior molding quality of the SLM samples and the effects of grain refinement strengthening.
(4)
At a laser scanning speed of 2000 mm/s, the samples displayed the lowest coefficient of thermal expansion. This behavior is likely due to the higher defect density, such as the presence of pores, which provides additional space for the thermal expansion of adjacent microstructures.

Author Contributions

Z.Y.: Writing—review and editing and Conceptualization. Z.F.: Writing—review and editing, Methodology, and Funding acquisition. Y.D.: Visualization and Investigation. T.W.: Software and Investigation. K.W.: Writing—review and editing. Z.Z.: Writing—review and editing, Formal analysis, and Data curation. J.G.: Visualization, Investigation, Formal analysis, and Funding acquisition. J.W.: Visualization and Investigation. M.F.: Formal analysis. J.L.: Methodology, Investigation, Formal analysis, Funding acquisition, and Conceptualization. All authors have read and agreed to the published version of the manuscript.

Funding

This work was supported by the National Natural Science Foundation of China (52001109), Hebei Natural Science Foundation (E2024208012), Hebei Yanzhao Golden Platform Talent Gathering Plan Backbone Talent Project (Postdoctoral Platform) (B2024005025), Introduction of Foreign Intelligence Projects in Hebei Province in 2024 and 2025, and Key Research and Development Program of Shijiazhuang City (231080479A/241110537A).

Institutional Review Board Statement

Not applicable.

Informed Consent Statement

Not applicable.

Data Availability Statement

Data will be made available on request.

Conflicts of Interest

Author Zhihao Feng was employed by the company Juli Rigging Co., Ltd. Author Mingqiang Fan was employed by the company HBIS Group Technology Research Institute. The remaining authors declare that the research was conducted in the absence of any commercial or financial relationships that could be construed as a potential conflict of interest.

References

  1. Wang, Q.; Dong, Y.; Jiang, Z.; Yin, Z.; Wu, Y.; Qing, H. Clarifying the role of Ce in the corrosion behavior of Fe-36Ni Invar alloy. J. Mater. Res. Technol.-JMRT 2024, 30, 6536–6551. [Google Scholar] [CrossRef]
  2. Wang, Q.; Dong, Y.; Jiang, Z.; Huang, J. Enhancing low thermal expansion behavior and strength via induced Zr-rich intermetallic phase in Fe-36Ni Invar alloy. Mater. Des. 2023, 226, 111644. [Google Scholar] [CrossRef]
  3. Wang, Q.; Dong, Y.; Jiang, Z.; Yin, Z.; Wu, Y.; Qing, H. Unveiling the influence of zirconium on the corrosion behavior of Fe-36Ni Invar alloy. Intermetallics 2024, 175, 108519. [Google Scholar] [CrossRef]
  4. Liu, Z.; Wang, J.; Xu, Z.; Li, Y.; Sun, Q.; Zhan, X. Unraveling microstructure evolution induced mechanical responses in coaxial fiber-diode laser hybrid welded Fe–36Ni Invar alloy. Mater. Sci. Eng. A 2024, 908, 146778. [Google Scholar] [CrossRef]
  5. Wang, Q.; Dong, Y.; Jiang, Z.; Zou, T.; Liu, Y.; Wu, Y.; Qing, H. Effects of Ce addition on mechanical properties and thermal expansion behavior of Fe-36Ni Invar alloy. Mater. Charact. 2024, 207, 113584. [Google Scholar] [CrossRef]
  6. Supekar, S.; Ghuge, R.; Shinde, M.; Manda, S.; Sivalingam, Y.; Ganesh, P.; Kumar, S.S.; Pareek, P.; Rane, S. Effect of annealing conditions on structural and magnetic properties of 36Ni-64Fe laminates. J. Magn. Magn. Mater. 2023, 567, 170357. [Google Scholar] [CrossRef]
  7. Kahlert, M.; Wegener, T.; Laabs, L.; Vollmer, M.; Niendorf, T. Influence of Defects and Microstructure on the Thermal Expansion Behavior and the Mechanical Properties of Additively Manufactured Fe-36Ni. Materials 2024, 17, 4313. [Google Scholar] [CrossRef]
  8. Xu, Y.; Li, Y.; Wang, L.; Song, Y.; Li, K.; Xing, H.; Chen, B.; Wang, J. Molten pool macroscopic thermodynamic analysis during selective laser melting of AlSi10Mg: Simulations and experiments. J. Mater. Res. Technol. 2024, 33, 2506–2518. [Google Scholar] [CrossRef]
  9. Feng, Z.; Wei, K.; Wang, T.; Feng, Q.; Wang, S.; Jiao, L.; Ma, J.; Meng, D.; Li, J. Effect of laser scanning speed on the surface characteristics and wear resistance of TiZrAlV alloy via laser gas nitriding. Surf. Coat. Technol. 2025, 500, 131909. [Google Scholar] [CrossRef]
  10. Lv, F.; Liang, H.; Xie, D.; Mao, Y.; Wang, C.; Shen, L.; Tian, Z. On the role of laser in situ re-melting into pore elimination of Ti–6Al–4V components fabricated by selective laser melting. J. Alloys Compd. 2021, 854, 156866. [Google Scholar] [CrossRef]
  11. Karimi, J.; Suryanarayana, C.; Okulov, I.; Prashanth, K. Selective laser melting of Ti6Al4V: Effect of laser re-melting. Mater. Sci. Eng. A 2021, 805, 140558. [Google Scholar] [CrossRef]
  12. Wang, H.M.; Zhang, S.Q.; Tang, H.B.; Tian, X.J.; Liu, D. Laser additive manufacturing of high-performance metallic aerospace components. Chin. J. Lasers 2020, 47, 0500002. [Google Scholar]
  13. Feng, Z.; Liu, Z.; Meng, D.; Li, Y.; Jiang, X.; Li, J.; Wang, J.; Jiao, L.; Zhao, B.; Wang, L.; et al. Microstructure evolution and vacuum tribological properties of surface nitriding layer on a TiZrAlV alloy fabricated by laser nitriding. J. Mater. Res. Technol.-JMRT 2023, 24, 928–939. [Google Scholar] [CrossRef]
  14. Feng, Z.; Sun, X.; Han, P.; Fu, H.; Dong, H.; Guo, S.; Su, R.; Li, J. Microstructure and microhardness of a novel TiZrAlV alloy by laser gas nitriding at different laser powers. Rare Met. 2020, 39, 270–278. [Google Scholar] [CrossRef]
  15. Kang, C.; Kim, G.-H.; Kim, W.R.; Lee, T.W.; Kang, H.S.; Ham, M.J.; Choi, S.-J.; Choi, H.Y.; Kim, K.-S.; Kim, H.T.; et al. Effect of energy density on down surface characteristics of AlSi10Mg alloy fabricated via selective laser melting. Heliyon 2024, 10, e39522. [Google Scholar] [CrossRef]
  16. Asgari, H.; Salarian, M.; Ma, H.; Olubamiji, A.; Vlasea, M. On thermal expansion behavior of Invar alloy fabricated by modulated laser powder bed fusion. Mater. Des. 2018, 160, 895–905. [Google Scholar] [CrossRef]
  17. Zhang, B.; Li, Y.; Bai, Q. Defect formation mechanisms in selective laser melting: A review. Chin. J. Mech. Eng. 2017, 30, 515–527. [Google Scholar] [CrossRef]
  18. Ergene, B. Farklı bağıl yoğunluklardaki Inconel 718 ve Ti6Al4V biyomedikal parçaların seçici lazer ergitme (SLE) metoduyla üretiminin simülasyonu. Gazi Üniversitesi Mühendislik Mimar. Fakültesi Derg. 2021, 37, 469–484. [Google Scholar] [CrossRef]
  19. Li, F.; Guo, C. Forming process and property of selective laser melted 4J36 invar alloy. Hot Work. Technol. 2023, 21, 87–92. [Google Scholar]
  20. Liu, Z.; Zhao, D.; Wang, P.; Yan, M.; Yang, C.; Chen, Z.; Lu, J.; Lu, Z. Additive manufacturing of metals: Microstructure evolution and multistage control. J. Mater. Sci. Technol. 2022, 100, 224–236. [Google Scholar] [CrossRef]
  21. Wang, Q.; Zhang, Z.; Tong, X.; Dong, S.; Cui, Z.; Wang, X.; Ren, L. Effects of process parameters on the microstructure and mechanical properties of 24CrNiMo steel fabricated by selective laser melting. Opt. Laser Technol. 2020, 128, 106262. [Google Scholar] [CrossRef]
  22. Moeinfar, K.; Khodabakhshi, F.; Kashani-Bozorg, S.; Mohammadi, M.; Gerlich, A. A review on metallurgical aspects of laser additive manufacturing (LAM): Stainless steels, nickel superalloys, and titanium alloys. J. Mater. Res. Technol. 2022, 16, 1029–1068. [Google Scholar] [CrossRef]
  23. Dong, P.; Li, Z.; Li, D.; Yu, Y.; Zhang, W. Track trajectory, molten pool and defect characterization in NiTi single-track selective laser melting (SLM) experiments. J. Mater. Res. Technol. 2024, 33, 5210–5222. [Google Scholar] [CrossRef]
  24. Liang, J.; Xie, X.; Mu, Y.; Yang, P.; Wu, Z.; Jia, Y.; Wang, G. Metastable core-shell precipitation strengthened high-entropy alloys fabricated by direct energy deposition with multi-stage terrace-like slip wave toughening. J. Mater. Sci. Technol. 2025, 210, 58–71. [Google Scholar] [CrossRef]
  25. Wu, L.; Zhang, C.; Khan, D.F.; Zhang, R.; Wang, Y.; Jiang, X.; Yin, H.; Qu, X.; Liu, G.; Su, J. Unveiling the cellular microstructure–property relations in martensitic stainless steel via laser powder bed fusion. Int. J. Miner. Metall. Mater. 2024, 31, 2476–2487. [Google Scholar] [CrossRef]
  26. Jiang, Y.; Tang, H.; Li, Z.; Chen, H.; Li, Y.; Zheng, D.; Cheng, X.; Zhang, C. A magnesium alloy with ultrahigh Gd content manufactured by laser directed energy deposition: Heat treatment and microstructure evolution. J. Alloys Compd. 2024, 1005, 175965. [Google Scholar] [CrossRef]
  27. Loh, L.-E.; Chua, C.-K.; Yeong, W.-Y.; Song, J.; Mapar, M.; Sing, S.-L.; Liu, Z.; Zhang, D. Numerical investigation and an effective modelling on the Selective Laser Melting (SLM) process with aluminium alloy 6061. Int. J. Heat Mass Transf. 2015, 80, 288–300. [Google Scholar] [CrossRef]
  28. An, F.; Liu, X.; Zeng, X.; Zhang, L.; Ning, J.; Na, S.J. Effect of laser beam drift at high scanning speed on relative density, thickness and roughness of thin-walled TC11 specimen by selective laser melting. J. Manuf. Process. 2025, 139, 38–49. [Google Scholar] [CrossRef]
  29. Hao, L.; Wang, W.; Zeng, J.; Song, M.; Chang, S.; Zhu, C. Effect of scanning speed and laser power on formability, microstructure, and quality of 316L stainless steel prepared by selective laser melting. J. Mater. Res. Technol. 2023, 25, 3189–3199. [Google Scholar] [CrossRef]
  30. Qi, T.; Zhu, H.; Zhang, H.; Yin, J.; Ke, L.; Zeng, X. Selective laser melting of Al7050 powder: Melting mode transition and comparison of the characteristics between the keyhole and conduction mode. Mater. Des. 2017, 135, 257–266. [Google Scholar] [CrossRef]
  31. Peng, S.; Wei, Y.; Gao, H. Nanoscale precipitates as sustainable dislocation sources for enhanced ductility and high strength. Proc. Natl. Acad. Sci. USA 2020, 117, 5204–5209. [Google Scholar] [CrossRef]
  32. Huang, G.; He, G.; Peng, X.; He, Y.; Chen, H.; Huang, K.; Liu, Y. Effect of processing parameters on the microstructure, mechanical properties and thermal expansion behavior of Invar 36 alloy manufactured by laser powder bed fusion. Mater. Sci. Eng. A 2024, 897, 146329. [Google Scholar] [CrossRef]
  33. Yan, J.; Cai, B.; Ou, B.; Meng, X.; Xie, Y.; Zhang, Y.; Fang, S. Effect of laser energy density on the phase transformation behavior and functional properties of NiTi shape memory alloy by selective laser melting. J. Alloys Compd. 2024, 1005, 176060. [Google Scholar] [CrossRef]
  34. Huang, G.; Peng, X.; Yang, L.; He, Y.; Liu, C.; Zhu, J.; Huang, K.; Liu, Y. Microstructure evolution and corrosion behavior of Invar 36 alloy additively manufactured via laser powder bed fusion. Mater. Charact. 2024, 217, 114422. [Google Scholar] [CrossRef]
  35. Yakout, M.; Elbestawi, M.; Veldhuis, S.C. Density and mechanical properties in selective laser melting of Invar 36 and stainless steel 316L. J. Mater. Process. Technol. 2019, 266, 397–420. [Google Scholar] [CrossRef]
  36. Chen, P.; Chen, W.; Chen, J.; Chen, Z.; Yin, R.; Tang, Y.; Liu, G.; Huang, B.; Zhang, Z. Effect of base material temper condition on precipitate evolution and mechanical properties of 2195 AlLi alloy friction stir welding joints. Mater. Charact. 2024, 209, 113712. [Google Scholar] [CrossRef]
Figure 1. Microscopic morphology of Fe-36Ni alloy powder.
Coatings 15 00572 g001
Figure 2. Schematic diagram of laser scanning method.
Coatings 15 00572 g002
Figure 3. X-ray diffraction patterns of Fe-36Ni alloys fabricated by SLM at different laser scanning speeds.
Coatings 15 00572 g003
Figure 4. Microscopic morphologies of horizontal cross-section (X-Y plane) of Fe-36Ni alloy specimens fabricated by SLM at different scanning speeds: (a) V-500, (b) V-1000, (c) V-1500, and (d) V-2000.
Coatings 15 00572 g004
Figure 5. IPF maps of Fe-36Ni alloy samples under different laser scanning speeds: (a) V1 (b) V2 (c) V3 (d) V4.
Coatings 15 00572 g005
Figure 6. Grain size distribution of samples at different laser scanning speeds.
Coatings 15 00572 g006
Figure 7. Phase distribution maps of Fe-36Ni alloy samples at different laser scanning speeds: (a) V-500, (b) V-1000, (c) V-1500, and (d) V-2000.
Coatings 15 00572 g007
Figure 8. Relative density of SLM samples at different laser scanning speeds.
Coatings 15 00572 g008
Figure 9. Tensile stress–strain curves of SLM samples at different laser scanning speeds.
Coatings 15 00572 g009
Figure 10. Mechanical property trend plots of SLM samples at different laser scanning speeds.
Coatings 15 00572 g010
Figure 11. Thermal expansion properties of SLM-formed Fe-36Ni alloys at different laser scanning speeds: (a) thermal expansion strain (−100 °C~200 °C); (b) coefficient of thermal expansion (CTE, −100 °C~200 °C).
Coatings 15 00572 g011
Table 1. Chemical composition of Fe-36Ni alloy powder (wt. %).
CMnSiNiPSFe
0.0010.4120.14135.7260.0040.001Bal.
Table 2. The SLM parameters and corresponding values used in this study.
Sample IDP (W)V (mm/s)h (mm)t (mm)Ev (J/mm)3
V-5002405000.10.04120
V-100024010000.10.0460
V-150024015000.10.0440
V-200024020000.10.0430
Disclaimer/Publisher’s Note: The statements, opinions and data contained in all publications are solely those of the individual author(s) and contributor(s) and not of MDPI and/or the editor(s). MDPI and/or the editor(s) disclaim responsibility for any injury to people or property resulting from any ideas, methods, instructions or products referred to in the content.

