Article

Simulation of Internal Environmental Conditions Within Rock Wool Insulation: Implications for Corrosion Under Insulation in Piping Systems

National Center for Material Service Safety, University of Science & Technology Beijing, No. 12 Kunlun Road, Changping District, Beijing 102206, China
*
Authors to whom correspondence should be addressed.
Coatings 2025, 15(5), 571; https://doi.org/10.3390/coatings15050571 (registering DOI)
Submission received: 9 April 2025 / Revised: 6 May 2025 / Accepted: 9 May 2025 / Published: 10 May 2025

Abstract

:
Rock wool is widely used in industrial piping systems for its excellent thermal insulation properties, but its porous structure allows water infiltration that can lead to corrosion under insulation (CUI) on metal pipe surfaces. In order to investigate how water infiltration into the insulated pipeline system creates a corrosive environment, a study on the flow behavior of fluids in porous media was conducted. Experiments were performed to measure the flow velocity and pressure drop along three principal directions—axial, radial, and circumferential. These measurements enabled the derivation of specific viscous and inertial resistance coefficients, which characterize the flow through the rock wool structure. The results indicated that the flow parameters of rock wool change over time and with repeated use, particularly after dry–wet cycles. The experimentally derived parameters were incorporated into both small-scale and large-scale three-dimensional computational fluid dynamics (CFD) models to simulate water transport within the rock wool insulation layer. Validation experiments performed on a real rock wool-insulated pipeline system confirmed the predictive accuracy of the CFD simulations in capturing water movement through the insulation. The large-scale model further analyzed the influence of inlet velocity, rock wool aging, and pipeline inclination on the development of environmental conditions for CUI.

1. Introduction

Effective insulation systems are vital in modern industry for minimizing energy loss and ensuring the stable operation of pipelines and process equipment, particularly in high-temperature sectors such as chemical processing [1], oil refining [2], and power generation [3]. Among the wide array of insulation materials, rock wool stands out due to its excellent thermal insulation properties, high melting point, and intrinsic fire resistance [4]. Rock wool is primarily made of basaltic rock and recycled industrial slag, produced by melting these raw materials at over 1400 °C and rapidly spinning the molten material into fine fibers, resulting in a highly porous, interwoven structure [5]. Nevertheless, rock wool’s highly porous structure can inadvertently allow moisture to penetrate to the metallic pipeline surface, resulting in a phenomenon commonly referred to as corrosion under insulation [6]. CUI is a pervasive challenge in the industry, characterized by accelerated metal corrosion beneath insulation layers due to trapped moisture and corrosive agents. This phenomenon leads to increased maintenance costs, unplanned downtime, and, in severe cases, catastrophic equipment failure [7]. Previously, requirements for rock wool insulation materials mainly centered on thermal performance. However, as CUI has garnered increasing attention, relevant product standards have begun to focus on corrosion protection [8], for example, by adding water repellents to the product and limiting the chloride ion concentration of the leachate [9]. While there has been considerable research on the aging of rock wool—highlighting its gradual deterioration over prolonged service and the resulting decline in thermal performance [10]—relatively little attention has been paid to how this aging process influences CUI [7].
Rock wool insulation material is a typical porous material. The study of the process in which water, either in liquid or vapor form, enters the pipeline insulation system and permeates through the rock wool to reach the pipe surface essentially involves a multiphase flow problem in porous media [11]. Henry Darcy is widely recognized as a pioneering figure in the field of porous medium flow. Darcy’s law is regarded as a fundamental principle describing the relationship between fluid velocity, pressure gradient, and the permeability of porous media [12]. The Darcy equation, the Brinkman-extended Darcy equation, and the Forchheimer-extended Darcy equation [13] have been widely employed in the study of macroscopic-scale fluid flow in porous media. CFD, a powerful tool for investigating fluid flow in porous media, is employed to simulate the complex interactions among heat [14], moisture [15], and airflow [16] within porous media, such as insulation materials [17]. CFD simulations enable researchers to visualize and quantify the distribution of fluid phases, thereby providing insights that are difficult to obtain solely through experimental methods [18]. Several studies have leveraged CFD to investigate moisture transport in insulation materials. For example, Nosrati et al. [19] utilized CFD to model the hygrothermal characteristics of aerogel-enhanced insulating materials under different humidity and temperature conditions. Belleghem et al. [20] built a coupled heat, vapor, and liquid moisture transport model to predict the moisture behaviour of building components.
In research on flow in porous media, the viscous resistance coefficient and inertial resistance coefficient [21] are key parameters for the modifiedDarcy’s law to characterize the fluid flow process. In some simulation studies [22,23] of flow in porous media, theoretical calculations of the resistance coefficient are often used as model inputs. However, for rock wool—where fibers are randomly arranged [4]—such theoretical approaches are not suitable. Moreover, due to the structural characteristics of pipe insulation and its resulting anisotropic fiber distribution, experimentally determining the flow resistance coefficient for the porous medium is often the most practical approach. By experimentally measuring these coefficients and incorporating them into CFD simulations, the accuracy and reliability of numerical models that reflect actual operating conditions can be significantly enhanced [24]. When addressing practical problems through modeling and simulation, experimental validation is often a crucial component [12,18,24,25,26,27]. By comparing simulation results with experimental data, the accuracy of the model can be assessed, and necessary adjustments can be made. Small-scale models are typically validated through laboratory experiments. Building upon these smaller models, larger or full-scale models can then be developed to more accurately address practical engineering applications.
This study focuses on investigating the factors that influence the formation of a corrosive environment under rock wool insulation in pipelines. While rock wool is widely recognized for its thermal insulation and fire-resistant properties, its porous structure allows moisture infiltration, which can create a corrosive environment on the underlying metal surface. Despite the growing attention to corrosion under insulation (CUI) in high-temperature industrial applications, there is limited understanding of how rock wool aging and moisture transport contribute to the development of such corrosive environments. The key challenge addressed in this study is to explore how the interactions between liquid and vapor phases within the rock wool insulation lead to the creation of a corrosive environment on the pipe surface. This study aims to experimentally measure the fluid flow characteristics, including the viscous and inertial resistance coefficients, and incorporate these findings into computational fluid dynamics (CFD) models to simulate the moisture infiltration process and predict the development of corrosive conditions under different operational and environmental factors. By combining experimental research with advanced CFD simulations, this study seeks to quantify the influence of rock wool aging and moisture infiltration on the formation of a corrosive environment under insulation; develop a validated CFD framework to predict the formation of corrosive environments in insulated pipelines under various conditions, such as varying inlet velocities, aging of rock wool, and pipeline inclination; and provide practical recommendations for improving the design and maintenance of insulation systems to mitigate the risks of CUI.

2. Materials and Methods

2.1. Material

As shown in 
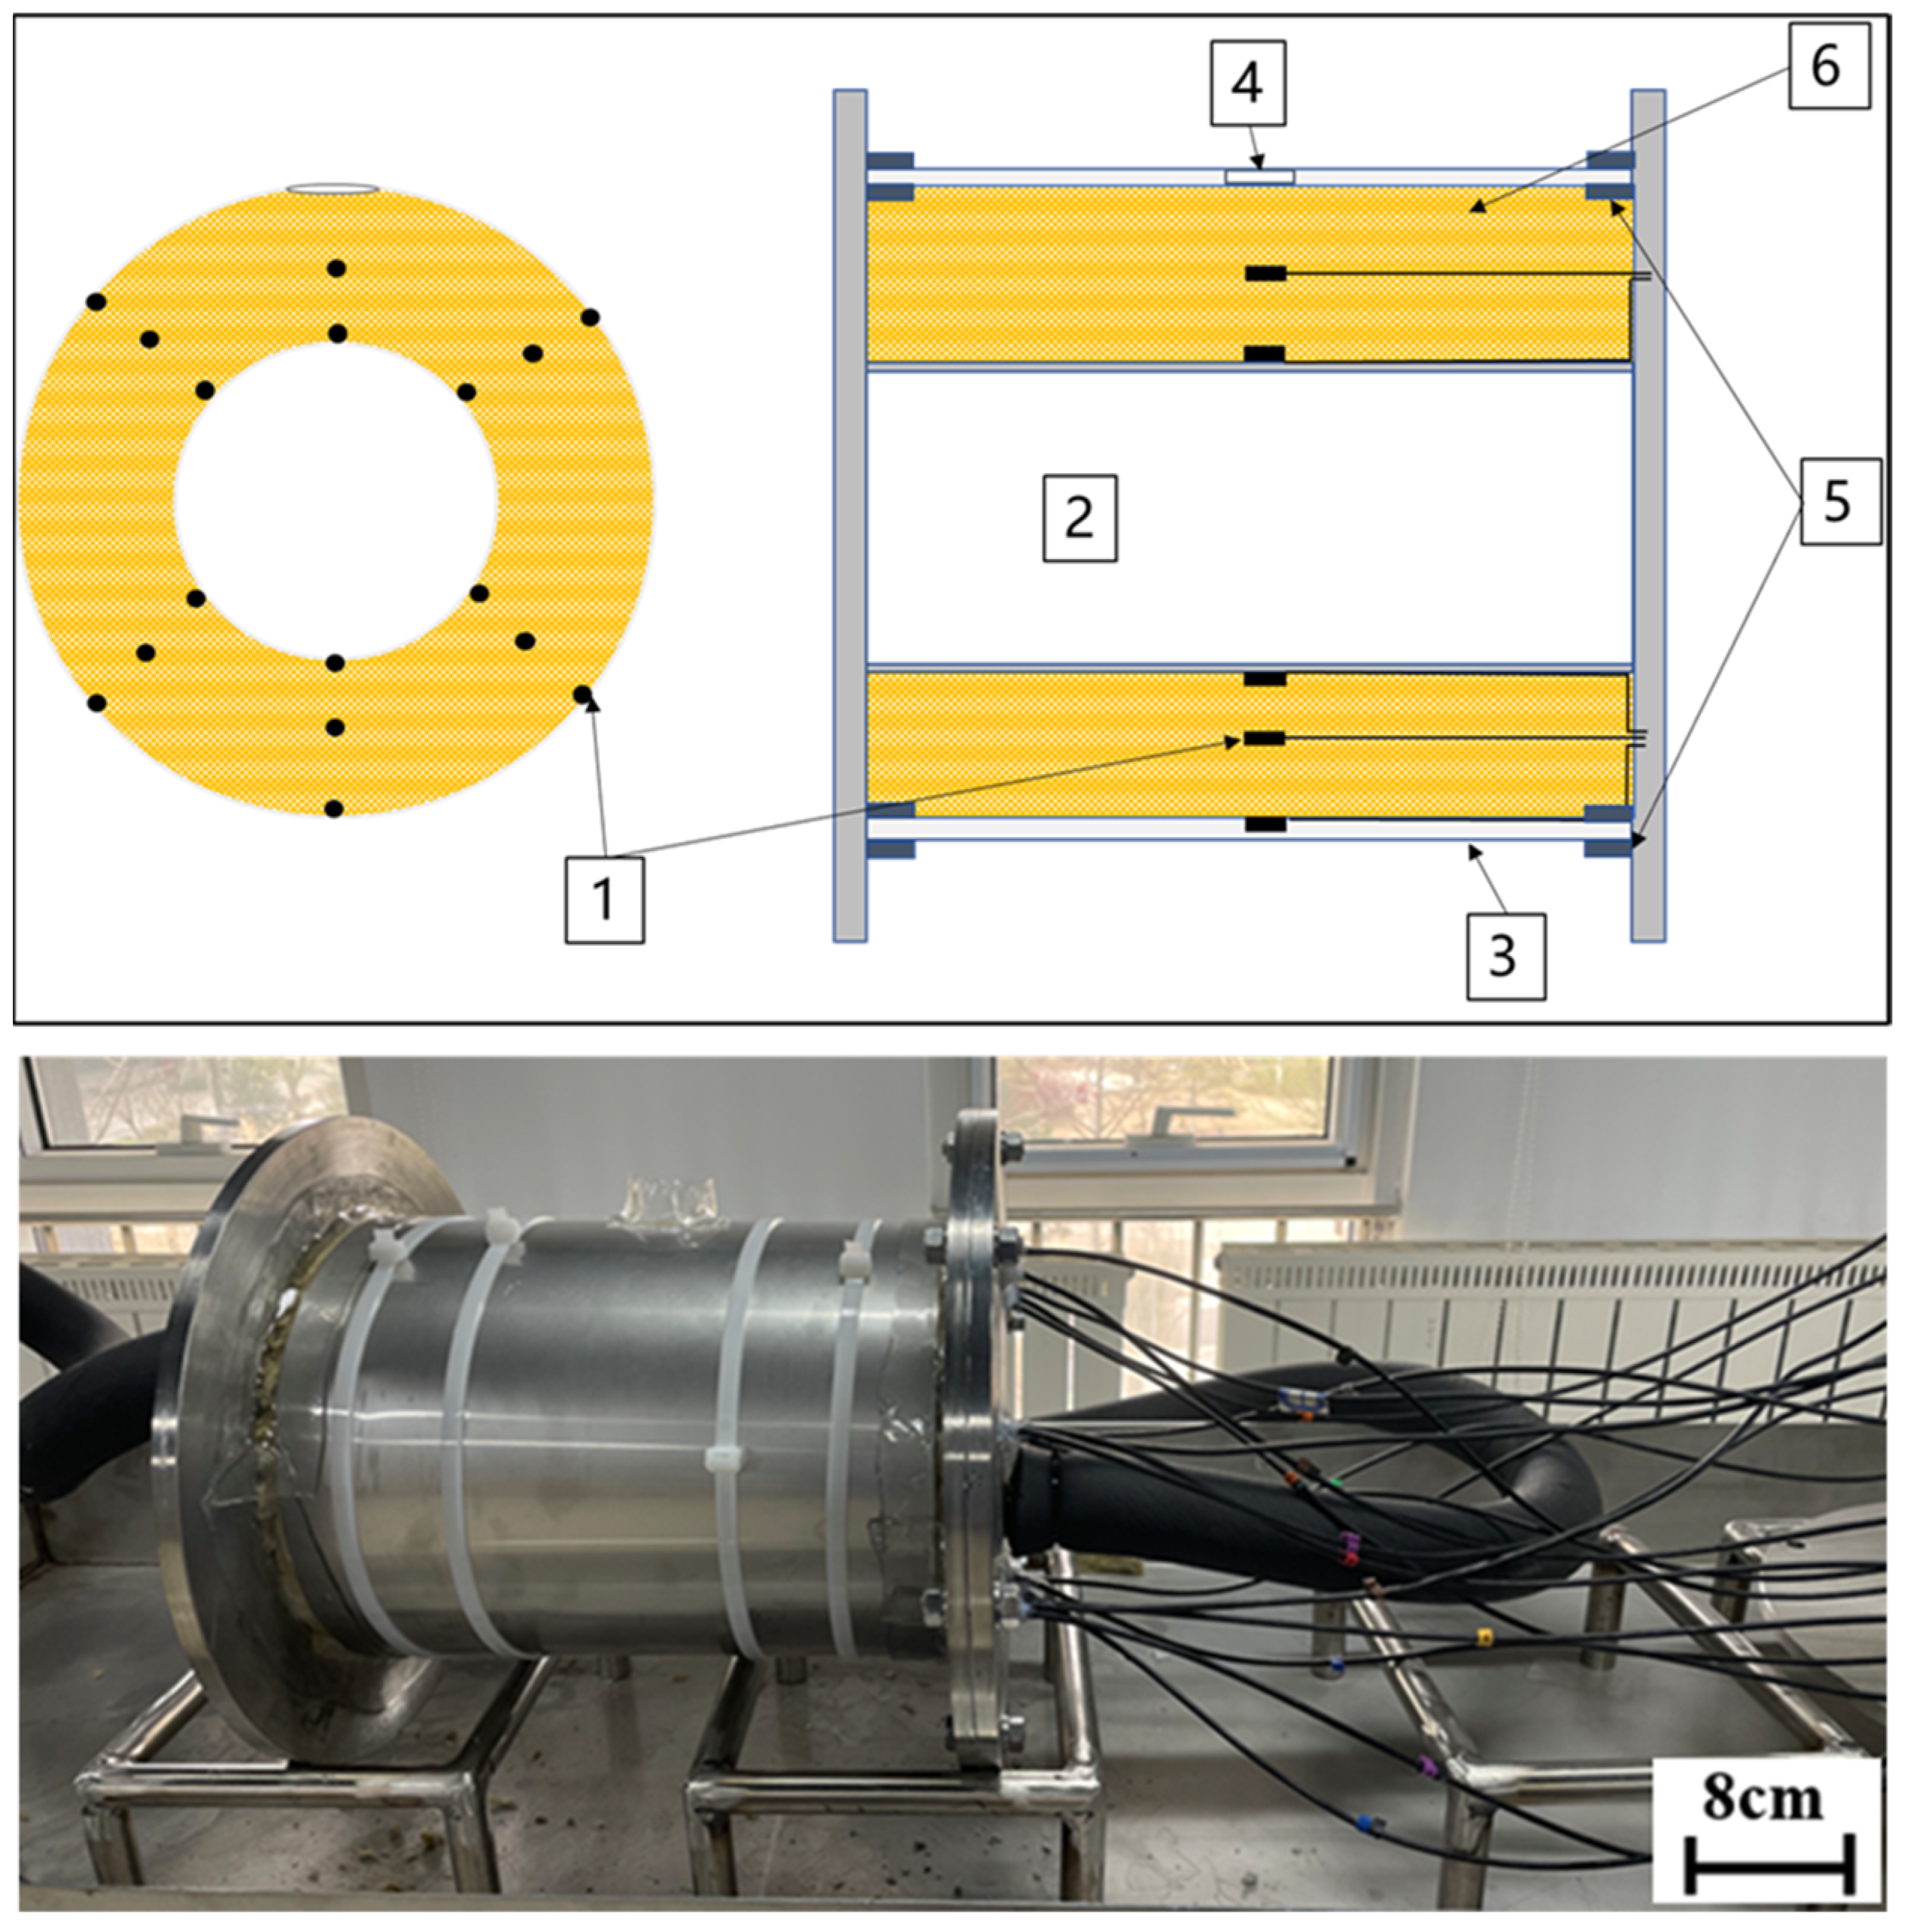
Figure 1, rock wool pipe insulation material was selected for investigation. This insulation was a pipe shell—a hollow cylinder with a concentric ring cross-section featuring an inner diameter of 115 mm and a thickness of 50 mm. Generally, the inner surface fits over the metal pipe, while the outer surface is often covered with a waterproof or fireproof protective layer. Due to the forming process, fibers within the rock wool are aligned in specific directions, resulting in distinct pore structures. According to the cylindrical coordinate system, the rock wool pipe shell is divided into three orientations: the axial direction, which is parallel to the cylinder’s axis of symmetry; the radial direction, which is perpendicular to that axis; and the circumferential direction, which runs tangentially around the circumference.
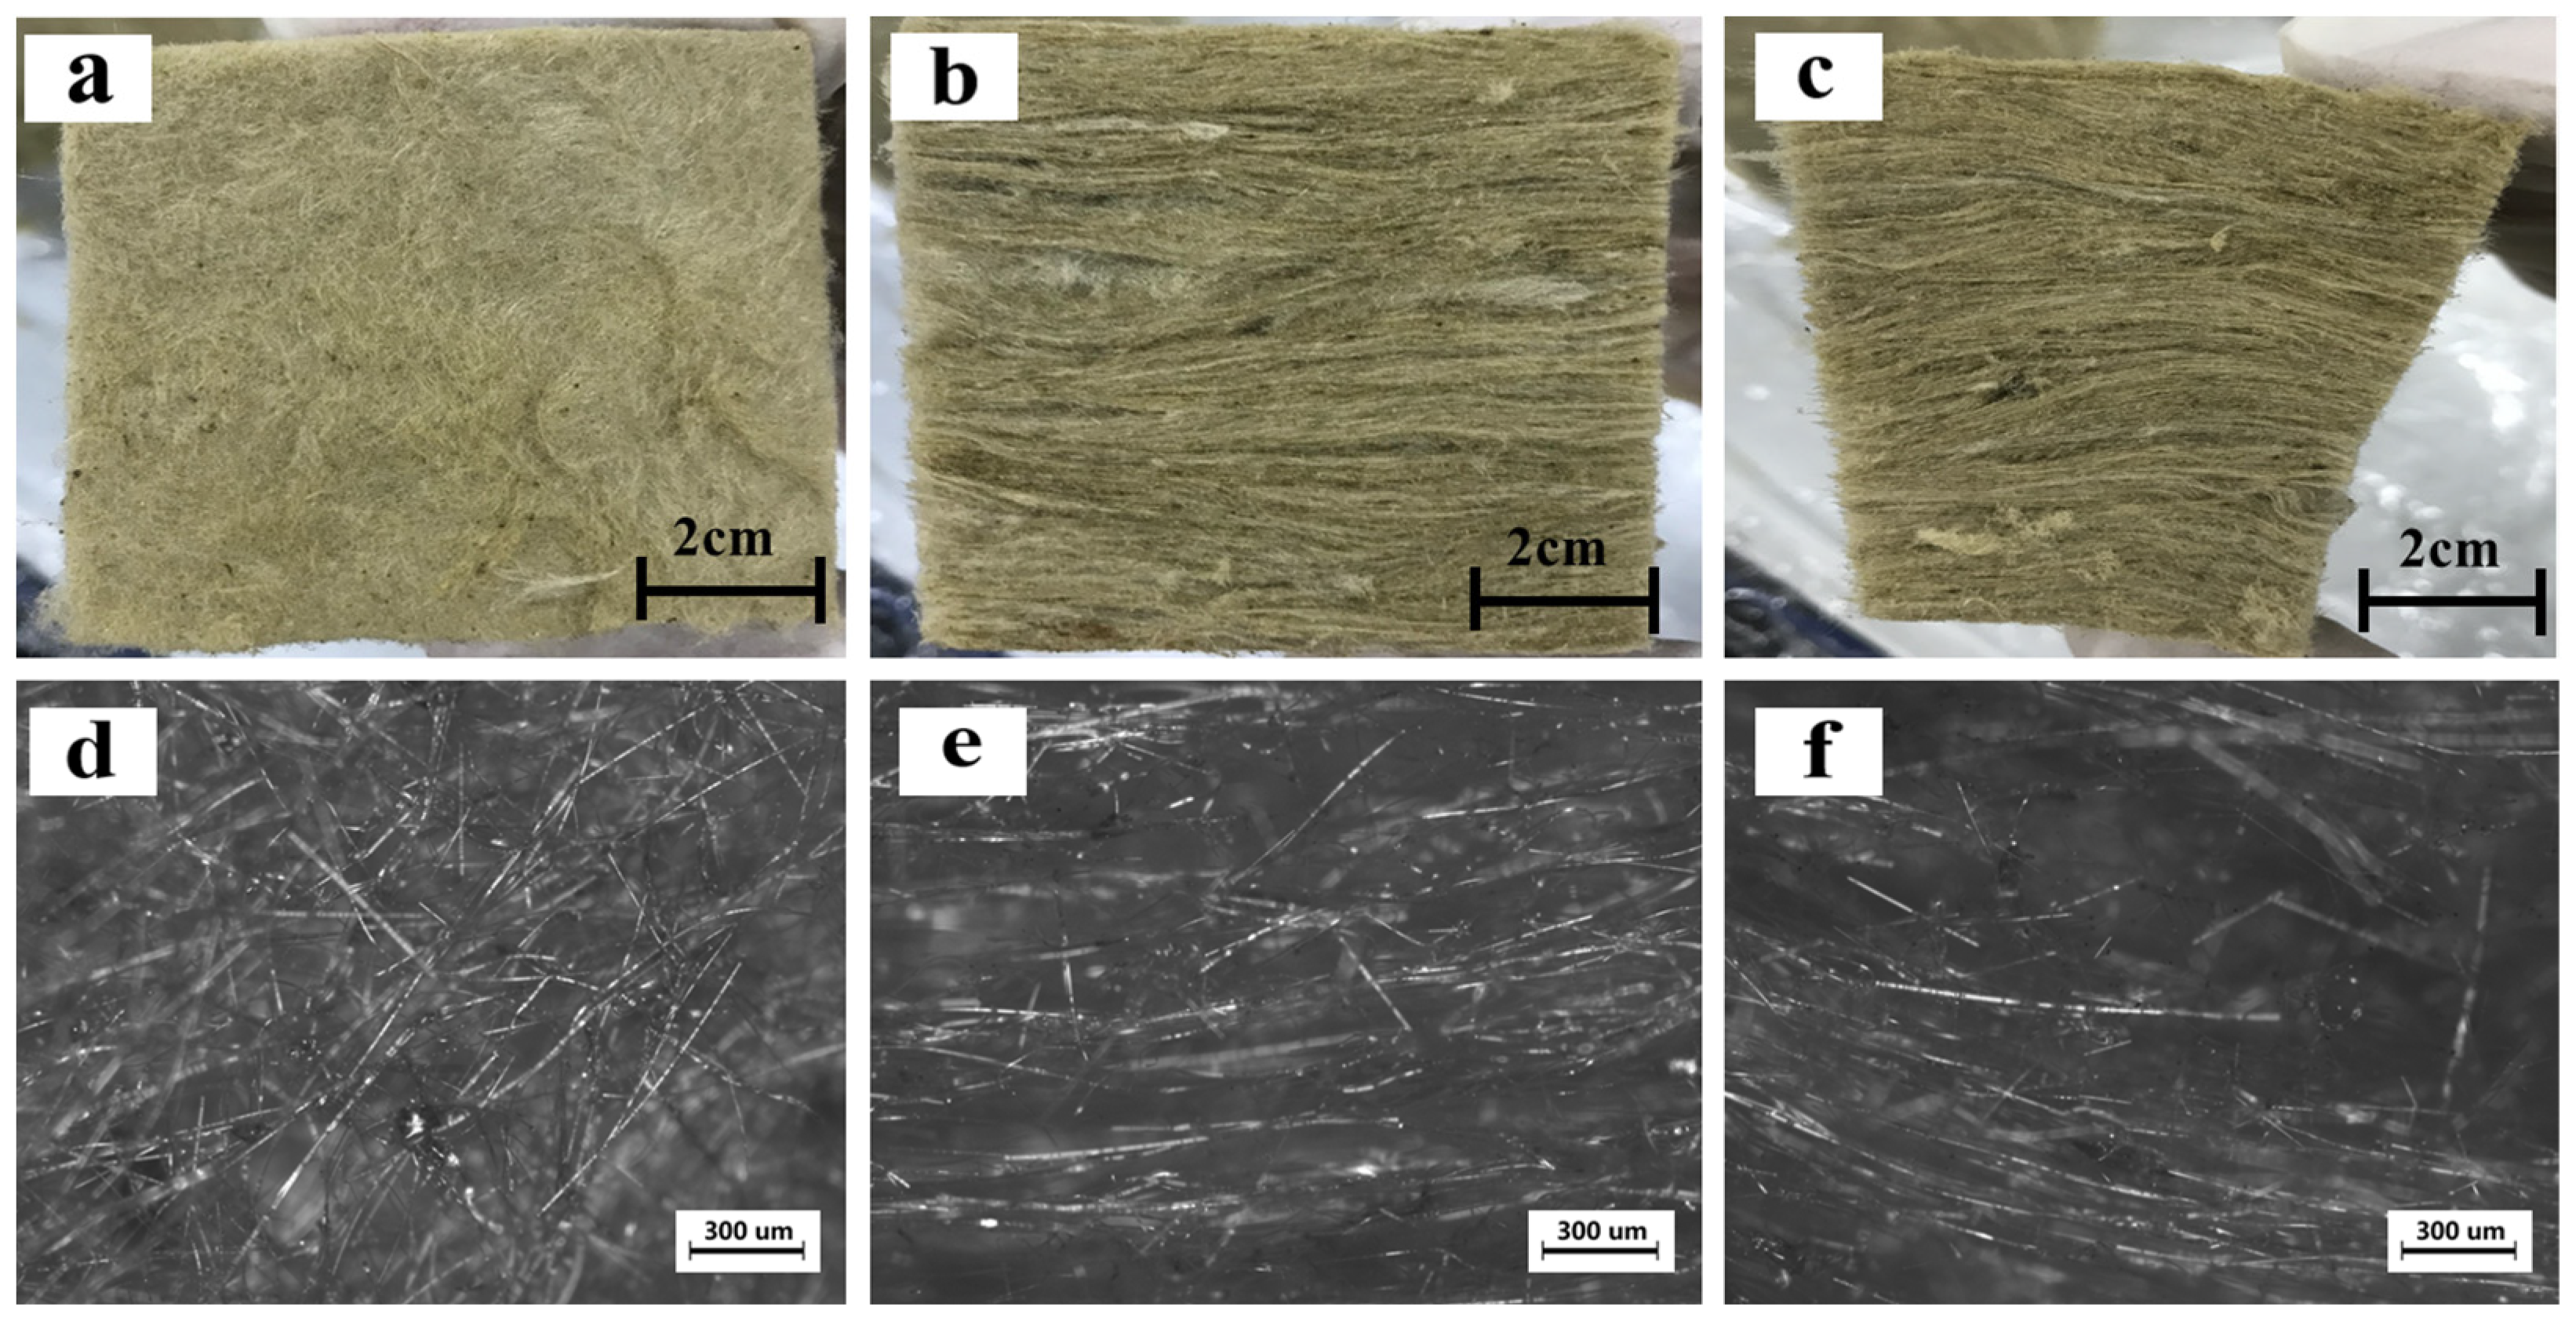
Figure 2 combines macroscopic (Figure 2a–c) and microscopic (Figure 2d–f) images to reveal significant variations in the arrangement of rock wool fibers when viewed from different directions. These differences in fiber alignment result in distinct structural characteristics, which in turn affect the fluid flow through the material by altering both viscous resistance (arising from pore geometry and surface friction) and inertial resistance (resulting from flow deflection and localized acceleration at higher velocities). In the images, the viewing direction aligns with the previously defined orientations of the rock wool pipe shell, so the observed cross-sections are the planes perpendicular to each of these three orientations. In other words, when fluid flows along these orientations, it directly encounters the structural resistance depicted in Figure 2. For instance, in images Figure 2a,d (perpendicular to the radial orientation), the fibers appear randomly yet uniformly arranged, forming densely packed, layered pores; in contrast, the cross-sections perpendicular to the circumferential and axial orientations (shown in images Figure 2b,c,e,f) exhibit more parallel fiber arrangements, with pores that vary in size and extend preferentially along the axial direction in b and e and along the circumferential direction in Figure 2c,f.
Porosity is defined as the ratio of void volume to total volume of the porous medium. It is measured experimentally or provided by the manufacturer. In this study, the porosity of the rock wool used reached 95%.

2.2. Modelling

For the purpose of simulating the flow dynamics of water entering the pipeline insulation system, the following assumptions were adopted:
  • The porosity of the porous medium is uniform;
  • The fluid is incompressible;
  • The viscosity of the fluid is considered constant;
  • The influence of wall friction is neglected.
This study employed CFD simulations to analyze the multiphase flow within rock wool insulation surrounding a pipeline. The simulations were conducted using ANSYS Fluent, a comprehensive CFD software capable of modeling complex interactions in porous media. The methodology integrates fundamental theories of porous media flow, including Darcy’s law, the Forchheimer equation, and the Darcy-Forchheimer model, to accurately represent the resistance to flow within the insulation material. Key aspects of the methodology include the formulation of governing equations, incorporation of relevant physical models, determination of critical parameters, and validation against experimental data.
The Darcy–Forchheimer extended model was used to mathematically analyze the nonlinear flow characteristics of the porous medium. Its essence was to introduce an additional source term into the momentum equation based on the standard Navier–Stokes equation with the help of the relationship between the real flow velocity and the apparent flow velocity, and to prove the viscosity and inertia moment of the material by describing the source fluid. Different from the Darcy seepage model, there were nonlinear terms in the Darcy–Forchheimer extended model to describe the change of flow direction in the material. The equations of the continuity equation and the momentum equation are as follows:
The continuity equation:
( ε ρ ) t + ε ρ U = 0
The momentum equation:
( ε ρ U ) t + d i v ε ρ U = ε p + ε τ ̿ ε B f + S
where ε is the porosity, ρ is the fluid density (kg/m3), U is the velocity (m/s), t is the time (s), p is the pressure (Pa), and τ is the shear stress (N/m2).
In Formula (2), the source term S of the momentum equation reflects the definition of viscosity and inertial resistance caused by the influence of the porous material skeleton as follows:
S = μ α + ρ C 2 2 U U
where μ represents dynamic viscosity(Pa·s), 1/ α is the viscous resistance coefficient, and C2 represents the inertial resistance coefficient.
The real flow rate and the apparent flow rate are related by porosity as follows:
U s u p e r f i c i a l = ε U p h y s i c a l
where U s u p e r f i c i a l is the apparent velocity of the fluid in the porous material, and U p h y s i c a l is the actual flow velocity in the porous material.
In the source term of the momentum equation, the viscous resistance term describes the seepage process in the porous material based on Darcy’s law, and the inertial resistance term is introduced to describe the velocity loss of the airflow in the porous material. The definitions of viscous resistance and inertial resistance are as follows:
Viscous resistance: When a fluid flows slowly in a porous medium, ignoring the convection and diffusion effects and assuming that there is no inertial resistance, the pressure gradient will be proportional to the fluid flow rate, which is a simplified form of Darcy’s law, and the pressure drop expressions in the x, y, and z directions are as follows:
P x = j = 1 3 μ α x j U j n x P y = j = 1 3 μ α y j U j n y P z = j = 1 3 μ α z j U j n z
Inertial resistance: When the fluid flows at high speed in a porous medium, C2 in Equation (3) can be regarded as the inertial loss coefficient per unit length in the flow direction. If the fluid viscosity loss is not considered, the simplified momentum equation in the porous medium is expressed as follows:
P x = j = 1 3 C 2 x j 2 n x U j U P x = j = 1 3 C 2 y j 2 n y U j U P x = j = 1 3 C 2 z j 2 n z U j U
Since the diffusion Darcy model is used to simulate the nonlinear flow characteristics of the fluid between the pores of the porous medium, the source term in the momentum equation reflects the viscosity and inertial resistance of the fluid flowing through the porous material. According to Equations (3), (5) and (6), a one-way simplified expression relationship can be obtained:
P = S i n
Thus,
P = μ α U + ρ C 2 2 U 2 n
where n is the length of the porous medium material through which the fluid flows.
Consequently, the viscous and inertial resistance coefficients of the porous medium can be directly derived from the pressure drop–velocity data obtained in Darcy flow experiments. These coefficients are then integrated into the mass-transfer model for the porous medium, ensuring that the CFD simulations closely reflect real operating conditions.
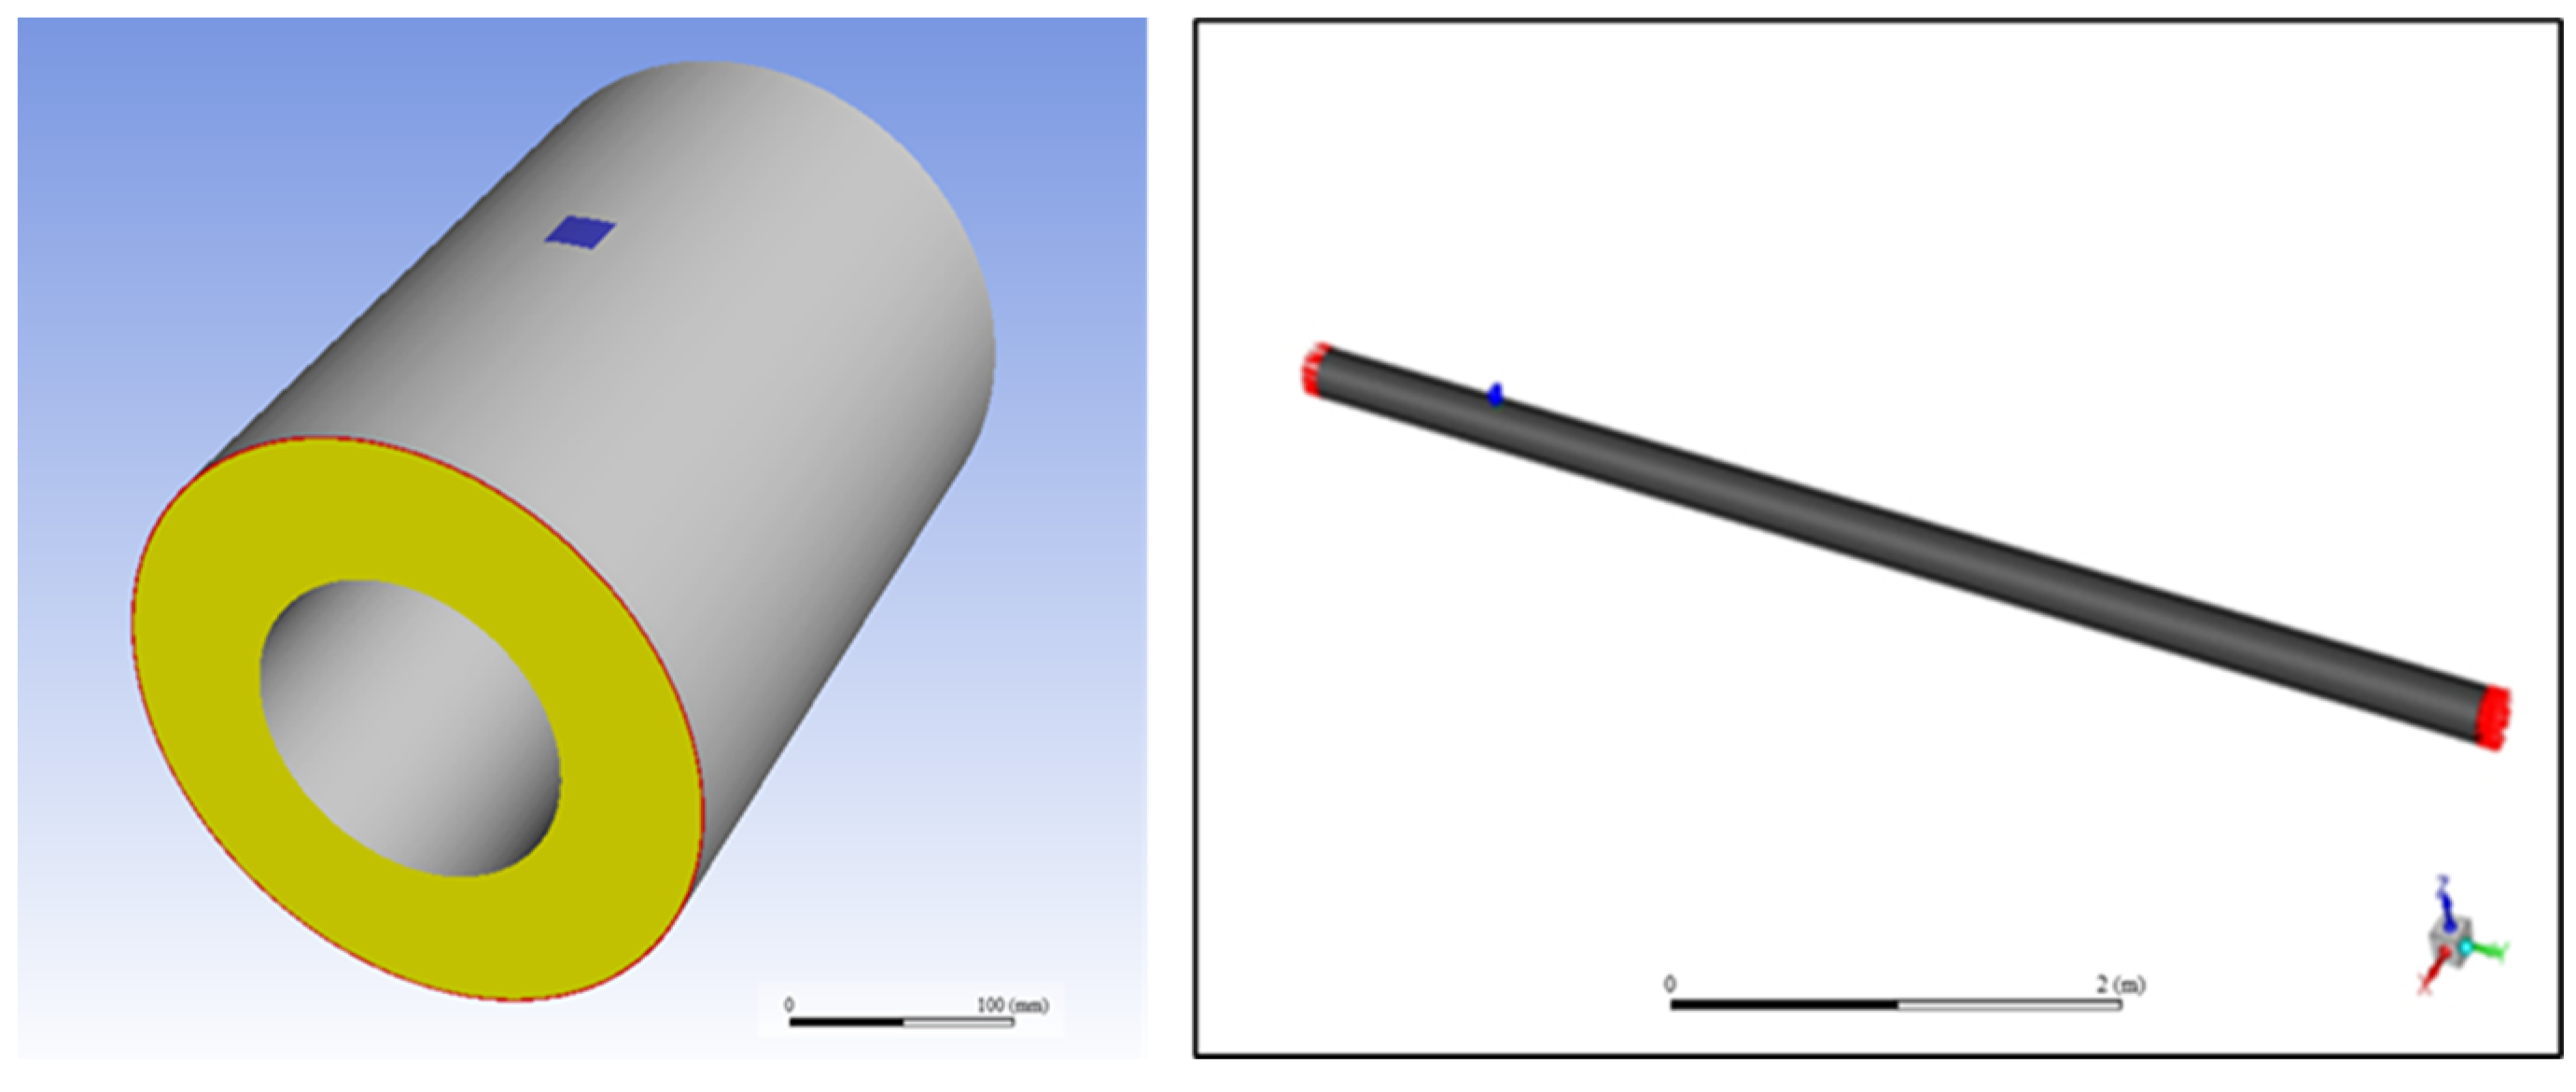
After obtaining the viscous and inertial drag coefficients through experiments and calculations, two three-dimensional simulation models were established: a small-scale model and a large-scale model. For the small one, according to the size of the actual rock wool insulation shell and the size of the experimental device, a hollow cylindrical model with an inner diameter of 115 mm, an outer diameter of 215 mm, a thickness of 50 mm, and a length of 300 mm was established as porous zone. In addition, two 1 mm-thick non-porous fluid domains were included on the inner and outer sides of the porous zone, respectively, to represent the gaps between the insulation and the metal pipe surface and between the insulation and the external protective layer. A 20 × 20 mm water inlet was left at the center of the horizontal top of the shell. For the large-scale model, the thicknesses of the fluid zones were established the same as the small one, but the length reached 6 m, and the inlet was located at a distance of 1 m from one outlet side, as illustrated in Figure 3.
After completing the grid generation and quality inspection, a mesh sensitivity analysis was performed to ensure the accuracy and reliability of the simulation results. Different mesh densities were tested, and the results were compared to identify an optimal mesh that provides stable and accurate predictions of the fluid flow. Following this analysis, the CFD software ANSYS-FLUENT 17.0 was employed to simulate the environmental conditions of CUI using the volume of fluid (VOF) model to capture the flow process of both the liquid water and the air phases within insulated piping systems.
The k–ω SST turbulence model was selected, and transient simulations were performed with the influence of gravity taken into account. To ensure accurate near-wall resolution with the k–ω SST model, five uniform inflation layers were applied to all pipe walls, with the first layer thickness set to 0.02 mm and all layers having equal thickness (growth rate = 1). This mesh arrangement guarantees that the dimensionless wall distance y+ remains below 1 for all wall cells, placing them entirely within the viscous sublayer. Post-processing via Fluent’s Wall-Y+ contours confirmed that y+ never exceeded 1, demonstrating the adequacy of the mesh refinement and wall treatment. For the small-scale model, the inlet velocity was set at 0.005 m/s with a 100% liquid phase volume fraction. The top opening of the insulation layer faced vertically downward into the porous region, while all other boundaries were treated as no-slip walls. The computational domain was selected as the porous medium region, where the porosity was defined as 0.95 (matching the actual porosity of the rock wool insulation material). The experimentally determined viscous and inertial resistance coefficients were used as input parameters to define the porous medium properties. Since the model only involves mass transfer and does not account for temperature effects, a default temperature of 300 K was assumed. During the solution of the momentum and continuity equations, the pressure and velocity were coupled using the SIMPLE algorithm, and pressure discretization was carried out with the PRESTO scheme. Because the main parameters evolve over time, the calculation was performed as a transient simulation. After verifying time-independence, a time step of 0.05 s was chosen, with 20 iterations per time step to ensure convergence (with a convergence criterion set to a residual of less than 10−3 for both the continuity and momentum equations). The inlet boundary condition was maintained for 300 s, after which the flow was halted, and the subsequent redistribution of water was monitored. During the simulation, the velocity, pressure, and liquid water content were tracked over time to capture the transient flow behaviors.
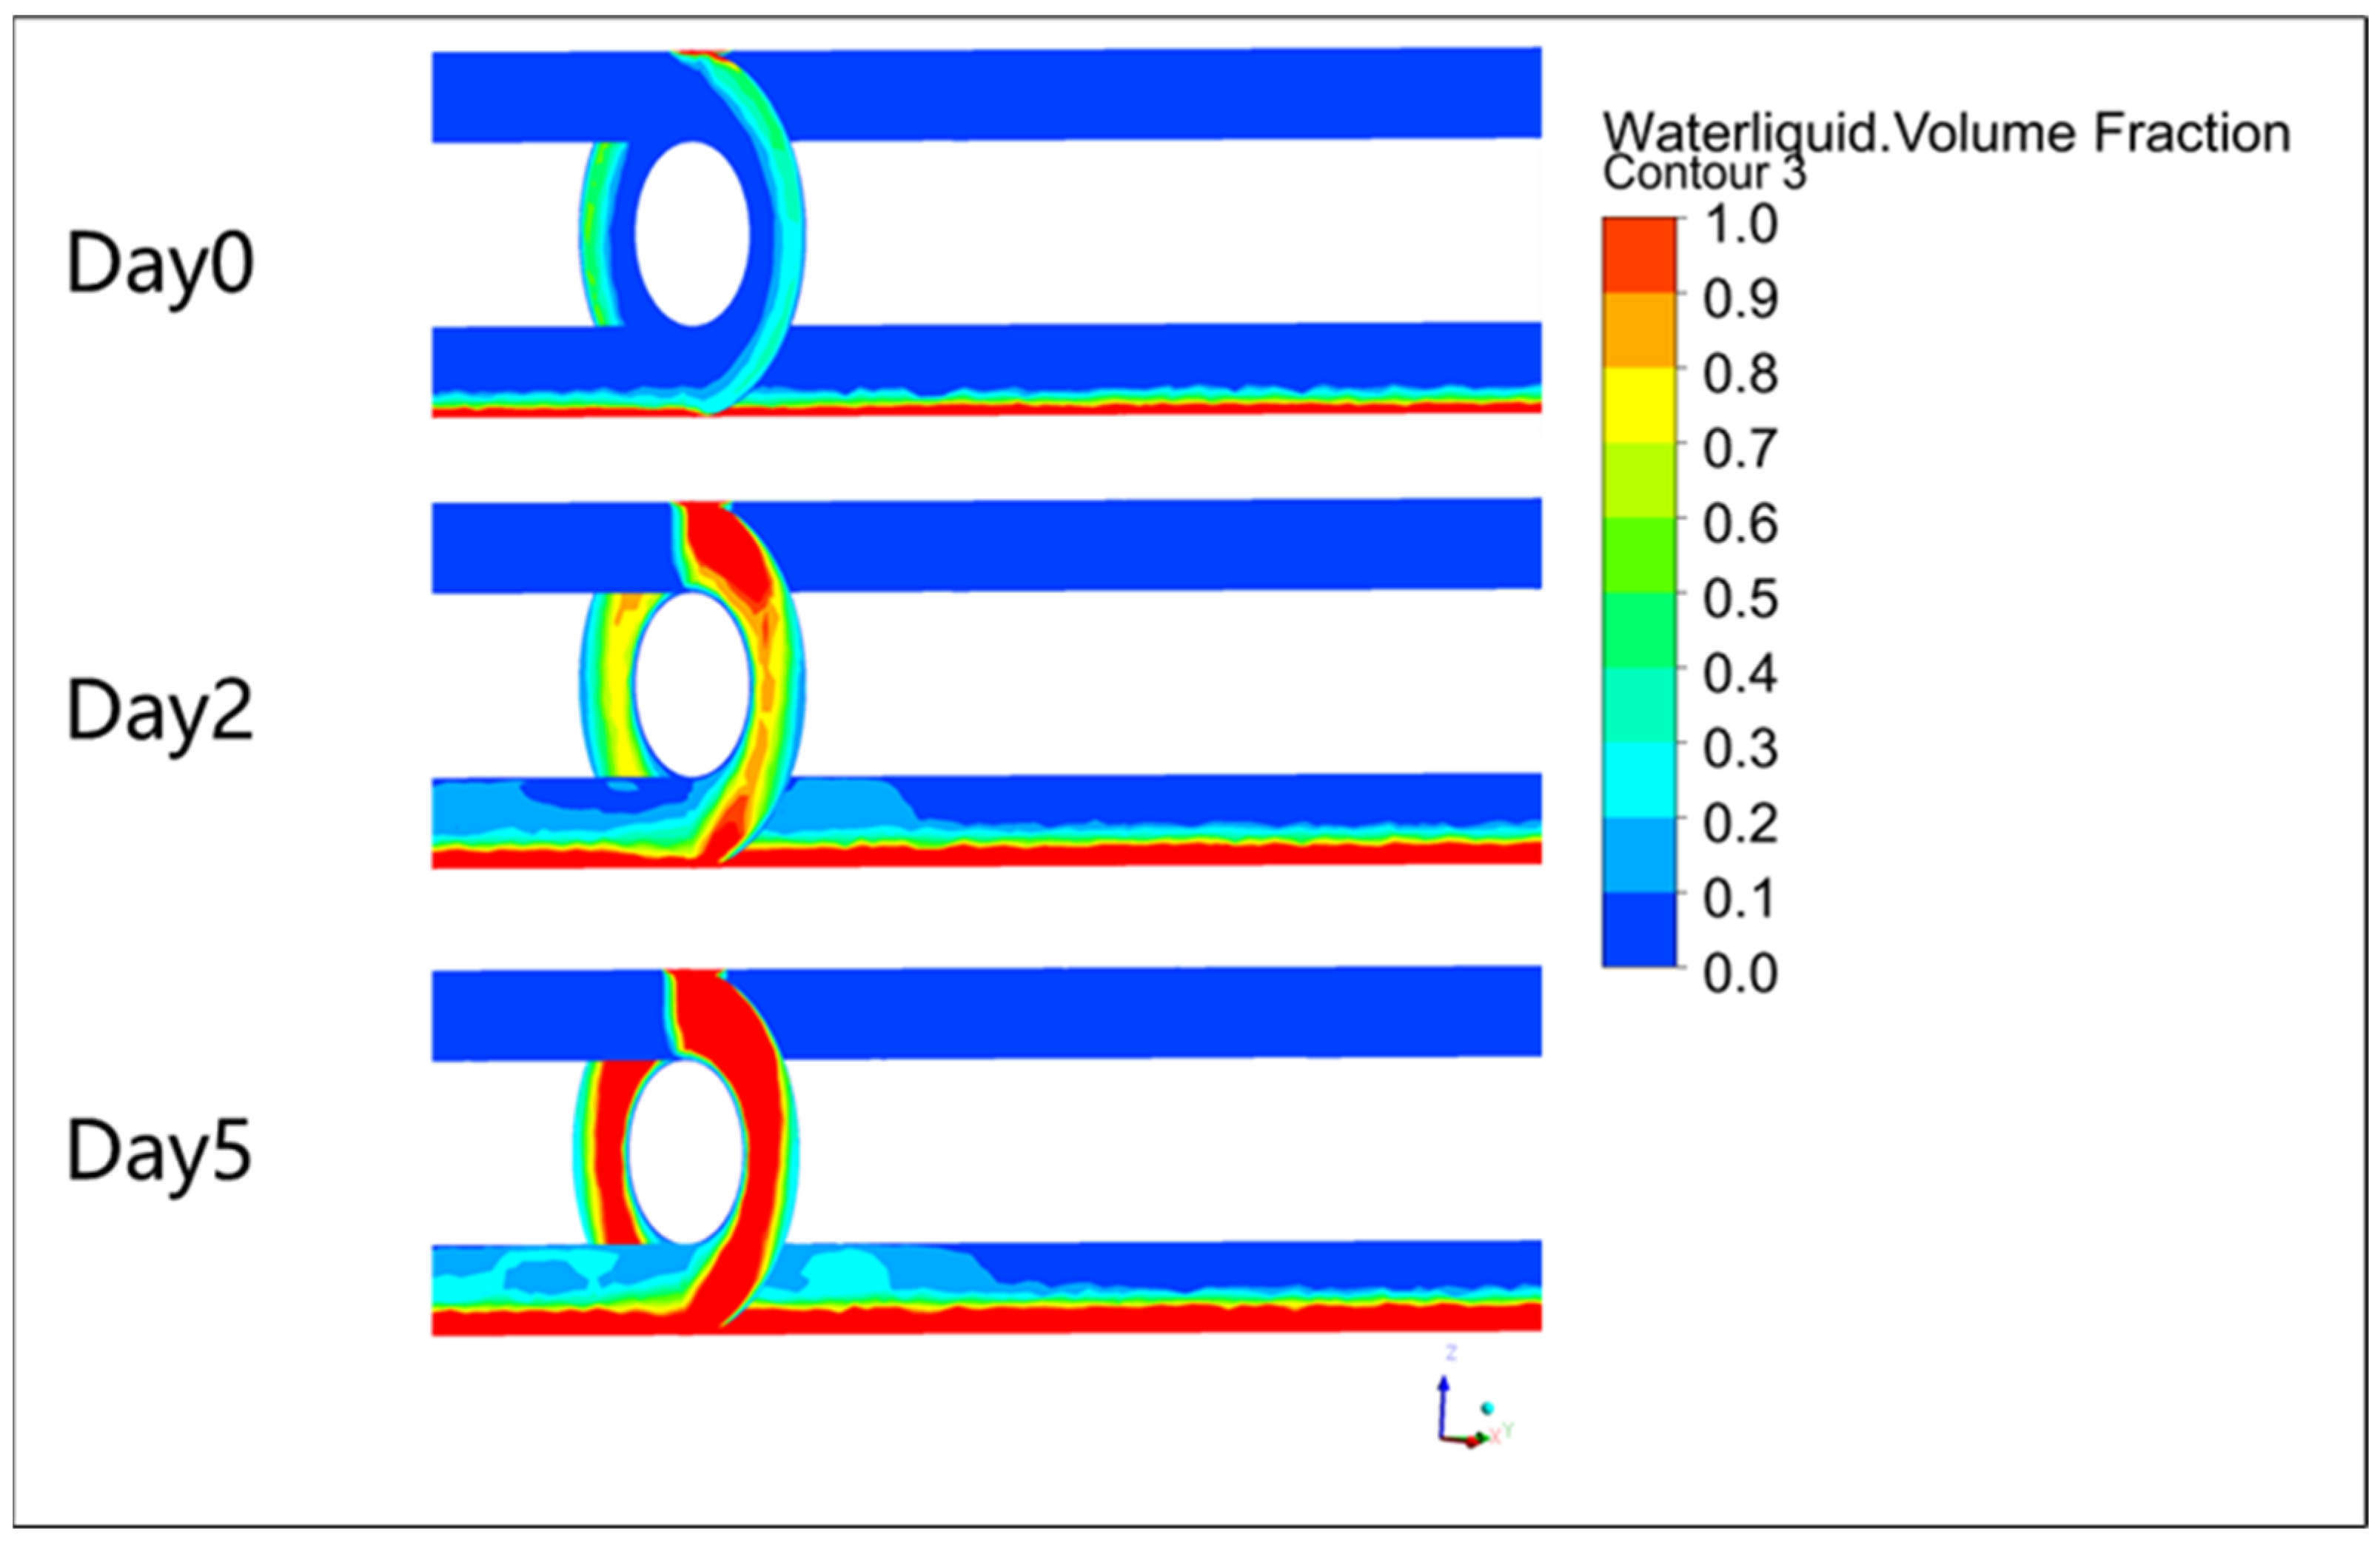
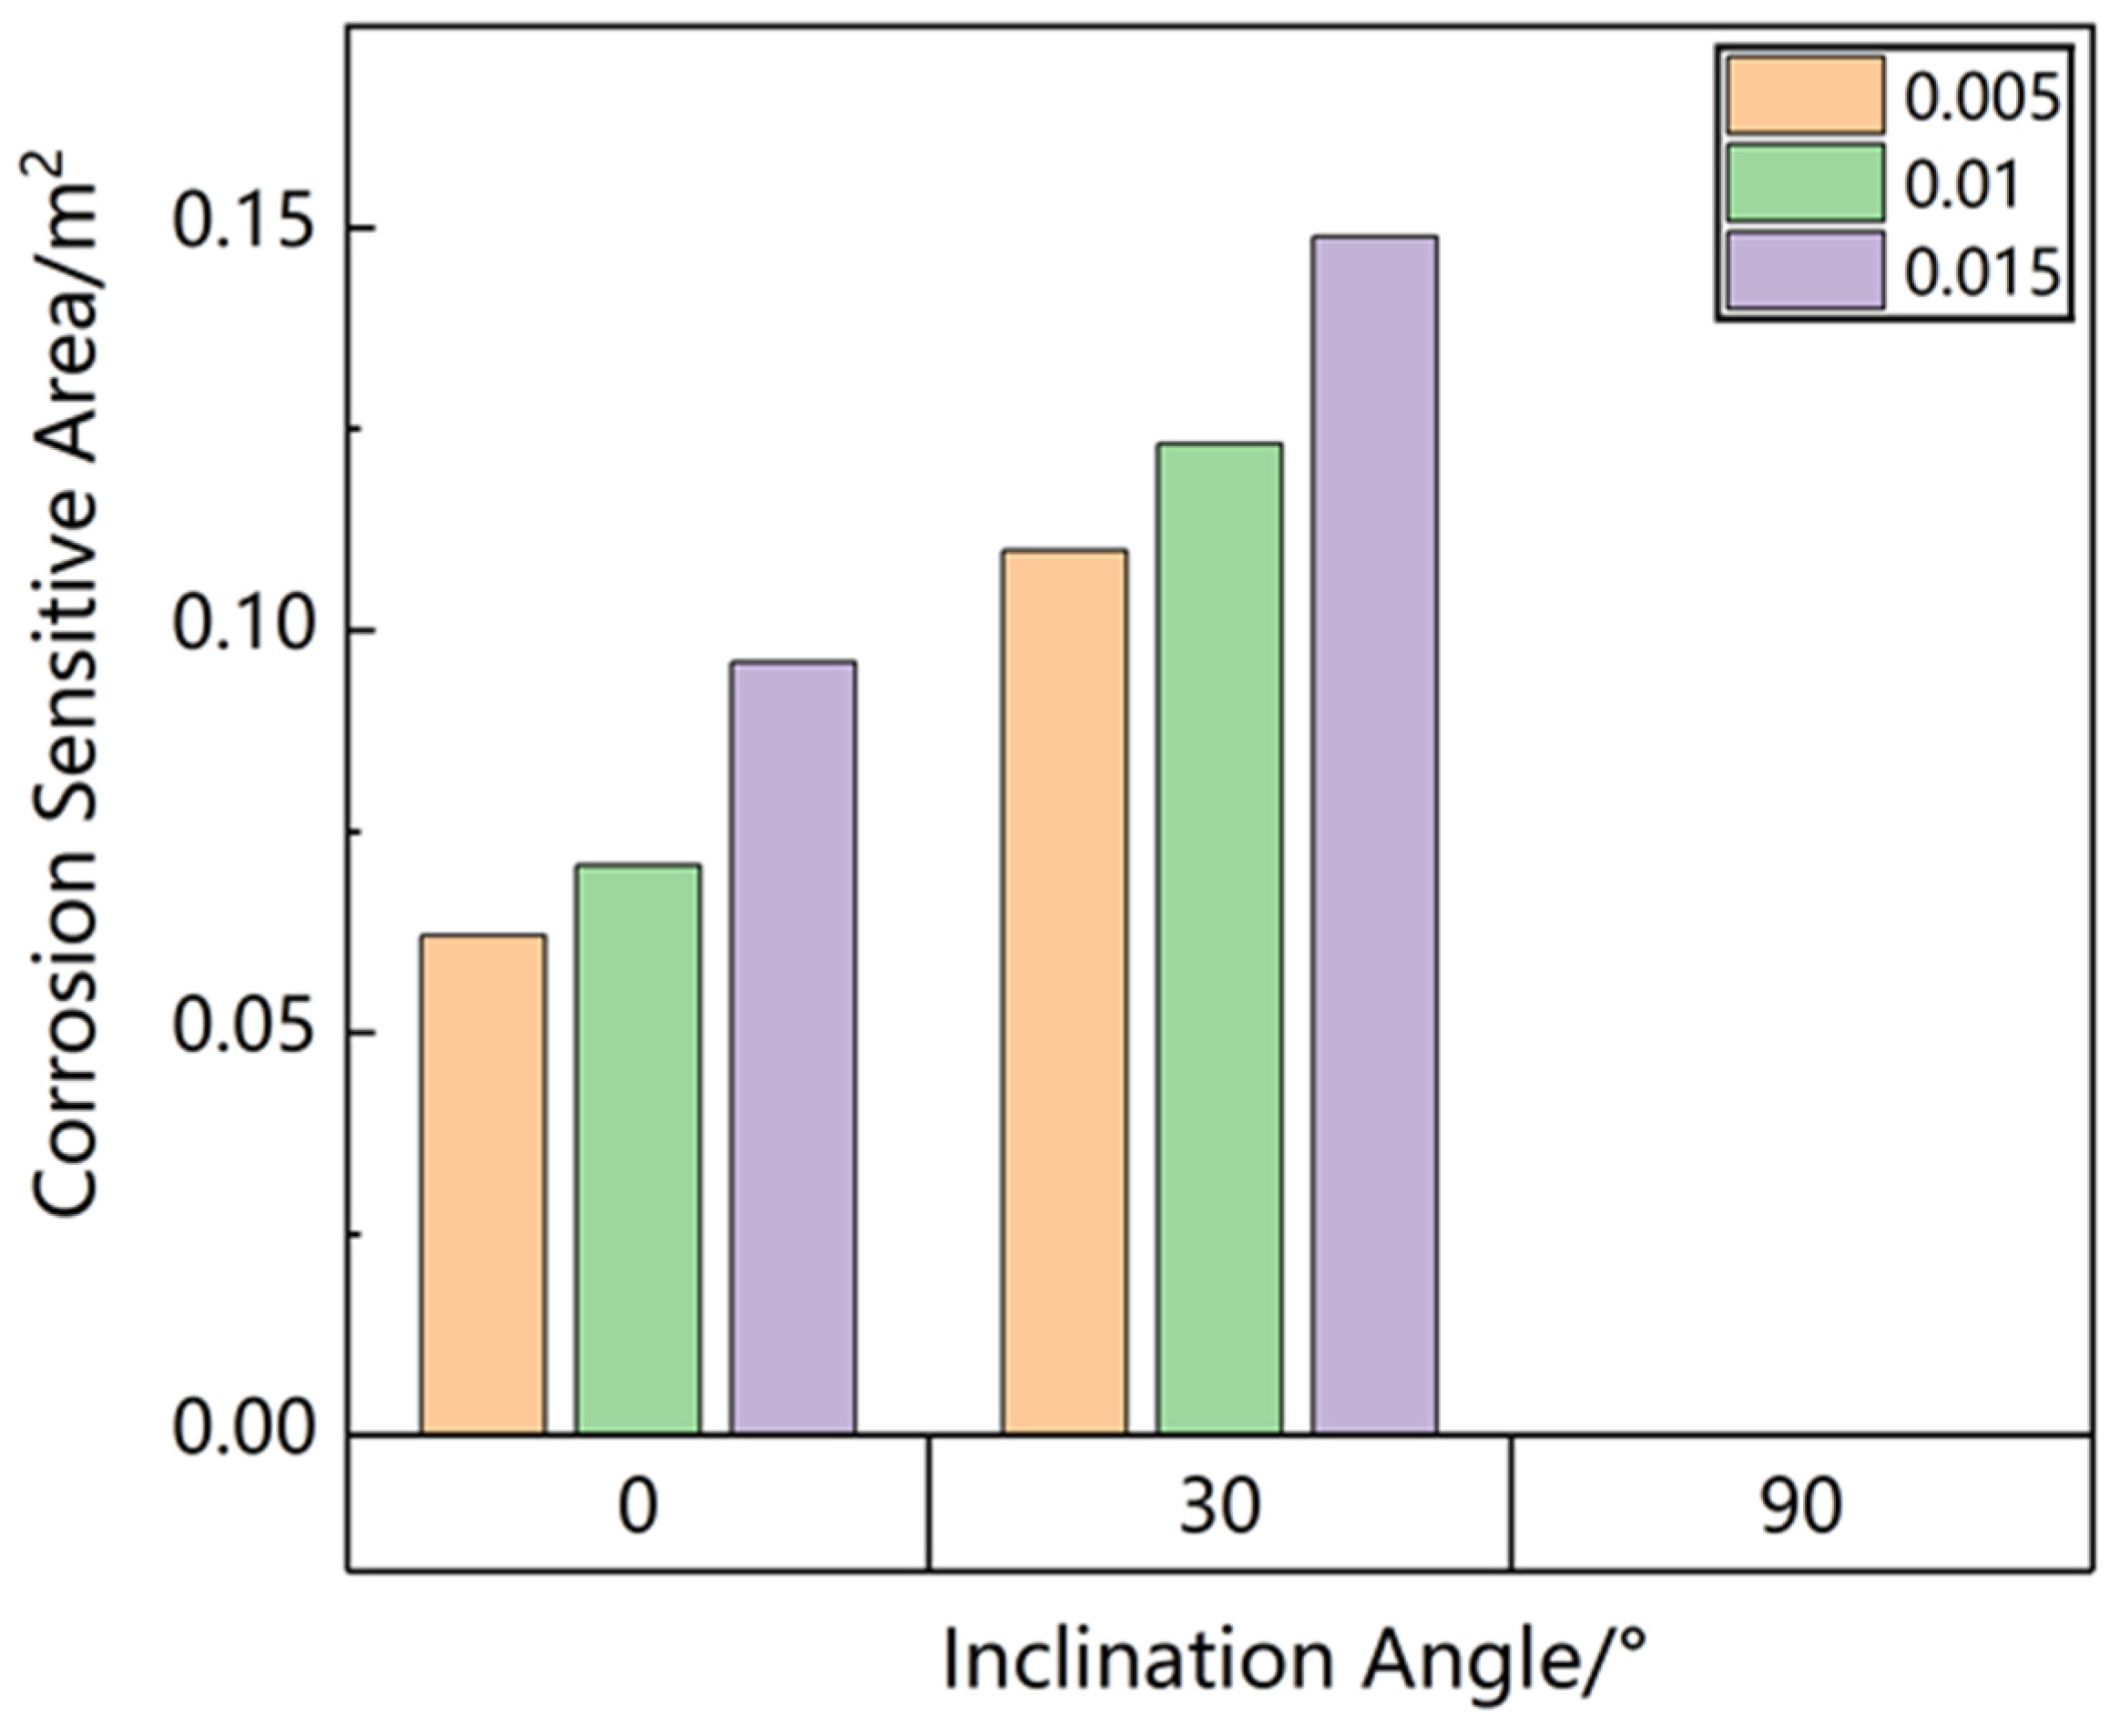
For the large-scale models, they were constructed based on the verified small-size models. A series of different conditions was investigated: inlet velocities were 0.005 m/s, 0.01 m/s, and 0.015 m/s; rock wool at three aging states (Day 0, Day 2, and Day 5, representing the new, relatively new, and old rock wool, which will be mentioned in the following experiments); different pipe inclination angles were 0° (horizontal), 30°, and 90° (vertical). These combinations aimed to mimic various real-world scenarios in which fluid flow through the pipe insulation could form corrosive conditions conducive to CUI. To optimize computational resources and address varying convergence rates under different flow conditions, an adaptive time-step scheme was used, with a minimum simulated duration of 3000 s for all cases.

2.3. Experiments

In this section, two experiments are presented: one is the data measurement of fluid flowing through rock wool material, and the other is the experiment simulating water entering the pipe insulation system as a verification experiment for the small-scale simulation model.
Due to the addition of hydrophobic agents in rock wool insulation—especially in newly produced material, where the high concentration of hydrophobic agents results in very strong surface hydrophobicity—liquids have difficulty penetrating and fully distributing within the insulation layer. This, in turn, affects the measurement of mass transfer resistance coefficients and the subsequent simulation of corrosion environments. Therefore, before investigating the porous mass transfer resistance coefficients of rock wool insulation, it is essential to fully consider the impact of its hydrophobicity on fluid behavior. In this study, a series of cyclic immersion-drying experiments on rock wool insulation were designed and conducted to simulate the gradual decay of hydrophobic performance that occurs after a period of service. This pre-treatment provided the necessary experimental materials for subsequent tests.
A semi-cylindrical sample with an inner diameter of 115 mm, a thickness of 50 mm, and a length of 300 mm was prepared in this experiment. During the immersion experiment, the sample was completely submerged in a rectangular water tank (1000 mm × 600 mm × 500 mm) filled with deionized water. Due to the strong hydrophobicity of the material—especially in newly produced rock wool with a high concentration of hydrophobic agents—the surface resists wetting, leading to the formation of air layers on both the surface and within localized regions. Consequently, the overall density of the sample becomes lower than that of water, causing it to float. To counter this, a weighting bracket was employed to press the sample at least 20 mm below the water surface. The design of the bracket ensured that the sample was completely submerged without being deformed. The water tank was also equipped with a thermostatic heating rod to maintain the water temperature.
The experimental procedure was as follows: The rock wool sample was fully immersed in deionized water heated to 90 °C and maintained at that constant temperature. Under the action of the weighting bracket, the sample remained stationary in the water for 24 h. After 24 h, the sample was removed and allowed to drain on a sieve for one hour, then transferred to a drying oven at 90 °C for 5 h (a duration verified to achieve complete drying), thus completing one immersion–drying cycle. Experiments were conducted for 1, 2, 3, 4, and 5 cycles, with three parallel tests for each cycle, resulting in three samples under identical conditions for subsequent flow and mass transfer experiments. Since each cycle involved one day of immersion, the samples were labeled as Day 1 through Day 5 according to the number of cycles performed, and Day 0 represented new rock wool.
This repeated immersion and drying process simulates the gradual decay of hydrophobic performance that occurs in real-world applications after prolonged use. The high-temperature water accelerates partial hydrolysis or deactivation of the hydrophobic agents, thereby rendering the material’s mass transfer characteristics more representative of those in insulation materials exposed to liquid media (such as rainwater, condensate, or steam) over extended periods.

2.3.1. Porous Media Flow Experiments

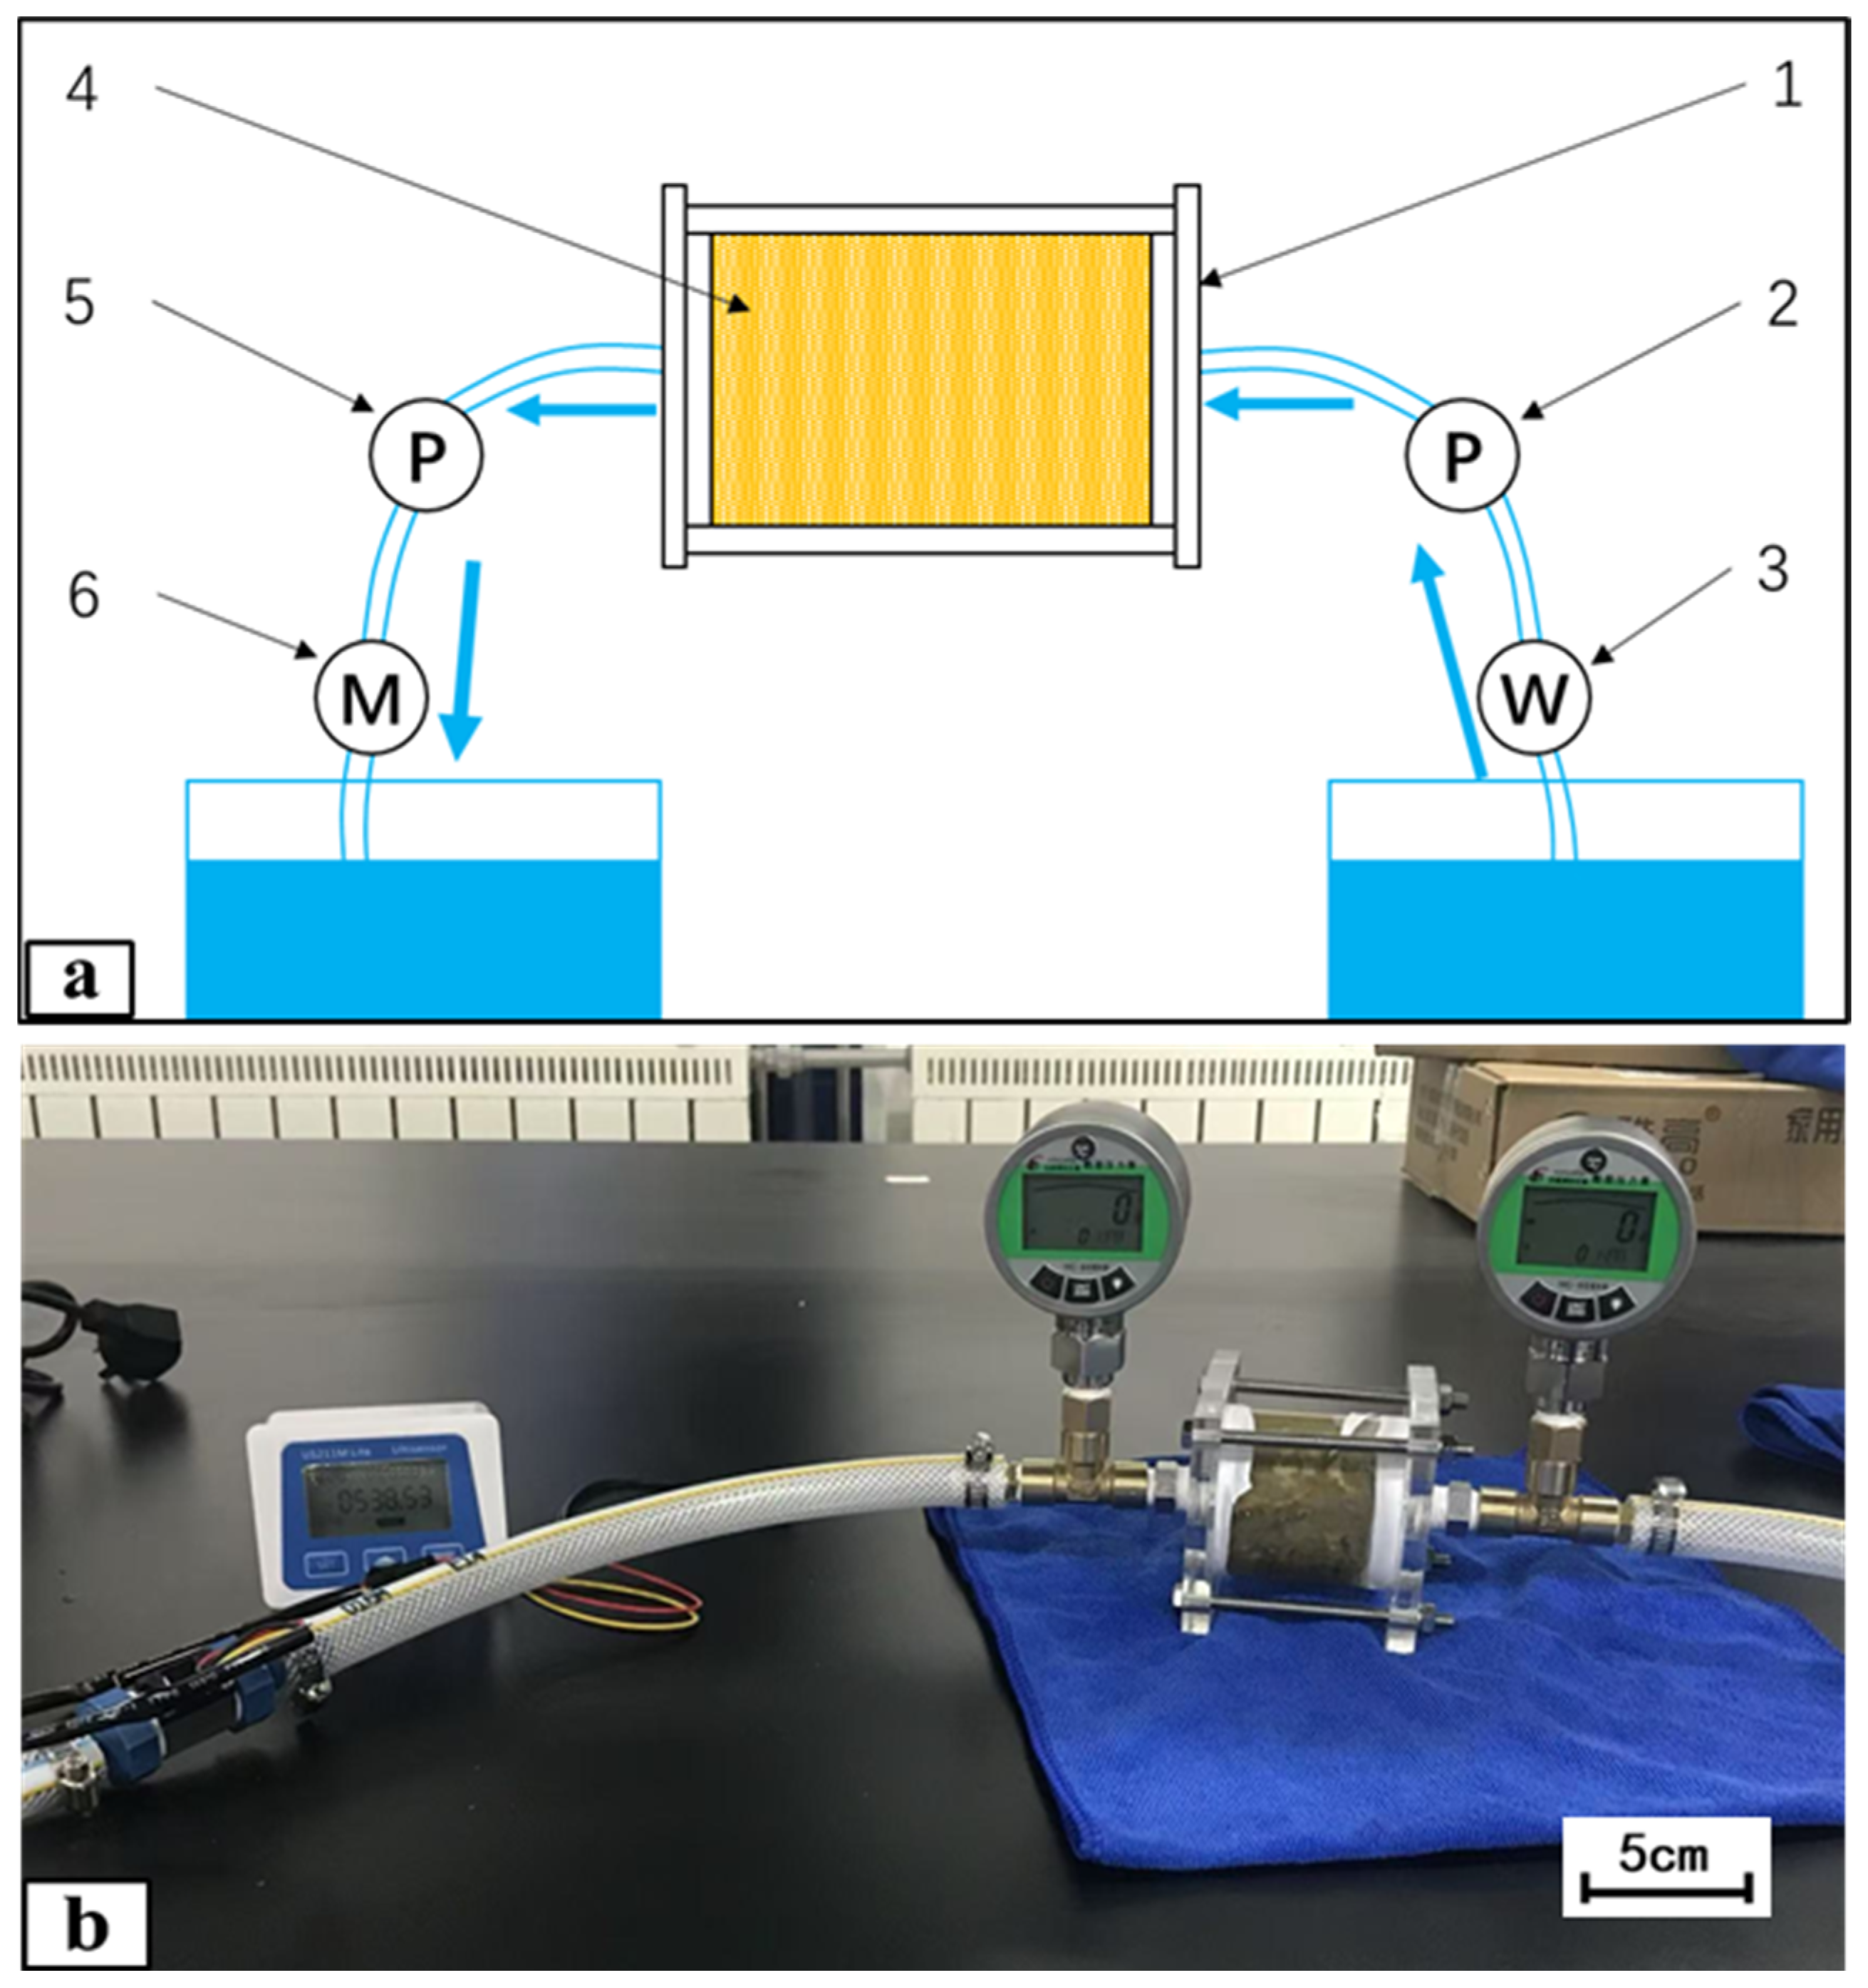
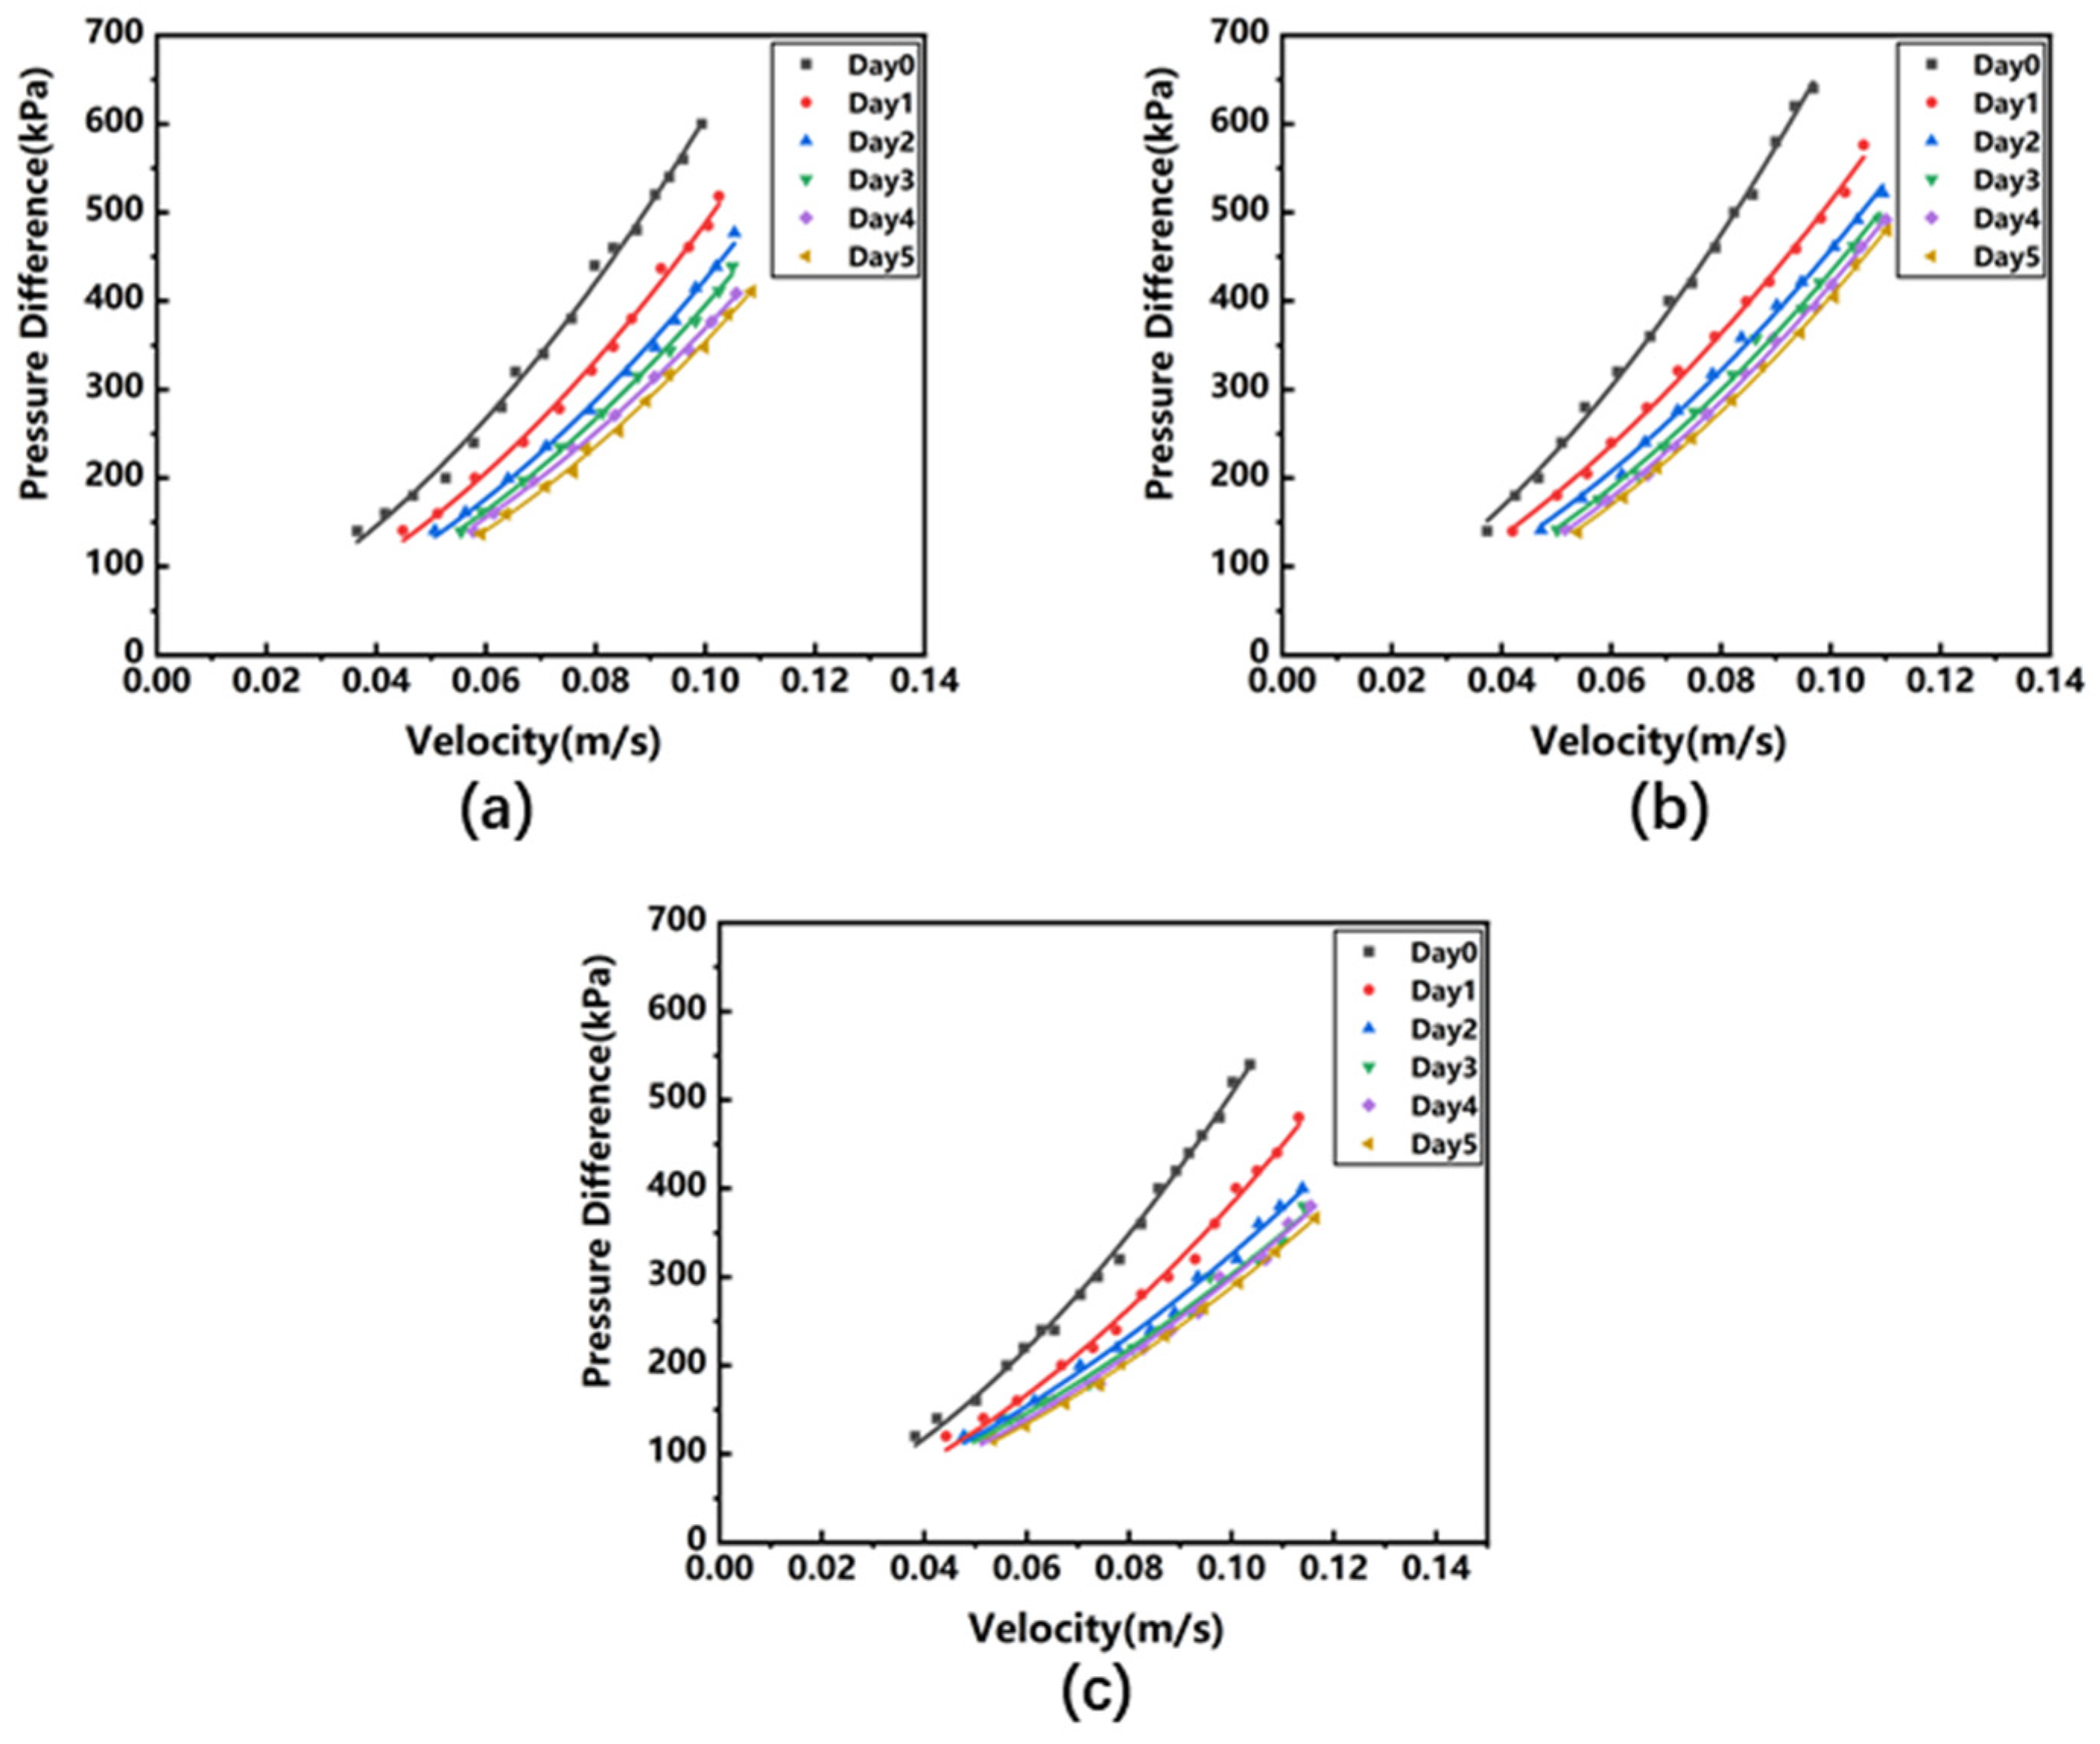
Figure 4 illustrates a measurement apparatus for determining the mass transfer coefficients in porous media, specifically designed for rock wool insulation. The apparatus is based on the conventional Darcy experimental setup and is tailored to the geometric dimensions of the rock wool insulation shell (inner diameter 115 mm, outer diameter 215 mm, thickness 50 mm). The apparatus includes an acrylic tubular experimental container (transparent for easy observation) with an inner diameter of 50 mm (matching the insulation shell thickness), a length of 60 mm (slightly longer than the sample to allow for fluid accommodation), and a wall thickness of 3 mm. High-precision digital pressure gauges (denoted as P in the figure), with a range of 0–1.6 MPa and an accuracy of 0.1 grade (±1.6 kPa measurement error), are installed at both ends of the container to monitor pressure during flow. On the inlet side, a water pump draws water from a reservoir and injects it into the flow channel, creating a liquid flow system; at the outlet, a liquid flow meter measures the flow rate and converts it into flow velocity. Additionally, the connecting pipes are sufficiently long to ensure a stable flow state (with the inlet pipe length set at 1.2 m, and the outlet at 1 m, using PVC pipes with an inner diameter of 12 mm). Before introducing the rock wool sample, baseline (blank) tests were conducted with an empty container to record systematic pressure drops at various flow rates. These measurements reflect inherent losses due to structural changes and friction within the flow channel, independent of the porous sample. When experiments are performed with the rock wool sample in place, the measured pressure drop values are adjusted by subtracting these inherent system losses. This procedure yields the additional pressure drop attributed solely to the porous structure of the rock wool sample, allowing for a more accurate calculation of the viscous and inertial resistance coefficients. The rock wool experimental samples were prepared using a metal cylinder with an inner diameter of 50 mm, which was processed into a thin “cylindrical cutter” to directly encase and trim the material along the three orientations shown in Figure 1. The circumferential orientation was obtained by cutting tangentially. As the sample diameter matched the inner diameter of the apparatus, the samples could be installed with a precise and seamless fit.
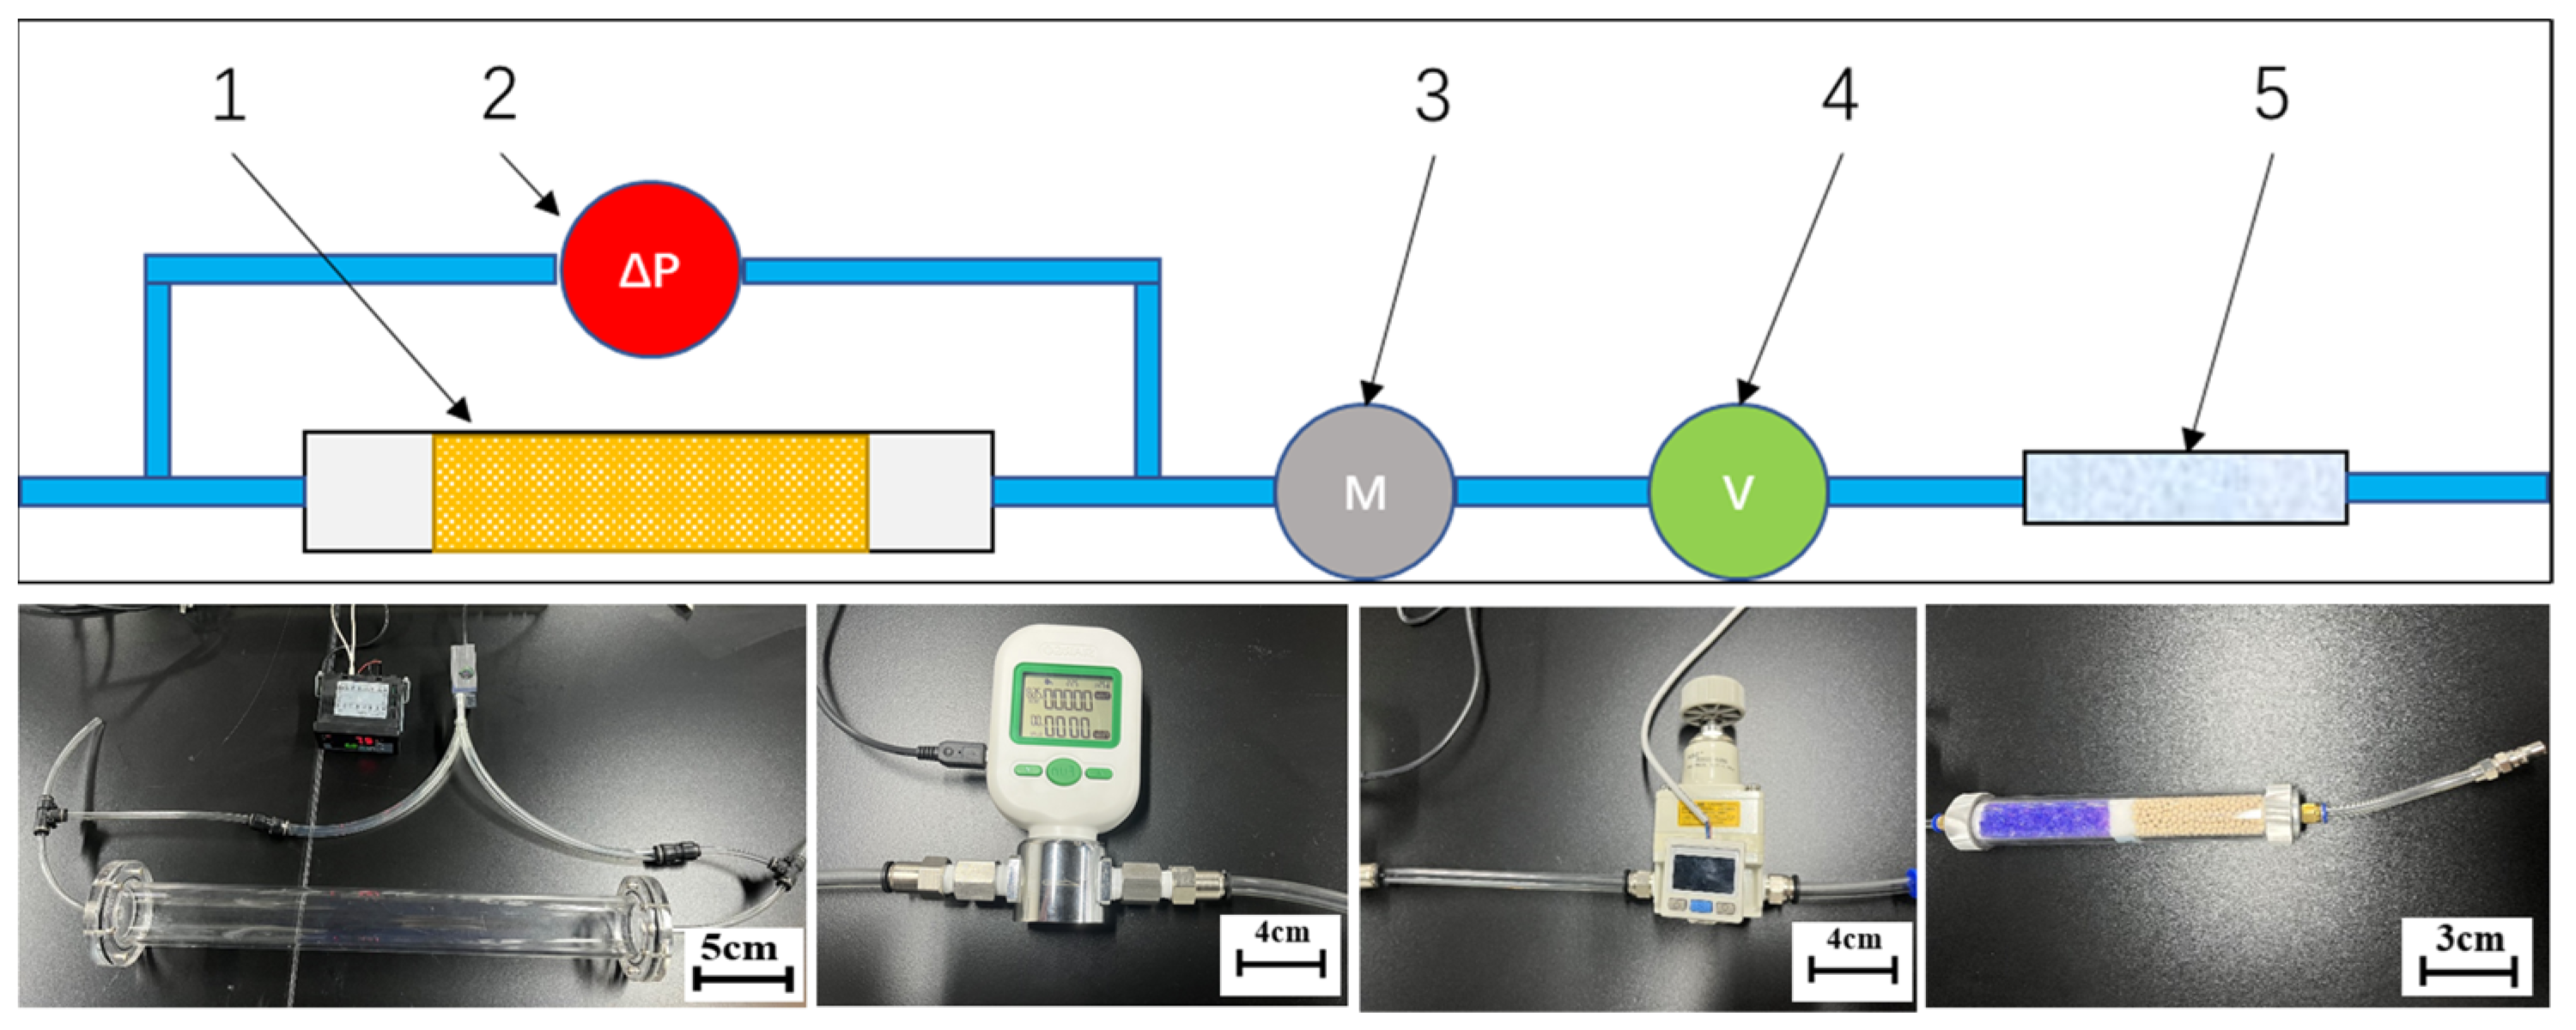
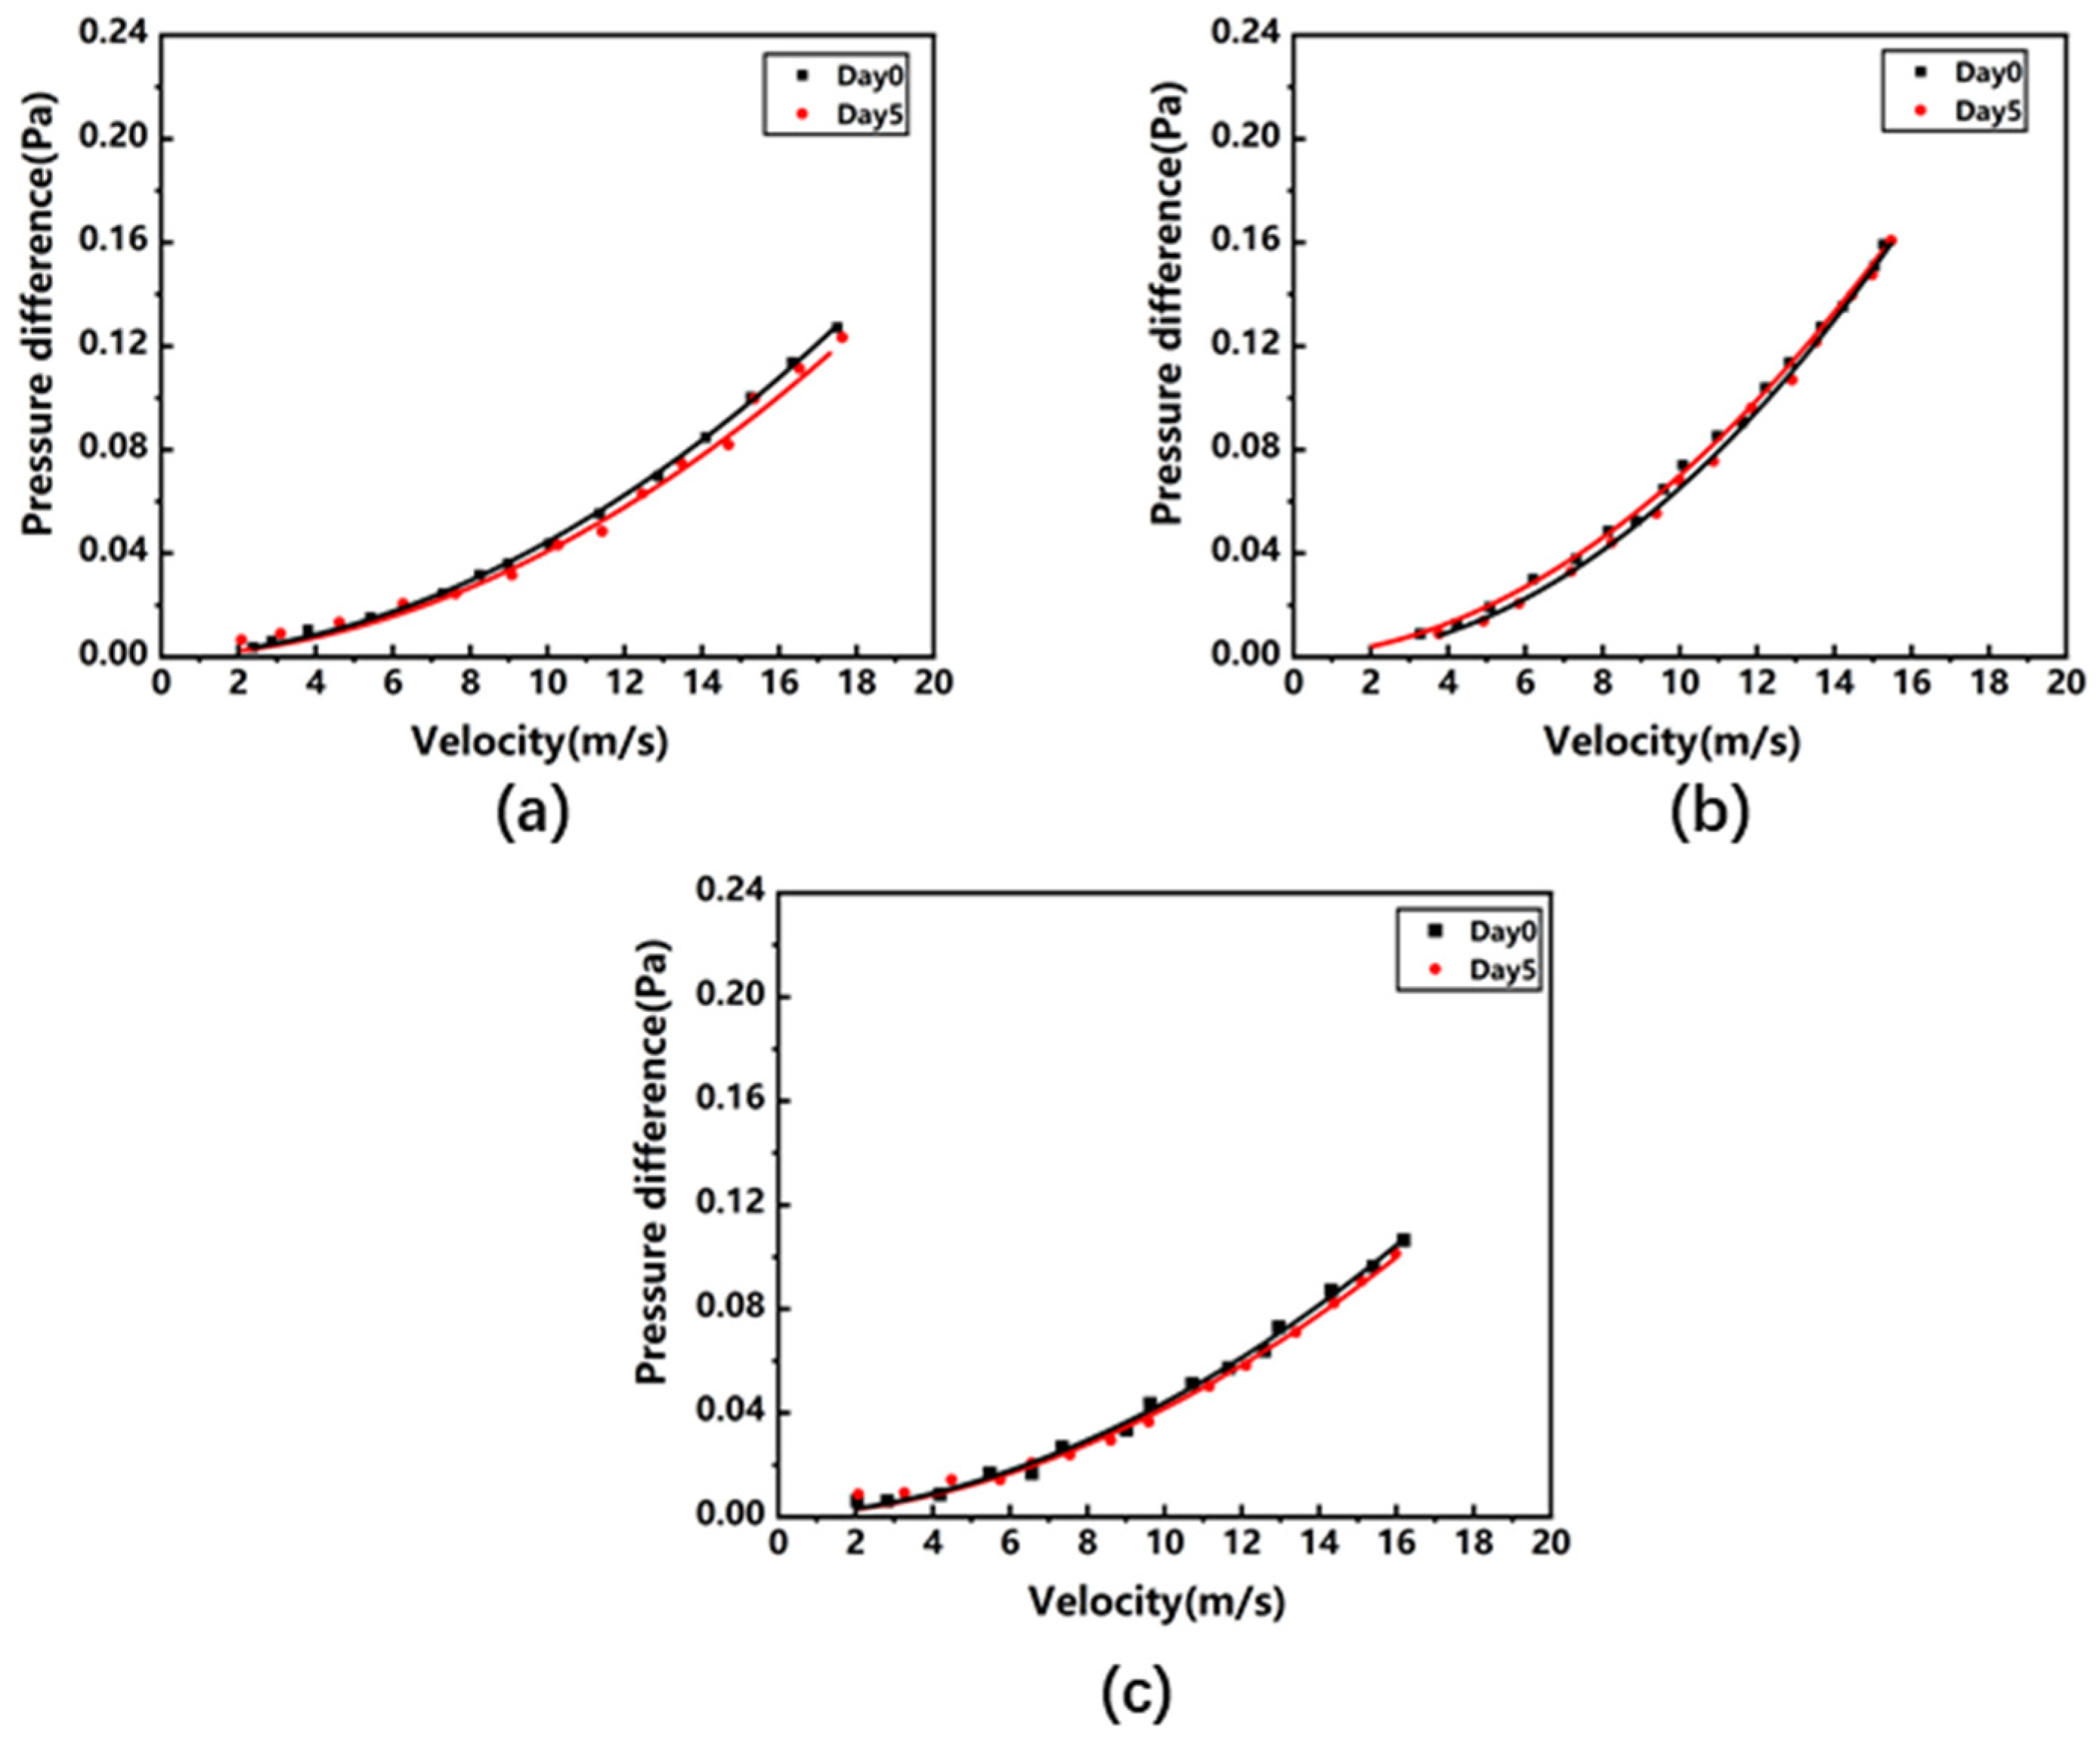
In order to study the flow characteristics of the gas phase in the rock wool porous medium domain, similar to the liquid phase flow experiment, a gas phase rock wool porous medium coefficient measurement experimental device, as shown in Figure 5, was designed and built. According to the geometric dimensions of the rock wool insulation layer material (tube shell with an inner diameter of 115 mm, an outer diameter of 215 mm, and a thickness of 50 mm), an experimental device for measuring the porous medium mass transfer coefficient of the rock wool insulation material was designed. The device includes an acrylic tubular experimental container with an inner diameter of 50 mm, a length of 300 mm, and a thickness of 3 mm, which is used to fill the rock wool insulation material to form a porous medium channel. The channel length designed here is longer than that of the liquid phase flow device in order to ensure that the pressure difference value ∆p measured in the experiment can be within the measurement range that adapts to the instrument range by controlling the longer porous medium domain length ∆n. The two ends of the container are respectively connected to the two ends of the gas differential pressure sensor, and the pressure difference value at both ends of the experimental area can be directly monitored by the differential pressure sensor under gas experimental conditions. The gas pumped out by the external air pump will enter the porous medium test area from the inlet side through the dry clean pipe, pressure reducing valve, and gas flow meter in sequence. The function of the dry clean pipe is to absorb impurities and water vapor flowing through the gas, reduce experimental errors and protect subsequent instruments; the function of the pressure reducing valve is to adjust the pressure, stabilize the airflow, and control the gas flow (flow rate) in the experiment, which makes up for the deficiency that the air pump cannot accurately control the output; the gas flow meter monitors the gas flow in the pipeline to ensure whether the system state is stable or not, and the recorded data are used for the subsequent conversion of the gas flow rate in the porous medium domain. The cylindrical rock wool insulation material with a diameter of 50 mm is obtained from the axial, radial, and circumferential directions for the gas phase porous medium flow experiment. Unlike the liquid phase flow experiment that only uses one sample at a time, after debugging and verification, the gas phase flow experiment needs to use 5 pieces of experimental materials at a time to generate a sufficient gradient of pressure difference values distributed in the range of the pressure difference sensor at different flow rates.
In this series of experiments, both liquid and gas phases were introduced at varying inlet flow rates. By recording multiple sets of pressure differences and flow rates, the measurement devices provided the data necessary to determine the viscous and inertial resistance coefficients.

2.3.2. Model Validation Experiments

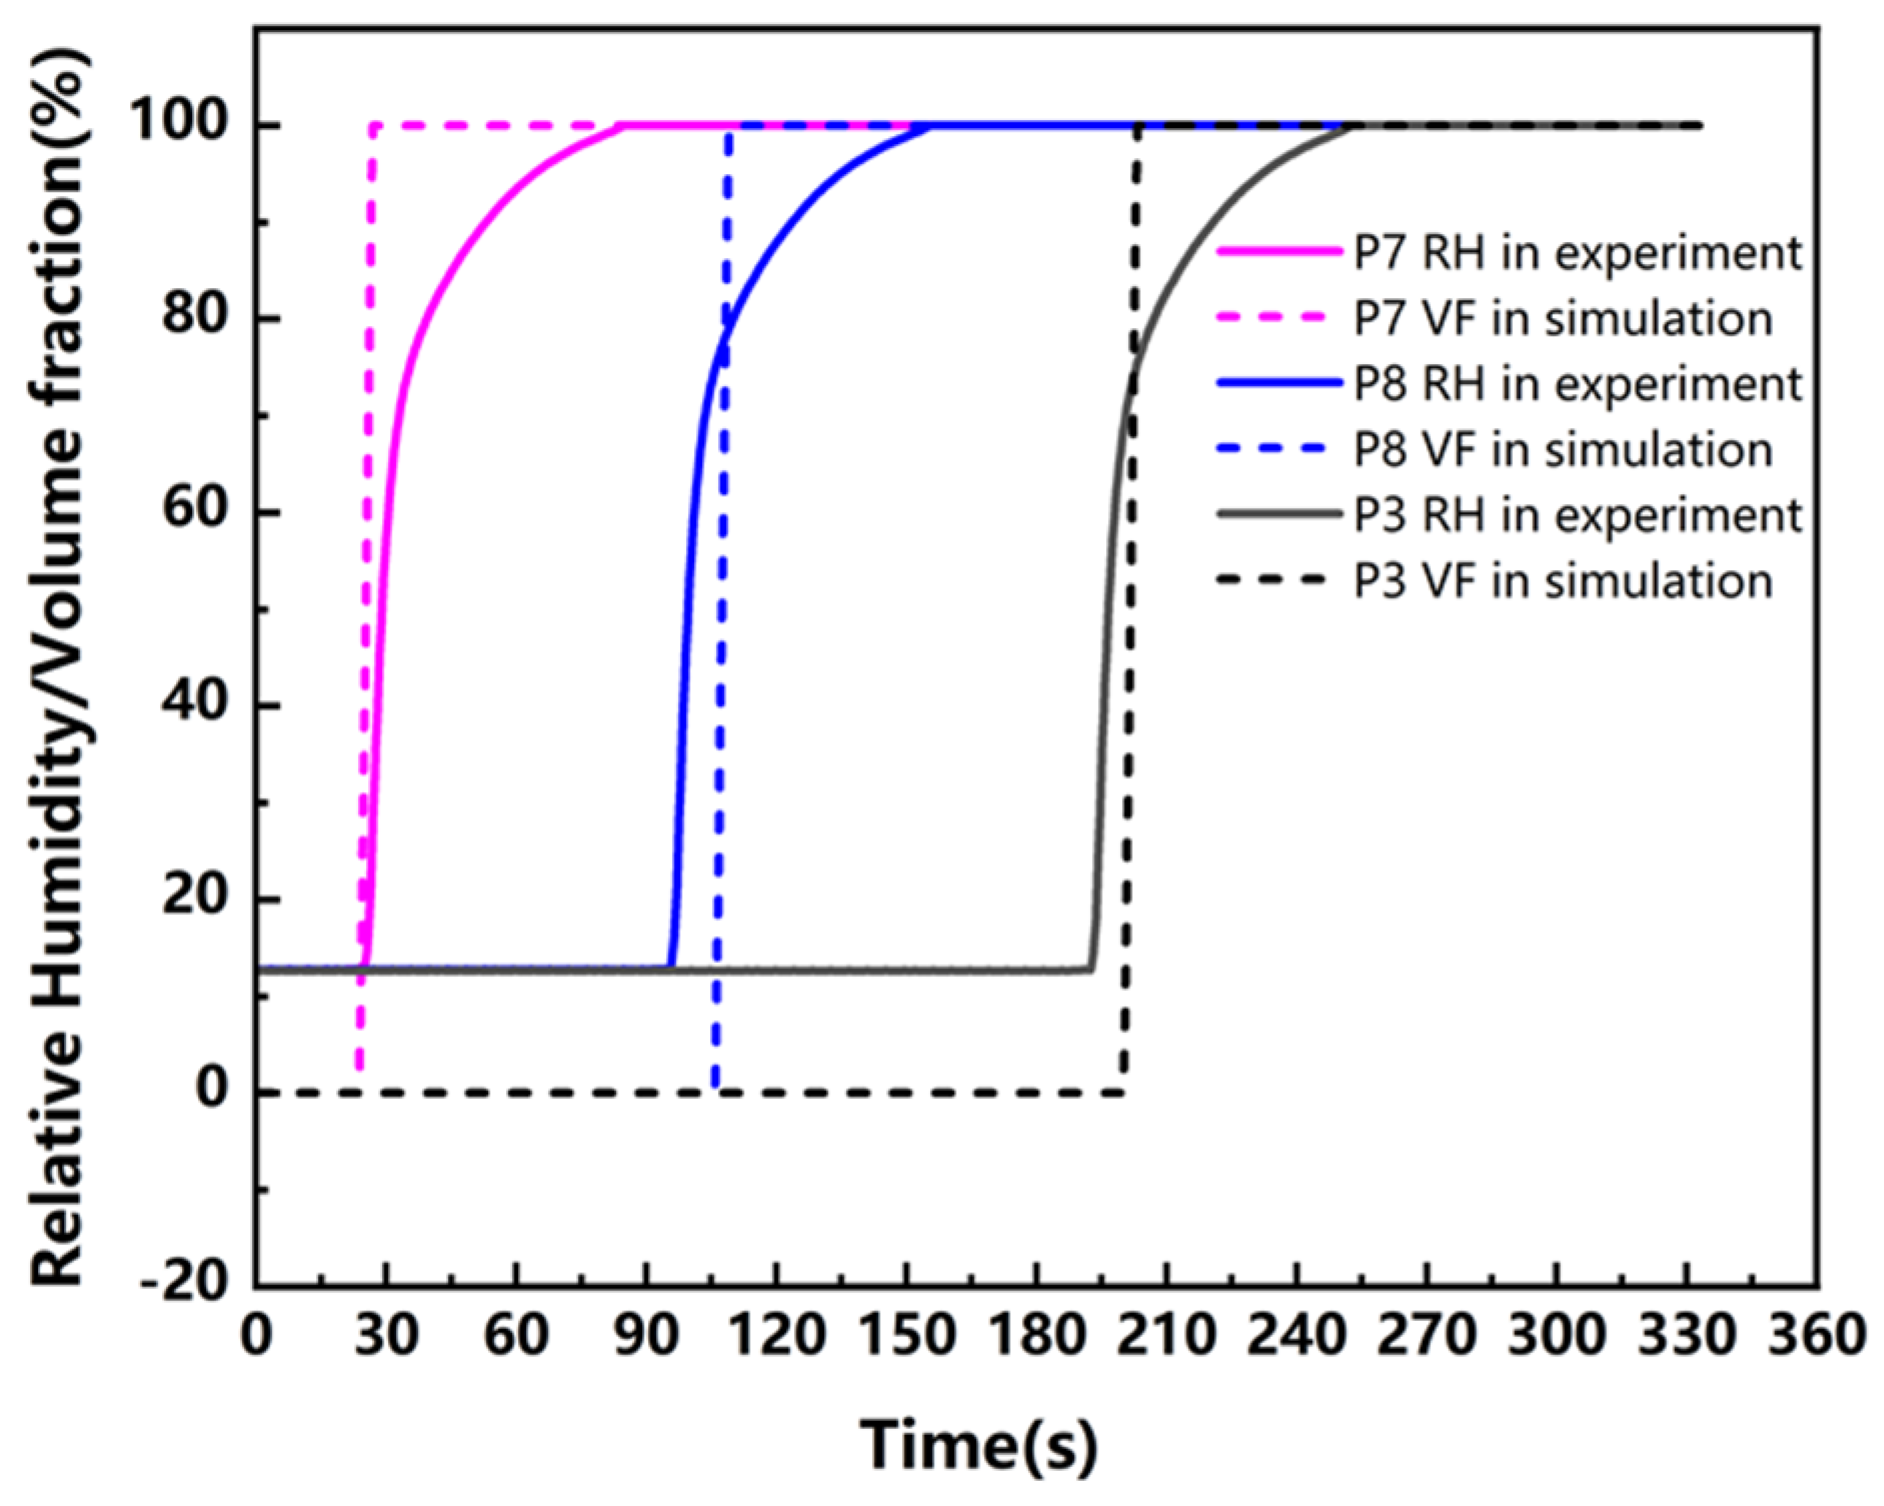
In order to verify the 3D simulation model of the liquid flow in rock wool insulation pipeline system, an experimental verification device was designed. As shown in Figure 6, this device was mainly composed of a metal pipe, rock wool insulation, and jacketing layers. The metal pipe, with an outer diameter of 114.3 mm, was made of 316 L, which provided support for the insulation shell. The rock wool pipe insulation shell with 115 mm inner diameter and 50 mm thickness was installed on the pipe, and the jacketing made of 316 L was covered over the insulation to create a closed insulated piping system. A 20 mm × 20 mm hole was left above the jacket layer as the inlet for the fluid. On both sides of the device were flanges with holes for the sensor wires to pass through. In this experiment, relative humidity sensors were used to detect water flow within this insulated piping system. As illustrated in Figure 6, the layout of the sensors is shown. Starting from the sensor at the top of the innermost circle and proceeding clockwise, the sensors are numbered 1 through 6. Similarly, for the middle layer, beginning with the top sensor and moving clockwise, the sensors are numbered 7 through 12. The outermost layer is numbered 13 through 18 in the same fashion. Note that the sensor located at the very top water inlet is omitted from the numbering.
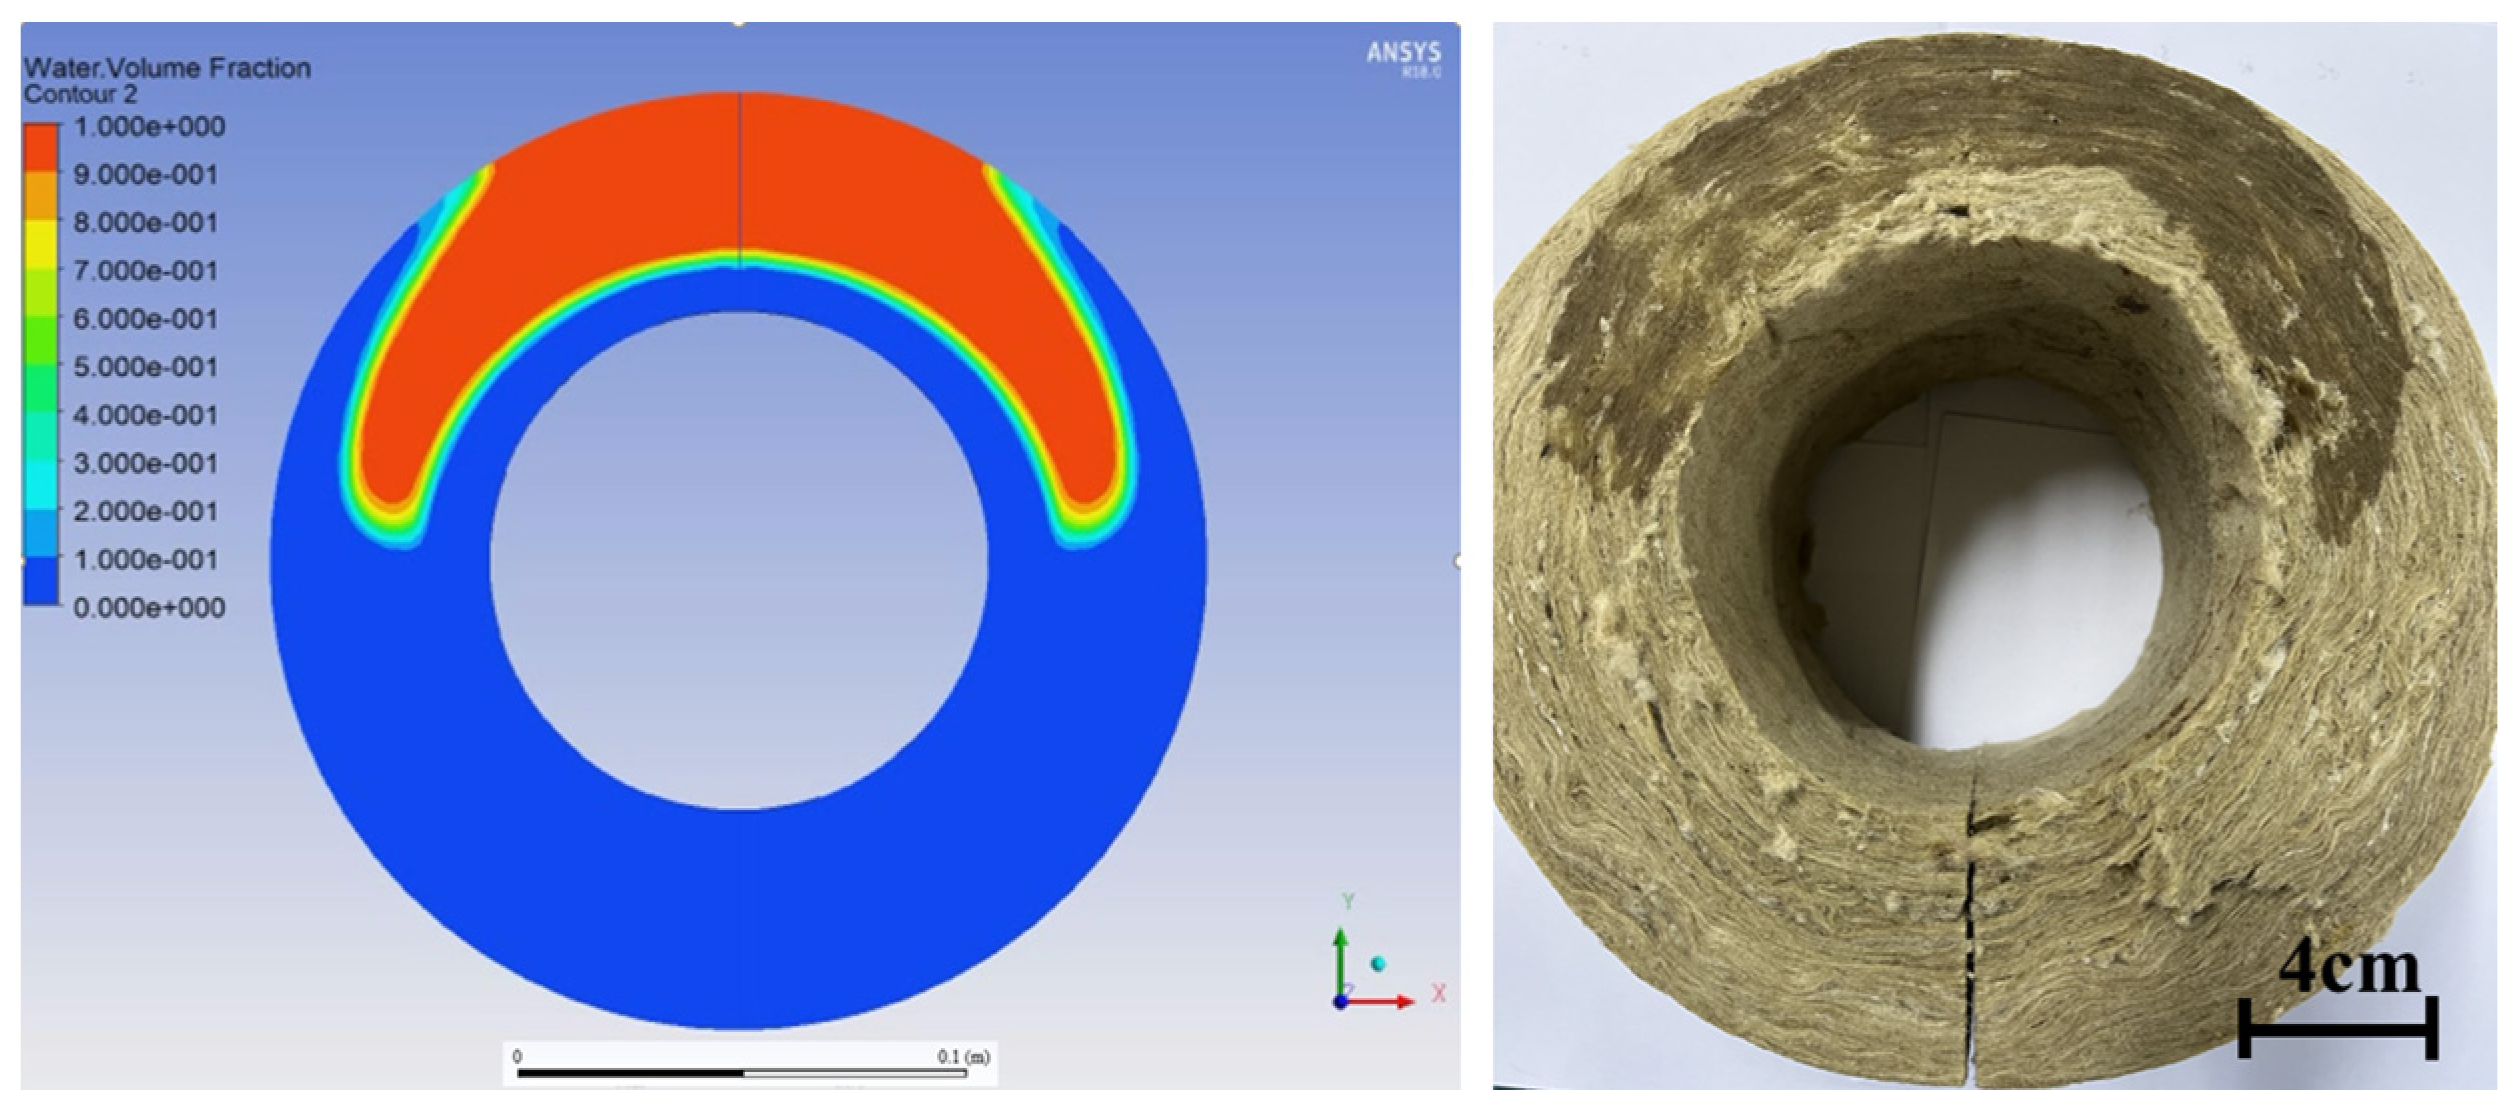
In this experiment, old insulation (Day 5) was used. First, the sensors were activated to begin recording data. Liquid water was injected through the designated inlet at the top of the apparatus at a flow rate corresponding to a velocity of 0.005 m/s. The injection was stopped after 100 s, 200 s, and 300 s, respectively. The apparatus was then opened, and the rock wool insulation was cut along the inlet plane to observe the water distribution within the material, and the collected sensor data were analyzed. Because the processes of opening the apparatus and cutting the rock wool were irreversible, stopping the experiment at 100 s and 200 s effectively marked its conclusion. Therefore, in order to capture a continuous 300 s experiment and its intermediate stages, three separate experiments were conducted.

3. Results and Discussion

3.1. Measurement of Porous Flow Characteristic Parameters

The experimental data of fluid flowing through rock wool insulation material were converted and finally displayed in the form of velocity–pressure difference curves in Figure 7 and Figure 8.
In Figure 7a–c, the slopes of the curves in the three orientations—axial, radial, and circumferential—roughly represent the magnitude of the resistance coefficient. A greater pressure difference generated at the same flow rate indicates higher flow resistance. By analyzing the slopes, we observe that for the same flow rate, radial resistance is greater than axial resistance, which in turn is greater than circumferential resistance. This trend indicates that the fluid flow within the rock wool insulation is more restricted along the radial direction, followed by the axial direction, and is least restricted along the circumferential direction. Therefore, the fluid tends to flow more easily along the circumference of the rock wool fibers, where the resistance to flow is lower.
This difference in resistance across the three directions can be attributed to the anisotropic nature of rock wool. As noted earlier, rock wool fibers are randomly oriented, but they often exhibit a slight degree of alignment along certain axes due to manufacturing processes. This alignment, coupled with the structural distribution of fibers, results in varying flow resistance depending on the direction of the flow. The higher resistance along the radial direction can be explained by the fact that the water has to navigate through a greater number of interwoven fibers, creating more friction and hindering flow. In contrast, the circumferential direction provides a less obstructed path for water due to the natural fiber alignment along this axis, leading to lower flow resistance.
Furthermore, as the number of immersion cycles of the rock wool increased, its resistance coefficient gradually decreased. This is a clear indication of the aging effect on the material. Initially, after the first cycle, the resistance coefficient underwent a significant decrease, likely due to changes in the structural integrity of the fibers and their ability to absorb and retain moisture. Once the fibers are subjected to multiple immersion cycles, their internal structure becomes more compact, and the material undergoes physical degradation, which leads to easier fluid movement through the insulation. Notably, after the initial significant change, the resistance coefficient reached a stable value, indicating that the aging process of the rock wool material stabilized after a certain number of cycles. This trend was consistently observed across all three directions, suggesting that aging affects the entire material uniformly, though the magnitude of resistance change varies by direction.
The stabilization of the resistance coefficient after the first few cycles suggests that rock wool may reach a point of equilibrium where further cycles do not significantly affect its flow resistance, potentially due to a saturation point in the material’s ability to absorb moisture or undergo physical degradation. This behavior is important when considering the long-term performance of insulation materials and their effectiveness in preventing CUI.
In Figure 8a–c, the slopes of the curves in the three orientations also represented the magnitude of the resistance coefficient. Similarly, from the slope sizes, it could be seen that at the same flow rate, the radial resistance was greater than the axial resistance, which in turn was greater than the circumferential resistance, although the differences were quite small. According to the curves of Day 0 and Day 5, it can be found that the air resistance coefficients were almost unaffected by the immersion cycle test, that is, the effect of rock wool aging. This result aligns with the idea that gas-phase flow in porous materials like rock wool is largely governed by porosity and fiber alignment, which are less affected by the aging process compared to liquid flow, where the changes in the material structure (e.g., pore blocking, fiber compression) have a more pronounced impact on flow resistance. This observation is important for understanding the role of moisture and air flow separately in the insulation system and suggests that aging may not significantly impact air permeability but could have long-term effects on water infiltration and, consequently, corrosion formation.

3.2. Small-Scale Simulation and Verification Experiment Results

As shown in Figure 9, the liquid phase volume fraction on the cross-section, which indicates regions of complete water penetration (volume fraction equals 1), closely matched the wetted areas observed on the physical section of the rock wool in the experimental results. From the contour of the simulation results, the distribution of the liquid phase volume fraction on the cross-section indicated that, when comparing the flow distances in the radial and circumferential directions, the radial resistance was greater than the circumferential resistance. This observation was consistent with the results obtained from unidirectional flow experiments.
Figure 10 shows the time evolution of relative humidity (RH) and liquid phase volume fraction (VF) at measurement points P7, P8, and P3 (marked in Figure 6). Comparing experimental data with simulation results, it was found that both the experimental and simulation results exhibited similar overall trends. When water flowed through a recording point, there was a rapid change in both RH and VF, followed by a stabilization period. In the simulation, VF can change from 0 to 1 in a very short time. However, in the experiment, the sensor took a little time to respond, so the value would not change so quickly. In addition to the variations observed at individual measurement points, the time intervals between changes at different points in the simulation model were nearly identical to those observed in the experimental results. If the average time interval between two points being wetted by the liquid is used as a measure of accuracy, the model’s accuracy in this case can reach 80%. These consistencies suggest that the simulation model accurately captured the dynamic evolution of water within the system, thereby providing strong validation for using CFD-based approaches in predicting corrosion environments under insulation.

3.3. Large-Scale Simulation Results and Discussion

Among all computational results, a representative subset that clearly demonstrated the influence of the set variables on fluid flow in the pipeline rock wool insulation system was selected for analysis and discussion. In the case of uncoated carbon steel pipelines, it is generally assumed that corrosion occurs in regions where water is present.
Figure 11 shows the distribution of the liquid water phase volume fraction on two cross-sections at 1000 s. This distribution was calculated under an inlet velocity of 0.001 m/s using porous medium parameters corresponding to different new and aged rock wool conditions. It was clearly observed that new rock wool exhibited significantly higher resistance to water infiltration, which hindered the water’s ability to reach the metal surface. In contrast, aged rock wool allowed water to pass more easily through the material, resulting in a greater volume of water accumulating on the metal pipe surface. This created conditions conducive to CUI.
Furthermore, the results of longer simulation times indicate that new rock wool (Day 0) eventually reaches the same moisture distribution as older rock wool (Day 2 and Day 5). This suggests that, while newer rock wool provides some resistance to water intrusion, it does not completely prevent the formation of a corrosive environment over time. This finding is consistent with the concept of material aging in insulation systems, where even initially high-performance materials gradually degrade and lose their protective properties. The comparison of the resistance coefficient between new and aged rock wool supports this conclusion: although new rock wool delays water intrusion into the system, it ultimately cannot prevent water from reaching the metal surface.
Figure 12 illustrates the contours of the liquid water volume fraction in the cross-section of a vertical piping system using new rock wool (Day 0) under different inlet velocity conditions at 3000 s. The results clearly demonstrate that as the inlet velocity increases, the extent of water penetration into the rock wool insulation becomes broader. At lower inlet velocities, the water remains confined to localized regions within the insulation layer, indicating that the flow through the porous medium is more restricted. However, at higher inlet velocities, the flow is less hindered, allowing for more rapid and extensive saturation of the porous rock wool structure. This observation emphasizes the strong influence of velocity on fluid transport in porous media like rock wool. The results also highlight an important aspect of the vertical piping system: water penetration through the rock wool insulation to reach the pipe surface is quite difficult, even under higher flow conditions.
Figure 13 shows the liquid water volume fraction contours at 2000 s under an inlet velocity of 0.01 m/s using insulation material Day 2. The three subfigures compare the spatial distribution of water within the insulation layer and on the pipe surface under different pipe orientations. The oblique perspective in Figure 13a clearly reveals concentrated regions of high water volume fraction (red zones) on the upper portion of the pipe surface. This distribution indicated that gravitational and inertial forces together caused water to preferentially accumulate along the upper flow path of the inclined pipe. A significant portion of water also settled and flowed downward along the lower part of the pipe due to gravity. The formation of such a persistent flow channel along the bottom further illustrated the anisotropic saturation behavior under inclined conditions, which could lead to extended wet zones and potentially higher corrosion risk along the bottom half of the pipe. Comparing Figure 13b,c, viewed from the underside of the pipe, the water distribution on the pipe surface appeared as a continuous and elongated band along the bottom surface in Figure 13b, while in Figure 13c, the water distribution was more symmetrical and localized, with no significant accumulation along any preferential path.
To more intuitively demonstrate the effects of pipe inclination and inlet velocity on the formation of a corrosion environment, calculations were performed at 3000 s using rock wool on Day 2 under various inclination angles and inlet velocity conditions. The area of the pipe surface with a liquid water volume fraction exceeding 0.5 (defined as the corrosion-sensitive area) was quantified, as shown in Figure 14. Note that data from the vertical pipe were excluded, as the liquid never reached the pipe surface under these conditions. In comparing the 30° inclined pipe and the horizontal pipe, it was observed that in these cases, the corrosion-sensitive area increased with higher inlet velocity. Similarly, the inclination angle significantly influenced the formation of the corrosion area; when all other conditions remained the same, pipes with an inclination produced a larger corrosion-sensitive area than horizontal pipes. Notably, as evidenced by Figure 13, the furthest corrosion position exhibited an approximate relationship with the inlet velocity and pipe inclination. In horizontal pipes, the corrosion typically concentrated near the inlet, whereas in inclined pipes, the corrosion could occur far from the inlet. This phenomenon poses considerable challenges for the detection and maintenance of CUI in practice.

4. Conclusions

This study combines experimental research with CFD simulations to explore the impact of water infiltration on the formation of a corrosive environment within rock wool insulation layers of pipelines. Through experiments measuring fluid velocity and pressure drop in axial, radial, and circumferential directions, we derived the viscous and inertial resistance coefficients for the rock wool. Based on the validated model, a three-dimensional CFD model of the rock wool-insulated pipeline was developed to simulate the process of water intrusion, and the simulation results showed good agreement with the experimental data. A large-scale CFD model was further used to analyze the influence of factors such as inlet velocity, rock wool aging, and pipeline inclination on the formation of CUI. The experimental and simulation results showed the following:
  • The liquid-phase resistance coefficient initially decreased significantly under dry–wet cycles before stabilizing, while the gas-phase resistance coefficient remained almost unchanged;
  • Fiber alignment and structural anisotropy directly influenced fluid transport and played a critical role in controlling the flow within the insulation;
  • Higher inlet velocity accelerated the development of a corrosive environment;
  • Older rock wool allowed water to more easily reach the pipe surface;
  • Inclined pipelines, compared to horizontal ones, exhibited larger corrosion-sensitive areas under the same water intrusion conditions.
Overall, this study demonstrated that experimentally determining the flow characteristics of porous insulation materials contributes to the development of accurate CFD models. The CFD approach can be used for preliminary predictions of CUI in pipeline systems, providing a foundation for further understanding the phenomenon. Based on the computational results, several recommendations were made: the protective layer on the pipeline insulation system should be carefully inspected to prevent large breaches and high flow rates; if feasible, rock wool should be replaced periodically, or materials less prone to aging should be selected; and, during pipeline design and installation, inclined pipelines should be avoided as much as possible. Furthermore, while the current models provide valuable insights, their limitations suggest that future work should consider more complex diffusion and phase-change processes to improve the precision of CUI predictions under varying conditions.

Author Contributions

Conceptualization, J.W. and Y.J.; methodology, J.W. and F.L.; software, J.W. and W.L.; validation, J.W. and H.Z.; formal analysis, W.L.; investigation, B.Z.; resources, W.L. and F.H.; data curation, J.W. and B.Z.; writing—original draft preparation, J.W.; writing—review and editing, W.L., H.Z. and Y.J.; visualization, F.H.; supervision, F.L. and Y.J.; project administration, F.L. and Y.J.; funding acquisition, F.L. and Y.J. All authors have read and agreed to the published version of the manuscript.

Funding

The National Natural Science Foundation of China (NSFC 52474343).

Institutional Review Board Statement

Not applicable.

Informed Consent Statement

Not applicable.

Data Availability Statement

Data are contained within the article.

Conflicts of Interest

The authors declare no conflicts of interest.

References

  1. Rostami-Tapeh-Esmaeil, E.; Vahidifar, A.; Esmizadeh, E.; Rodrigue, D. Chemistry, Processing, Properties, and Applications of Rubber Foams. Polymers 2021, 13, 1565. [Google Scholar] [CrossRef]
  2. Cao, Q.; Pojtanabuntoeng, T.; Esmaily, M.; Thomas, S.; Brameld, M.; Amer, A.; Birbilis, N. A Review of Corrosion under Insulation: A Critical Issue in the Oil and Gas Industry. Metals 2022, 12, 561. [Google Scholar] [CrossRef]
  3. Villasmil, W.; Fischer, L.J.; Worlitschek, J. A Review and Evaluation of Thermal Insulation Materials and Methods for Thermal Energy Storage Systems. Renew. Sustain. Energy Rev. 2019, 103, 71–84. [Google Scholar] [CrossRef]
  4. Yang, S.; Zhang, L. Research on Properties of Rock-Mineral Wool as Thermal Insulation Material for Construction. Adv. Mater. Res. 2012, 450–451, 618–622. [Google Scholar] [CrossRef]
  5. Chen, Z.; Liu, T. Development and Application Status of Glass Wool, Rock Wool, and Ceramic Wool. In Thermal Insulation and Radiation Control Technologies for Buildings; Kośny, J., Yarbrough, D.W., Eds.; Springer International Publishing: Cham, Switzerland, 2022; pp. 129–161. ISBN 978-3-030-98693-3. [Google Scholar]
  6. Caines, S.; Khan, F.; Shirokoff, J. Analysis of Pitting Corrosion on Steel under Insulation in Marine Environments. J. Loss Prev. Process Ind. 2013, 26, 1466–1483. [Google Scholar] [CrossRef]
  7. Cao, Q.; Brameld, M.; Birbilis, N.; Thomas, S. On the Mitigation of Corrosion Under Insulation (CUI) of Mild Steel Using Local Cathodic Protection. Corrosion 2019, 75, 1541–1551. [Google Scholar] [CrossRef]
  8. Seto, R. Mineral Wool CUI Mitigation Improvements. In Proceedings of the AMPP Annual Conference + Expo, New Orleans, Louisiana, 3–7 March 2024. AMPP-2024-20798. [Google Scholar]
  9. Cao, Q.; Esmaily, M.; Liu, R.L.; Birbilis, N.; Thomas, S. Corrosion of Mild Steel under Insulation–the Effect of Dissolved Metal Ions. Corros. Eng. Sci. Technol. 2020, 55, 322–330. [Google Scholar] [CrossRef]
  10. Reurings, C.; Koussios, S.; Bergsma, O.K.; Vergote, K.; Paeshuyse, L.; Benedictus, R. Experimental Method for Investigating Wear of Porous Thermal Insulation Systems Exposed to Realistic, Hot, Turbulent Gas Flow. Wear 2021, 466–467, 203536. [Google Scholar] [CrossRef]
  11. Wijeysundera, N.E.; Zheng, B.F.; Iqbal, M.; Hauptmann, E.G. Numerical Simulation of the Transient Moisture Transfer through Porous Insulation. Int. J. Heat Mass Transf. 1996, 39, 995–1004. [Google Scholar] [CrossRef]
  12. Kundu, P.; Kumar, V.; Mishra, I.M. Experimental and Numerical Investigation of Fluid Flow Hydrodynamics in Porous Media: Characterization of Pre-Darcy, Darcy and Non-Darcy Flow Regimes. Powder Technol. 2016, 303, 278–291. [Google Scholar] [CrossRef]
  13. Ehlers, W. Darcy, Forchheimer, Brinkman and Richards: Classical Hydromechanical Equations and Their Significance in the Light of the TPM. Arch. Appl. Mech. 2022, 92, 619–639. [Google Scholar] [CrossRef]
  14. Pavlenko, A. Heat and Mass Transfer in Porous Materials. Materials 2023, 16, 5591. [Google Scholar] [CrossRef]
  15. Xu, Y.; Jing-yi, N.; Yue-jin, Y.; Yue-ding, Y.; Ma, K. Simulation and Experimental Study of Heat-Moisture-Solute Transfer during Drying Process of Porous Media. Dry. Technol. 2025, 43, 183–196. [Google Scholar] [CrossRef]
  16. Belleudy, C.; Woloszyn, M.; Chhay, M.; Cosnier, M. A 2D Model for Coupled Heat, Air, and Moisture Transfer through Porous Media in Contact with Air Channels. Int. J. Heat Mass Transf. 2016, 95, 453–465. [Google Scholar] [CrossRef]
  17. Jervell, V.G.; Gjennestad, M.A.; Trinh, T.T.; Wilhelmsen, Ø. The Influence of Thermal Diffusion on Water Migration through a Porous Insulation Material. Int. J. Heat Mass Transf. 2024, 227, 125576. [Google Scholar] [CrossRef]
  18. Lu, F.; Kaviany, M.; Williams, J.; Addison-Smith, T. Heat, Mass and Momentum Transport in Wet Mineral-Wool Insulation: Experiment and Simulation. Int. J. Heat Mass Transf. 2024, 228, 125644. [Google Scholar] [CrossRef]
  19. Nosrati, R.H.; Berardi, U. Hygrothermal Characteristics of Aerogel-Enhanced Insulating Materials under Different Humidity and Temperature Conditions. Energy Build. 2018, 158, 698–711. [Google Scholar] [CrossRef]
  20. Van Belleghem, M.; Steeman, M.; Janssen, H.; Janssens, A.; De Paepe, M. Validation of a Coupled Heat, Vapour and Liquid Moisture Transport Model for Porous Materials Implemented in CFD. Build. Environ. 2014, 81, 340–353. [Google Scholar] [CrossRef]
  21. Wadell, H. The Coefficient of Resistance as a Function of Reynolds Number for Solids of Various Shapes. J. Franklin Inst. 1934, 217, 459–490. [Google Scholar] [CrossRef]
  22. Sobieski, W.; Zhang, Q. Multi-Scale Modeling of Flow Resistance in Granular Porous Media. Math. Comput. Simul. 2017, 132, 159–171. [Google Scholar] [CrossRef]
  23. Soares, C.; Padoin, N.; Muller, D.; Hotza, D.; Rambo, C.R. Evaluation of Resistances to Fluid Flow in Fibrous Ceramic Medium. Appl. Math. Model. 2015, 39, 7197–7210. [Google Scholar] [CrossRef]
  24. Liu, Q.; Baiquan, L.; Yan, Z.; Yanjun, L.; Ting, L. Experimental Verification of Permeability and Inertial Resistance Coefficient Model in the Goaf. Energy Sources Part A Recovery Util. Environ. Eff. 2022, 1–20. [Google Scholar] [CrossRef]
  25. Dragovic, H.; Damaceno, D.S.; Meyer, O.H.H.; Ervik, Å. Water Transport and Corrosion under Insulation: Experimental Investigations of Drying in Mineral Wool. Process Saf. Environ. Prot. 2024, 190, 198–210. [Google Scholar] [CrossRef]
  26. Ranjbarzadeh, R.; Sappa, G. Numerical and Experimental Study of Fluid Flow and Heat Transfer in Porous Media: A Review Article. Energies 2025, 18, 976. [Google Scholar] [CrossRef]
  27. Fan, J.; Wen, X. Modeling Heat and Moisture Transfer through Fibrous Insulation with Phase Change and Mobile Condensates. Int. J. Heat Mass Transf. 2002, 45, 4045–4055. [Google Scholar] [CrossRef]
Figure 1. Photo of rock wool pipe shell insulation and indication of each orientation.
Coatings 15 00571 g001
Figure 2. Macroscopic photos and optical microscope photographs of rock wool from different directions: (a,d) radial; (b,c) circumferential; (e,f) axial.
Coatings 15 00571 g002
Figure 3. Geometry of small-scale model (left) and large-scale model (right).
Coatings 15 00571 g003
Figure 4. Measuring device for liquid flow through rock wool: (a) 1. cylindrical container; 2. inlet pressure gauge; 3. water pump; 4. rock wool sample; 5. outlet pressure gauge; 6. liquid flow meter; (b) photo of the installation.
Coatings 15 00571 g004
Figure 5. Measuring device for gas flow through rock wool: design sketches (top): 1. cylindrical container with rock wool; 2. differential pressure meter; 3. gas flow meter; 4. pressure regulating valve; 5. desiccant air filter; photos of individual components (bottom).
Coatings 15 00571 g005
Figure 6. Experimental device for simulating water entering a rock wool pipe insulation system: design sketches (top): 1. sensors; 2. pipe; 3. jacketing; 4. inlet hole; 5. seals; 6. insulation; and photo of the installation (bottom).
Coatings 15 00571 g006
Figure 7. Velocity and pressure difference of liquid water flow at three orientations: (a) axial; (b) radial; (c) circumferential.
Coatings 15 00571 g007
Figure 8. Velocity and pressure difference of air flow at three orientations: (a) axial; (b) radial; (c) circumferential.
Coatings 15 00571 g008
Figure 9. Contours of liquid volume fraction in cross-section (left) and rock wool physical section (right) at 100 s.
Coatings 15 00571 g009
Figure 10. Time evolution of experimental and simulated relative humidity (RH) and volume fraction (VF) at measurement points P7, P8, and P3.
Coatings 15 00571 g010
Figure 11. Contours of liquid volume fraction in cross-section with different conditions of rock wool insulation.
Coatings 15 00571 g011
Figure 12. Contours of liquid volume fraction in cross-section with different conditions of inlet velocity.
Coatings 15 00571 g012
Figure 13. Contours of liquid volume fraction in cross-section and on pipe surface with an inlet velocity of 0.01 m/s and insulation on Day 2 at 2000 s: (a) 30° inclined pipe, observed from an oblique upward view; (b) 30° inclined pipe, observed from the bottom; (c) horizontal pipe, observed from the bottom.
Coatings 15 00571 g013
Figure 14. Corrosion-sensitive area with different inclination angles and inlet velocities.
Coatings 15 00571 g014
Disclaimer/Publisher’s Note: The statements, opinions and data contained in all publications are solely those of the individual author(s) and contributor(s) and not of MDPI and/or the editor(s). MDPI and/or the editor(s) disclaim responsibility for any injury to people or property resulting from any ideas, methods, instructions or products referred to in the content.

