


Investigations on Changes in the Surface Geometrical Texture Caused by the Use of Corrosion Product Removers


Abstract
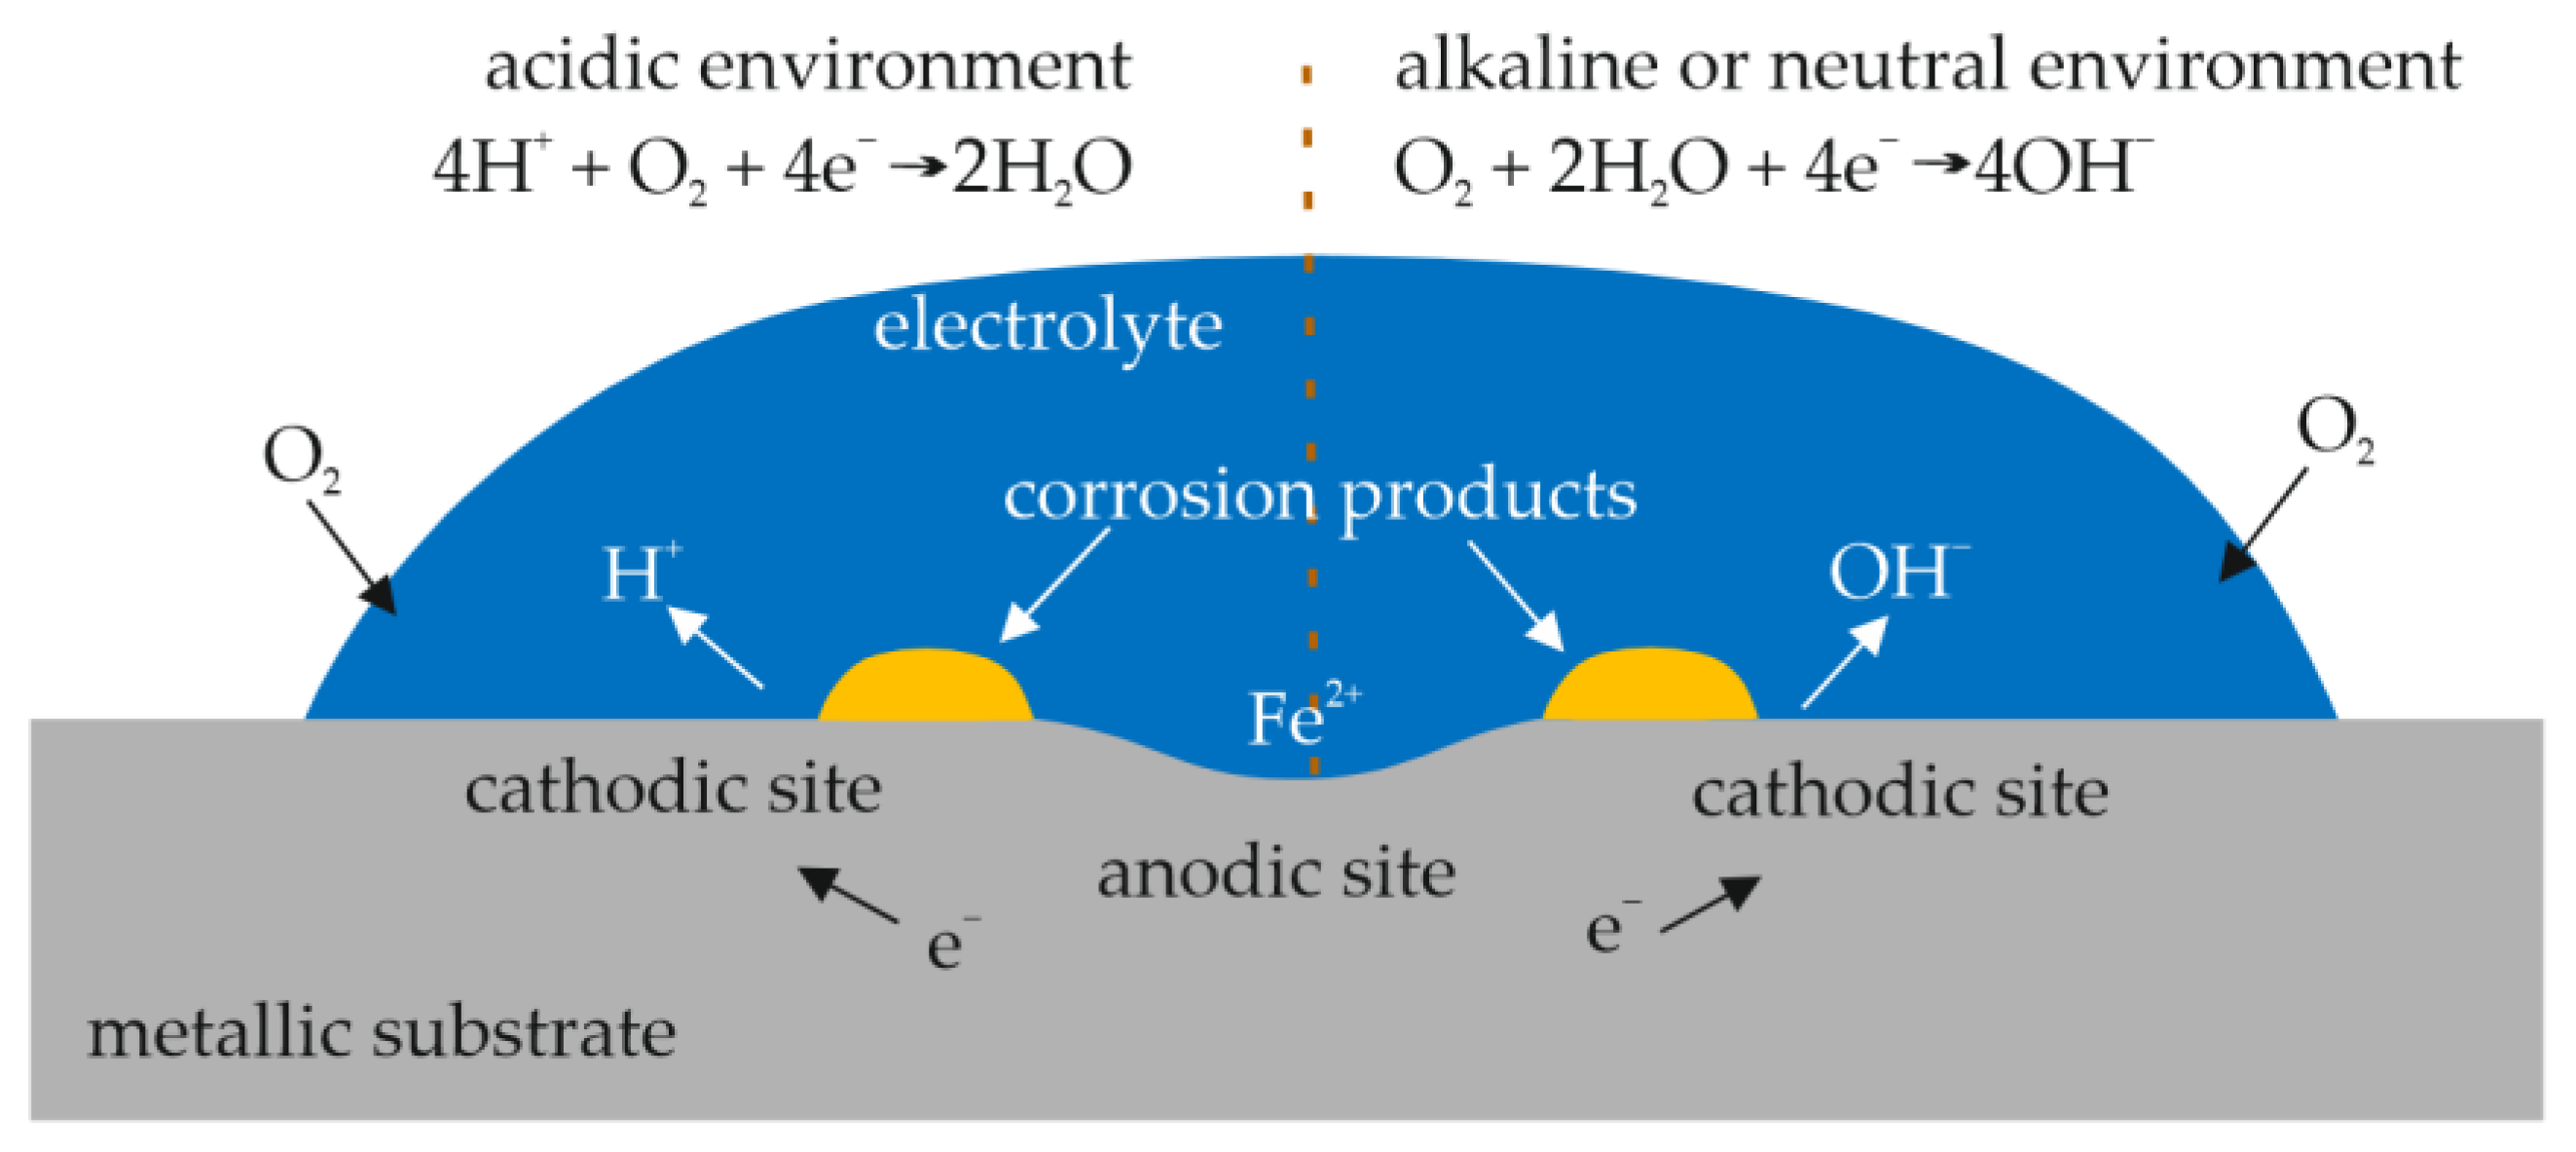
1. Introduction
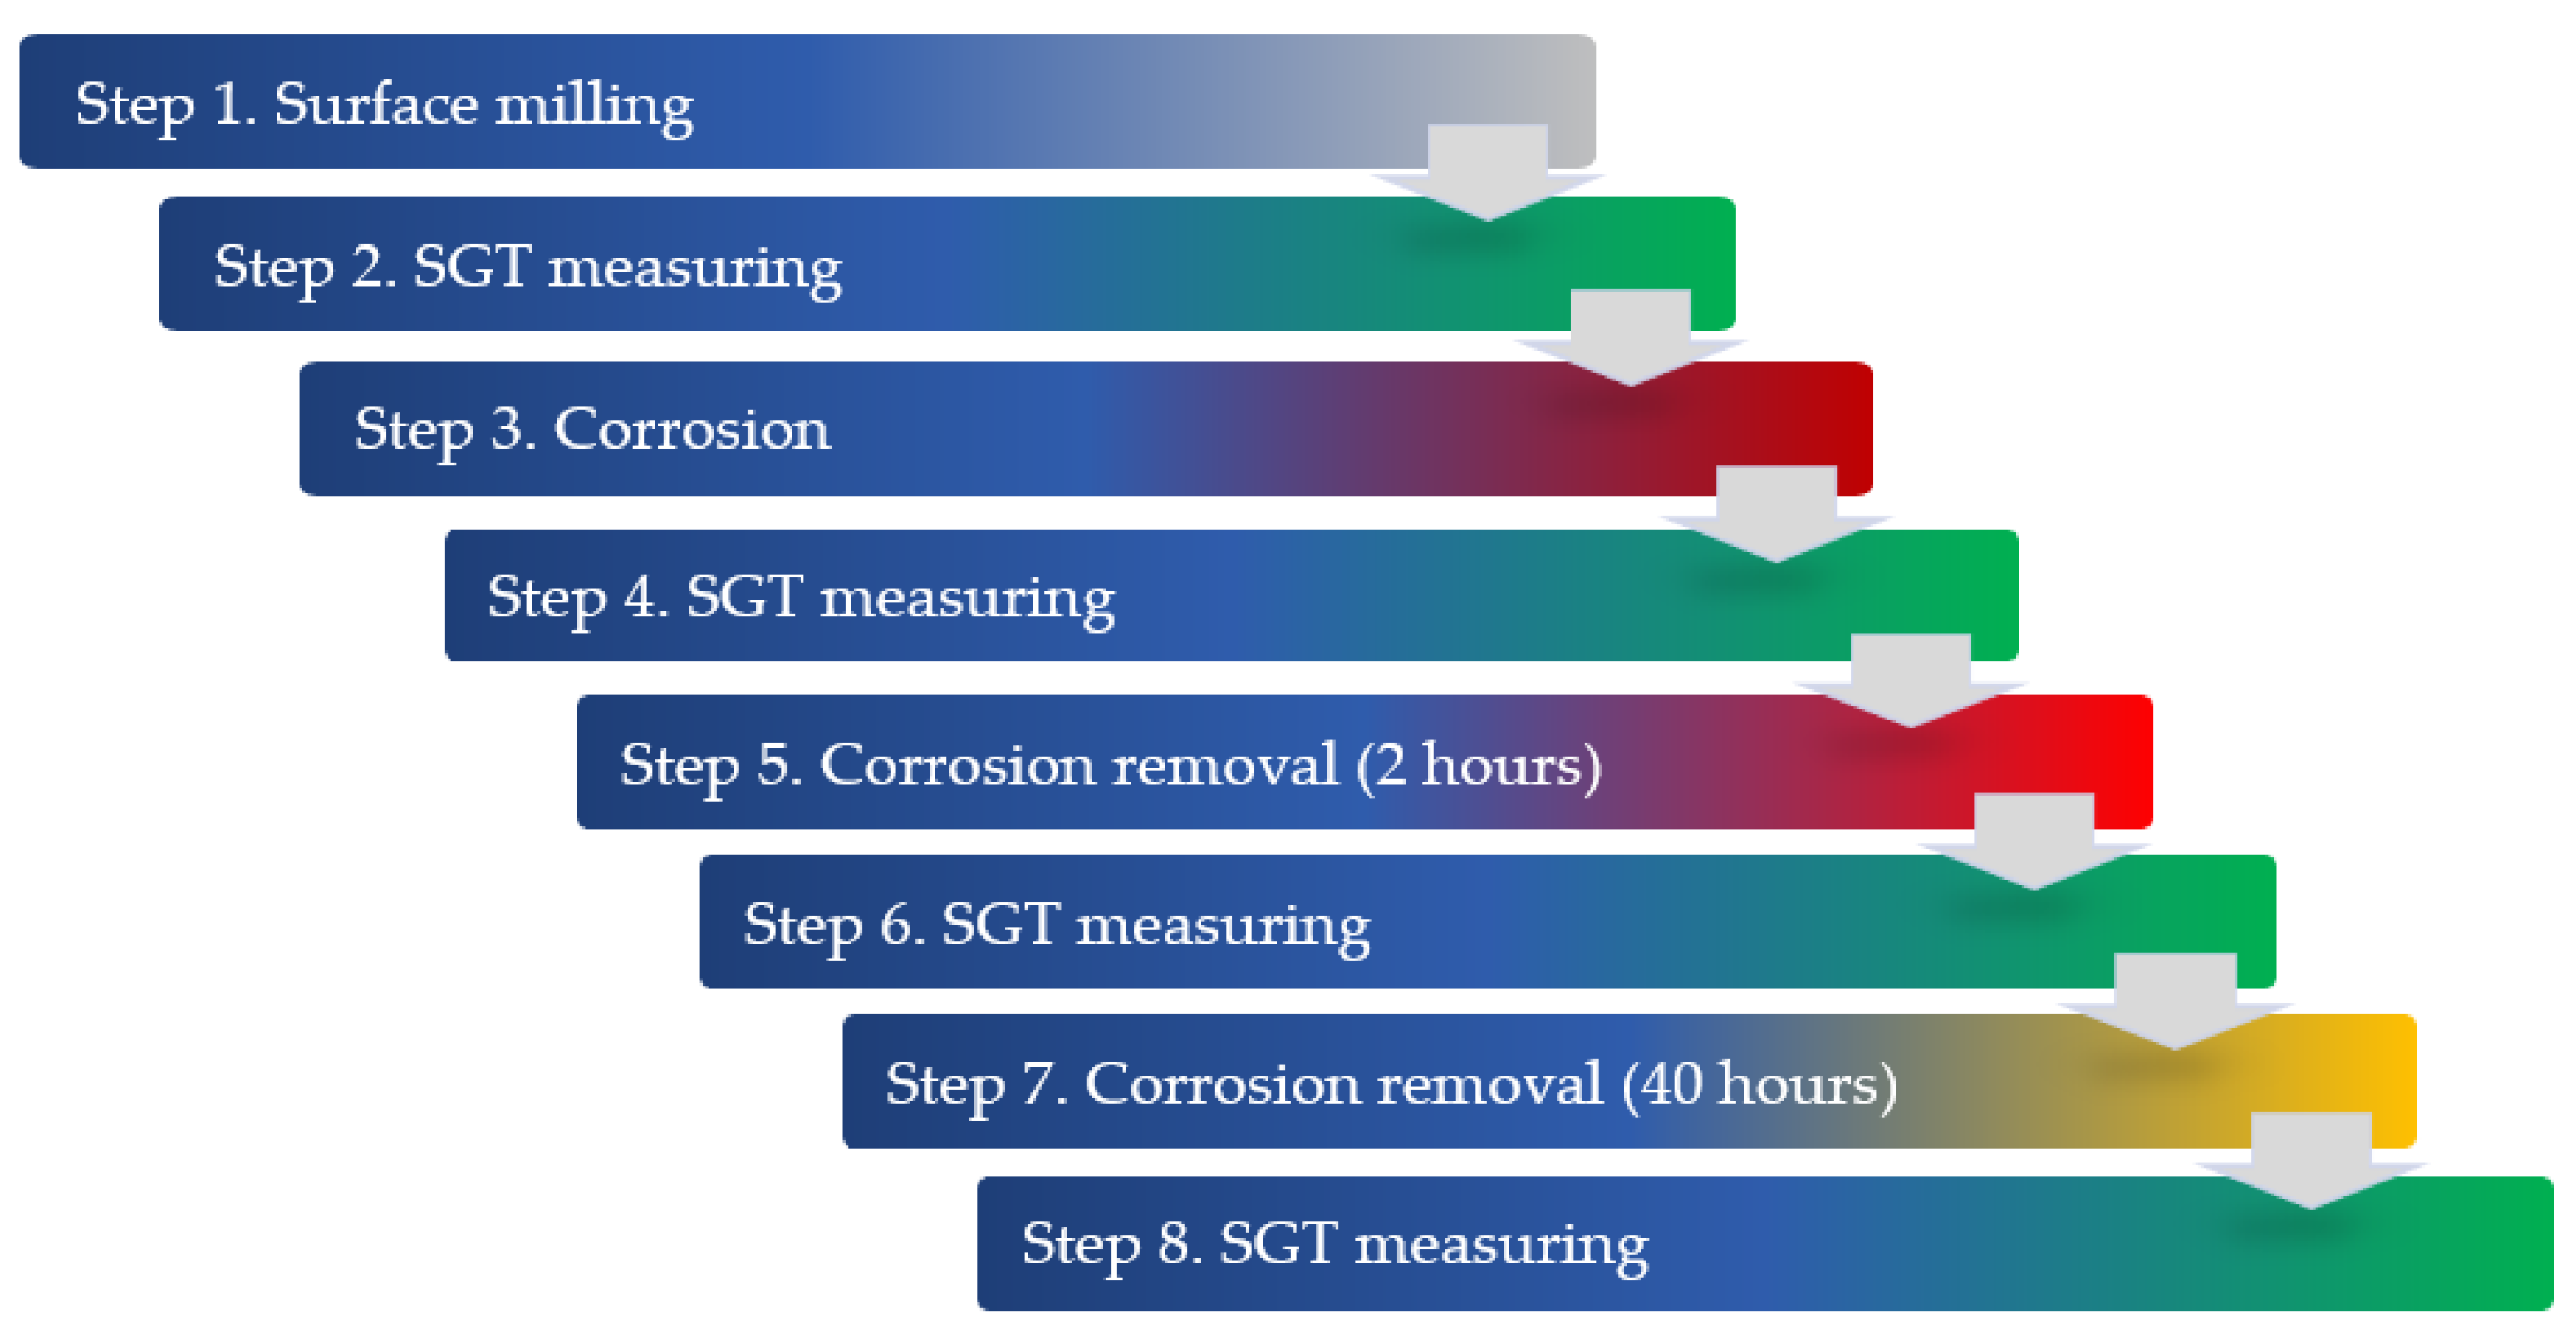
2. Research Method
- OPN-Rust Remover (R1) is a professional aerosol for cleaning corrosion products based on petroleum-derived hydrocarbons, including C10–C13 alkanes and isoalkanes, as well as 2-butoxyethanol and light naphthenic distillates. These components dissolve corrosion products through solvating and penetrating actions, while the formulation is designed to act gently on the base metal. Importantly, this agent does not contain passivating additives and relies on mechanical removal post-application. OPN-Rust Remover (R1) provides gentle cleaning without structural damage, but requires follow-up protection to prevent re-corrosion.
- Epoxy Brunox (R2) is a commercial-grade corrosion product converter and epoxy-based primer, combining organic acids (e.g., formic acid) that dissolve iron oxides and epoxy resin components, which then form a protective polymer layer. This dual-function product both removes corrosion products and prepares the surface for coating, which contributes to its superior and more permanent surface stabilisation. Epoxy Brunox (R2) is chemically active, both removing and inhibiting future corrosion through a stable epoxy barrier.
- The cola drink (R3) is a consumer-grade agent containing phosphoric acid and carbon dioxide, with a pH of ~2.5. Its weak organic acid content enables the short-term dissolution of corrosion products. However, due to the lack of protective ingredients and the presence of sugars, it may lead to residue formation that traps moisture, resulting in the renewed development of corrosion sites over time.
- Sa—arithmetic mean surface height (μm);
- Spk—reduced peak height (μm);
- Sk—core roughness depth (μm);
- Svk—reduced valley depth (μm);
- Vmp—surface material peak volume (mm3/mm2);
- Vmc—surface material core volume (mm3/mm2);
- Vvc—surface void core volume (mm3/mm2);
- Vvv—surface void valley volume (mm3/mm2).
3. Results
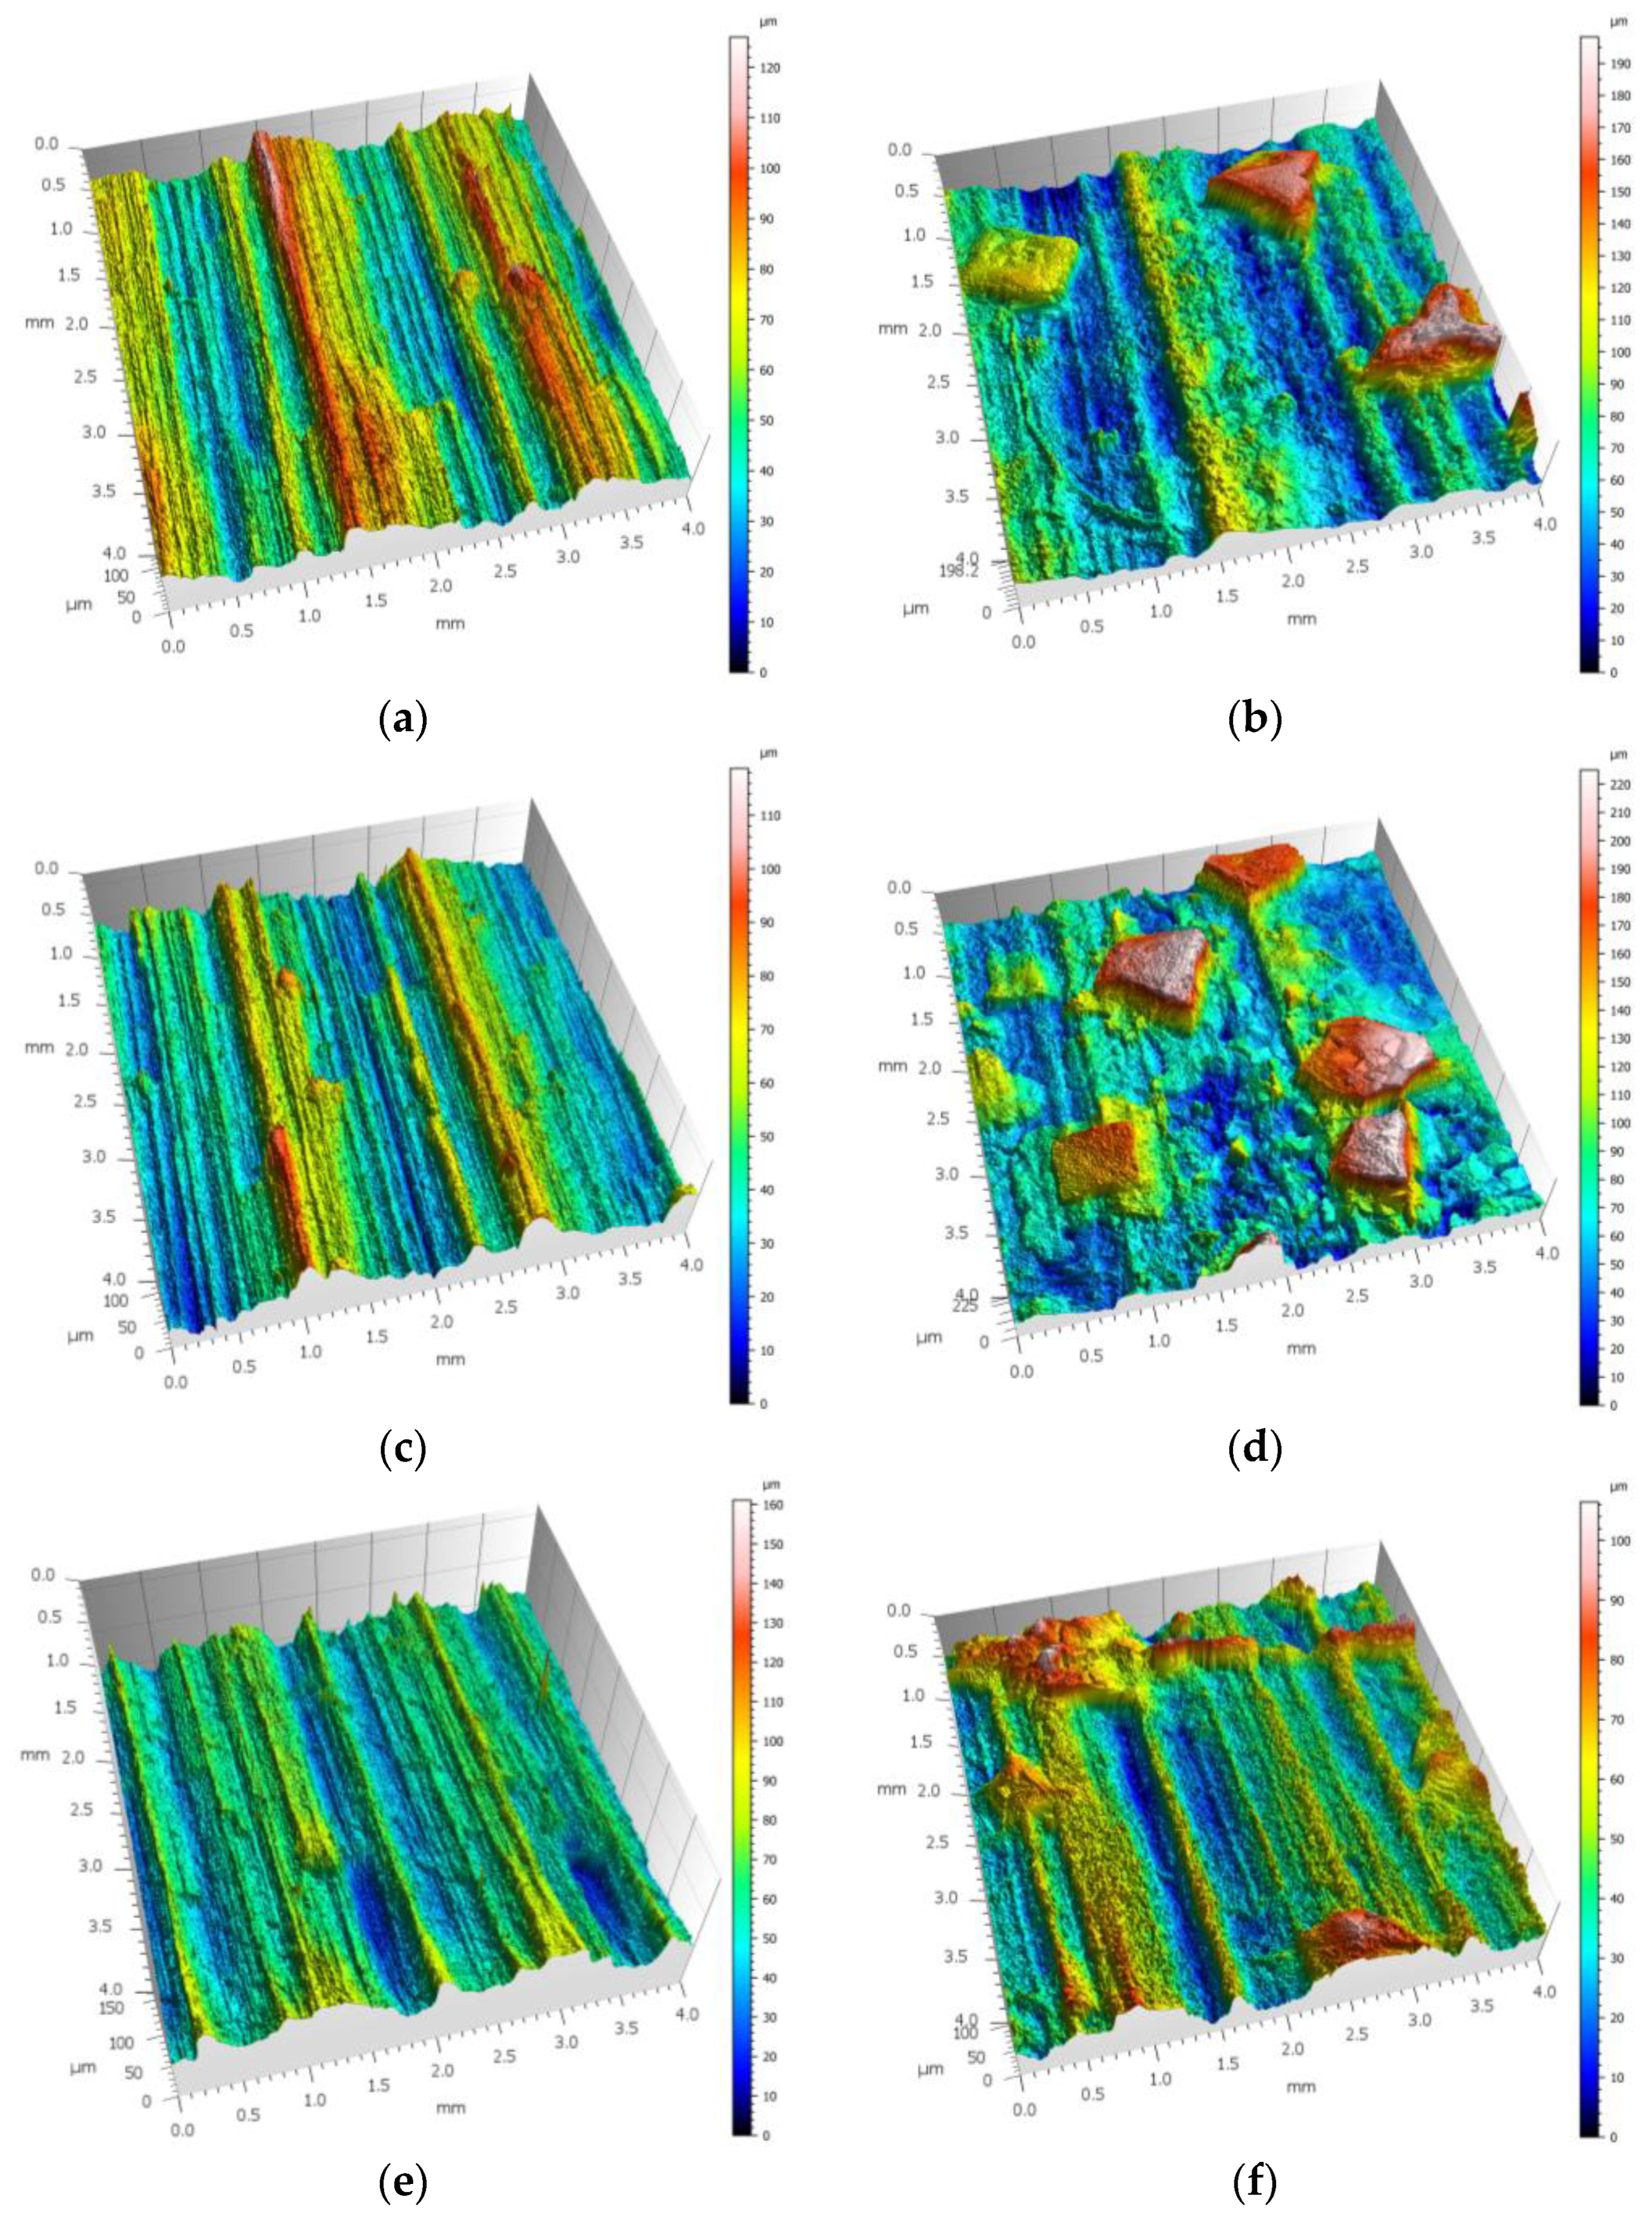
3.1. SGT Measurements After Milling and After Corrosion Process
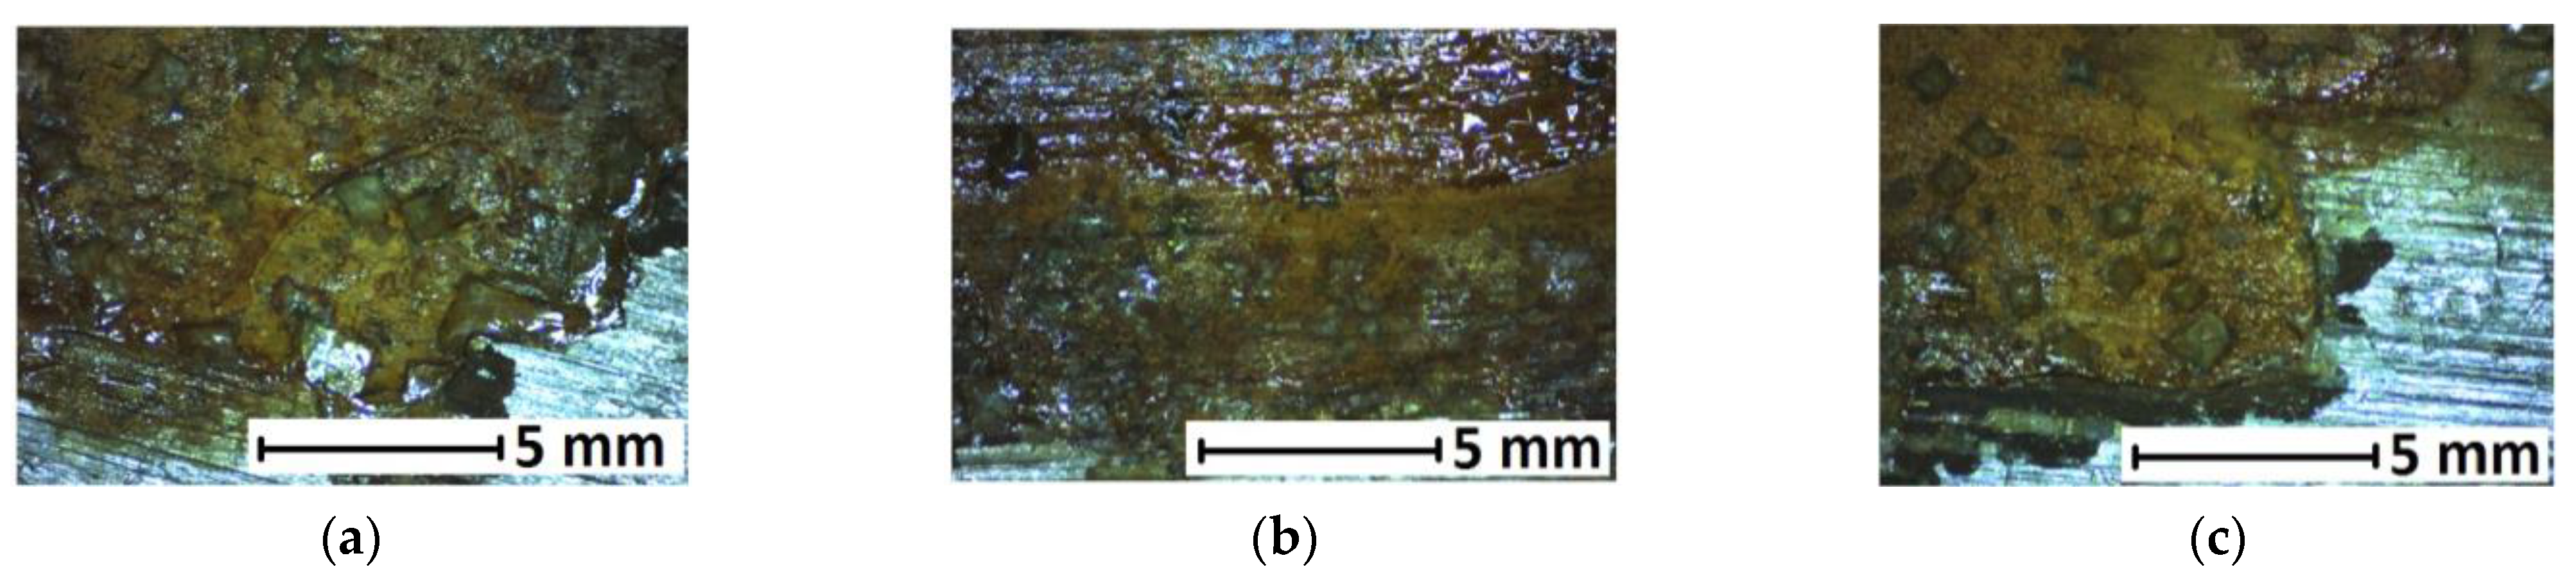
3.2. Changes in SGT Caused by Use of Corrosion Product Removers
4. Discussion
4.1. Assessment of SGT After Milling and After Corrosion Process
4.2. Assessment of Changes in SGT Caused by Use of Corrosion Product Removers
- In the short term, all three agents (R1, R2 and R3) contributed to the removal of the corrosion products, with the Epoxy Brunox (R2) showing the most pronounced efficiency due to its combined chemical and polymeric actions.
- In the long term, the Epoxy Brunox (R2) maintained the surface integrity through passivation, whereas the cola drink (R3) led to the formation of new corrosion foci due to the lack of protective properties and residue-promoted moisture retention.
5. Conclusions
- Corrosion and associated problems are an important economic issue. The oft-repeated fact that it is better to use suitable corrosion protection than to carry out corrosion product removal processes afterwards should be emphasised here. Even the smallest foci of corrosion lead to the loss of metallic materials. It is important to detect it at an early stage, when it occupies a small part of the surface and the corrosion is still superficial.
- If corrosion is already present, it can be removed with common cola drinks. However, their action is limited to short-term exposure and must be followed by immediate rinsing and surface protection, as prolonged contact can lead to further corrosion development. Although the initial effect of cola resembles that of professional agents (such as R1), its long-term effectiveness is significantly lower and may even accelerate the formation of new corrosion foci, increasing the surface roughness. Thus, while cola can be considered as a temporary or emergency solution, it should not be treated as an equivalent alternative to dedicated corrosion product removers.
- Corrosion product removers left on the surface for too long can lead to permanent changes in the surface. As well as reducing the height of the irregularities, they can lead to changes in the volumetric indices responsible for ensuring the texture and functionality of the object in question.
- After the application of chemicals to remove corrosion products, it is rare that completely new metallic surface fragments are exposed. The remaining tarnishes and discolourations should be removed additionally in a minimally invasive manner (this was not done during the experimental tests).
- As a direction for further research, it may possible to check the effects of the hydrophilic properties of a surface on its corrosion resistance by estimating the wetting angles of samples at different measurement stages.
Author Contributions
Funding
Institutional Review Board Statement
Informed Consent Statement
Data Availability Statement
Conflicts of Interest
Abbreviations
| GDP | Gross domestic product |
| SGT | Surface geometrical texture |
References
- Grzejda, R.; Parus, A. Health assessment of a multi-bolted connection due to removing selected bolts. FME Trans. 2021, 49, 634–642. [Google Scholar] [CrossRef]
- Balakrishnan, T.S.; Sultan, M.T.H.; Shahar, F.S.; Basri, A.A.; Shah, A.U.M.; Sebaey, T.A.; Łukaszewicz, A.; Józwik, J.; Grzejda, R. Fatigue and impact properties of kenaf/glass-reinforced hybrid pultruded composites for structural applications. Materials 2024, 17, 302. [Google Scholar] [CrossRef]
- Huang, Y.; Sultan, M.T.H.; Shahar, F.S.; Grzejda, R.; Łukaszewicz, A. Hybrid fiber-reinforced biocomposites for marine applications: A review. J. Compos. Sci. 2024, 8, 430. [Google Scholar] [CrossRef]
- Harsimran, S.; Santosh, K.; Rakesh, K. Overview of corrosion and its control: A critical review. Proc. Eng. Sci. 2021, 3, 13–24. [Google Scholar] [CrossRef]
- Tkaczyk, S.; Szpotański, M. Damage to palletized loads in road transport. WUT J. Transp. Eng. 2022, 137, 19–37. [Google Scholar] [CrossRef]
- Dubiel, T.; Grzejda, R. Effect of atmospheric conditions on the tightening behaviour of HV galvanised bolts in structural bolt sets. Lubricants 2023, 11, 460. [Google Scholar] [CrossRef]
- Jhavar, S.; Paul, C.P.; Jain, N.K. Causes of failure and repairing options for dies and molds: A review. Eng. Fail. Anal. 2013, 34, 519–535. [Google Scholar] [CrossRef]
- Akpanyung, K.V.; Loto, R.T. Pitting corrosion evaluation: A review. J. Phys. Conf. Ser. 2019, 1378, 022088. [Google Scholar] [CrossRef]
- Zhang, J.-J.; Zhang, J.-G.; Rosenkranz, A.; Zhao, X.-L.; Song, Y.-L. Surface textures fabricated by laser surface texturing and diamond cutting—Influence of texture depth on friction and wear. Adv. Eng. Mater. 2018, 20, 1700995. [Google Scholar] [CrossRef]
- De Palo, R.; Mazzarone, A.E.; Volpe, A.; Gaudiuso, C.; Mezzapesa, F.P.; Spagnolo, V.; Ancona, A. Investigation of Laser-Induced Surface Structures (LIPSS) on quartz and evaluation of their influence on material wettability. Opt. Laser Technol. 2024, 169, 110097. [Google Scholar] [CrossRef]
- Khan, M.A.; Halil, A.M.; Abidin, M.S.Z.; Hassan, M.H.; Rahman, A.A.A. Influence of laser surface texturing on the surface morphology and wettability of metals and non-metals: A review. Mater. Today Chem. 2024, 41, 102316. [Google Scholar] [CrossRef]
- Legrand, Q.; Biancarelli, E.; Goux-Henry, C.; Benayoun, S.; Andrioletti, B.; Valette, S. Elaboration of highly hydrophobic surface by coupling femtosecond laser texturing and fluorine-free chemistry. Colloids Surf. A Physicochem. Eng. Asp. 2025, 704, 135370. [Google Scholar] [CrossRef]
- Moronuki, N. Functional texture design and texturing processes. Int. J. Autom. Technol. 2016, 10, 4–15. [Google Scholar] [CrossRef]
- Masato, D.; Piccolo, L.; Lucchetta, G.; Sorgato, M. Texturing technologies for plastics injection molding: A review. Micromachines 2022, 13, 1211. [Google Scholar] [CrossRef]
- Pratap, T.; Patra, K. Fabrication of micro-textured surfaces using ball-end micromilling for wettability enhancement of Ti-6Al-4V. J. Mater. Process. Technol. 2018, 262, 168–181. [Google Scholar] [CrossRef]
- Pratap, T.; Patra, K. Tribological performances of symmetrically micro-textured Ti-6Al-4V alloy for hip joint. Int. J. Mech. Sci. 2020, 182, 105736. [Google Scholar] [CrossRef]
- Tiwari, A.K.; Jha, V.K.; Singh, R.K.; Ji, G. Investigation on the effects of electrical discharge machining on mild steel surface texture and its corrosion behaviour in NaCl solutions. Mater. Today Proc. 2023, 80, 293–297. [Google Scholar] [CrossRef]
- Huang, Q.; Shi, X.; Xue, Y.; Zhang, K.; Wu, C. Recent progress on surface texturing and solid lubricants in tribology: Designs, properties, and mechanisms. Mater. Today Commun. 2023, 35, 105854. [Google Scholar] [CrossRef]
- Volpe, A.; Gaudiuso, C.; Ancona, A. Laser fabrication of anti-icing surfaces: A review. Materials 2020, 13, 5692. [Google Scholar] [CrossRef]
- Ince, F.D.; Özel, T. Laser surface texturing of materials for surface functionalization: A holistic review. Surf. Coat. Technol. 2025, 498, 131818. [Google Scholar] [CrossRef]
- Macek, W. Fracture surface formation of notched 2017A-T4 aluminium alloy under bending fatigue. Int. J. Fract. 2022, 234, 141–157. [Google Scholar] [CrossRef]
- Krajewski, S.J.; Grochała, D.; Tomków, J.; Grzejda, R. Analysis of the surface stereometry of alloyed austenitic steel after fibre laser cutting using confocal microscopy. Coatings 2023, 13, 15. [Google Scholar] [CrossRef]
- Grochała, D.; Grzejda, R.; Parus, A.; Berczyński, S. The wavelet transform for feature extraction and surface roughness evaluation after micromachining. Coatings 2024, 14, 210. [Google Scholar] [CrossRef]
- Lasemi, A.; Xue, D.; Gu, P. Recent development in CNC machining of freeform surfaces: A state-of-the-art review. Comput.-Aided Des. 2010, 42, 641–654. [Google Scholar] [CrossRef]
- Grochała, D.; Grzejda, R.; Józwik, J.; Siemiątkowski, Z. Improving the degree of surface isotropy of parts manufactured using hybrid machining processes. Coatings 2025, 15, 461. [Google Scholar] [CrossRef]
- Grzesik, W. Prediction of the functional performance of machined components based on surface topography: State of the art. J. Mater. Eng. Perform. 2016, 25, 4460–4468. [Google Scholar] [CrossRef]
- Grudzień, J.; Grochała, D.; Grzejda, R.; Kochmański, P. Testing the effectiveness of hybrid milling and surface burnishing in improving the wear resistance of machine parts made of structural steel. Lubricants 2024, 12, 458. [Google Scholar] [CrossRef]
- Amiriafshar, M.; Rafieazad, M.; Duan, X.; Nasiri, A. Fabrication and coating adhesion study of superhydrophobic stainless steel surfaces: The effect of substrate surface roughness. Surf. Interfaces 2020, 20, 100526. [Google Scholar] [CrossRef]
- Grochała, D.; Jasiewicz, M.; Filipowicz, K.; Parus, A.; Powałka, B.; Grzejda, R.; Zmarzły, P. Assessment of the functional properties of the surfaces of ductile cast iron parts. Appl. Sci. 2024, 14, 9129. [Google Scholar] [CrossRef]
- Sługocka, M.; Grochała, D.; Kwiatkowski, K.; Grzejda, R.; Zmarzły, P. Study of the impact of surface topography on selected mechanical properties of adhesive joints. Coatings 2024, 14, 944. [Google Scholar] [CrossRef]
- Shen, L.; Yang, H.; Gao, S.; Fang, J. Production Scheduling with Mould Maintenance in Flow Shop. In Proceedings of the 2016 4th International Conference on Sensors, Mechatronics and Automation, Zuhai, China, 12–13 November 2016; pp. 730–733. [Google Scholar]
- Fu, X.Y.; Chan, F.T.S.; Niu, B.; Chung, N.S.H.; Qu, T. A multi-objective pigeon inspired optimization algorithm for fuzzy production scheduling problem considering mould maintenance. Sci. China Inf. Sci. 2019, 62, 070202. [Google Scholar] [CrossRef]
- Kochmańska, A.E.; Kochmański, P. Failure analysis of grate in a municipal solid waste incineration plant. Eng. Fail. Anal. 2024, 165, 108823. [Google Scholar] [CrossRef]
- Wierzbowska, K.; Kochmańska, A.E.; Kochmański, P. Resistance of aluminide coatings on austenitic stainless steel in a nitriding atmosphere. Materials 2022, 15, 162. [Google Scholar] [CrossRef]
- Cole, I.S.; Muster, T.H.; Azmat, N.S.; Venkatraman, M.S.; Cook, A. Multiscale modelling of the corrosion of metals under atmospheric corrosion. Electrochim. Acta 2011, 56, 1856–1865. [Google Scholar] [CrossRef]
- Schindelholz, E.; Kelly, R.G. Wetting phenomena and time of wetness in atmospheric corrosion: A review. Corros. Rev. 2012, 30, 135–170. [Google Scholar] [CrossRef]
- Koch, G. Cost of corrosion. In Trends in Oil and Gas Corrosion Research and Technologies; Woodhead Publishing: Boston, MA, USA, 2017; pp. 3–30. [Google Scholar]
- Nawrocki, J.; Raczyk-Stanisławiak, U.; Świetlik, J.; Olejnik, A.; Sroka, M.J. Corrosion in a distribution system: Steady water and its composition. Water Res. 2010, 44, 1863–1872. [Google Scholar] [CrossRef]
- Roberge, P.R. Atmospheric corrosion. In Uhlig’s Corrosion Handbook, 3rd ed.; Revie, R.W., Ed.; John Wiley & Sons: Hoboken, NJ, USA, 2011; pp. 299–326. [Google Scholar]
- Cole, I.S.; Marney, D. The science of pipe corrosion: A review of the literature on the corrosion of ferrous metals in soils. Corros. Sci. 2012, 56, 5–16. [Google Scholar] [CrossRef]
- The Weather Year Round Anywhere on Earth. Available online: https://weatherspark.com (accessed on 31 March 2025).
- Ruhl, A.S.; Kranzmann, A. Investigation of corrosive effects of sulphur dioxide, oxygen and water vapour on pipeline steels. Int. J. Greenh. Gas Control 2013, 13, 9–16. [Google Scholar] [CrossRef]
- Farooq, S.A.; Raina, A.; Haq, M.I.U.; Anand, A. Corrosion behaviour of engineering materials: A review of mitigation methodologies for different environments. J. Inst. Eng. India Ser. D 2022, 103, 639–661. [Google Scholar] [CrossRef]
- Stango, R.J.; Khullar, P. Fundamentals of Bristle Blasting Process for Removing Corrosive Layer. In Proceedings of the CORROSION 2009 Conference, Atlanta, GA, USA, 22–26 March 2009. [Google Scholar]
- Rudawska, A. Mechanical surface treatment of adherends for adhesive bonding. In Progress in Adhesion and Adhesives; Mittal, K.L., Ed.; John Wiley & Sons: Hoboken, NJ, USA, 2023; Volume 7, pp. 113–169. [Google Scholar]
- Zhuang, S.; Kainuma, S.; Yang, M.; Haraguchi, M.; Asano, T. Investigation on the peak temperature and surface defects on the carbon steel treated by rotating CW laser. Opt. Laser Technol. 2021, 135, 106727. [Google Scholar] [CrossRef]
- Wang, Q.; Kainuma, S.; Zhuang, S.; Shimizu, K.; Haraguchi, M. Laser cleaning on severely corroded steel members: Engineering attempt and cleanliness assessment. J. Clean. Prod. 2022, 376, 134224. [Google Scholar] [CrossRef]
- Guaragnone, T.; Casini, A.; Chelazzi, D.; Giorgi, R. PVA-based peelable films loaded with tetraethylenepentamine for the removal of corrosion products from bronze. Appl. Mater. Today 2020, 19, 100549. [Google Scholar] [CrossRef]
- Švadlena, J.; Prošek, T.; Strachotová, K.C.; Kouřil, M. Chemical removal of lead corrosion products. Materials 2020, 13, 5672. [Google Scholar] [CrossRef] [PubMed]
- Dwivedi, D.; Lepková, K.; Becker, T. Carbon steel corrosion: A review of key surface properties and characterization methods. RSC Adv. 2017, 7, 4580. [Google Scholar] [CrossRef]
- Hilbert, L.R.; Bagge-Ravn, D.; Kold, J.; Gram, L. Influence of surface roughness of stainless steel on microbial adhesion and corrosion resistance. Int. Biodeterior. Biodegrad. 2003, 52, 175–185. [Google Scholar] [CrossRef]
- Li, W.; Li, D.Y. Influence of surface morphology on corrosion and electronic behavior. Acta Mater. 2006, 54, 445–452. [Google Scholar] [CrossRef]
- Seo, M.J.; Shim, H.-S.; Kim, K.M.; Hong, S.-I.; Hur, D.H. Influence of surface roughness on the corrosion behavior of Alloy 690TT in PWR primary water. Nucl. Eng. Des. 2014, 280, 62–68. [Google Scholar] [CrossRef]
- Jawwad, A.K.A.; Mohamed, I.K. The combined effects of surface texture, flow patterns and water chemistry on corrosion mechanisms of stainless steel condenser tubes. Eng. Fail. Anal. 2020, 109, 104390. [Google Scholar] [CrossRef]
- Šolić, T.; Marić, D.; Bašić, A.; Samardžić, I. Influence of surface roughness on the rate of corrosion penetration into the steel. Metalurgija 2023, 62, 99–102. [Google Scholar]
- Bai, H.; Cui, X.; Wang, R.; Lv, N.; Yang, X.; Li, R.; Ma, Y. Effect of surface roughness on static corrosion behavior of J55 carbon steel in CO2-containing geothermal water at 65 °C. Coatings 2023, 13, 821. [Google Scholar] [CrossRef]
- Pu, Z.; Song, G.-L.; Yang, S.; Outeiro, J.C.; Dillon, O.W., Jr.; Puleo, D.A.; Jawahir, I.S. Grain refined and basal textured surface produced by burnishing for improved corrosion performance of AZ31B Mg alloy. Corros. Sci. 2012, 57, 192–201. [Google Scholar] [CrossRef]
- Parapurath, S.; Elkhodbia, M.; Gunister, E. Effect of Grinding, Polishing and HCl on Surface Roughness of Low Carbon Steel. In Proceedings of the Advances in Science and Engineering Technology International Conferences, Dubai, United Arab Emirates, 26 March–10 April 2019. [Google Scholar]
- Say, Y.; Aslan, N.; Alla, A.M.A.; Özmen, H. Influence of chemical etchings on surface properties, in-vitro degradation and ion releases of 316l stainless steel alloy for biomedical applications. Mater. Chem. Phys. 2023, 295, 127139. [Google Scholar] [CrossRef]
- Arnold, W.H.; Haddad, B.; Schaper, K.; Hagemann, K.; Lippold, C.; Danesh, G. Enamel surface alterations after repeated conditioning with HCl. Head Face Med. 2015, 11, 32. [Google Scholar] [CrossRef]
- Wang, Y.; Shkel, A.M. Study on Surface Roughness Improvement of Fused Quartz After Thermal and Chemical Post-Processing. In Proceedings of the 2016 IEEE International Symposium on Inertial Sensors and Systems, Laguna Beach, CA, USA, 22–25 February 2016. [Google Scholar]
- Sun, S.; Chen, W.; Yi, S.; Cao, S. Study of the corrosion protection behavior of neutral water-based rust remover on carbon steel. Colloids Surf. A Physicochem. Eng. Asp. 2018, 558, 130–137. [Google Scholar] [CrossRef]
- OPN-Rust Remover Clear, Safety Data Sheet. Available online: https://www.opn-chemie.com/wp-content/uploads/2017/11/SDB-60439_OPN-Rust-Remover-Clear_EN.pdf (accessed on 25 April 2025).
- Brunox® Epoxy, Safety Data Sheet. Available online: https://www.brunox.pl/pdf/BRUNOX-EPOXY-2015.pdf (accessed on 25 April 2025).
- Winogrodzka, A.; Valefi, M.; de Rooij, M.B.; Schipper, D.J. Measurement of chemical and geometrical surface changes in a wear track by a confocal height sensor and confocal Raman spectroscopy. Arch. Civ. Mech. Eng. 2014, 14, 1–5. [Google Scholar] [CrossRef]
- Ţălu, Ş.; Achour, A.; Solaymani, S.; Nikpasand, K.; Dalouji, V.; Sari, A.; Rezaee, S.; Nezafat, N.B. Micromorphology analysis of TiO2 thin films by atomic force microscopy images: The influence of postannealing. Microsc. Res. Tech. 2020, 83, 457–463. [Google Scholar] [CrossRef]
- PN-EN ISO 25178-2; Geometrical Product Specifications (GPS), Surface Texture: Areal, Part 2: Terms, Definitions and Surface Texture Parameters. Polish Committee for Standardization: Warsaw, Poland, 2022.
- Zmarzły, P. Influence of bearing raceway surface topography on the level of generated vibration as an example of operational heredity. Indian J. Eng. Mater. Sci. 2020, 27, 356–364. [Google Scholar]
- Macek, W. Correlation between fractal dimension and areal surface parameters for fracture analysis after bending-torsion fatigue. Metals 2021, 11, 1790. [Google Scholar] [CrossRef]
- Podulka, P.; Knapčíková, L.; Tauberová, R.; Martiček, M.; Sukić, E. Study of etched surface topography with the compensation of contactless vibrational measurement errors. Measurement 2025, 242, 116218. [Google Scholar] [CrossRef]
- Macek, W. The impact of surface slope and calculation resolution on the fractal dimension for fractures of steels after bending-torsion fatigue. Surf. Topogr. Metrol. Prop. 2022, 10, 015030. [Google Scholar] [CrossRef]
- Gathimba, N.; Kitane, Y. Effect of surface roughness on tensile ductility of artificially corroded steel plates. J. Constr. Steel Res. 2021, 176, 106392. [Google Scholar] [CrossRef]
- Cai, L.; Kim, A.; Kainuma, S. Surface texture evolution of weathering steel in corrosive marine atmospheres: Geospatial variability and explainable machine learning models. Corros. Sci. 2025, 243, 112602. [Google Scholar] [CrossRef]
- Misyura, S.Y.; Feoktistov, D.V.; Morozov, V.S.; Orlova, E.G.; Kuznetsov, G.V.; Islamova, A.G. Effect of heat treatment on corrosion of laser-textured aluminum alloy surfaces. J. Mater. Sci. 2021, 56, 12845–12863. [Google Scholar] [CrossRef]
- Kondaiah, P.; Pitchumani, R. Fractal textured surfaces for high temperature corrosion mitigation in molten salts. Sol. Energy Mater. Sol. Cells 2021, 230, 111281. [Google Scholar] [CrossRef]
- Yayoglu, Y.E.; Toomey, R.G.; Crane, N.B.; Gallant, N.D. Laser machined micropatterns as corrosion protection of both hydrophobic and hydrophilic magnesium. J. Mech. Behav. Biomed. Mater. 2022, 125, 104920. [Google Scholar] [CrossRef] [PubMed]
- Caraguay, S.J.; Pereira, T.S.; Giacomelli, R.O.; Cunha, A.; Pereira, M.; Xavier, F.A. The effect of laser surface textures on the corrosion resistance of epoxy coated steel exposed to aggressive environments for offshore applications. Surf. Coat. Technol. 2022, 437, 128371. [Google Scholar] [CrossRef]
- Zhang, L.; Lin, N.; Zou, J.; Lin, X.; Liu, Z.; Yuan, S.; Yu, Y.; Wang, Z.; Zeng, Q.; Chen, W.; et al. Super-hydrophobicity and corrosion resistance of laser surface textured AISI 304 stainless steel decorated with Hexadecyltrimethoxysilane (HDTMS). Opt. Laser Technol. 2020, 127, 106146. [Google Scholar] [CrossRef]
- Rodič, P.; Kovač, N.; Kralj, S.; Jereb, S.; Golobič, I.; Može, M.; Milošev, I. Anti-corrosion and anti-icing properties of superhydrophobic laser-textured aluminum surfaces. Surf. Coat. Technol. 2024, 494, 131325. [Google Scholar] [CrossRef]
- Ezazi, M.; Shrestha, B.; Klein, N.; Lee, D.H.; Kwon, G. Self-healable superomniphobic surfaces for corrosion protection. ACS Appl. Mater. Interfaces 2019, 11, 30240–30246. [Google Scholar] [CrossRef]
- Zhang, M.; Chen, P.; Wang, G.; Dai, T.; Sun, P. Preparation of liquid-infused surface on epoxy resin for improved tribological and anti-corrosion performance. Colloids Surf. A Physicochem. Eng. Asp. 2023, 668, 131472. [Google Scholar] [CrossRef]
- Zhang, M.; Chen, P.; Li, J.; Wang, G. Water-repellent and corrosion resistance properties of epoxy-resin-based slippery liquid-infused porous surface. Prog. Org. Coat. 2022, 172, 107152. [Google Scholar] [CrossRef]
- McBride, S.A.; Dash, S.; Varanasi, K.K. Evaporative crystallization in drops on superhydrophobic and liquid-impregnated surfaces. Langmuir 2018, 34, 12350–12358. [Google Scholar] [CrossRef] [PubMed]
- Álvarez-Rodríguez, L.; de Moura, J.; Fernández-Vigo, J.I.; Macarro-Merino, A.; Fernández-Vigo, J.Á.; Novo, J.; Ortega, M. Heatmap-guided balanced multi-task learning approach for glistening characterization in OCT images. Biomed. Signal Process. Control 2025, 104, 107527. [Google Scholar] [CrossRef]


| OPN-Rust Remover (R1) | Epoxy Brunox (R2) | ||
|---|---|---|---|
| Content, % | Component | Content, % | Component |
| 25–50 | Hydrocarbons, C10–C13, n-alkanes, isoalkanes, cycloalkanes, <2% aromatics | 10–25 | 2-Methoxy-1-methylethyl acetate |
| 10–20 | Propane | 10–15 | 1-Methoxy-2-propanol |
| 10–20 | Distillates (petroleum), hydrotreated light naphthenic | 3–10 | Isopropyl alcohol |
| 10–20 | Butane | 3–10 | Diethylene glycol monobutyl ether |
| 5–10 | Isobutane | 3–10 | Ethylene glycol |
| 1–2.5 | 2-Butoxyethanol | 1–2 | Formic acid |
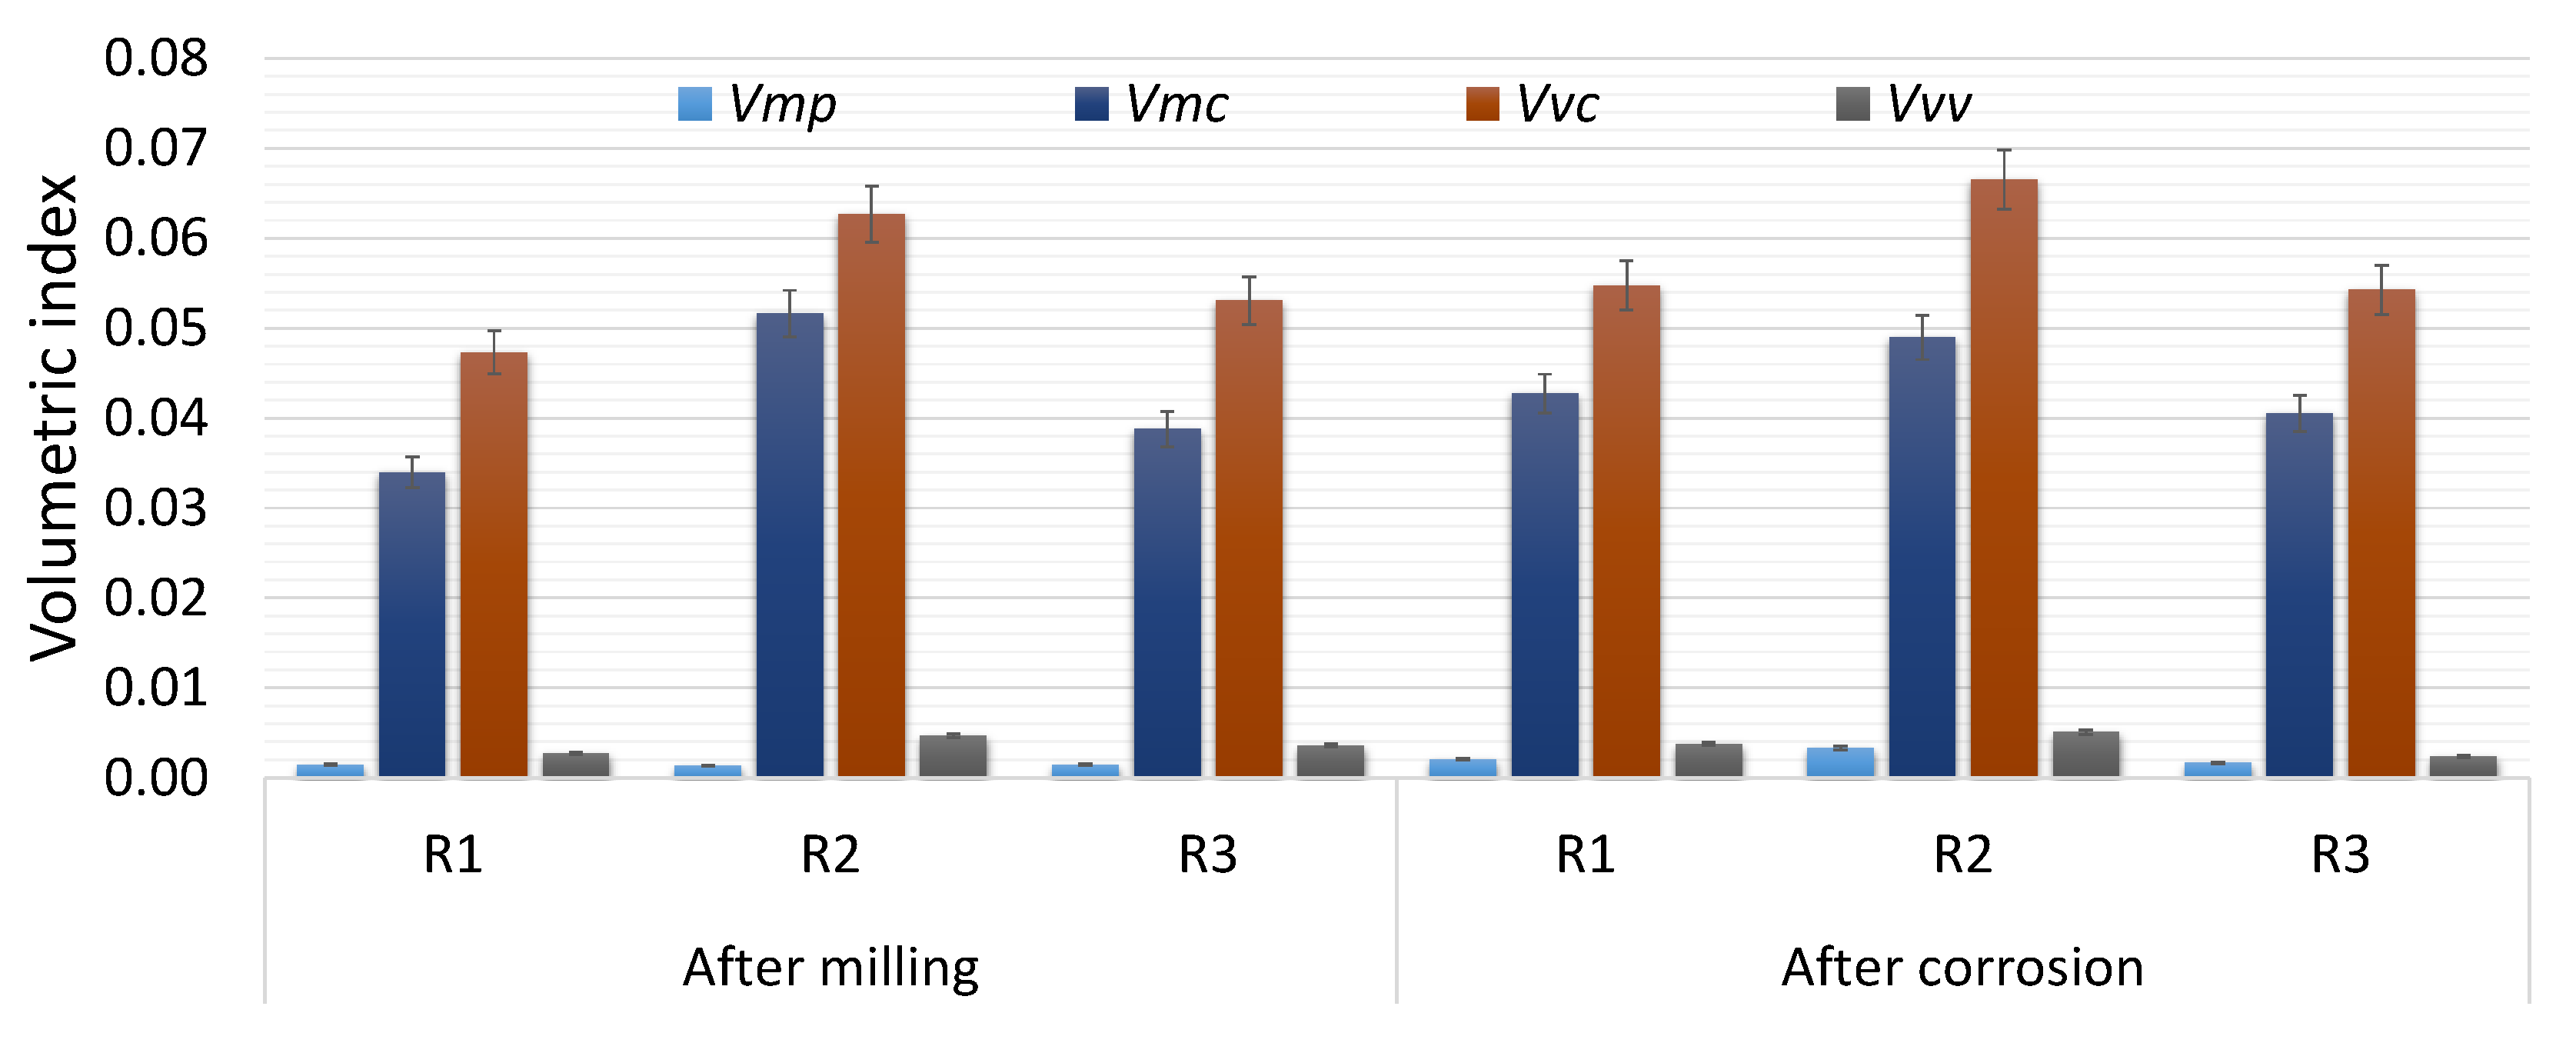
| Index | After Milling | After Corrosion Process | ||||
|---|---|---|---|---|---|---|
| R1 | R2 | R3 | R1 | R2 | R3 | |
| Sa | 15.0 | 13.5 | 9.70 | 20.5 | 29.5 | 13.4 |
| Spk | 14.2 | 18.3 | 12.1 | 46.2 | 87.4 | 22.6 |
| Sk | 54.3 | 42.2 | 30.1 | 66.5 | 70.1 | 40.6 |
| Svk | 7.30 | 7.90 | 10.9 | 8.30 | 13.0 | 10.3 |
| Vmp | 0.0015 | 0.0014 | 0.0015 | 0.0021 | 0.0033 | 0.0017 |
| Vmc | 0.0340 | 0.0516 | 0.0388 | 0.0427 | 0.0490 | 0.0405 |
| Vvc | 0.0473 | 0.0626 | 0.0530 | 0.0547 | 0.0665 | 0.0542 |
| Vvv | 0.0027 | 0.0047 | 0.0036 | 0.0038 | 0.0051 | 0.0024 |
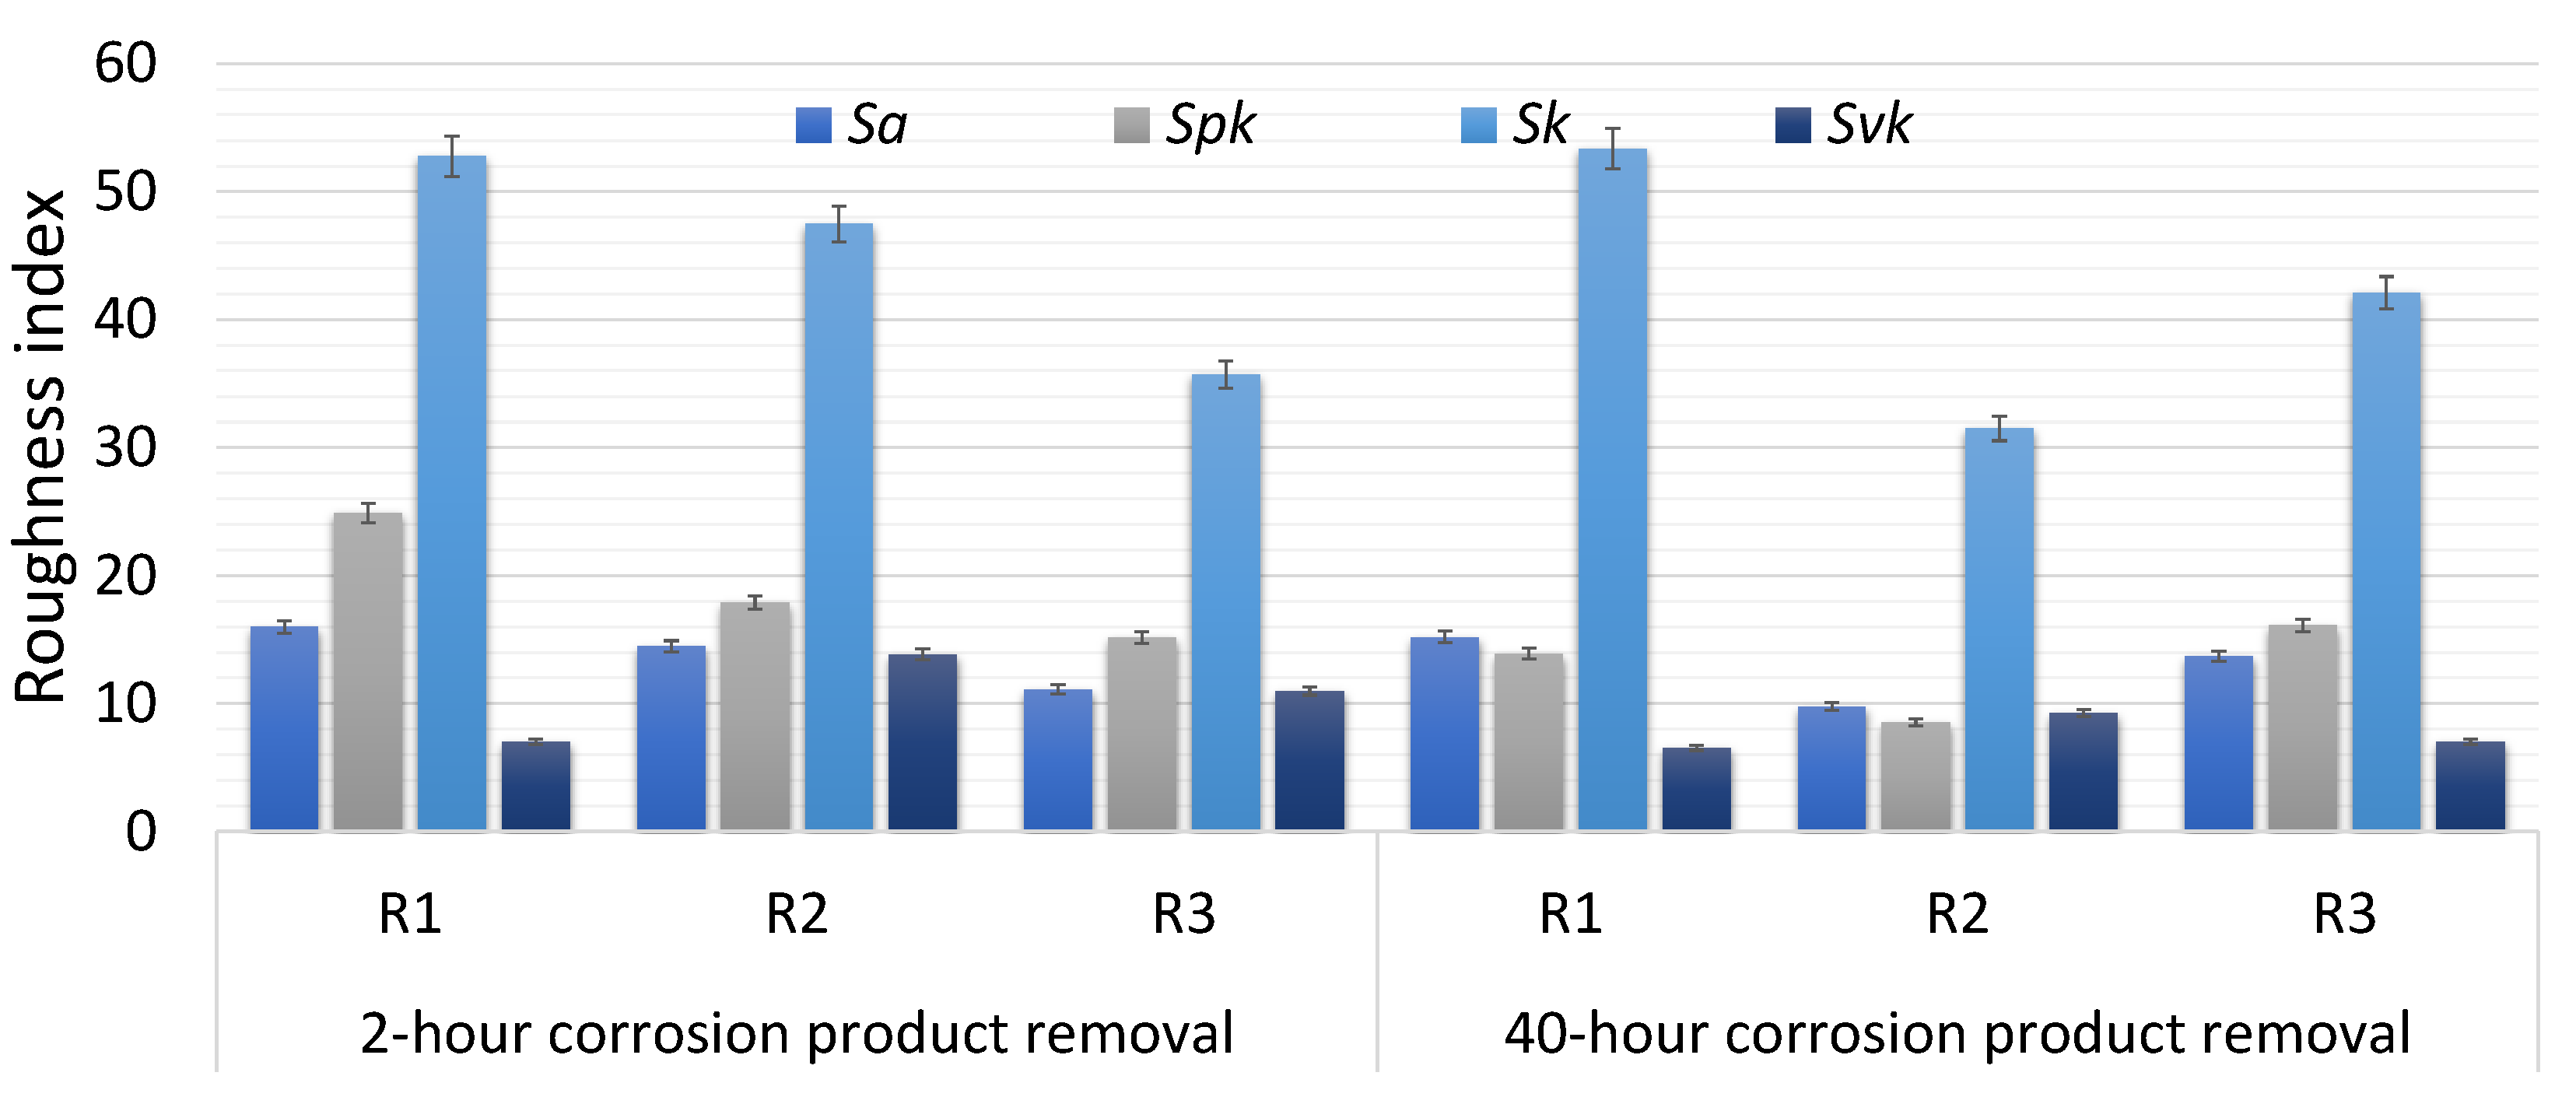
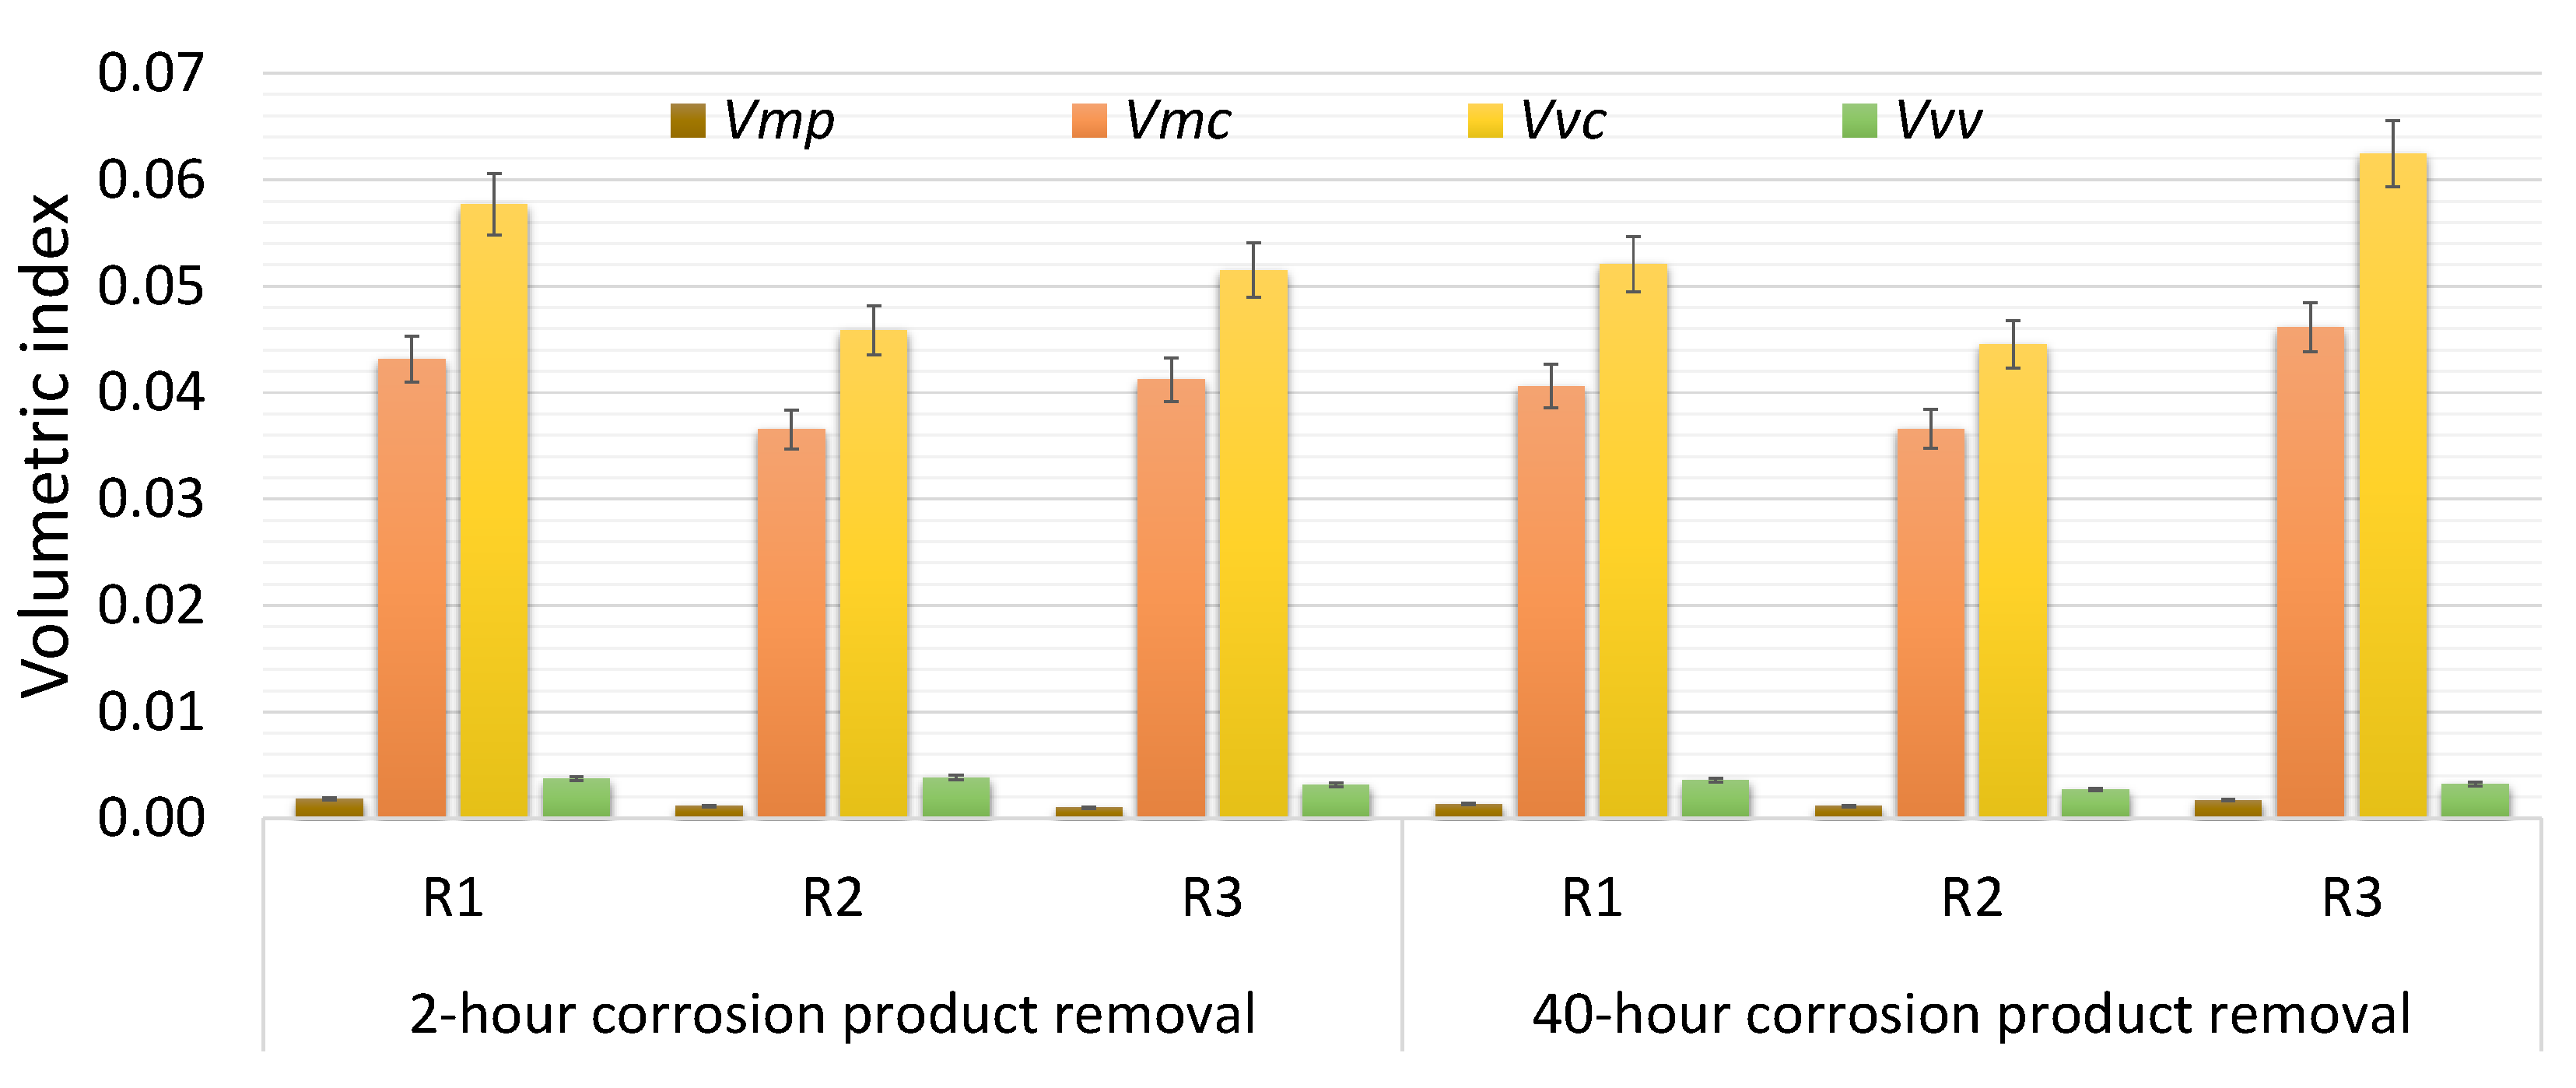
| Index | 2 h Corrosion Product Removal | 40 h Corrosion Product Removal | ||||
|---|---|---|---|---|---|---|
| R1 | R2 | R3 | R1 | R2 | R3 | |
| Sa | 16.0 | 14.5 | 11.1 | 15.2 | 9.80 | 13.7 |
| Spk | 24.9 | 17.9 | 15.2 | 13.9 | 8.50 | 16.1 |
| Sk | 52.8 | 47.5 | 35.7 | 53.4 | 31.5 | 42.1 |
| Svk | 7.00 | 13.8 | 11.0 | 6.50 | 9.30 | 7.00 |
| Vmp | 0.0018 | 0.0011 | 0.0010 | 0.0013 | 0.0011 | 0.0017 |
| Vmc | 0.0432 | 0.0365 | 0.0412 | 0.0406 | 0.0366 | 0.0461 |
| Vvc | 0.0577 | 0.0459 | 0.0515 | 0.0521 | 0.0445 | 0.0625 |
| Vvv | 0.0037 | 0.0038 | 0.0032 | 0.0036 | 0.0027 | 0.0032 |
| Index | 2 h Corrosion Product Removal | 40 h Corrosion Product Removal | ||||
|---|---|---|---|---|---|---|
| R1 | R2 | R3 | R1 | R2 | R3 | |
| KSa | 0.07 | 0.07 | 0.14 | 0.01 | −0.28 | 0.41 |
| KSpk | 0.76 | −0.02 | 0.25 | −0.02 | −0.53 | 0.33 |
| KSk | −0.03 | 0.13 | 0.19 | −0.02 | −0.25 | 0.40 |
| KSvk | −0.04 | 0.76 | 0.00 | −0.10 | 0.18 | −0.36 |
| KVmp | 0.24 | −0.16 | −0.32 | −0.10 | −0.15 | 0.16 |
| KVmc | 0.27 | −0.29 | 0.06 | 0.20 | −0.29 | 0.19 |
| KVvc | 0.22 | −0.27 | −0.03 | 0.10 | −0.29 | 0.18 |
| KVvv | 0.36 | −0.18 | −0.13 | 0.30 | −0.42 | −0.11 |
| Agent | Type/Use | Mechanism of Action | Short-Term Effect on Corrosion | Long-Term Effect on Corrosion |
|---|---|---|---|---|
| R1 | Professional corrosion product remover | Dissolves corrosion via solvent penetration, no chemical neutralisation or conversion | Effective removal of loose corrosion products, preserved surface integrity | No passivation—surface susceptible to re-corrosion, protection required after cleaning |
| R2 | Industrial corrosion product converter and epoxy primer | Dissolves iron oxides, forms a protective conversion layer (phosphates, polymers), epoxy acts as barrier | Effective corrosion product removal, pre-coating protection | Long-term passivation, possible change in SGT by dissolving raised areas |
| R3 | Consumer drink (used experimentally) | Mild acidic action, dissolves salts and light corrosion products, no protective effect, sugars attract moisture | Noticeable short-term cleaning, no full corrosion neutralisation | Promotion of re-corrosion, moisture retention due to sugar, increased surface roughness over time |
Disclaimer/Publisher’s Note: The statements, opinions and data contained in all publications are solely those of the individual author(s) and contributor(s) and not of MDPI and/or the editor(s). MDPI and/or the editor(s) disclaim responsibility for any injury to people or property resulting from any ideas, methods, instructions or products referred to in the content. |
© 2025 by the authors. Licensee MDPI, Basel, Switzerland. This article is an open access article distributed under the terms and conditions of the Creative Commons Attribution (CC BY) license (https://creativecommons.org/licenses/by/4.0/).
Share and Cite
Ochal, A.; Grochała, D.; Grzejda, R.; Kochmańska, A.E. Investigations on Changes in the Surface Geometrical Texture Caused by the Use of Corrosion Product Removers. Coatings 2025, 15, 539. https://doi.org/10.3390/coatings15050539
Ochal A, Grochała D, Grzejda R, Kochmańska AE. Investigations on Changes in the Surface Geometrical Texture Caused by the Use of Corrosion Product Removers. Coatings. 2025; 15(5):539. https://doi.org/10.3390/coatings15050539
Chicago/Turabian StyleOchal, Aleksandra, Daniel Grochała, Rafał Grzejda, and Agnieszka Elżbieta Kochmańska. 2025. "Investigations on Changes in the Surface Geometrical Texture Caused by the Use of Corrosion Product Removers" Coatings 15, no. 5: 539. https://doi.org/10.3390/coatings15050539
APA StyleOchal, A., Grochała, D., Grzejda, R., & Kochmańska, A. E. (2025). Investigations on Changes in the Surface Geometrical Texture Caused by the Use of Corrosion Product Removers. Coatings, 15(5), 539. https://doi.org/10.3390/coatings15050539