Abstract
As the crucial core material in aluminum–plastic-laminated films, aluminum foil serves as a barrier and shaping element for lithium-ion battery soft packaging. However, its thinness, measuring only tens of microns, makes it susceptible to the formation of pinholes during the manufacturing process, which can significantly impact the barrier performance and properties of the aluminum–plastic-laminated film. The morphology and composition of foreign particles that lead to pinholes were analyzed using scanning electron microscopy (SEM) with energy-dispersive spectroscopy (EDS). Additionally, the formation mechanism and evolution law of pinholes were investigated using a laser scanning confocal microscope (LSCM). The results revealed that foreign particles responsible for pinholes originated from the inclusions in the aluminum alloy melt, filter aid particles from rolling oil, and environmental dust particles. To address this issue, potential strategies for controlling foreign particles were proposed. These included purifying the aluminum alloy melt, filtering the rolling oil, and maintaining a clean production environment. The simulated experiments showed that foreign particles were gradually embedded in the aluminum matrix during plastic deformation, leading to damage in the aluminum matrix. When the cumulative rolling reduction ratio exceeded 38%, the aluminum foil and foreign particles began to separate along the rolling direction, resulting in the formation of pinholes. The mechanism of uncoordinated deformation between foreign particles and aluminum foil was elaborated in detail. In addition, the simulation experiment indicated that once the cumulative reduction ratio surpassed 50%, the aspect ratio of the pinhole increased rapidly. When the cumulative reduction ratio increased to 83%, the pinhole began to gradually heal. Consequently, a quantitative relationship model between the pinhole area and the rolling reduction ratio was constructed. The pinhole evolution model enables a rough prediction of the actual pinhole area change and meets the requirements for engineering applications. This research provides both engineering applications and theoretical prediction approaches that can aid in the production of high-quality aluminum foil for lithium-ion battery soft packaging.
1. Introduction
Aluminum–plastic-laminated film is a packaging material for lithium-ion batteries, which serves as a barrier against gas and water vapor [1,2]. When the levels of water and gas in the battery exceed a certain threshold, the capacity of the Li-ion battery diminishes, resulting in swelling and a decrease in cycle life and chemical performance [3]. In severe cases, this could even lead to battery failure or safety accidents [4]. However, nylon and polypropylene are the main base materials of aluminum–plastic-laminated films, which do not provide long-term barrier performance. Aluminum foil serves as the crucial core material in aluminum–plastic films, exhibiting exceptionally high resistance to moisture and gas. This makes it the unmatched material for barrier performance compared to other polymer materials or metallized films [5,6].
The high-density metal crystal structure of aluminum foil theoretically results in an effective barrier against gas and water vapor permeation [7]. The quality of aluminum foil products is governed by the pinhole density and dimensional characteristics of pinholes. Notably, the pinhole population density exhibits an inverse correlation with foil thickness. Furthermore, pinhole defects compromise the foil’s barrier performance against moisture, oxygen, and UV radiation, ultimately degrading the overall barrier effectiveness of aluminum–plastic films.
Currently, researchers from academia and industry have extensively investigated the origins of pinholes in aluminum foil. Chen D.B. et al. [8] analyzed the phase composition near pinhole defects in 1070 aluminum foil, identifying foreign particles and melt slag inclusions as primary causative agents. Özgül K. et al. [9] demonstrated that coarse intermetallic compounds with a non-uniform spatial distribution in AA8111 foil served as preferential initiation sites for pinholes. Li M. et al. [10] correlated billet quality with pinhole formation in thin-gauge aluminum foil, establishing foil stock purity and work roll surface finish as primary contributing factors. Cai H.T. et al. [11] quantified the effect of rolling oil filtration efficiency on pinhole density, confirming that the periodic regeneration of diatomaceous earth filters significantly suppressed pinhole generation. Although substantial progress has been made in pinhole source identification, the underlying deformation mechanisms and evolutionary behavior of pinholes during rolling processes remain poorly understood.
This study systematically investigates the formation mechanisms of exogenous inclusions and quantitatively tracks pinhole morphology evolution through simulated cold rolling experiments. Notably, the first observation of spontaneous pinhole healing behavior during rolling enabled the development of a self-healing kinetics model. The proposed model establishes theoretical frameworks for defect mitigation while providing process optimization strategies for industrial-scale aluminum foil manufacturing.
2. Experimental Procedure
2.1. Experimental Material
The AA8021 aluminum foil sheets were obtained from China Aluminum Luoyang Aluminum Foil Co., Ltd. (Luoyang, China). These specimens were used to investigate particulate contamination sources, evolutionary behavior, and defect formation mechanisms through simulated rolling experiments. The elemental composition of the AA8021 alloy is listed in Table 1. During the rolling simulation, the controlled introduction of exogenous particles was implemented, including Fe2O3 abrasives and AlSi10Mg intermetallics with an elliptical geometry.

Table 1.
The chemical compositions (wt.%) of AA8021.
2.2. Experimental Methods
This study employed an integrated methodology comprising (1) in situ pinhole sampling at industrial production lines, (2) simulated rolling experiments, and (3) computational mechanics analysis. The research objectives focused on elucidating the particle-induced pinhole formation mechanisms and tracking the evolution of pinhole defects during plastic deformation processes.
2.2.1. Inspection and Analysis of the Sources of Foreign Particles
Aluminum foil with pinholes was collected from industrial production lines for defect analysis. The morphology and elemental distribution of the aluminum foil were characterized using a scanning electron microscope (SEM; Apreo C, Thermo Fisher Scientific, Waltham, MA, USA) equipped with energy-dispersive spectroscopy. The device operated at a voltage of 20 kV and a current of 0.8 nA.
2.2.2. Rolling Experiments of the Pinhole Formation and Evolution
A laboratory-scale rolling mill for aluminum foil processing (shown in Figure 1) was employed to process two foil specimens with distinct initial pinhole areas (0.06 mm2 and 0.08 mm2). The pinhole morphology evolution was systematically analyzed at cumulative rolling reduction ratios of 16%, 51%, 78%, and 83%, where the reduction ratio R is defined as follows:
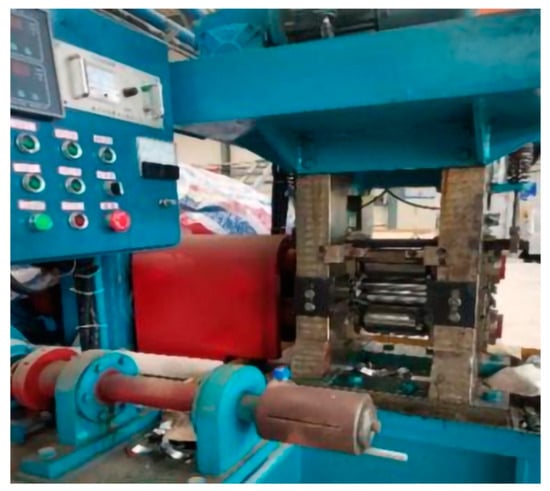
Figure 1.
The rolling mill of aluminum foil.
Here, t0 and t1 represent the initial and final foil thickness, respectively.
To investigate the pinhole formation mechanism induced by flake-shaped Fe2O3 hard particles (near-spherical morphology), controlled rolling experiments were performed on a pilot mill. A constant speed strategy (500 r/min) was implemented to decouple strain rate effects from velocity fluctuations. The aluminum foil was processed through five passes with cumulative reductions of 2%, 38%, 63%, 75%, and 81%. For AlSi10Mg spherical particles, analogous experiments were conducted at 13%, 25%, 50%, and 70% reductions. Post-rolling characterization using a laser scanning confocal microscope (VHX-7000) quantified surface damage and pinhole evolution per deformation cycle.
3. Results
3.1. Source of Foreign Particles
3.1.1. Al Alloy Melt Inclusions
Figure 2 presents the morphological characteristics of melt inclusions and associated pinholes observed via SEM. Two exogenous particles (labeled A and B) located 200 μm from the pinhole were identified in Figure 2a. Particle A measured 55 μm × 83 μm in lateral dimensions. Notably, only particle A exhibited surface protrusion, confirming its complete matrix penetration and pinhole formation. Conversely, particle B remained embedded within the aluminum matrix, as evidenced by Figure 2c,d. All pinholes demonstrated partial matrix coverage along particle/matrix interfaces.
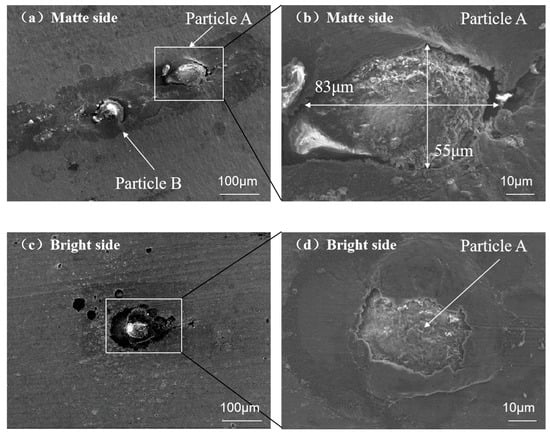
Figure 2.
SEM images illustrating morphological contrast of foreign particles on aluminum foil surfaces: (a,b) matte side at 200× and 2000× magnifications; (c,d) bright side at corresponding magnifications.
Particle A exhibited non-uniform contrast variations (P1–P4) on the matte surface of the aluminum foil, suggesting the heterogeneous distribution of low-Z and high-Z elements within the embedded inclusion. In contrast, identical particle A displayed homogeneous contrast matching the adjacent matrix (P5–P6) on the bright surface (Figure 3b), confirming elemental uniformity at the particle/matrix interface.
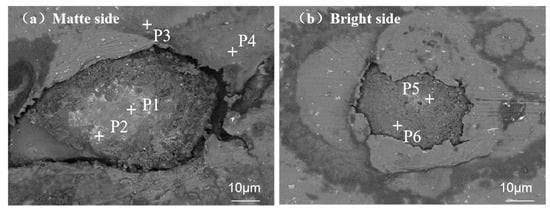
Figure 3.
SEM images contrasting foreign particle morphology on aluminum foil surfaces: (a) matte side at 2000× magnification; (b) bright side at 2000× magnification.
Table 2 presents the energy-dispersive spectroscopy (EDS) analysis results of the aluminum foil and inclusions. The aluminum foil matrix (P3 and P4) primarily consisted of C, O, Al, Fe, Si, and trace elements. Rolling oil contributed to the elemental composition of the matrix in addition to oxygen and aluminum. Foreign particles contained F, Mg, Cl, K, and La. The refining agent was a mixture of chloride and fluoride salts, used for purifying aluminum alloy melts. These elements (F, Mg, Cl, K) are hypothesized to originate from the refining agent. Carbon originated from reactions between carbon anodes and molten aluminum during electrolysis. Oxygen in the alloy melts was present as Al2O3, MgO, or MgAl2O4 (spinel). Lanthanum is likely derived from bauxite ore.
Table 2.
Composition of foreign particle A, wt.%.
Figure 4 demonstrates another pinhole morphology caused by irregular exogenous inclusions. The inclusion measures 61 μm (rolling direction) × 71 μm (transverse direction). Aluminum matrix overburden at particle/matrix interfaces was observed on both matte and bright surfaces. This interfacial characteristic suggests potential contamination from inherent inclusions in the parent material.
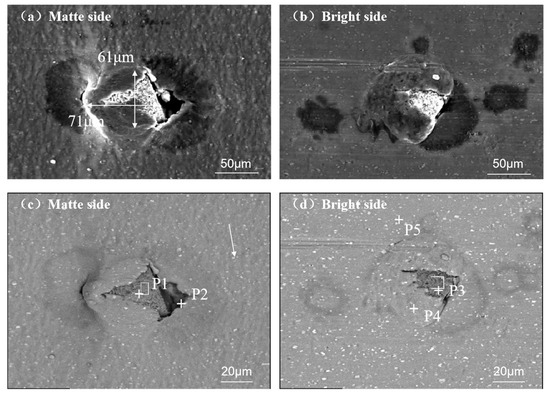
Figure 4.
SEM characterization of irregular foreign particles on aluminum foil surfaces: (a) matte side at 500× magnification—secondary electron (SE) image; (b) bright side at 500× magnification—SE image; (c) matte side at 1000× magnification—backscattered electron (BSE) image; (d) bright side at 1000× magnification—BSE image.
Figure 4 characterizes the morphological features of exogenous inclusions. These inclusions exhibited a comparable grayscale contrast to the Al matrix (uniform gray appearance), suggesting a homogeneous elemental distribution within the particles. Energy-dispersive spectroscopy (EDS) analysis confirmed the white particulate phases (indicated by arrows in Figure 4c) as Al–Fe intermetallic compounds. The secondary-phase particles measured 2–3 μm in diameter, significantly smaller than both primary inclusions and the foil thickness (40 μm). Consequently, these submicron-scale particles lacked a sufficient mechanical driving force to initiate matrix perforation under rolling stresses.
Table 3 demonstrates that the Al matrix at position P5 is predominantly composed of Al and Fe. Inclusions at P1 and P3 comprise multicomponent systems containing Al, O, Si, Mg, Cl, Ti, C, etc. These elemental signatures originate from (1) electrolytic reduction processes (characteristic elements O/C), (2) melt refining fluxes (Cl/K), and (3) grain refiners (Ti). Notably, position P2 demonstrated elevated Ti, Fe, and V concentrations, potentially associated with inherent inclusion transport during refining operations.
Table 3.
Composition of irregula foreign particles, wt.%.
3.1.2. Rolling Oil Filtering Aid
Figure 5 shows the morphological characteristics of pinholes induced by spherical foreign particles. The particles had a diameter of approximately 32 μm and created a groove approximately 250 μm long along the rolling direction. The particles were embedded in the deepest region of the groove. When observed from the bright side, the foreign particles penetrated the aluminum foil, forming pinholes that appeared on the bright surface.
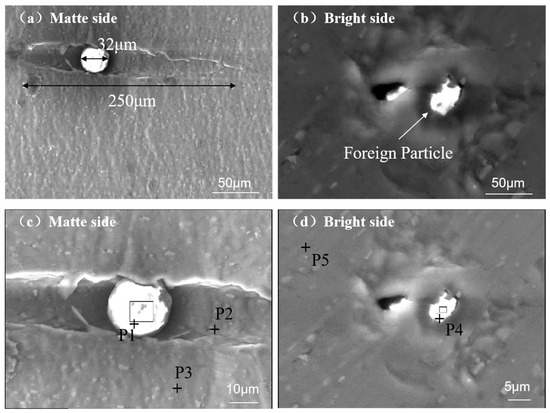
Figure 5.
SEM characterization of spherical foreign particles on aluminum foil surfaces: (a) matte side at 500×—SE; (b) bright side at 500×—SE; (c) matte side at 2000×—BSE; and (d) bright side at 4000×—BSE.
Table 4 illustrates the composition of the aluminum foil with a significant presence of Al and Fe elements, as observed in P2, P3, and P5. The compositions of foreign particles (observed in P1 and P4) contain O, Si, Al, Ca, Na, and Mg, and a small quantity of P, S, and K. Based on the characteristics and main components of the foreign particles, they likely originate from the filter aid. Typically, the filter aid is composed of SiO2 with minor quantities of Al2O3, Fe2O3, CaO, MgO, K2O, Na2O, P2O5, and organic components.
Table 4.
Composition of spherical foreign particles, wt.%.
3.1.3. Dust Particles in the Environment
Figure 6 shows the typical SEM morphological characteristics of pinholes caused by dust particles. On the bright surface of the Al foil, foreign particles that scratched and crushed the matrix are visible. Figure 6b shows a foreign particle protruding from the matte side penetrated the matrix, forming a pinhole.
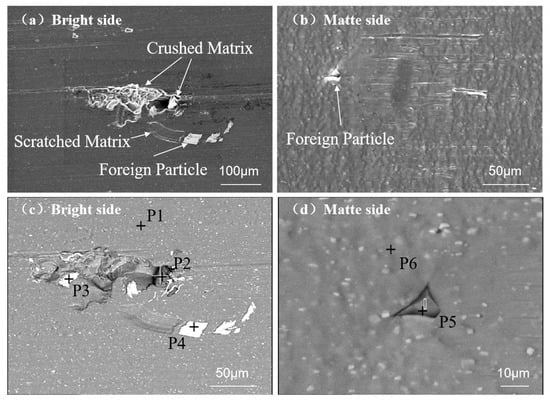
Figure 6.
SEM characterization of dust particles on aluminum foil surfaces: (a) bright side at 200×—SE; (b) matte side at 500×—SE; (c) bright side at 500×—BSE; and (d) matte side at 2000×—BSE.
The foreign particles exhibited polygonal morphologies with acute edges on the bright surface of the aluminum foil (Figure 6c). The particles demonstrated significantly higher brightness contrast compared to the Al matrix. Microscopic examination revealed a singular particle achieving full matrix penetration with emergence on the matte side (Figure 6). The particles displayed a distinct triangular morphology with sharp vertices, whose grayscale intensity corresponded to the matrix. Cross-sectional analysis confirmed particle embedment initiating from the bright surface followed by through-thickness propagation to the matte side.
Table 5 demonstrates that foreign particles are classified into two categories: (1) Fe-Cr-dominant particles (35 μm diameter) at positions P3/P4; (2) Si-O-based particles (10 μm diameter), identified as SiO2 through stoichiometric analysis, at positions P2/P5. Figure 6d demonstrates direct pinhole initiation by SiO2 particles, attributable to their inherent brittleness and high hardness. Surface contact during foil production enables these particles to scratch or fracture the matrix, ultimately generating pinholes.
Table 5.
Composition of dust particles in the environment, wt.%.
Fe-Cr particles at P3/P4 primarily bond with the Al matrix via mechanical interlocking rather than chemical interactions. While these particles create localized surface defects, their ductile nature and stress dissipation capability mitigate stress concentration, effectively suppressing pinhole initiation. Conversely, brittle SiO2 particles (P2/P5) exhibit preferential matrix penetration under applied stresses due to elevated hardness, directly generating pinholes. Cross-sectional EDS mapping and lamellar microstructure analysis revealed no Fe-Cr particles in pinhole-affected zones, confirming their limited contribution to perforation failure.
3.2. Evolution Model of Pinhole
3.2.1. Evolution Law of Pinhole
Figure 7a shows an elliptical micro-pinhole (site A) in the aluminum foil prior to deformation, with a major axis of ~0.28 mm and minor axis of ~0.27 mm (area ~0.06 mm2). Figure 7f displays a macro-pinhole (site B) with a major axis of ~0.32 mm and minor axis of ~0.31 mm (area ~0.08 mm2). The morphological evolution during four-pass rolling is shown in Figure 7b–e,g–j, revealing the following sequence: annular → elliptical → crack propagation → pinhole closure.
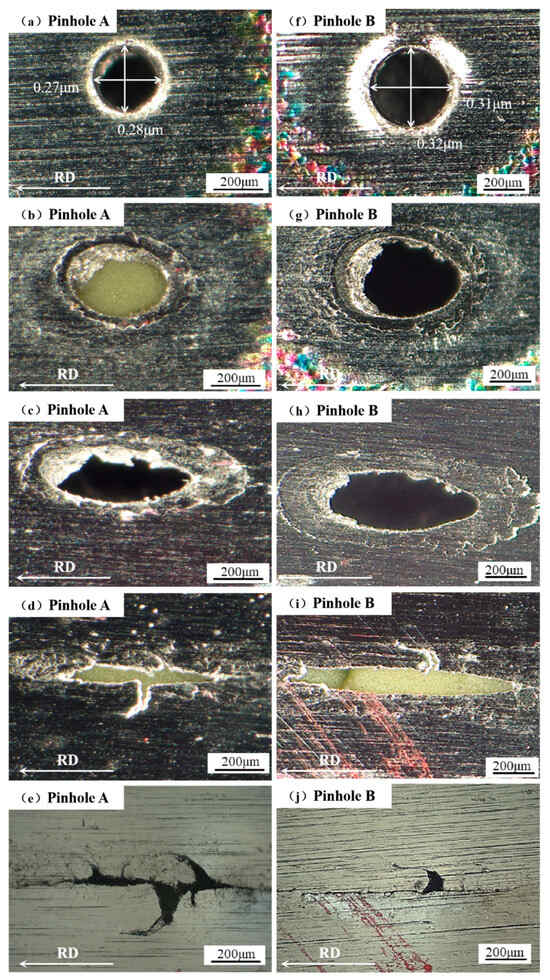
Figure 7.
Morphology evolution of the pinhole under the different cumulative reduction ratios (a,f) 0%, (b,g) 16%, (c,h) 51%, (d,i) 78%, and (e,j) 83%.
Prior studies [12,13,14,15] suggest that higher rolling reductions and thinner gauges induce elevated tensile stresses at pinhole peripheries, aggravating edge cracking susceptibility. This work reveals identical evolutionary behavior between different-sized pinholes (Micro-A/Macro-B): at a 16% cumulative reduction, pinholes exhibit <5% longitudinal elongation with negligible transverse deformation; beyond a 50% reduction, pronounced longitudinal extension occurs (Figure 7c,h); after three passes (78% reduction), pinholes evolve into ribbon morphologies with edge microcrack initiation (Figure 7d,i), indicating a localized stress surpassing the matrix bearing capacity; at an 83% reduction, transverse healing accompanies accelerated crack propagation. Through Abaqus stress-field simulations, Yan Y.X. et al. [16,17,18] demonstrated that edge tensile stresses scale positively with reduction ratios and thinner foils under equivalent reductions develop steeper edge-center compressive stress gradients, promoting crack nucleation. Crack initiation observed at a 54% reduction during third-pass rolling aligns with these theoretical predictions.
The shape factor—defined as the ratio of the rolling-direction-parallel major axis to the transverse minor axis—was utilized to quantify the pinhole morphological evolution (Figure 8). The results indicate a sharp rise in the shape factor when the cumulative reduction surpassed 50%, accompanied by a lateral contraction at pinhole peripheries and an elliptical-to-crack morphological transition.
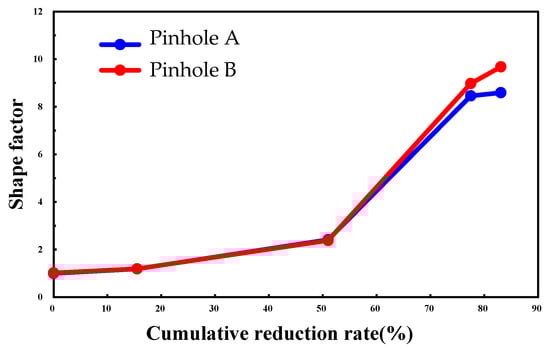
Figure 8.
The change in pinhole shape factor with the cumulative reduction ratio.
3.2.2. Evolution Model of Pinhole Based on Cold Rolling Reduction
Figure 7 demonstrates the pinhole’s expansion–contraction evolution during rolling. The quantitative correlation between rolling parameters and pinhole geometry was established through dimensional measurements after each rolling pass. Assuming elliptical geometries, Table 6 documents the dimensional progression of four pre-engineered pinholes under varying cumulative reductions.
Table 6.
Evolution of pinhole size.
Column Pass 0 denotes pre-rolling geometrical parameters of the engineered pinholes (Table 6). The cumulative reduction ratio is calculated using Equation (2):
where ηc—cumulative reduction ratio (%); hi—thickness at i-th pass (μm); and h0—initial thickness (μm). In the rolling simulation of pinhole evolution, the pinhole area first increases and then decreases with increasing rolling reduction. The peak area occurs at ~50% reduction and subsequently diminishes. At 80% reduction (Figure 7), the lateral closure of pinholes is nearly achieved. Identical evolutionary patterns are observed across varying initial pinhole sizes. The dataset in Figure 9 is fitted by the following:
where Si is the initial pinhole area (μm2), S0 is the initial area of the pinhole, and A and B are material constants. A quadratic polynomial was employed to fit the measured pinhole areas listed in Table 6, as depicted by the dashed curve in Figure 9. Dimensionless coefficients A and B were derived for each quadratic polynomial through normalization relative to Si. In Equation (3), the averaged coefficients A and B from the four quadratic polynomials corresponding to the original pinholes were determined as 2439 and −33.13, respectively.
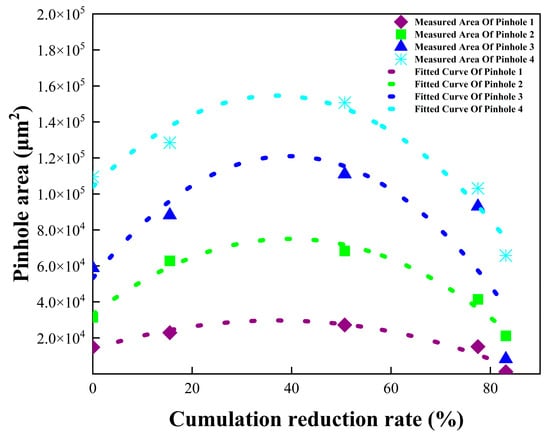
Figure 9.
Relationship between pinhole area and reduction ratio.
To study the applicability of the above model, rolling experiments were conducted in the laboratory after prefabricating pinholes of different sizes. The variations in the pinhole area are shown in Table 7. The results reveal that the pinhole area calculated by Equation (3) can accurately predict the changes in the actual pinhole area, with discrepancies primarily coming from changes in forward and backward tension, lubrication conditions, as well as measurement deviation in pinhole size.
Table 7.
Predicted pinhole area.
In reality, the rolling of aluminum foil is a complex plastic deformation process. The reduction ratio, tension, friction coefficient, roll diameter, and other factors affect the rheological behavior of the material in the rolling deformation zone. Numerous studies have shown that the reduction ratio and tension play an important role in the propagation and healing of surface cracks on rolled parts compared to other process parameters [19,20]. Therefore, this study chose to focus on the reduction ratio as the key variable for pinhole evolution to construct a pinhole evolution model. Due to idealized simplifications during the model construction process, errors inevitably exist between the predicted results and the actual outcomes.
4. Discussion
4.1. Formation Mechanism of Pinhole
4.1.1. Pinholes Induced by Irregular Shape Particles
Figure 10 illustrates the evolution of hard iron oxide particles under different reduction ratios. A hard foreign particle measuring approximately 461 μm × 435 μm was observed in the aluminum foil matrix after a 2% reduction ratio, as shown in Figure 10a. With an increasing reduction ratio, the foreign particle was elongated along the rolling direction, with its longitudinal dimension increasing from 461 μm through 788 μm and 1300 μm to 1757 μm. However, the particle dimensions in the vertical rolling direction remained relatively stable. When the aluminum foil reduction ratio was increased from 38% to 75%, the lateral dimensions of foreign particles exhibited minor fluctuations, recording 450 μm, 500 μm, and 480 μm in Figure 10b,d.
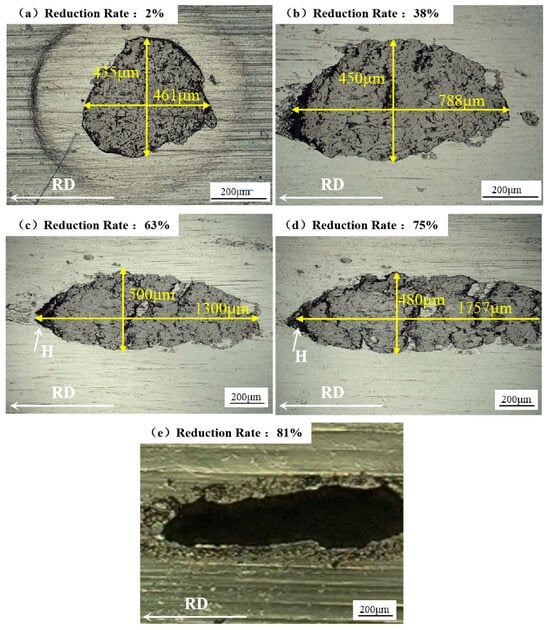
Figure 10.
Pinholes induced by Fe2O3 particles under the different cumulative reduction ratios: (a) 2%, (b) 38%, (c) 63%, (d) 75%, and (e) 81%.
When the reduction ratio reached 81%, the aluminum foil thickness decreased to 15 μm, with foreign particles evolving into a macroscopic cavity, as shown in Figure 10e. At a cumulative reduction ratio of 75%, a translucent pinhole appeared in Figure 10d, located on the rolling mill’s exit side during successive rolling passes (arrow-indicated). In Figure 10b,d, when the cumulative reduction ratio exceeded 38%, interfacial decohesion was initiated between the aluminum matrix and foreign particles along the rolling direction, while surrounding regions maintained intimate bonding. Progressive damage accumulation led to the gradual formation of a translucent pinhole at location H.
4.1.2. Pinhole Induced by Spherical Particle
During rolling deformation, the volume conservation of aluminum foil is governed by the constant-volume principle, expressed as follows:
where l0, b0, and t0, respectively, represent the length, width, and thickness of foil before rolling, μm, and l1, b1, and t1, respectively, represent the length, width, and thickness of aluminum foil after rolling, μm. Due to in the rolling process of aluminum foil, it is generally accepted that the width direction was unchanged, which conforms to the plane strain condition. Therefore, the above formula can be simplified as follows:
Consequently, the extension ratio of the aluminum foil represented by δ1 can be calculated as follows:
Figure 11 illustrates the damage evolution in aluminum foil caused by spherical hard foreign particles composed of the AlSi10Mg alloy. The foreign particle initially measured 45 μm in diameter. At reduction ratios below 25%, the particle remained fully embedded in the host matrix with complete interfacial bonding and no detectable gaps (Figure 11a,b). With an increasing reduction ratio, interfacial delamination was initiated at the particle/matrix interface (arrow-indicated in Figure 11c,d), specifically within the forward slip zone characteristic of rolling deformation.
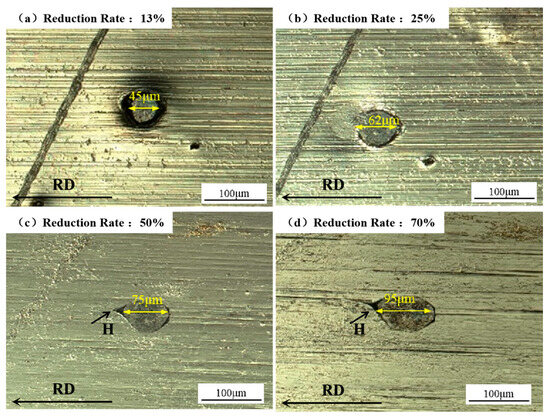
Figure 11.
Evolution of pinholes induced by AlSi10Mg particles in the same aluminum foil specimen under increasing cumulative rolling reduction ratios: (a) 13%, (b) 25%, (c) 50%, and (d) 70%.
Figure 11 illustrates the plastic deformation behavior of spherical particles. In contrast to the fractured flaky particles observed in Figure 10, spherical particles exhibited a coordinated plastic flow along the rolling direction while maintaining structural integrity. The plastic compatibility between aluminum foil and foreign particles was quantified through strain analysis in the rolling direction, defined as follows:
where h0 and h1 represent the particle dimensions (μm) parallel to the rolling direction before and after deformation, respectively.
The extension ratios of aluminum foil and foreign particles were calculated using Equations (6) and (7) in Table 8. As summarized in Table 8, the aluminum foil exhibited extension ratios of 5.3% and 35.7% during the first and second rolling passes, respectively, marginally lower than those of foreign particles (7.1% and 37.8%, respectively). However, in the third and fourth passes, the aluminum foil’s extension ratios surpassed those of foreign particles. This discrepancy arose primarily from deformation incompatibility between the aluminum matrix and foreign particles. Beyond the aforementioned forward slip effect, the foreign particles’ plastic deformation deviated from plane strain conditions, resulting in elongation not only along the rolling direction but also in the thickness direction. The progressive accumulation of aluminum foil reduction aggravated the particle/matrix coordination loss, ultimately inducing pinhole formation.
Table 8.
Comparison of the extension of aluminum foil matrix and foreign particle.
4.1.3. Formation Mechanism of Pinhole Induced by Foreign Particles
When aluminum foil was rolled, the forward slip formula can be expressed as follows [21,22]:
where Sh is the forward slip (mm), γ is the neutral angle (°), D is the work roll diameter (mm), and h is the exit-side plate thickness (mm). The forward slip of aluminum foil was calculated via Equation (8), with results tabulated in Table 9. Table 9 demonstrates that the forward slip increased during the second rolling pass, attaining a maximum value of 4.44% by the fourth pass. The derivation of Equation (8) omitted rolling tension effects. Experimentally, the forward slip magnitude exhibited a positive correlation with rolling pass count. Consequently, under idealized conditions, the forward slip was progressively amplified, as shown in Table 9.
Table 9.
Amount of forward slip of aluminum foil.
The presence of hard foreign particles induced incompatible plastic deformation in the aluminum matrix, leading to progressive interfacial decohesion at the rolling mill’s exit side (as shown in Figure 10b). This deformation mismatch resulted in a forward slip value of 1.41%.
The interaction between hard foreign particles and the aluminum matrix induced deformation incompatibility, manifested as interfacial decohesion at the rolling mill exit (location H in Figure 11) under forward slip conditions (1.41%). The progressive accumulation of the forward slip-amplified particle/matrix separation culminated in translucent pinhole formation during the fourth rolling pass. Subsequent rolling (fifth pass) resulted in particle detachment and large-sized holes.
4.2. Pinhole Improvement Measures and Effects
Foreign objects that induce pinhole defects primarily consist of inclusions originating from the melting and casting process, particles from filter aids used in rolling oils, and dust particles emanating from the surrounding environment. To address these issues, several targeted measures can be implemented, such as enhancing the purity of the aluminum melt, advancing the filtration systems for rolling oils, and physically sealing the aluminum foil rolling mill to curtail the proliferation of various extraneous particles [23].
The enhancement of melt purification filters significantly improves the metallurgical quality of aluminum melts. The implementation of a dual-stage filtration system (replacing conventional single-stage foam ceramic filters) reduces the pinhole density from 70 to <18 defects/104 m2. Post-optimization through system upgrades, pinhole occurrence is further suppressed to <1 defect/104 m2.
The enhancement of the rolling oil filtration system can be achieved by optimizing the composition of the filter media, specifically by adjusting the ratio of diatomite to bleaching earth, as shown in Figure 12 [24]. Studies have demonstrated that increasing the proportion of bleaching earth effectively removes particles below 1 μm from the rolling oil, thereby enhancing its transparency. It is important to note that there is an optimal point in increasing the transparency of rolling oil by adding more bleaching earth. This research indicates that when the proportion of bleaching earth reaches approximately 20%, the transparency of the rolling oil is maximized. By fine-tuning the ratio of diatomite to bleaching earth to 4:1, the transparency of the rolling oil can be significantly improved from 82% to over 95%. Furthermore, upgrading the filter cloth specification from 90 g/m2 to 110 g/m2 not only increases the density and load-bearing capacity but also reduces the pore size of the filter cloth from approximately 20 μm to 10 μm, which contributes to a more efficient filtration process.
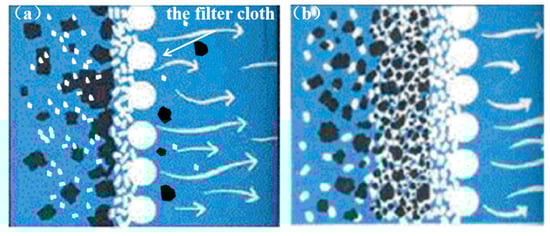
Figure 12.
Impact of filter cloth specifications: (a) low weight (90 g/m2); (b) high weight (110 g/m2).
The physical enclosure of roughing and finishing mills in aluminum foil rolling processes effectively mitigates environmental dust-induced pinhole defects. Following the implementation of enhancement strategies, an 8-month longitudinal study tracked the pinhole evolution (Figure 13). The initial pinhole density measured 6 defects/104 m2, exceeding the premium-grade benchmark (≤1 defect/104 m2). Post-intervention, the pinhole rate progressively declined, achieving compliance with advanced specifications by the fourth month.
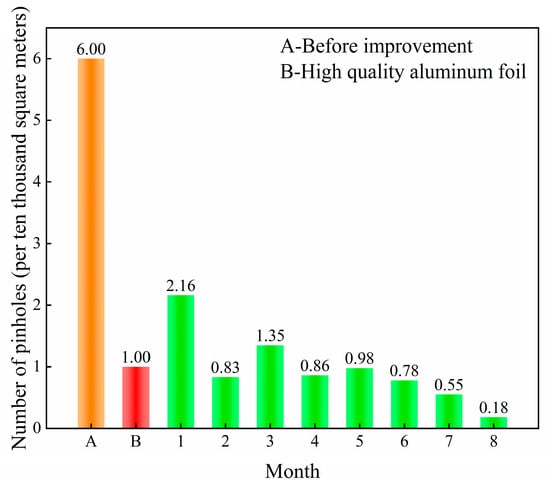
Figure 13.
The change in pinhole ratio of aluminum foil.
5. Conclusions
This study systematically investigated pinhole generation mechanisms through the morphological and compositional analysis of associated foreign particles. Simulated rolling experiments revealed the dynamic evolution of pinhole morphology and underlying formation processes. Through industrial-scale validation, the following conclusions were derived:
- (1)
- Foreign particles induce the aluminum foil pinholes during the production process. These particles originate from various sources, including the melting and casting process, rolling oil filtration aid, and production environment. The improvement directions for reducing foreign particles have been clarified, such as strengthening aluminum alloy melt filtration, upgrading the rolling oil filtration system, and cleaning the environment.
- (2)
- The evolution of pinhole morphology follows a specific pattern. When the cumulative rolling reduction exceeds 50%, the shape factor of the pinhole rapidly increases. The edges of the pinhole in the vertical rolling direction swiftly approach each other, transitioning from an oval shape to a crack shape and gradually healing.
- (3)
- A quantitative relationship model that links the pinhole area and reduction ratio was developed, which can roughly predict the change in the actual pinhole area and meet the requirements for engineering applications to guide the production of high-quality aluminum foil.
- (4)
- The formation mechanism of pinholes is attributed to the uncoordinated deformation between foreign particles and the matrix. During the rolling process, hard foreign particles gradually embed into the matrix to cause damage. As the reduction ratio increases to 38%, the interface between the foreign particles in the forward slip zone and the matrix separates, ultimately resulting in the formation of pinholes.
Based on understanding the formation mechanism and evolution law of pinholes in aluminum foil, this study has successfully mastered the key technology for producing high-barrier aluminum foil for lithium-ion battery soft packaging. Therefore, this research plays a role in engineering applications and has theoretical guiding significance.
Author Contributions
Conceptualization, W.C.; methodology, W.C.; validation, C.X.; formal analysis, Y.X.; investigation, R.N.; resources, W.C.; data curation, Y.C.; writing—original draft preparation, K.Z.; writing—review and editing, Z.F.; visualization, K.Z.; supervision, H.W.; project administration, H.W.; funding acquisition, X.C. All authors have read and agreed to the published version of the manuscript.
Funding
This research received no external funding.
Institutional Review Board Statement
Not applicable.
Informed Consent Statement
Not applicable.
Data Availability Statement
The original contributions presented in this study are included in the article. Further inquiries can be directed to the corresponding author.
Acknowledgments
This work are grateful to the Technology Foundation of Chinalco for supporting this work.
Conflicts of Interest
Authors Kai Zhang, Wei Chen, Yunan Chen and Yinhui Xu were employed by Chinalco Materials Application Research Institute Co., Ltd. The remaining authors declare that the research was conducted in the absence of any commercial or financial relationships that could be construed as a potential conflict of interest.
References
- Huang, Z.; Luo, P.F. Constructing one-dimensional mesoporous carbon nanofibers loaded with NaTi2(PO4)3 nanodots as novel anodes for sodium energy storage. J. Phys. Chem. Solids 2022, 161, 110479. [Google Scholar] [CrossRef]
- Mueller, K.; Schoenweitz, C. Thin Laminate Films for Barrier Packaging Application-Influence of Down Gauging and Substrate Surface Properties on the Permeation Properties. Packag. Technol. Sci. 2012, 25, 137–148. [Google Scholar] [CrossRef]
- Wang, D.Y.; Wang, X.X. Molecular level manipulation of charge density for solid-liquid TENG system by proton irradiation. J. Nano Energy 2022, 103, 107819. [Google Scholar] [CrossRef]
- Wang, M.; Jiang, C.L. Reversible calcium alloying enables a practical room-temperature rechargeable calcium-ion battery with a high discharge voltage. Nat. Chem. 2018, 10, 667–672. [Google Scholar] [CrossRef]
- Guo, Z.; Fan, Y. Heat seal properties of polymer–aluminum–polymer composite films for application in pouch lithium-ion battery. RSC Adv. 2016, 6, 8971–8979. [Google Scholar] [CrossRef]
- Tetsuya, T.; Ishiaku, U.S. The effect of heat sealing temperature on the properties of OPP/CPP heat seal. I. Mechanical properties. J. Appl. Polym. Sci. 2005, 97, 753–760. [Google Scholar] [CrossRef]
- Raabe, D.; Ponge, D. Making sustainable aluminum by recycling scrap: The science of “dirty” alloys. Prog. Mater. Sci. 2022, 128, 100947. [Google Scholar] [CrossRef]
- Chen, D.B.; Shi, W.L.; Hou, Z.W.; Shen, J.G. Causes of the pinhole defects in aluminum foil and prevention measures. Light Alloy Fabr. Technol. 2023, 45, 001. [Google Scholar] [CrossRef]
- Keles, O.M. Aluminum foil: Its typical quality problems and their causes. J. Mater. Process. Technol. 2007, 186, 125–137. [Google Scholar] [CrossRef]
- Li, H.; Ren, S. Measures on reducing pinhole rate of double rolling aluminum foil being produced with continuous cast stock. Light Alloy Fabr. Technol. 2012, 40, 27–30. [Google Scholar] [CrossRef]
- Cai, H.; Ren, J. Discussion about Reducing Needle Pore Defect of Double Zero Aluminium Foil. Light Alloy Fabr. Technol. 2003, 31, 001. [Google Scholar] [CrossRef]
- Huang, Y.; Xiao, B. Effect of tension on edge crack of on-line heating rolled AZ31B magnesium alloy sheet. J. Mater. Res. Technol. 2020, 9, 1988–1997. [Google Scholar] [CrossRef]
- Huang, Z.; Qi, C. Edge crack damage analysis of AZ31 magnesium alloy hot-rolled plate improved by vertical roll pre-rolling. J. Magnes. Alloys 2023, 11, 2151–2164. [Google Scholar] [CrossRef]
- Manabe, S.; Utsunomiya, H. Morphology of Edge Cracks of Rolled Magnesium Alloy Sheet. Adv. Mater. Res. 2014, 922, 469–474. [Google Scholar] [CrossRef]
- Pérez, M.T. Microstructural evolution during large strain hot rolling of an AM60 Mg alloy. Scr. Mater. 2004, 50, 661–665. [Google Scholar] [CrossRef]
- Yan, Y.; Sun, Q. The initiation and propagation of edge cracks of silicon steel during tandem cold rolling process based on the Gurson–Tvergaard–Needleman damage model. J. Mater. Process. Technol. 2013, 213, 598–605. [Google Scholar] [CrossRef]
- Zhang, D.F.; Dai, Q.W. Prediction of edge cracks and plastic-damage analysis of Mg alloy sheet in rolling. Trans. Nonferr. Met. Soc. China 2011, 21, 1112–1117. [Google Scholar] [CrossRef]
- Ben, S.L.; Allouch, M. Numerical Formulation of Anisotropic Elastoplastic Behavior Coupled with Damage Model in Forming Processes. Mathematics 2022, 11, 204. [Google Scholar] [CrossRef]
- Chen, D.C. Rigid-plastic finite element analysis of plastic deformation of porous metal sheets containing internal void defects. J. Mater. Process. Technol. 2006, 180, 193–200. [Google Scholar] [CrossRef]
- Wang, B.; Zhang, J. Analysis of the evolution behavior of voids during the hot rolling process of medium plates. J. Mater. Process. Technol. 2015, 221, 121–127. [Google Scholar] [CrossRef]
- Dong, Y.G.; Zhang, W.Z. Determination of Forward Slip Coefficient During Heavy Rail Rolling Using Universal Mill. J. Iron Steel Res. Int. 2008, 15, 32–38. [Google Scholar] [CrossRef]
- Hu, X.L.; Jiao, Z.J. Forward and Backward Slip Models in MAS Rolling Process and Its On-Line Application. J. Iron Steel Res. Int. 2007, 14, 15–19. [Google Scholar] [CrossRef]
- Voigt, C.; Jäckel, E.; Taina, F.; Zienert, T.; Salomon, A.; Wolf, G.; Aneziris, C.G.; Le Brun, P. Filtration Efficiency of Functionalized Ceramic Foam Filters for Aluminum Melt Filtration. Metall Mater Trans. B 2017, 48, 497–505. [Google Scholar] [CrossRef]
- Damoah, L.N.W.; Zhang, L. Removal of Inclusions from Aluminum Through Filtration. Metall Mater Trans. B 2010, 41, 886–907. [Google Scholar] [CrossRef]
Disclaimer/Publisher’s Note: The statements, opinions and data contained in all publications are solely those of the individual author(s) and contributor(s) and not of MDPI and/or the editor(s). MDPI and/or the editor(s) disclaim responsibility for any injury to people or property resulting from any ideas, methods, instructions or products referred to in the content. |
© 2025 by the authors. Licensee MDPI, Basel, Switzerland. This article is an open access article distributed under the terms and conditions of the Creative Commons Attribution (CC BY) license (https://creativecommons.org/licenses/by/4.0/).