Article

Study on the Embrittlement of Steel Grain Boundaries Caused by Penetration and Diffusion of Liquid Copper

1
School of Materials Science and Engineering, Shanghai Institute of Technology, Shanghai 201418, China
2
Research Institute, Baoshan Iron & Steel Co., Ltd., Shanghai 201900, China
*
Authors to whom correspondence should be addressed.
Coatings 2025, 15(4), 408; https://doi.org/10.3390/coatings15040408
Submission received: 6 February 2025 / Revised: 24 March 2025 / Accepted: 26 March 2025 / Published: 29 March 2025
(This article belongs to the Special Issue Advancement in Heat Treatment and Surface Modification for Metals)

Abstract

:
This paper investigated and experimentally analyzed the penetration behavior of liquid copper along austenite grain boundaries (GBs) at high temperatures. The microstructure of the liquid copper channel network along GBs and triple junctions (TJs), as well as the TJ wetting, was observed and interpreted through diffusion-controlled premelted GB formation. The concentration distribution results along GBs show that copper diffusion in both the near-surface premelted GBs and the non-surface-layer solid-state GBs conform to the diffusion equation, though the diffusion coefficients differ by approximately one order of magnitude. However, the copper concentration at premelted GBs cannot be fully described by an error solution. Using a modified diffusion equation when considering the concentration dependence of the GB diffusion coefficient provides a more accurate description, aligning better with experimental characteristics. Electron backscatter diffraction measurements indicate that the copper orientation at premelted GBs remains consistent with that of surface copper coating, whereas that at solid-state GBs undergoes significant changes. This finding is consistent with the argument that the corresponding material states at premelted GBs are different from those at solid-state GBs, thus providing experimental evidence for the diffusion equation solutions presented above. It provides a theoretical reference for understanding and preventing liquid metal embrittlement.

1. Introduction

Liquid metal embrittlement (LME) refers to the phenomenon where the mechanical properties of materials degrade upon contact with a liquid metal, which is commonly manifested as a loss of plasticity, a decrease in tensile strength, reduced ductility, and a lower fracture toughness [1,2,3,4]. In the case of LME, the molten metal readily penetrates grain boundaries (GBs), increasing their susceptibility to separation and flow, which leads to sudden brittle intergranular fracture at abnormally low stress levels [5,6].
Over a century ago, Johnson [7] had already observed the LME phenomenon, though he lacked an understanding of the mechanisms behind this observation. In early study on LME, W. Rostoker [8] observed that only certain liquid–solid couples cause the solid metal embrittlement at the liquid metal melting point, which becomes less severe as the temperature further increases. HS. Rawdon and A.P. Reynolds [9,10] described failures caused by cracking at the liquid-solid interface, which occurred both intergranularly and transgranularly. However, despite numerous studies over the decades attempting to explain LME, no comprehensive mechanisms have been developed to fully describe the observed behavior. In recent years, researchers have made some progress in studying the mechanisms of LME from various perspectives, such as the atomic scale, and crystal scale, etc. Boris Straumal et al. [11] reported that GBs can be wetted by a second liquid phase. In the case of complete GB wetting, the second liquid phase is formed in the GB continuous layers between the matrix grains. The formation of equilibrium liquidlike GB structures near the melting point Tm, referred to as GB premelting, is associated with LME. Schweinfest [12] et al. studied the effect of atomic size difference on the LME coupling of Cu–Bi. The first principles of quantum mechanical calculations showed that the presence of over-sized Bi atoms (embrittler) increased the Cu–Cu bond length at GBs, which weakened the atomic bonding and reduced the cohesion of GBs, leading to embrittlement. M.H. Razmpoosh et al. [13] investigated the micro-events of intergranular LME crack paths at the atomic scale. They described how the stress-assisted diffusion of brittle atoms prior to LME crack propagation leaded to GB decohesion, then to liquid metal flowing into the fracture path, which supplies fresh liquid embrittler to the advancing GBs. Atomic probe tomography (APT) experiments were also used to validate the recently proposed hypothesis of embrittler-induced charge density alteration as a viable LME mechanism. Heeseung Kang et al. [14] investigated the LME behavior of galvanized twinning-induced plasticity (TWIP) steel during high-temperature deformation. They pointed out that zinc penetration along TWIP steel GBs is characterized by GB wetting and intergranular solid-state diffusion of zinc along GBs. Two models for the LME of galvanized TWIP steel were proposed: (1) the Zn-rich (Fe,Mn) alloy GB percolation model, where zinc penetration was controlled by Zn-rich (Fe,Mn) alloy percolation along GBs, and (2) the solid-state rapid GB diffusion model, where zinc penetration was controlled by the rapid stress-assisted solid-state zinc GBs diffusion. A. A. Novikov et al. [15] used the experimental observation in situ technique of Bi penetration through the Cu plate to study the liquid bismuth network formed along GBs and TJs in polycrystalline copper samples. They assumed that the limiting step of the penetration is a diffusion process with an effective diffusion coefficient D*. The temperature dependence of the liquid bismuth average penetration rate along copper GBs was determined. References [16,17,18] suggested that the embrittlement temperature of liquid copper is related to the dihedral angles between the solid and liquid phases. The dihedral angle between liquid copper and the austenite GBs is a minimum at the melting point of copper, leading to maximum wetting of the steel surface (including GBs) and more pronounced embrittlement of liquid copper. T. Ishida [19] declared that when liquid copper was in contact with iron, the molten metal diffusion along GBs and the alloying reactions at the liquid–solid interface reduced the surface free energy. This facilitates the GB wetting by liquid copper, promoting its deep penetration into the iron GBs. H. Fredriksson et al. [20] proposed that the Kirkendall effect was responsible for vacancies diffusion to interfaces and GBs. Vacancies were theorized to condense at the GB followed by liquid in-flow. Therefore, the driving force for liquid copper penetration along GBs is the condensation of vacancies and the surface/interface free energy change. Assuming that the liquid copper penetration depth was perpendicular to the examined surface, a theoretical model describing the penetration rate was derived. However, there was an uncertainty that existed both in the calculated data and the measured ones.
However, current research on LME still faces urgent issues to be addressed, such as unreliable key parameters results, unclear theoretical models, and the absence of quantitative evaluation criteria. This study explains the characteristics and mechanisms of liquid copper penetrating along steel GBs at high temperatures from the perspective of diffusion-controlled premelted GB formation. Based on the diffusion equation, it quantitatively investigates the liquid copper penetration and diffusion along austenite GBs. The study aims to propose a mathematical model that can more accurately describe the liquid copper diffusion along austenite GBs through experimental and theoretical analysis. Accordingly, this paper designed a vacuum heat treatment experiment using a copper-plated layer on the surface of a carbon steel sample as the diffusion source to construct Fe-Cu solid-liquid metal couples for investigation.and studied the construction of Fe-Cu solid–liquid metal couples. Under specific conditions, the liquid copper diffusion induces the surface grain layer premeting, with a rapid decrease in the copper concentration and the width of the premelted GBs along the GBs [21,22]. Energy dispersive spectroscopy (EDS) was employed to measure the copper concentration along the GBs in the penetration–diffusion region, and a diffusion theoretical analysis was conducted. Furthermore, a more precise quantitative description of the liquid copper penetration in the near-surface premelted GBs can be achieved by employing a modified diffusion equation with taking into account the concentration dependence of the GB diffusion coefficient. Additionally, an experimental feature of premelted GBs is the appearance of the TJ wetting, commonly referred to as liquid penetration in engineering [23], which was also discussed through the solution of the modified diffusion equation. This study provides a theoretical reference for understanding and preventing the embrittlement phenomenon of liquid metals.

2. Experimental Materials and Methods

2.1. Experimental Materials

The low carbon steel selected in this study was Q355 steel. The chemical composition is shown in Table 1.

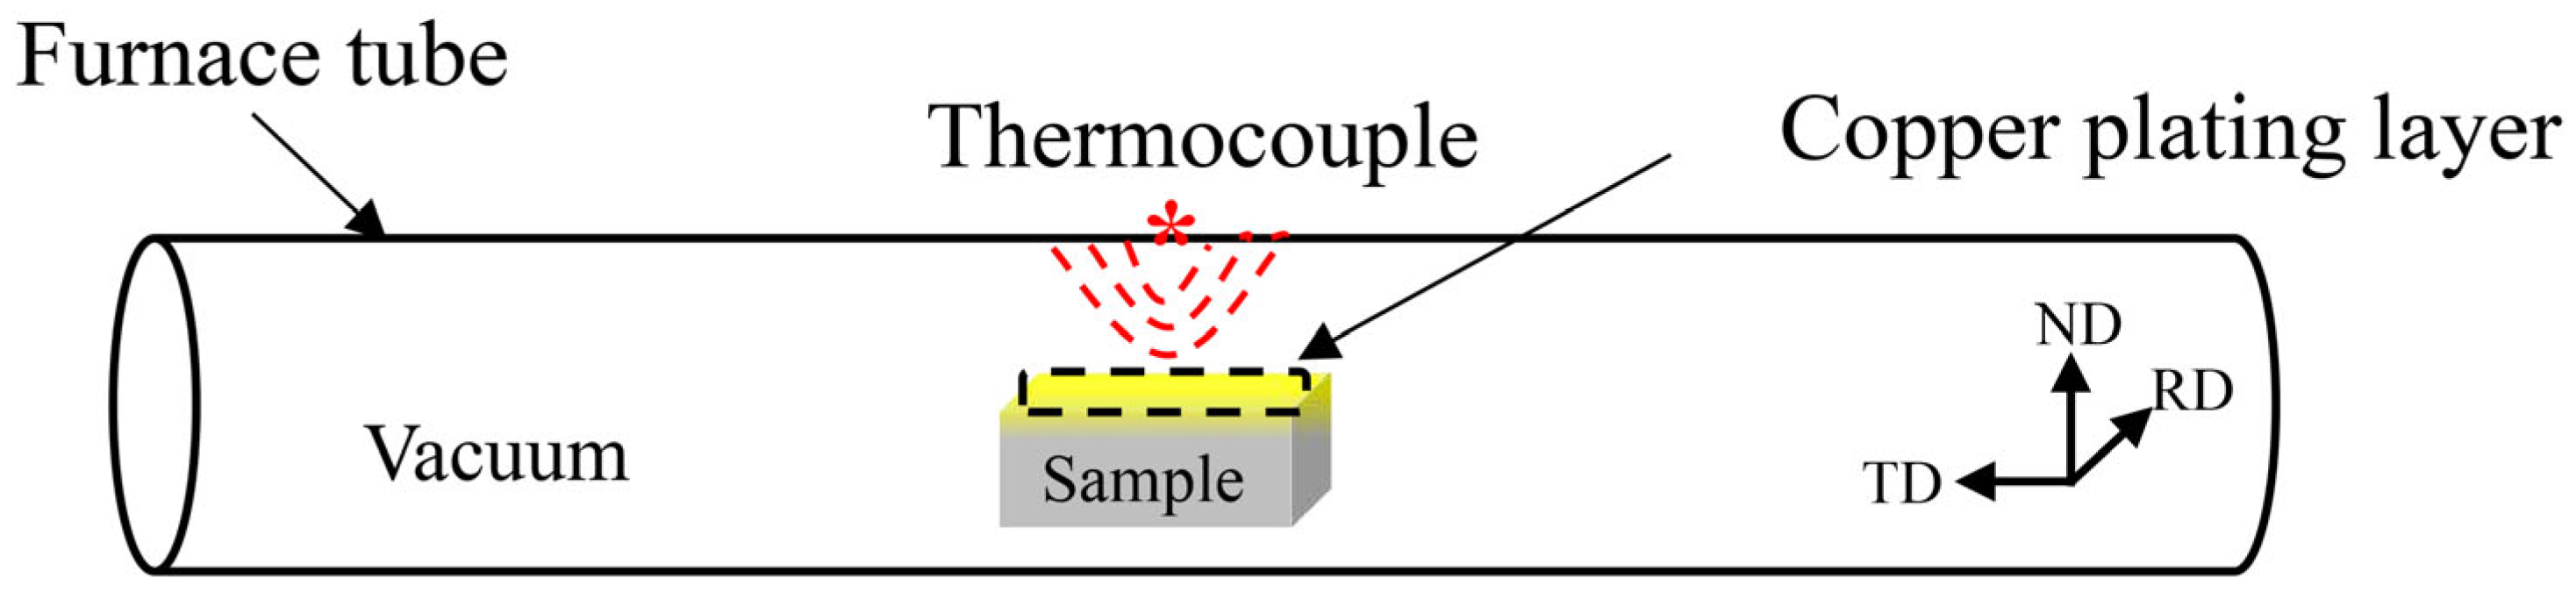
2.2. Experimental Method

The Fe–Cu alloy investigated in this study was produced by electroplating, employing saturated CuSO4 as the electrolyte. The electroplating is a proprietary process. Pure copper and low-carbon steel served as the electrodes, with a 6 V voltage applied across the sample and electrodes for 180 s. Following electroplating, the sample surface was rinsed with acetone and ethanol. Subsequently, specimens measuring 10 × 10 × 10 mm were sectioned using a cutting machine, prior to heat treatment.
As shown in Figure 1, the heat treatments were conducted in a precisely controllable cooling rate vacuum tube furnace (GSL-1500X, Hefei Kejing Material Technology Co., Ltd., Hefei, China). After evacuating to below 1 Pa using a two-stage rotary vane vacuum pump, the heat treatment was performed. The samples were heated to 1200 °C at a rate of 0.16 °C/s and held for 10, 30, and 100 min. Following the heat retention period, the samples were immediately removed and water-cooled. After heat treatment, the samples were uniformly split into two parts along their height. Standard procedures were used to prepare metallographic samples, which were mechanically ground and polished to a 0.25 μm diamond finish. Samples for morphological analysis were etched using a 4% nitric acid alcohol solution. The preparation of samples for electron backscatter diffraction (EBSD) analysis mirrored the metallographic preparation, culminating in 12 h of vibration polishing in an oxide polishing suspension (OPS) to eliminate any micro-scratches or surface stress from the preceding mechanical polishing.
Optical microscope (OM) and scanning electron microscope (SEM Sigma-300, ZEISS, GER, Jena, Germany) were used to observe the microstructure of the cross section of the sample. An EDS detector enabled us to examine the concentration distribution of copper along GBs in the copper-penetrated and diffusion region. Additionally, EBSD data acquisition was performed by Oxford Instruments Aztec and AztecCrystal (5.2) software, respectively, at the step size of 0.15 μm and an accelerating voltage of 20 kV. The collected EBSD data were used to post-process crystal orientations along the steel GBs in the copper-penetrated and diffusion area.

3. Results and Discussion

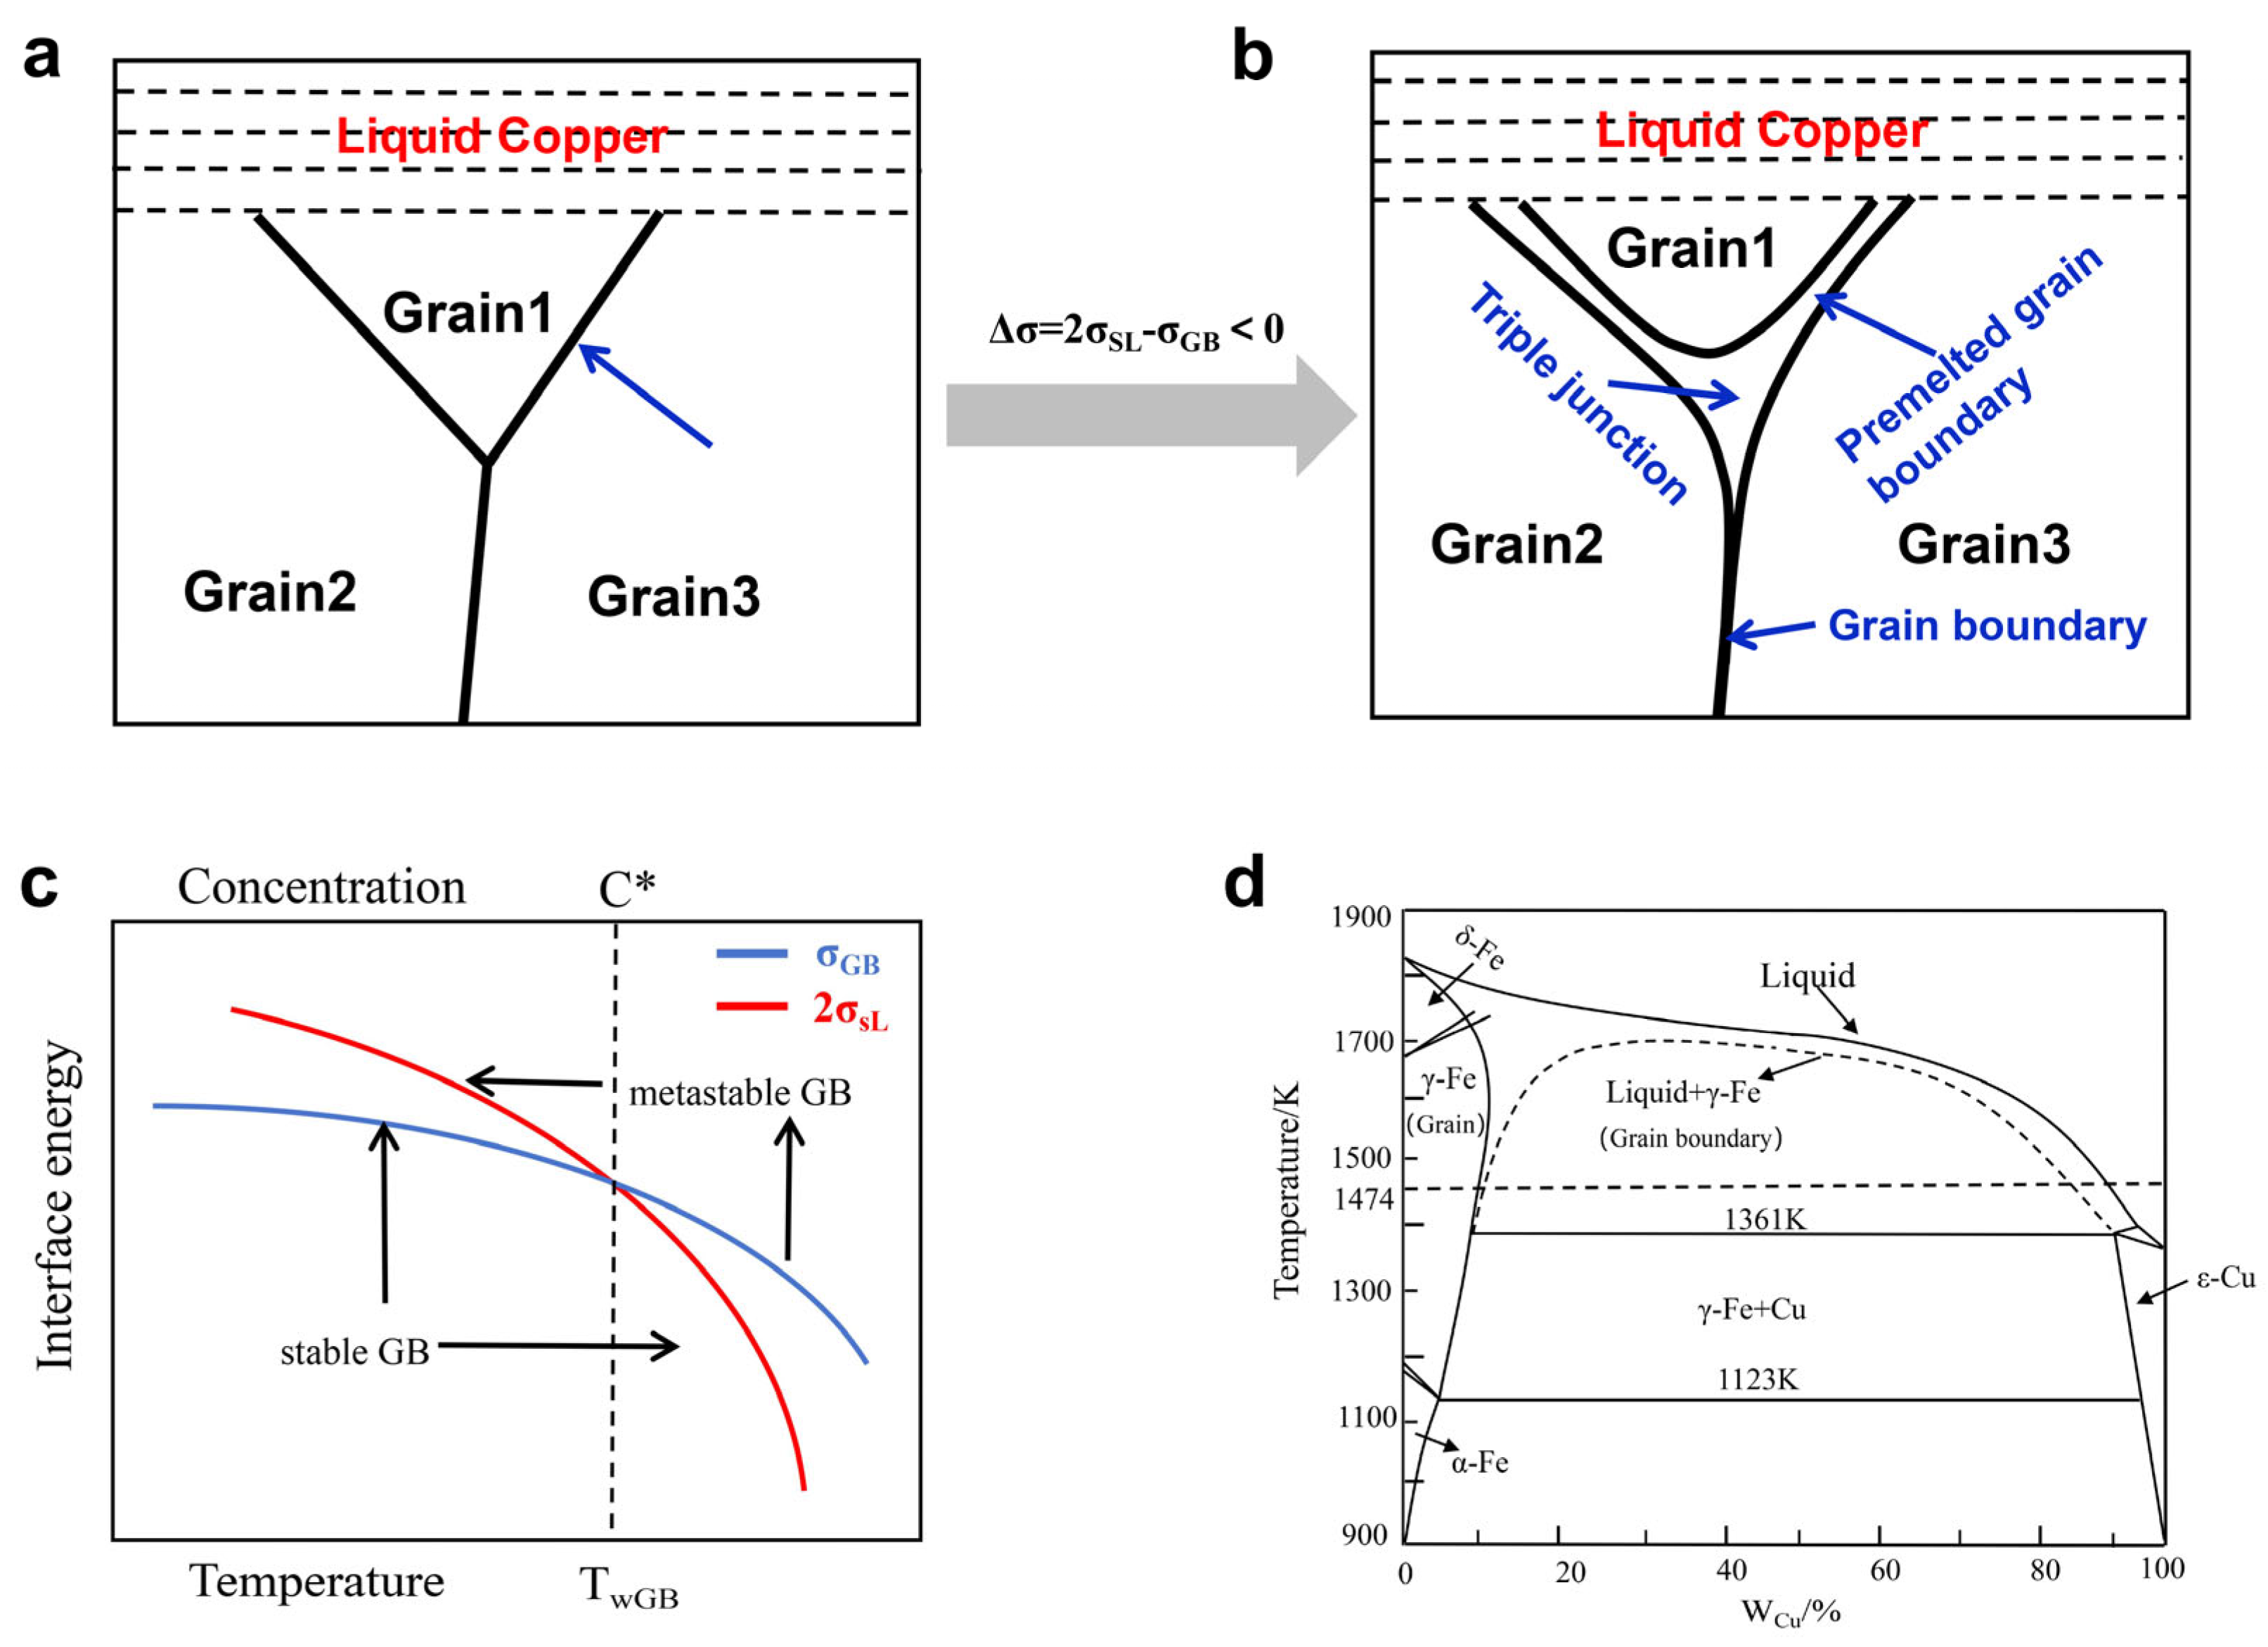
3.1. Microstructure Analysis of the Liquid Copper Penetration–Diffusion Along the GBs and TJs

Liquid copper penetration along the GBs of iron occurred in all specimens. Figure 2a–c show micrographs at three different annealing times. After holding at 1200 °C for 10, 30, and 100 min in vacuum atmosphere, a rugged Fe/Cu interface starts to develop, and a copper-penetrated solid solution region has formed on the surface of the iron matrix. The copper phase is light grey and the copper penetration along GBs and the TJ wetting are clearly visible. The GBs on the surface develop liquidlike structures and become wider, turning into a copper-rich liquid film [24,25]. These copper-wetted GBs are connected to form continuous network and the TJ wetting. EDS mappings show that the liquid film bounded by two solid–liquid interfaces and the TJ wetting are filled with copper-rich phases. This qualitatively agrees with the results reported in the literature [12], where a premelted GB is characterized by a layer of the liquid phase located between two solid–liquid interfaces. Also, it can be seen that the averaged penetration depth of the liquid copper increases with the time. The argument presented in the literature [26] gives a power law (penetration depth~tn, n < 1).
Furthermore, from the perspective of diffusion-controlled premelted GB formation, the microstructure characteristics of liquid copper penetration and diffusion along the steel GBs as shown in Figure 2 are explained in the study. Mellenthin et al. [27] pointed out that the GB in polycrystalline materials becomes an increasingly disordered liquidlike structure near the melting point Tm and wider, with a liquid film located between two solid–liquid interfaces, which is referred to as GB premelting. Premelted GBs are more pronounced in alloy materials, particularly for GBs with low-melting-point solute. Under conditions where the temperature is above the solute Tm but below the matrix Tm, premelted GBs can form. Theoretically, the simplest and most productive GB premelting model is to represent GBs by a uniform liquid layer between two solid–liquid interfaces interacting by a thermodynamic potential depending on the GB width [28,29,30]. The theory of material premelting indicates that the primary factor influencing the occurrence of premelting is the concentration gradient of solute diffusion, followed by the degree of undercooling (or overheating), which also affects the variation in the premelted GB width [31]. Figure 3 shows the schematic diagram of the premelted GBs (replaced by a layer of the liquid phase bounded by two solid–liquid interfaces with an energy of 2σSL). It is shown that when heated to 1200 °C (a temperature exceeding the Tm of copper at1083 °C), the steel GBs are completely wetted by the copper-containing melt, leading to a GB wetting transformation and liquid copper interlayers formed along the GBs. Thermodynamics shows that the GB energy and the energy of interface boundaries with liquid always decrease with the increase in temperature, in which the energy of two interface boundaries with liquid 2σSL generally decreases faster than the GB energy σGB (as shown in Figure 3c). This means that at each individual GB, the transition from incomplete wetting to complete wetting by the melt always occurs with increasing temperature. In case 2σSL-σGB < 0, “dry” GBs replaced with a liquid layer bounded by two solid–liquid interfaces can reduce the bulk energy, indicating the occurrence of GB premelting. On the other hand, an increase in temperature usually enhances the solute solubility, resulting in greater solute segregation at the GBs, which reduces the GB energy. As illustrated in the Fe–Cu phase diagram in Figure 3d, the maximum solubility of Cu in γ-Fe can reach approximately 10% at 1200 °C. Therefore, when the copper concentration at the GBs culminated in the maximum solubility, a liquid copper layer forms. The thin liquid film remains unstable until the emergency of the TJ wetting is observed.

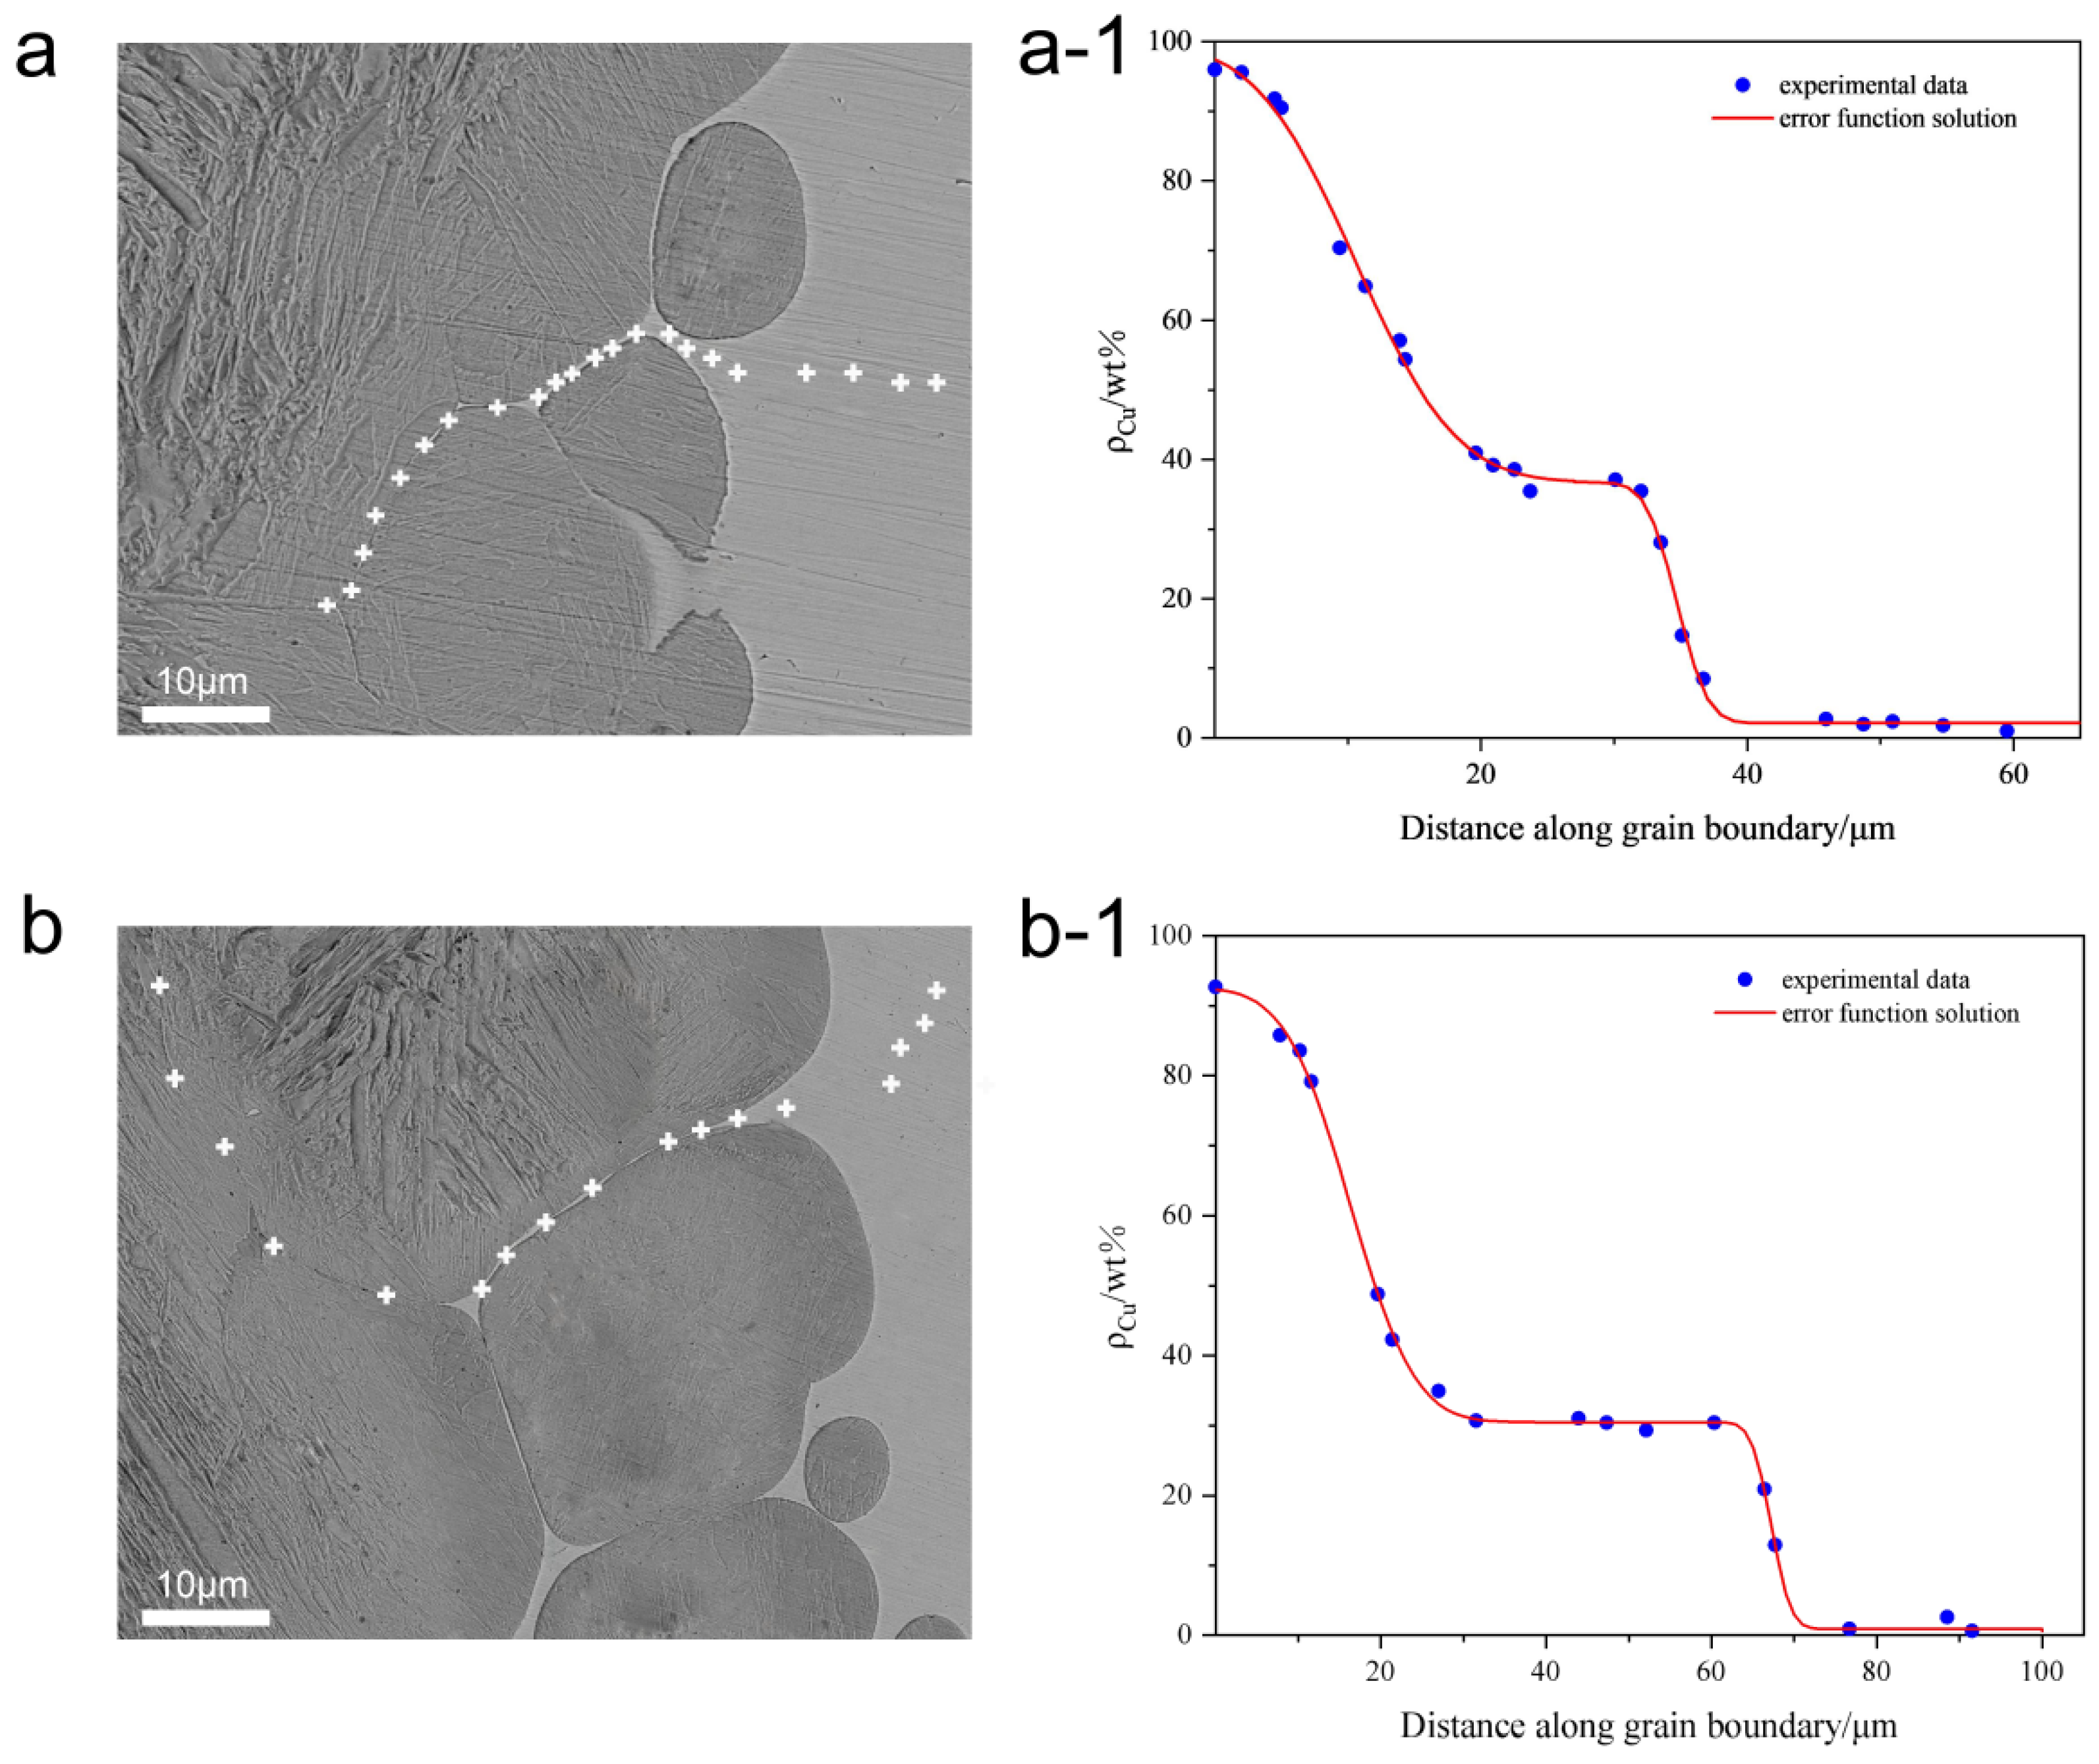
3.2. Measurement of Copper Diffusion at High Temperatures and Theoretical Analysis of Its Diffusion

3.2.1. The Quantitative Analysis on the Base of the Diffusion Equation

According to Refs. [32,33], GB diffusion should be treated as the correlated walk of atoms in a periodic quasi-2D system with multiple jump frequencies and different binding energies of point defects to different sites. Most mathematical treatments of GB diffusion are based on Fisher’s model, which considers diffusion along a single GB [34]. The Fisher model, still being the corner stone of boundary diffusion theory, has been subject to careful mathematical analysis and extended to many new situations encountered in either diffusion experiments or various metallurgical processes. According to Fisher’s model, the GB is represented by a high diffusivity uniform and isotropic slab embedded in a low diffusivity isotropic crystal perpendicular to its surface [35]. Mathematically, diffusion along the GBs is described by the following equation:
ρ t = D b 2 ρ x 2 + 2 D δ ρ y y = δ 2
where δ , ρ, Db, D, and t are the GB width, the concentration in the GBs, the GB diffusion coefficient, the volume diffusion coefficient, and the diffusion time, respectively. The second term on the right-hand side of Equation (1) takes into account the leakage of the atoms from the GBs to the volume (irrigation). Fisher derived an approximate solution of Equation (1) for diffusion along GBs based on the assumptions and simplifications [36]:
ρ = φ x , t y , t
Equation (1) gives the description by the conservation of matter; however, the second term represents the volume diffusion. In the present study, retaining only the first term, we have
ρ = φ x , t = ρ s   e r f c x 2 t D b
where x is the distance from the source surface, ρs is the concentration of diffusant atoms at the source surface, erfc is the complementary error function, t is the diffusion time, and Db is the GB diffusion coefficient. Here, Equation (3) is also consistent with the equations presented in Refs. [37,38,39,40].
Based on this, we conducted a quantitative analysis of the experimental results of liquid copper diffusion along the steel GBs. The solute diffusion wets the matrix GBs, resulting in GB premelting. Unlike the bulk diffusion, the diffusion along GBs does not follow a path parallel to the surface normal but rather envelopes each grain. Here, we provided a detailed explanation using the specimen held at 1200 °C for 30 min as an example. The points selected for the EDS measurement along the GB and at the TJ wetting are marked by the white crossing (+) shown in Figure 4a and Figure 4b, respectively. The measured copper concentration is presented in Figure 4c,d. It is found that the copper concentration distribution can be clearly divided into two parts, which is consistent with the result proposed in Ref [35]. Part 1 is characterized by a “Z-shaped” curve with a decreasing concentration, followed by an approximate plateau with minimal variation. In this case, the plateau is approximately 31%, resulting in the presence of the TJ wetting observed. The measurement results in Figure 4c indicate that the copper concentration at the TJ wetting reaches 60%–70%, which is significantly higher than the plateau concentration. Part 2 is another “Z-shaped” curve with a decreasing concentration. According to the observations on the EDS measured points along the GBs indicated in Figure 4a, the first part of decreasing concentration corresponds to the GBs in the surface grain layer, all of which are premelted GBs. The approximate plateau corresponds to the premelted GBs between the first and second grain layers. The second part where the concentration decreases again corresponds to the GBs between the grains in the second layer, which are solid-state GBs.
Equation (3) was fitted to the measured copper concentration along GBs shown in Figure 4d, as indicated by the red line. The expression is presented in Equation (4):
ρ x , t = ρ 0 + a 2 1 erf x x 02 2 D b 2 × t 2 + a 1 1 erf x x 01 2 D b 1 × t 1
where x 0 represents the coordinate of the Matano interfaces on the x-axis, corresponding to diffusion distance along GBs, ρ0 is the initial concentration of diffusant atoms, a represents the coefficient related to the difference in initial composition, Dbi represents the GB diffusion coefficients in the ith GB phase, subscripts 1 and 2 represent the first and second parts of diffusion, and ti is the diffusion time of the first and second stages, respectively. Thus, the GB diffusion coefficients for the first and second parts of concentration decrease are 14.4 × 10⁻¹⁵ m2/s and 1.44 × 10⁻¹⁵ m2/s, respectively, which indicates that the two correspond to different states of matter. Under the diffusion conditions defined in this study, GB premelting only observes in the surface grain layer, while the other grain layers remain as solid-state GBs. Therefore, Db1 in the premelted GBs is approximately one order of magnitude greater than that in the solid-state GBs of the second part. It was shown in the literature [41] that if at some bulk concentration of the solute atoms, the GB diffusion coefficient changes abruptly, this is an indication of a GB phase transformation. Such changes were interpreted as a GB premelting phase transition. Similarly, the EDS measurements (+) fitted into an error solution of Equation (4) in samples held at 1200 °C for 10 and 100 min, respectively, as indicated in Figure 5. It can be found that Db1 in the premelted GBs varied from 29.4 × 10⁻¹⁵ to 3.18 × 10⁻¹⁵ m2/s and Db2 in the solid-state GBs varied from 2.73 × 10⁻¹⁵ to 0.28 × 10⁻¹⁵ m2/s. Also, the root mean square error (RMSE) is employed to quantitatively calculate the error of these fitted curves, with values of 1.473 × 10⁻², 1.199 × 10⁻², and 1.007 × 10⁻² for annealing time of 10, 30 and 100 min, respectively. Generally, the lower RMSE, the better the goodness of fit. The fitting results demonstrate that the copper concentration distribution in both premelted and solid-state GBs conforms to the diffusion equation. However, it was indicated in the Ref [35] that the concentration dependence of Db can arise when the initial surface layer of the diffusant is thick enough to build up a relatively high concentration in the sample. Therefore, the copper penetration and diffusion in the near-surface premelted GBs cannot be fully described by error solution. It will be discussed in detail in the next section.
The quantitative study above reveals the characteristics of liquid copper diffusion along GBs: It involves two parts. The first part is the penetration–diffusion in premelted GBs, characterized by a high diffusion coefficient and associated with liquid penetration. The second part corresponds to diffusion in solid-state GBs.

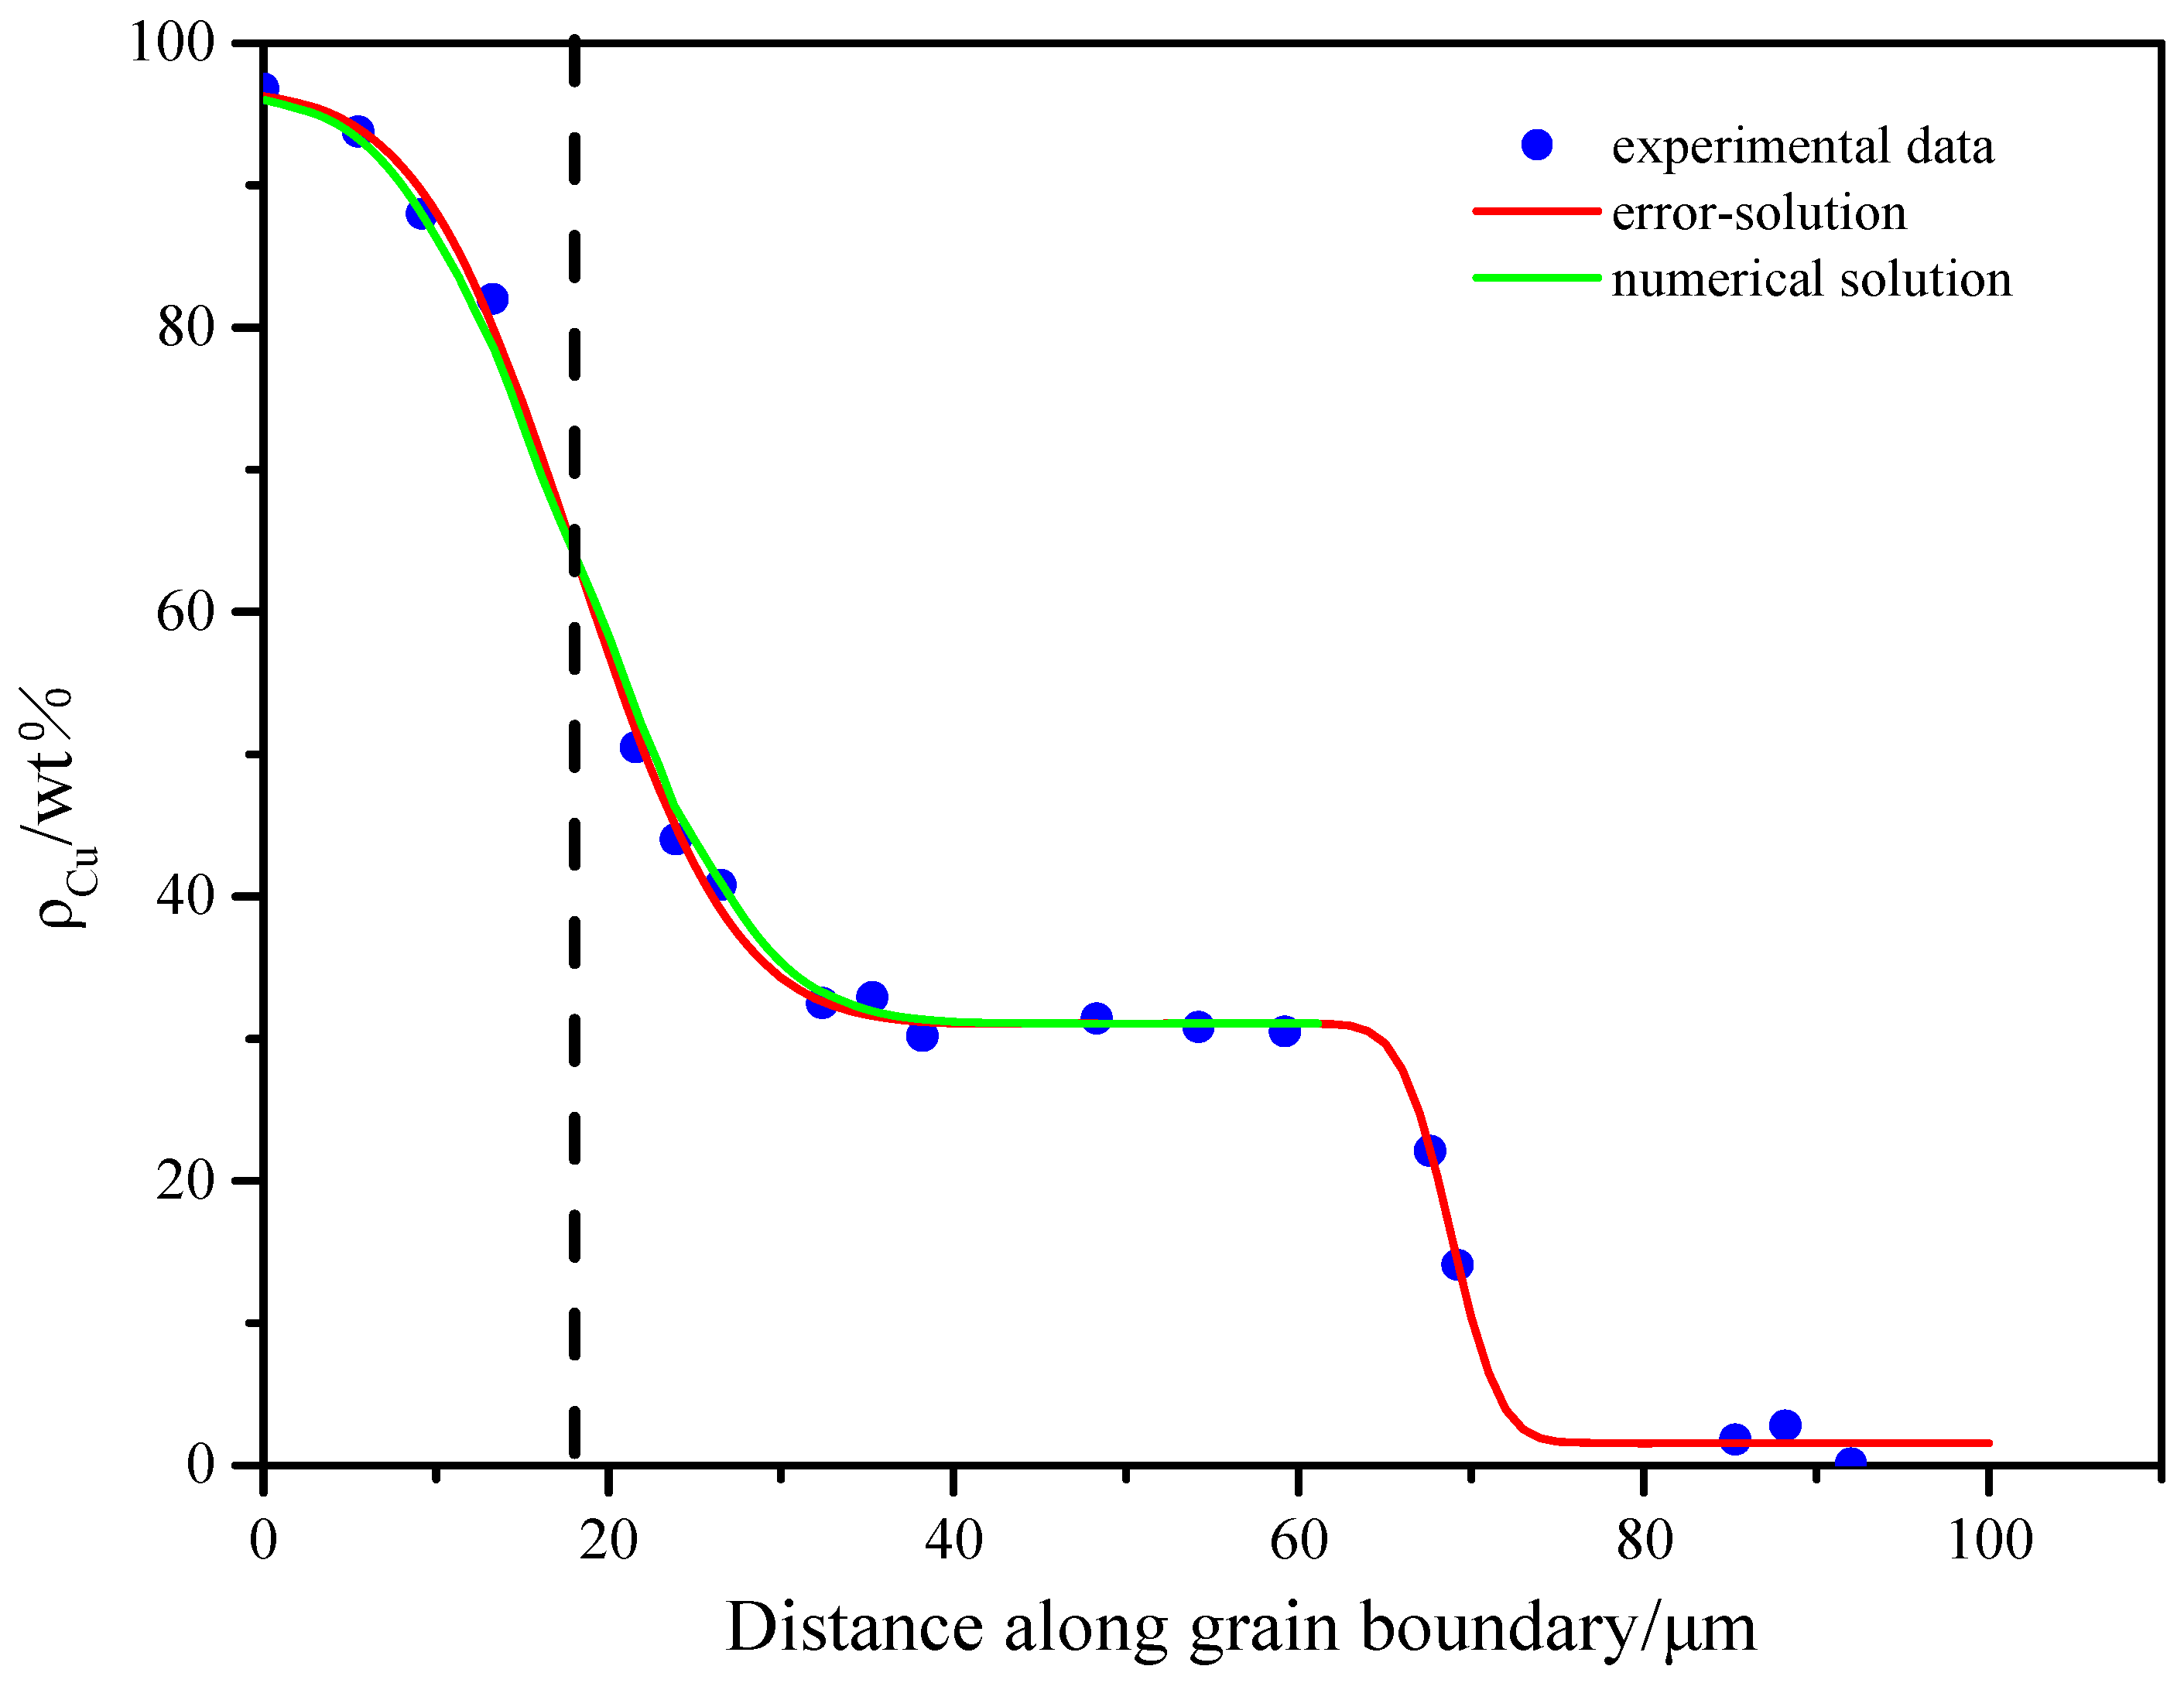
3.2.2. Quantitative Analysis on the Base of the Modified Diffusion Equation (Considering Liquid Copper Diffusion Along GBs)

As previously mentioned, near the Cu/Fe interface, i.e., in the near-surface GBs, the GBs widen due to premelting, accelerating Cu diffusion into the iron matrix. However, the GB width decreases as the diffusion distance x increases. At a certain distance from the Cu/Fe interface, the diffusion flux slows in the solid-state GBs, leading to congestion and forming the TJ wetting, as indicated by the red box in Figure 4a. Correspondingly, the error solution describing the concentration distribution exhibits an approximate plateau, as illustrated in Figure 4d. Therefore, the error solution cannot fully describe the copper concentration distribution in the near-surface premelted GBs. Db1 is no longer independent of concentration, but rather a function of the diffusion distance x, which can be expressed by an exponential function:
D b = D b 1 e β x
where the coefficient β (0 < β < 1) describes the effect of liquid copper on infiltration diffusion. Thus, the Equation (1) should be written as
ρ t = ρ x ( D b ρ x )
Expand the exponential function term   e β x in Equation (5) into a series, that is,   D b = D b 1 1 β x + β x 2 2 ; retaining only the first-order approximation, we obtain
ρ t = D b 1 2 ρ x 2 β D b 1 ρ x
In this study, Equation (7) is applied to describe the liquid copper infiltration process along the steel GBs, aiming to further improve the solution accuracy of the diffusion model.
For diffusion in non-GB and non-liquid regions, it is generally assumed that the diffusion coefficient is constant (i.e., β = 0), which is sufficient to describe the diffusion.
Equation (7) has no analytical solution but can be solved numerically. The numerical solution of ρ(x,t) will be discussed below. A comparative analysis is conducted between the error solution of Equation (1) and the numerical solution of the modified diffusion Equation (7) in the sample held at 1200 °C for 30 min, as shown in Figure 6. The coefficient β is determined by fitting the experimental data.
As shown in the figure, considering the effect of liquid copper infiltration diffusion, the copper concentration in GBs on the right side of the Cu/Fe interface (i.e., Matano interface, marked by the dashed vertical line at x = 18 μm) increases due to the high diffusion rate of liquid copper in the premelted GBs. Therefore, the increase in diffusion flux, represented by the additional area on this side, reflects the physical significance of the modification term coefficient β Db1 in Equation (7). The value of this coefficient is dependent on the temperature; the higher the temperature, the greater the value of β , and the more pronounced the increase in diffusion flux on the GBs to the right of the Cu/Fe interface. However, the reduced diffusion rate of liquid copper at a certain distance from the Cu/Fe interface results in an accumulation in the solid-state GBs, forming the TJ wetting. The distance of the TJ wetting from the Cu/Fe interface increases with extended holding time.
Compared to the RMSE value of the error solution (1.199 × 10⁻²), the calculated RMSE value of the numerical solution is 1.176 × 10⁻², which is reduced by 1.92%. Similarly, the numerical solution (considering liquid copper diffusion) for the copper concentration along the GBs shown in Figure 5a,b can be obtained, with values of RMSE of 1.466 × 10⁻² and 0.987 × 10⁻², which are reduced by 0.51% and 1.99%, respectively, compared with those of the error solution. Consequently, the numerical solution provides a more precise quantitative description of liquid copper penetration along the steel GBs.
We have modified the diffusion equation to make it applicable to the liquid diffusion and obtained a numerical solution for the concentration ρ(x,t). This solution provides a mathematical explanation for the liquid penetration phenomenon and aligns more closely with experimental observations.

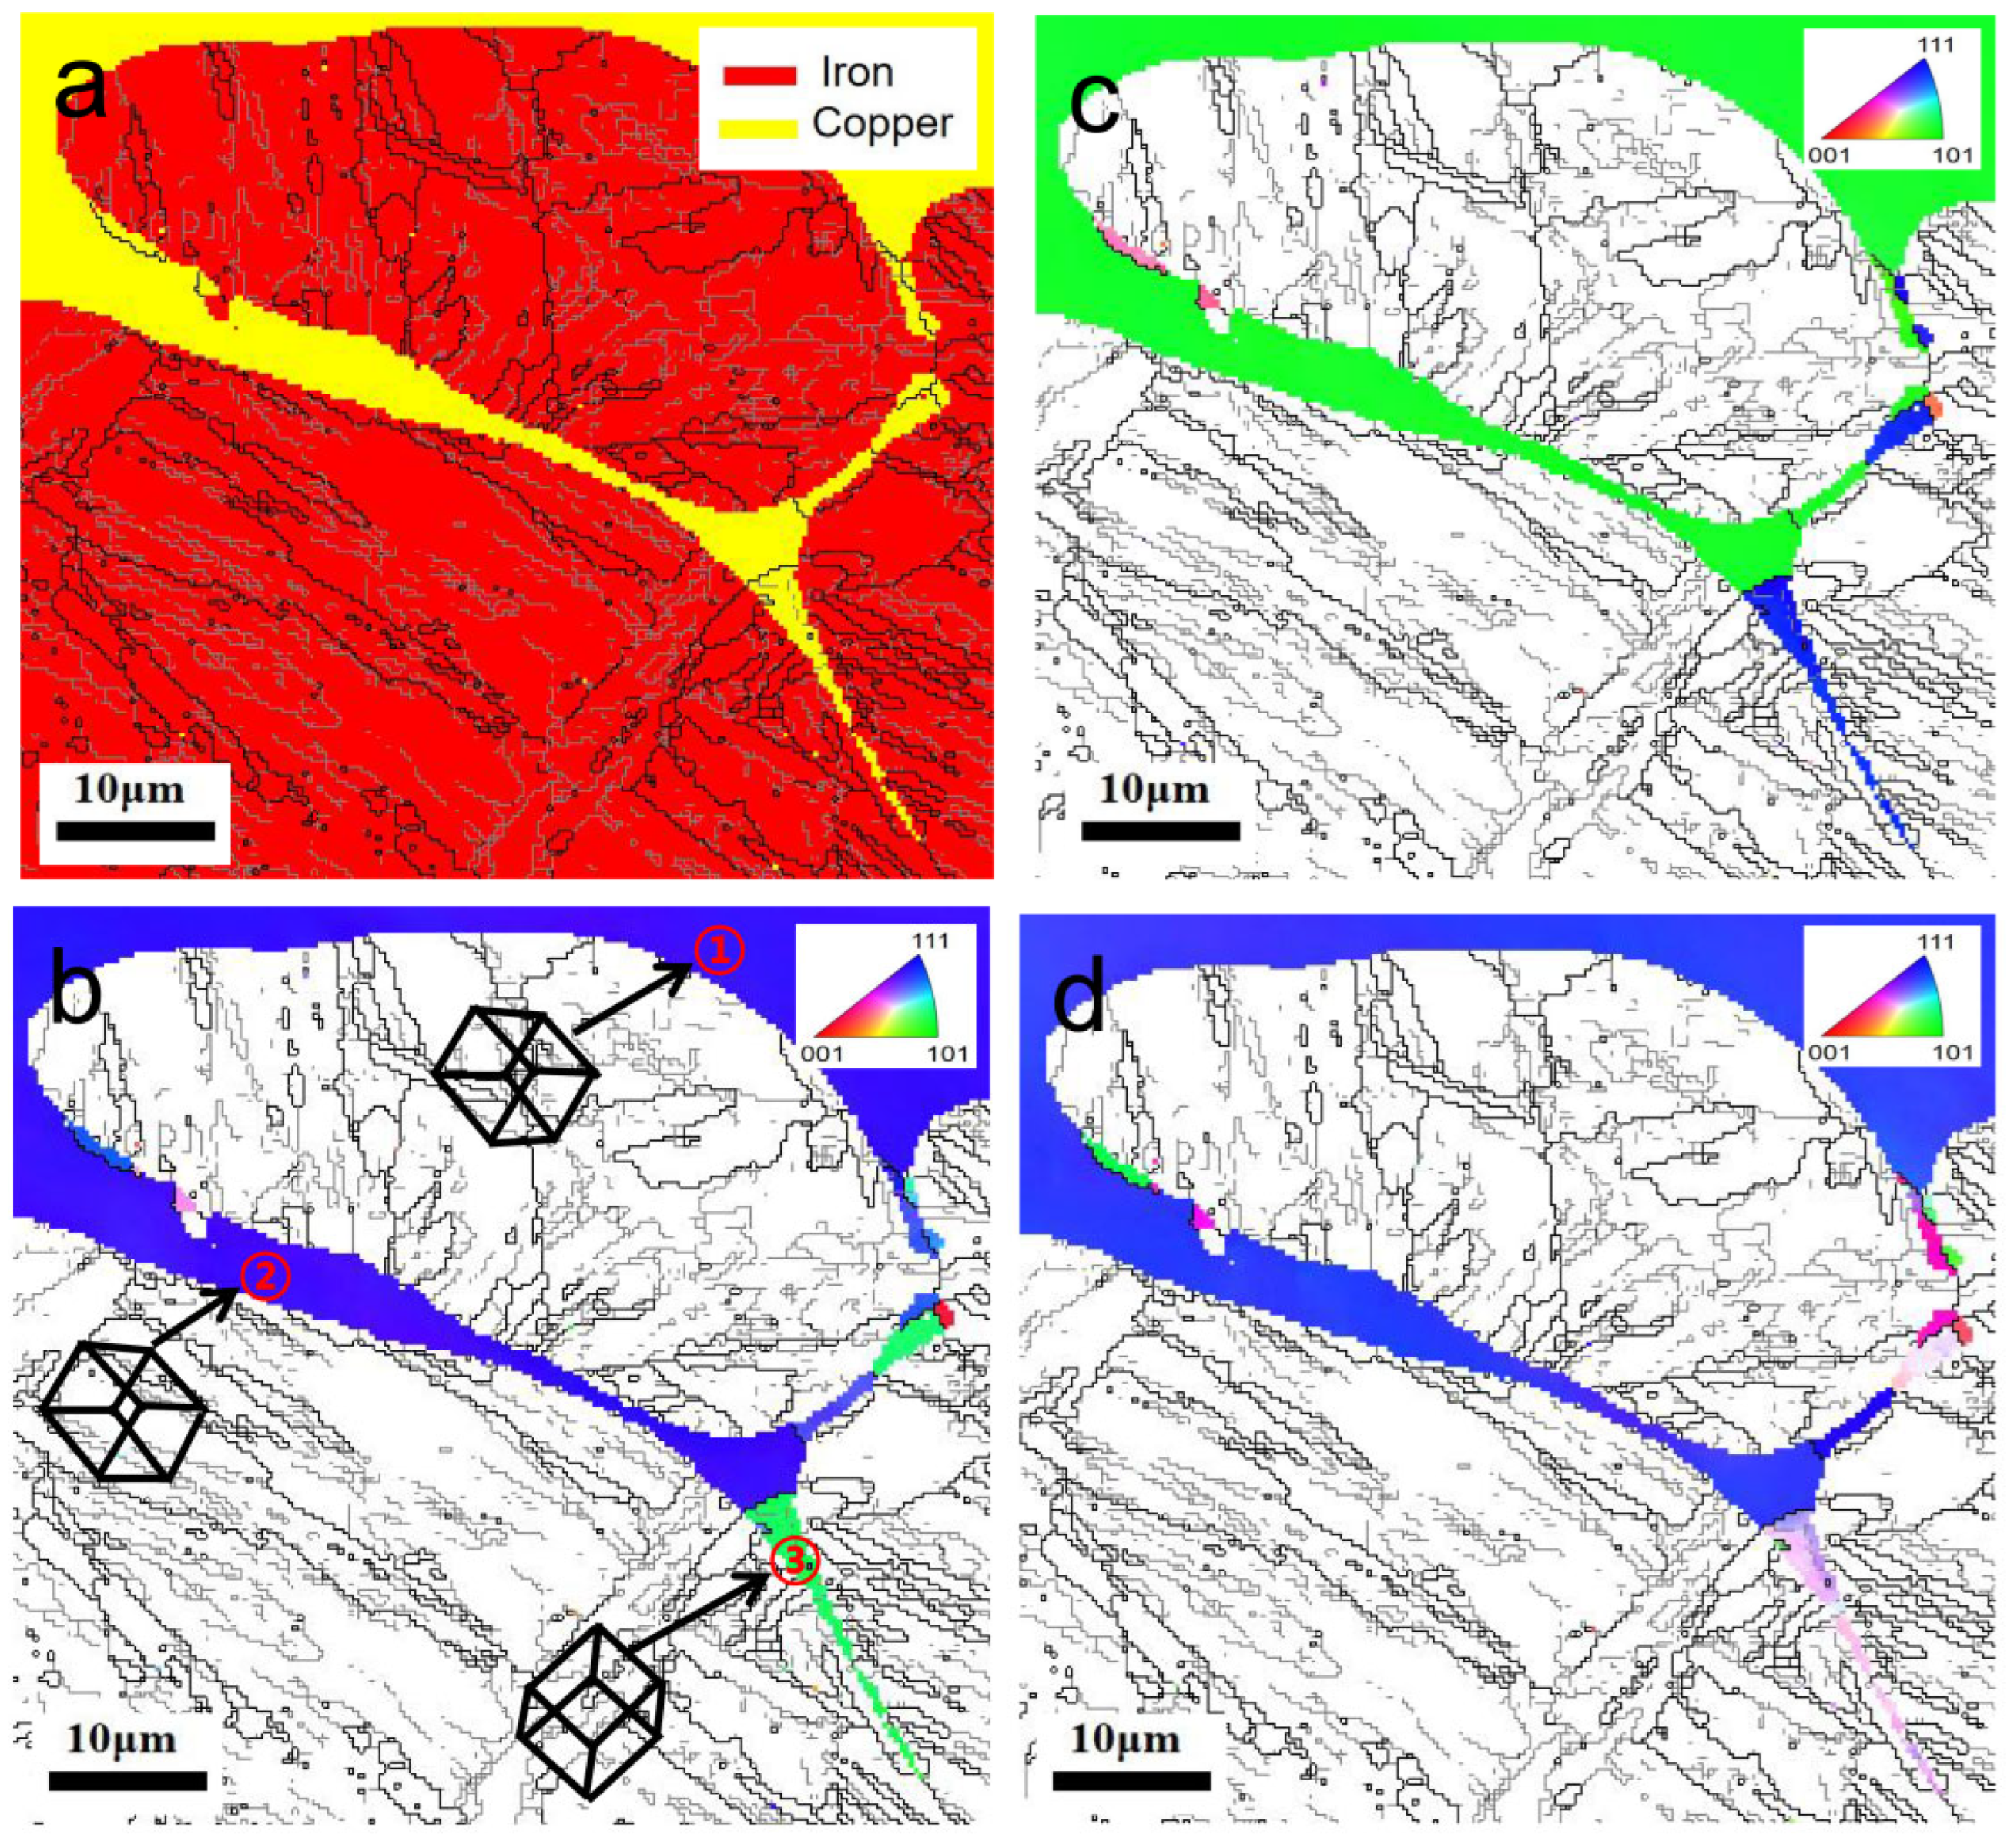
3.3. Analysis of Copper Orientation at the Penetration–Diffusion Region Along Steel GBs

In order to have a thorough understanding of the microstructural features, EBSD was conducted at the copper penetration–diffusion region along steel GBs. The EBSD inverse pole figure (IPF) maps in Figure 7b–d, show the copper orientation in the RD, TD, and ND directions, respectively. Select points on the copper coating layer on the sample surface and at the copper penetration–diffusion region along steel GBs are marked by ①, ②, and ③. The EBSD IPF maps of the copper phase at the near-surface premelted GBs and non-surface layer solid-state GBs of the Cu penetration–diffusion area reveal a non-identical crystal orientation, suggesting the emergence of “dry” or “wet” GBs. Specifically, the copper orientation at the premelted GBs remains consistent with the orientation of the surface copper coating layer, whereas the copper orientation at the solid-state GBs undergoes significant changes. The observation is consistent with the argument that the corresponding material states at near-surface premelted GBs are different from those at non-surface layer solid-state GBs. It provides experimental evidence for the solutions of the above diffusion equation.

4. Conclusions

The paper reports on the experimental study of the liquid copper penetration–diffusion along steel GBs, as well as an analysis of its diffusion theory. In terms of experiments, a vacuum heat treatment of copper-plated carbon steel was designed, which indicates that the GBs near surface are wetted by liquid copper and interconnected to form a continuous network, and that the TJ wetting is formed. Thermodynamics shows that in case 2σSL < σGB, a liquidlike layer that is unstable until the observed TJ wetting locates between two solid-liquid interfaces, forming a premelted GB. In terms of diffusion theoretical analysis, quantitative analysis of the copper concentration distribution along GBs in the penetration–diffusion region shows that copper diffusion in both near-surface premelted GBs and non-surface layer solid-state GBs conforms to the diffusion equation, though the diffusion coefficient along the premelted GBs increases by approximately one order of magnitude. Furthermore, the near-surface premelted GBs were analyzed using the modified diffusion equation, which takes into account the concentration dependence of Db, providing more accurate results. Additionally, the experimental characteristics of the TJ wetting were discussed, in which the liquid copper diffusion rate in the near-surface premelted GBs is high, leading to an increase in copper concentration. However, at a certain distance from the Cu/Fe interface within the solid-state GBs, the reduced diffusion rate of liquid copper causes the accumulated diffusion flux to be congested, forming the TJ wetting. EBSD provides experimental evidence for the solutions of the modified diffusion equation presented above, in which the copper orientation in the premelted GBs is consistent with that on the surface, while the copper orientation in the solid-state GBs undergoes significant changes. The observation is consistent with the opinion that the corresponding material states at near-surface premelted GBs are different from those at non-surface-layer solid-state GBs. The study provides a theoretical reference for understanding and preventing the LME phenomenon.

Author Contributions

Conceptualization, W.W.; Validation, D.W.; Formal analysis, Y.C.; Investigation, D.W.; Data curation, C.F.; Writing—original draft, Y.C.; Writing—review & editing, K.C.; Supervision, W.W. and K.C. All authors have read and agreed to the published version of the manuscript.

Funding

This research received no external funding.

Institutional Review Board Statement

Not applicable.

Informed Consent Statement

Not applicable.

Data Availability Statement

Data are contained within the article.

Conflicts of Interest

Authors Donghui Wen and Wei Wang were employed by the company Baoshan Iron & Steel Co., Ltd. The remaining authors declare that the research was conducted in the absence of any commercial or financial relationships that could be construed as a potential conflict of interest.

List of Symbols

σSLthe energy of the boundary between solid and liquid phases
σGBthe energy of the grain boundary
TwGBthe wetting temperature for a GB
C*the solute saturation concentrations
δthe GB width
ρthe concentration in the GBs
Dbthe GB diffusion coefficient
Dthe volume diffusion coefficient
xthe distance from the source surface
ρsthe concentration of diffusant atoms at the source surface
tthe diffusion time
Dbthe GB diffusion coefficient
x0the coordinate of the Matano interfaces on the x-axis, corresponding to diffusion distance along GBs
ρ0the initial concentration of diffusant atoms; represents the coefficient related to the difference in initial composition
Dbithe GB diffusion coefficients in the ith GBs phase; subscripts 1 and 2 represent the first and second parts of diffusion
tithe diffusion time of the first and second stages
β (0 < β < 1)the effect of liquid copper on infiltration diffusion

References

  1. Kamder, M.H. Liquid Metal Embrittlement. Treatise Mater. Sci. Technol. 1983, 25, 361–459. [Google Scholar]
  2. Leroy, V. Review of hot shortness problems in copper-containing steel. ATB Metall. 1983, 23, 1–24. [Google Scholar]
  3. Melford, D.A. The influence of residual and trace elements on hot shortness and high temperature embrittlement. Philos. Trans. R. Soc. Lond. Ser. A Math. Phys. Sci. 1980, 295, 89–103. [Google Scholar]
  4. Habraken, L.; Lecomte-Beckers, J. Hot shortness and scaling of copper-containing steel. Mater. Sci. 1982, 45–81. [Google Scholar]
  5. Aramfard, M.; Deng, C. Interaction of shear-coupled grain boundary motion with crack: Crack healing, grain boundary decohesion, and sub-grain formation. J. Appl. Phys. 2016, 119, 085308. [Google Scholar] [CrossRef]
  6. Zhao, Z.; Wang, Y.; Safaei, B.; Long, H.; Chu, F.; Wei, Y. Orientation effect on intergranular fracture behaviors along symmetrical tilt grain boundaries in bcc iron. Mater. Today Commun. 2021, 29, 102981. [Google Scholar] [CrossRef]
  7. Johnson, W.H. On some remarkable changes produced in iron and steel by the action of hydrogen and acids. R. Soc. 1875, 23, 156–163. [Google Scholar] [CrossRef]
  8. Rostoker, W.; McCaughey, J.; Markus, H. Embrittlement by Liquid Metals. Aeronautical 1960, 65, 443. [Google Scholar]
  9. Lynch, S.P. Hydrogen embrittlement and liquid-metal embrittlement in nickel single crystals. Sripta Metall. 1979, 13, 1051–1056. [Google Scholar] [CrossRef]
  10. Reynolds, A.P.; Stoner, G.E. Cleavage crystallography of liquid metal embrittled aluminum. Metall. Trans. 1991, 22, 1849–1855. [Google Scholar] [CrossRef]
  11. Straumal, B.; Lepkova, T.; Korneva, A.; Gerstein, G.; Kogtenkova, O.; Gornakova, A. Grain Boundary Wetting by the Second Solid Phase: 20 Years of History. Metals 2023, 13, 929. [Google Scholar] [CrossRef]
  12. Schweinfest, R.; Paxton, A.T.; Finnis, M.W. Bismuth embrittlement of copper is an atomic size effect. Nature 2004, 432, 1008–1011. [Google Scholar] [PubMed]
  13. Razmpoosh, M.H.; Langelier, B.; Marzbanrad, E.; Zurob, H.S.; Zhou, N.; Biro, E. Atomic-scale Investigation of Liquid-Metal-Embrittlement Crack-path: Revealing Mechanism and Role of Grain Boundary Chemistry. Acta Mater. 2021, 204, 116519. [Google Scholar]
  14. Kang, H.; Cho, L.; Lee, C.; De Cooman, B.C. Zn Penetration in Liquid Metal Embrittled TWIP Steel. Metall. Mater. Trans. A Phys. Metall. Mater. Sci. 2016, 47, 2885–2905. [Google Scholar]
  15. Novikov, A.A.; Petelin, A.L.; Bokstein, B.S.; Zhevnenko, S.N.; Orelkina, D.I. The Formation of Liquid Metal Channels Network under Grain Boundary Wetting in the Cu-Bi System. Defect Diffus. 2012, 323–325, 177–181. [Google Scholar] [CrossRef]
  16. Savage, W.F.; Nippes, E.P.; Mushala, M.C. Copper-Contamination Cracking in the Weld Heat-Affected Zone. Weld. J. 1978, 57, 145–152. [Google Scholar]
  17. Smith, C.S. Grains, Phases and Interfaces: Interpretation of Microstructures. Trans. AIME 1948, 175, 15–51. [Google Scholar]
  18. Nicholson, A.; Murray, J.D. Surface Hot Shortness in Low-Carbon Steel. J. Iron Steel Inst. 1956, 203, 1007–1018. [Google Scholar]
  19. Ishida, T. The interaction of molten copper with solid iron. J. Mater. Sci. 1986, 21, 1171–1179. [Google Scholar]
  20. Fredriksson, H.; Hansson, K.; Olsson, A. On the mechanism of liquid copper penetration into iron grain boundaries. Scand. J. Met. 2001, 30, 41–50. [Google Scholar]
  21. Shi, X. Grain boundary premelting and activated sintering in binary refractory alloys. Mater. Sci. 2016, 93, 224108. [Google Scholar]
  22. Hickman, J.; Mishin, Y. Disjoining potential and grain boundary premelting in binary alloys. Phys. Rev. 2016, 93, 24108. [Google Scholar]
  23. Anand, M.S.; Agarwala, R.P. Diffusion of copper in iron. J. Appl. Phys. 1966, 37, 4248–4251. [Google Scholar] [CrossRef]
  24. Liu, H.; Lu, S.; Zhang, Y.; Chen, H.; Chen, Y. Migration of solidification grain boundaries and prediction. Nat. Commun. 2022, 13, 5910. [Google Scholar] [CrossRef] [PubMed]
  25. Torabi Rad, M.; Boussinot, G.; Apel, M. Geometry of Triple Junctions during Grain Boundary Premelting. Phys. Rev. Lett. 2021, 127, 225701. [Google Scholar] [PubMed]
  26. Rabkin, E. Grain Boundary Interdiffusion in the Case of Concentration-Dependent Grain Boundary Diffusion Coefficient. Interface Sci. 1996, 3, 219–226. [Google Scholar] [CrossRef]
  27. Mellenthin, J.; Karma, A.; Plapp, M. Phase-field crystal study of grain-boundary premelting. Phys. Rev. 2018, 78, 184110. [Google Scholar]
  28. Lipowsky, R. Melting at grain boundaries and surfaces. Phys. Rev. Lett. 1986, 57, 2876. [Google Scholar]
  29. Hoyt, J.J.; Olmsted, D.; Jindal, S.; Asta, M.; Karma, A. Method for Computing Short-Range Forces between Solid-Liquid Interfaces Driving Grain Boundary Premelting. Phys. Rev. 2009, 79, 020601. [Google Scholar] [CrossRef]
  30. Luo, J.; Cheng, H.; Asl, K.M.; Kiely, C.J.; Harmer, M.P. The Role of a Bilayer Interfacial Phase on Liquid Metal Embrittlement. Science 2011, 332, 1730–1733. [Google Scholar] [CrossRef]
  31. Beke, D.L.; Kaganovskii, Y.; Katona, G.L. Interdiffusion along grain boundaries diffusion induced grain boundary migration, low temperature homogenization and reactions in nanostructured thin films. Prog. Mater. Sci. 2018, 98, 625–674. [Google Scholar] [CrossRef]
  32. Mishin, Y. Grain Boundary Diffusion in Metals. Phil. Mag. 1995, 1589, 337–366. [Google Scholar]
  33. Bernardini, J.; Gas, P. Grain Boundary Diffusion in Solids: Recent Advances and Applications. Defect Diffus. Forum 1997, 143–147, 1343–1356. [Google Scholar] [CrossRef]
  34. Fisher, J.C. Calculation of Diffusion Penetration Curves for Surface and Grain Boundary Diffusion. J. Appl. Phys. 1951, 22, 74–77. [Google Scholar] [CrossRef]
  35. Mishin, Y.; Herzig, C.; Bernardini, J. Gust, Grain boundary diffusion: Fundamentals to recent developments. Int. Mater. Rev. 1997, 42, 155–178. [Google Scholar] [CrossRef]
  36. Smoluchowski, R. Theory of Grain Boundary Diffusion. Phys. Rev. 1952, 87, 482–487. [Google Scholar] [CrossRef]
  37. Vogel, H.; Ratke, L. Instability of Grain Boundary Grooves due to Equilirium Grain Boundary Diffusion. Acta Metall. 1991, 39, 641–649. [Google Scholar] [CrossRef]
  38. Crank, J. The Mathematics of Diffusion; Clarendon Press: Oxford, UK, 1975; Volume 21. [Google Scholar]
  39. Herzig, C.; Mishin, Y. Diffusion in Condensed Matter; Springer: Berlin/Heidelberg, Germany, 2005; pp. 337–366. [Google Scholar]
  40. Paul, A.; Laurila, T.; Vourinen, V.; Divinski, S.V. Thermodynamics, Thermodynamics, Diffusion and the Kirkendall Effect in Solids; Springer: Berlin/Heidelberg, Germany, 2014; Volume 17, p. 446. [Google Scholar]
  41. Rabkin, E.; Semenov, V.N.; Shvindlerman, L.S.; Straumal, B.B. Penetration of tin and zinc along tilt grain boundary 43° in Fe-5at%Si alloy: Premelting phase transition. Acta Metall. Mater. 1991, 39, 627–639. [Google Scholar] [CrossRef]
Figure 1. The schematic diagram for vacuum heat treatment device, * indicates thermocouple measurement positions.
Coatings 15 00408 g001
Figure 2. Cross-sectional SEM images and EDS of copper penetration along grain boundaries in copper-electroplated Q355 specimen after holding at 1200 °C for 10, 30, and100 min in vacuum atmosphere. (a,a-1,a-2) 10 min. (b,b-1,b-2) 30 min. (c,c-1,c-2) 100 min.
Coatings 15 00408 g002
Figure 3. Schematic illustrating the formation of premelted GBs and TJs on copper-electroplated Q355 steel during vacuum heat treatment at 1200 °C (σSL and σGB are solid–liquid interface energy and GB energy, respectively). (a) Schematic of general GBs where the GBs are not wetted by liquid copper. (b) Schematic of premelted GBs and TJs. In this case, 2σSL < σGB, a continuous liquid layer locating along GBs. (c) Schematic of temperature and solute concentration dependence for GB energy σGB and two solid–liquid interface energy 2σSL. TwGB is the wetting temperature for a GB; C* is solute saturation concentration. (d) Binary Fe–Cu phase diagram.
Coatings 15 00408 g003
Figure 4. The copper concentration analyzed along the GBs in sample held at 1200 °C for 30 min. (a) The SEM image of copper-electroplated Q355 sample highlighting the aimed GBs for the EDS measurement with the white crossing (+). (b) The SEM image of the aimed TJ wetting for the EDS analysis highlighted by the red rectangle marked in (a). (c) The measured copper concentration at the TJ wetting for the selected spots indicated in (b). (d) The measured copper concentration along the GBs marked in (a), fitted into an error- solution represented by red line.
Coatings 15 00408 g004
Figure 5. The copper concentration analyzed along the GBs in samples held at 1200 °C for 10 and 100 min. (a,b) The SEM image of samples held at 1200 °C for 10 and 100 min highlighting the aimed GB. (a-1,b-1) The EDS measurements fitted into an error solution in samples indicated in (a,b).
Coatings 15 00408 g005
Figure 6. Comparison of the error solution and the numerical solution (considering liquid copper diffusion) for the copper concentration along the GBs shown in Figure 4a, the dashed vertical line represents the Cu/Fe interface.
Coatings 15 00408 g006
Figure 7. EBSD image of the Fe–Cu alloy after holding at 1200 °C for 30 min. (a) Phase map. (b) IPF-TD. (c) IPF-ND. (d) IPF-RD.
Coatings 15 00408 g007
Table 1. The composition of Q355 steel.
CompositionCSiMnPSAlFe
Content%0.170.181.20.020.0080.03Others
Disclaimer/Publisher’s Note: The statements, opinions and data contained in all publications are solely those of the individual author(s) and contributor(s) and not of MDPI and/or the editor(s). MDPI and/or the editor(s) disclaim responsibility for any injury to people or property resulting from any ideas, methods, instructions or products referred to in the content.

