Article

Using Preexisting Surface Cracks to Prevent Thermal Fatigue Failure and Crack Delamination in FGM Thermal Barrier Coatings

1
Department of Mechanical Engineering, National Cheng-Kung University, Tainan 701, Taiwan
2
Department of Mechanical and Electro-Mechanical Engineering, National Sun Yat-sen University, Kaohsiung 804, Taiwan
3
Department of Mechanical Engineering, National Yunlin University of Science and Technology, Yunlin 64002, Taiwan
4
Department of Materials Science and Engineering, National Yang Ming Chiao Tung University, Hsinchu 30010, Taiwan
*
Author to whom correspondence should be addressed.
Coatings 2025, 15(3), 362; https://doi.org/10.3390/coatings15030362
Submission received: 6 February 2025 / Revised: 9 March 2025 / Accepted: 15 March 2025 / Published: 20 March 2025

Abstract

:
Thermal shock testing has long been employed to assess thermal barrier coatings (TBCs), with crack formation and propagation on TBC surfaces serving as important indicators of fracture toughness. In this study, the influence of preexisting cracks within TBC coatings was investigated. These cracks can help alleviate stress concentrations at the interface and within the thermally grown oxide (TGO) layers of the TBC model. In other words, surface crack propagation may eventually intersect the interface, leading to delamination and spallation. This research focused on modifying the volume fraction of functionally graded materials (FGMs) and optimizing preexisting surface cracks in TBCs to extend their lifespan before delamination occurs. The accuracy of the J-integral and displacement correlation technique (DCT) methods was evaluated for use in thermal shock testing simulations. The results showed that both the stress intensity factor (SIF) and interface tensile stress of preexisting cracks were significantly reduced when the volume fraction was set at N = 3. Furthermore, the SIF values demonstrated strong agreement with calculations using the J-integral and DCT methods. The SIF for preexisting cracks dropped to below 62.42% of the fracture toughness when the crack length was approximately 50% of the TBC coating thickness in FGM structures, with a crack density of 10 cracks per inch (CPI).

1. Introduction

Functionally graded material is complex and exhibits several material parameters within the model space. These include Young’s modulus, Poisson’s ratio, thermal conductivity, and the thermal expansion coefficient in three-dimensional space. These parameters can be defined mathematically by the functions and linear rules of mixtures [1,2,3].
In the design of products utilizing FGM materials, the aim is the optimization and even distribution of stress and mechanical properties and the prevention of physical discontinuity. Such material finds primary applications in aerospace, nuclear reactor technology, architecture, and the automotive industry.
Thermal barrier coatings are commonly applied to turbine blades, piston surfaces, and other parts that operate at high temperatures. These coatings can ensure the normal function of working and static components under extremely high environmental temperatures. The traditional structure of a TBC coating comprises a ceramic topcoat, a bonding coat, and a metal substrate. However, crack delamination often occurs due to a higher thermal stress concentration and the growth of TGO oxide layers. Protection of the metal substrate is lost as cracks propagate through interaction between the metal surface and the TBC coating [4,5].
Jian et al. (1995) [6] studied crack propagation on TBC surfaces using a CO2 pulsed laser to heat the boundary. They confirmed that an FGM structure improved the thermal shock resistance of TBC coatings compared to traditional formulations. Xiong et al. (2004) [7] conducted thermal shock testing on layers of TBC surfaces with an FGM structure 0.13 mm, 0.2 mm, 0.3 mm, and 0.4 mm thick (per volume). They found that the continuity of FGM distribution effectively inhibited crack propagation on TBC surfaces, with the longest life before crack delamination occurring in the 0.13 mm specimens.
Numerous studies have shown that preexisting cracks, which extend over the entire TBC coating thickness, improve the thermal resistance of the coating. Taylor et al. (1990) [8] confirmed that the enhancement of the density of plasma-sprayed yttia-stabilized zirconia coatings effectively promoted thermal shock resistance. Wang et al. (2016) [4] suggested that the energy release rate could be reduced by increasing the number of preexisting cracks. Kokini et al. (2002, 2004) [8,9] previously used finite element analysis and thermal shock testing to demonstrate that promotion of the number of preexisting cracks on TBC coating surfaces reduces crack growth in TGO layers.
The analysis of crack growth in thermal barrier coating (TBC) systems under thermal shock loading is inherently complex due to their elastoplastic and time-dependent viscoplastic behavior [9]. To address this challenge, Bhattacharya et al. (2012) [10] employed the extended finite element method (XFEM) under the assumption of linear elastic fracture mechanics (LEFM) to evaluate crack propagation. Their study demonstrated that the XFEM could be further extended to predict the fatigue failure life of functionally graded materials (FGMs) under thermo-mechanical loading, while maintaining an invariant finite element mesh.
Building upon this, Thamburaja et al. (2019) [11] introduced a novel constitutive model based on material time derivatives to describe the damage and fracture behavior in viscoelastic materials. This model was successfully implemented in Abaqus/Explicit, where numerical simulations revealed that the computed stress–strain response and crack propagation characteristics remained objective and independent of mesh density.
These studies collectively highlight that mesh-invariant numerical approaches can effectively capture physical behavior at crack tips, ensuring robust and accurate fracture simulations across different material systems like viscoelastic and elastoplastic mechanical behaviors. In this study, two-phase FGM models were studied. The two-phase model consisted of yttria-stabilized zirconia (YSZ) and NiCoCrAlY. While YSZ is the traditional ceramic material for TBC, NiCoCrAlY is commonly used to bond coatings. The two-phase model aims to optimize the TBC coating structure and ensure a good bond with the substrate alloy that reduces stress concentration at the interface. The study findings suggest that preexisting crack structure and two-phase models can reduce the range of tensile stress on the interface between coating and substrate. This effect improves the postponement of crack delamination.
The focus of this study was on the stress intensity factor (SIF) values of preexisting cracks, tensile stress on the surface, and interface of thermal barrier coatings. SIF calculations were made using the J-integral method and the displacement correlation technique (DCT).
Paulino et al. (2003) [12] calculated the SIF value of orthotropic material using the J-integral method and compared it with Erdogan’s analytical solution for cracks in an infinite model [13]. The SIF error was about 1.8%~1.9%, demonstrating the high accuracy of the J-integral method for anisotropic materials. Erdogan et al. (1997) [14] calculated the SIF value of functionally graded material (FGM) models with DCT and compared their results with those from polynomial curve fitting of SIF, andthe error was only about 3.1%. In the same year, Erdogan et al. [15] analyzed the SIF of mode I in the homogeneous and inhomogeneous materials with Chebyshev polynomial respectively and turned out the different inhomogeneous materials can affect the SIF value greatly. In 1976, Shih et al. [16] computed the stress intensity factor (SIF) using quadrilateral elements based on crack opening displacement (COD). In 2005, Leslie et al. [17] analyzed the SIF value of mixed-mode crack tips constructed by quadratic elements with J-integral and DCT method respectively. The error estimation is only 0.51% between two different methods. The results are in close agreement with those obtained by accounting for the significant impact of material inhomogeneity on the stress intensity factor (SIF) and energy release rate, as well as with those derived using the J-integral method, which utilizes triangular elements at the crack tip. Although the DCT method offers lower accuracy compared to the J-integral approach, its straightforward finite element nodal formulation has sustained its popularity in SIF calculations.
Preexisting crack design has been evaluated for decades. Zhou et al. [18] simulated the TBC coating model with the thermal shock boundary. The result indicates that crack propagation on the interface will reduce when the density of preexisting cracks is improved. Mehboob et al. [19,20] calculated the stress and energy release rate of the crack tip on the interface. The density of preexisting cracks significantly influences the length of cracks and the amount of strain tolerance by the Abaqus simulation.
Surface tensile stress and interface stress distribution analysis help predict microcrack propagation on the surface and the interface, which leads to crack delamination and spallation of the TBC coating and thermal damage to the substrate alloy [21].
TBC coatings are primarily produced using air plasma spray (APS) and electron-beam physical vapor deposition (EB-PVD). APS costs less than EB-PVD, but its layers are not as strong as the column structure made by EB-PVD. APS is mainly used to apply TBC coatings to turbine fans, while EB-PVD ensures stronger structures on parts with smaller surfaces. In this study, TBC coatings with FGM content of different volume compositions made by the APS method were evaluated. The linear rule of the mixtures model effectively reduces the stress intensity factor of preexisting cracks on the TBC surface with a 10 CPI preexisting-crack density. This study provides a novel insight into the application of FGM isotropic materials to TBC coatings and makes a significant contribution to the J-integral method and the DCT method in preexisting crack design for TBC coatings.

2. Description of the Model

The TBC samples used for the thermal shock experiments carried out in this study were prepared according to Kokini et al. (2004) [9]. The FGM coatings were about 2.4 mm thick, and the samples were 14.9 × 31.75 × 3 mm in size, as presented in Figure 1. The FGM coatings were fabricated using the APS technique, and the powdered material used was NiCoCrAlY, YSZ, and mullite. The substrate alloy was Inconel-HX, as used in rocket engines and jet engine turbine fans, both of which are subject to very high temperature gradient conditions [21]. The number of preexisting cracks and their length and density can be varied by adjusting the spraying distance and using powders with different grain sizes.

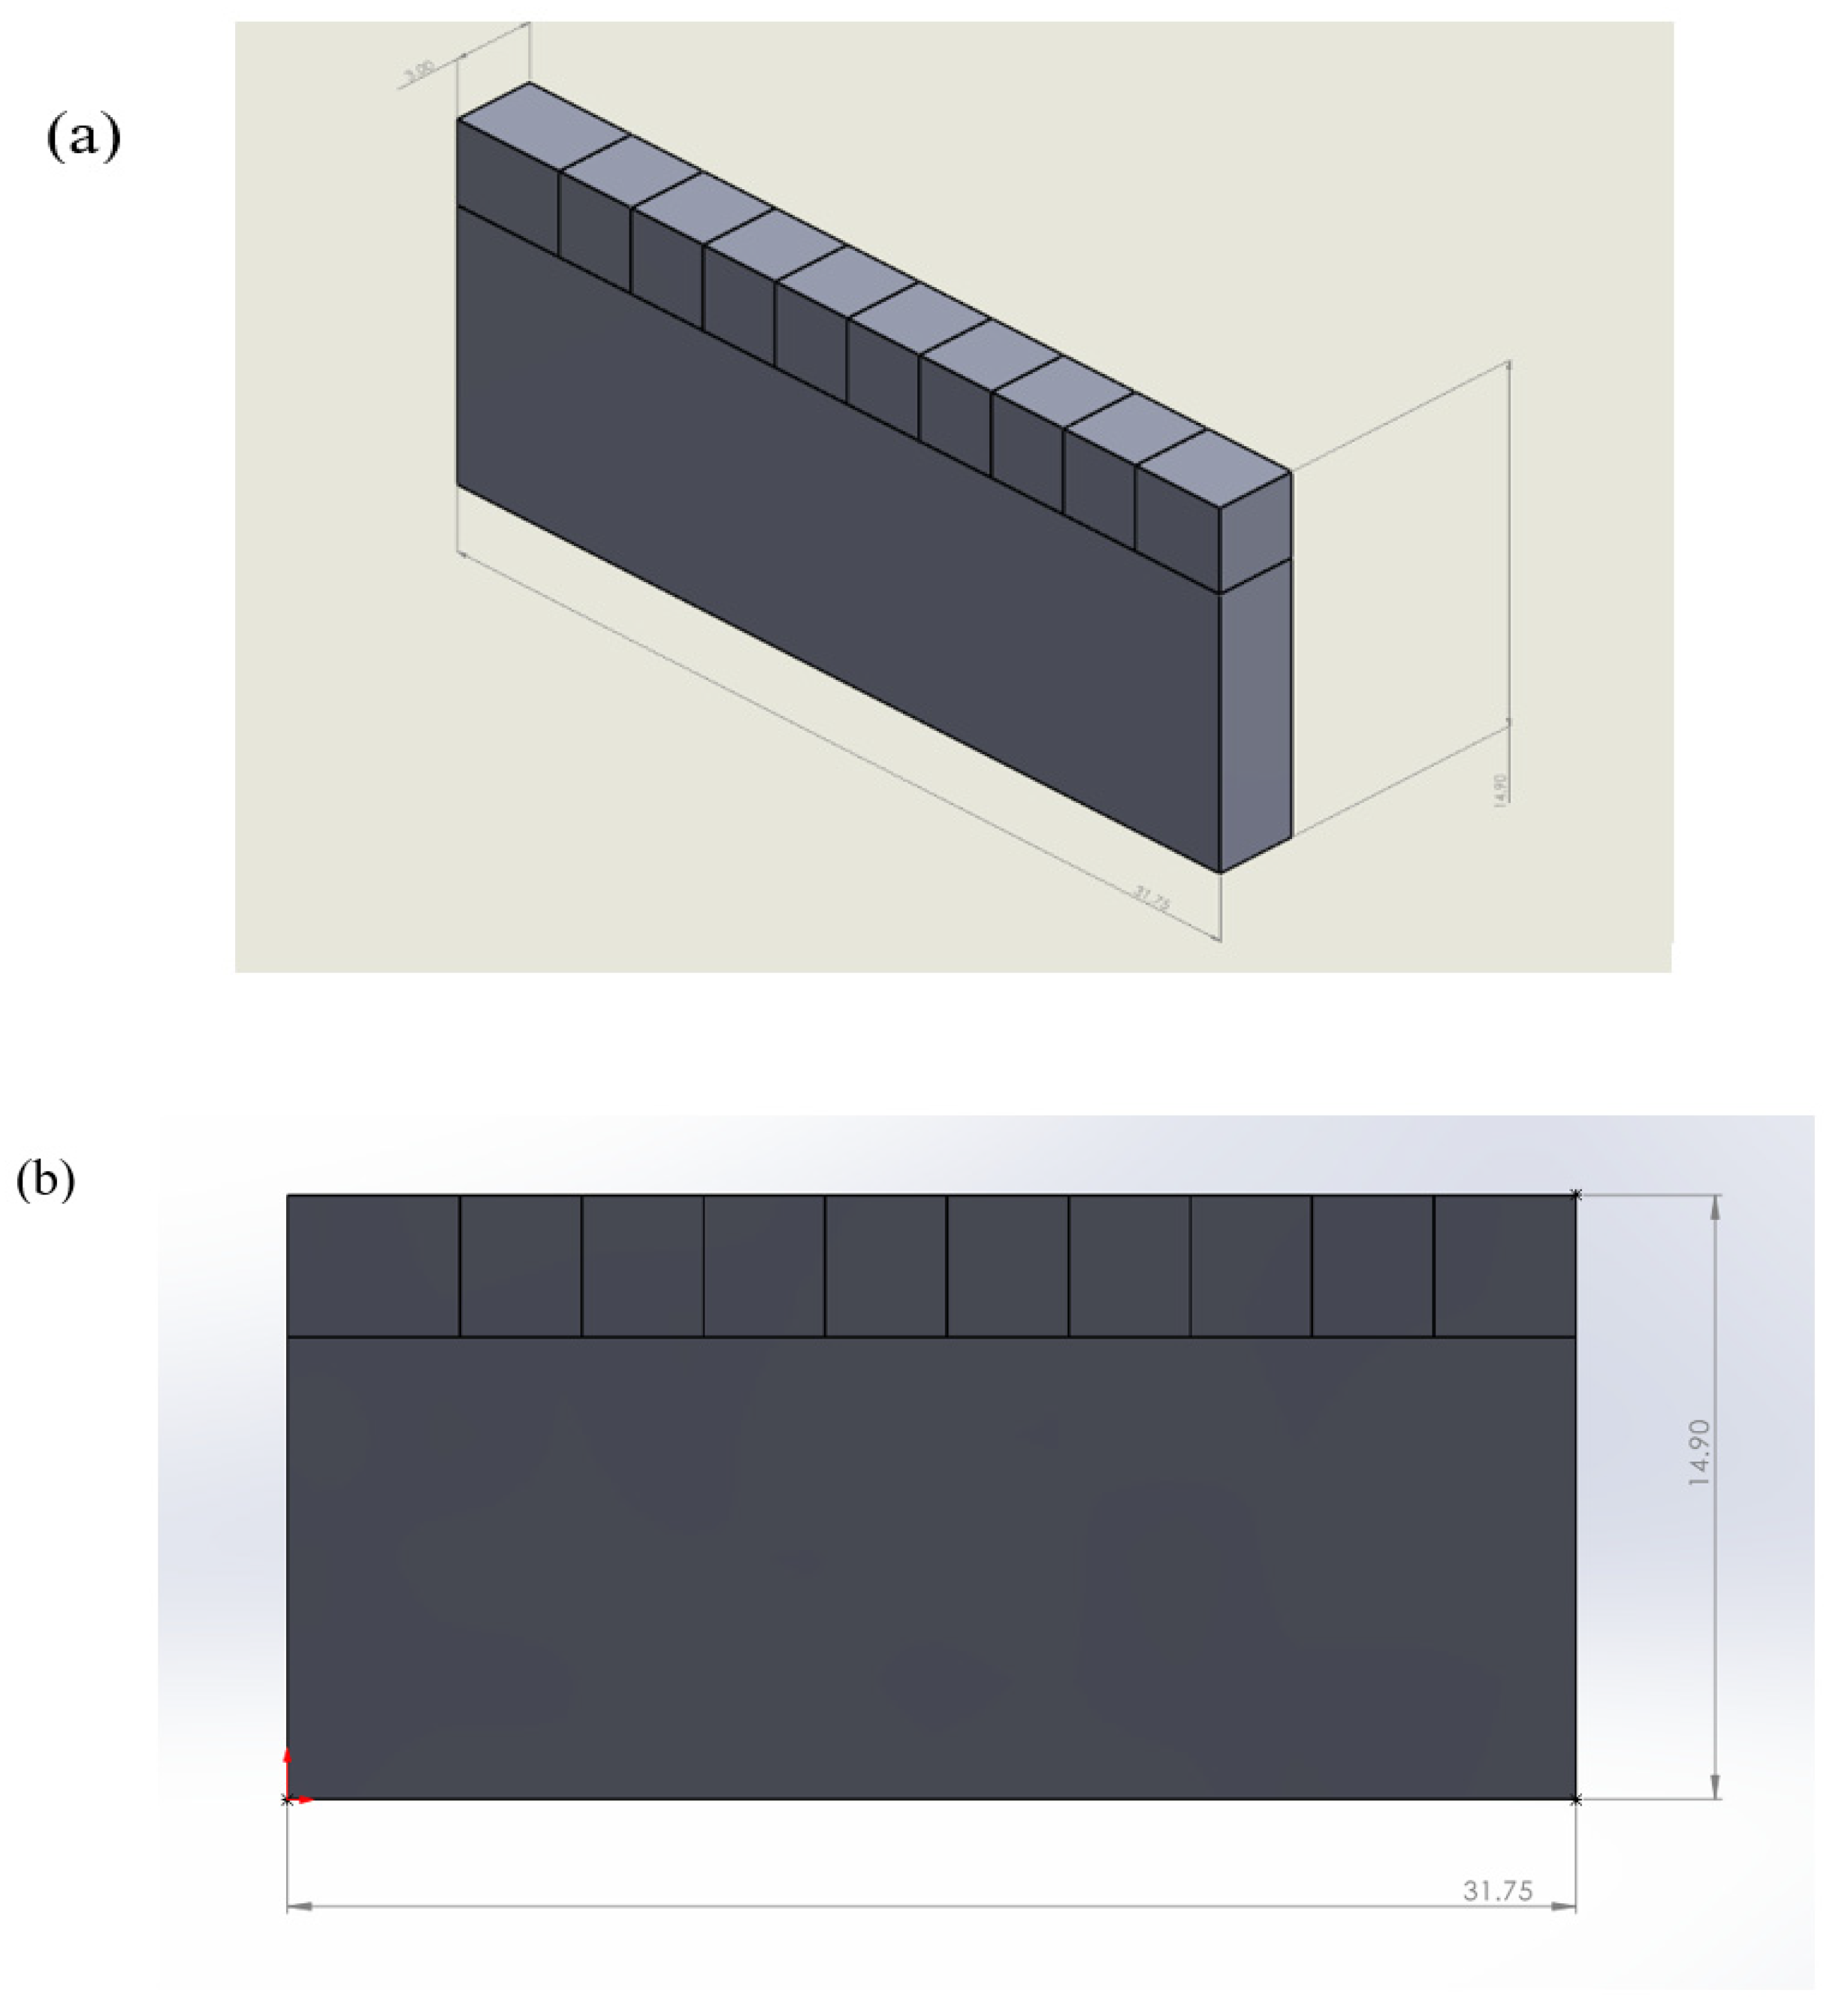
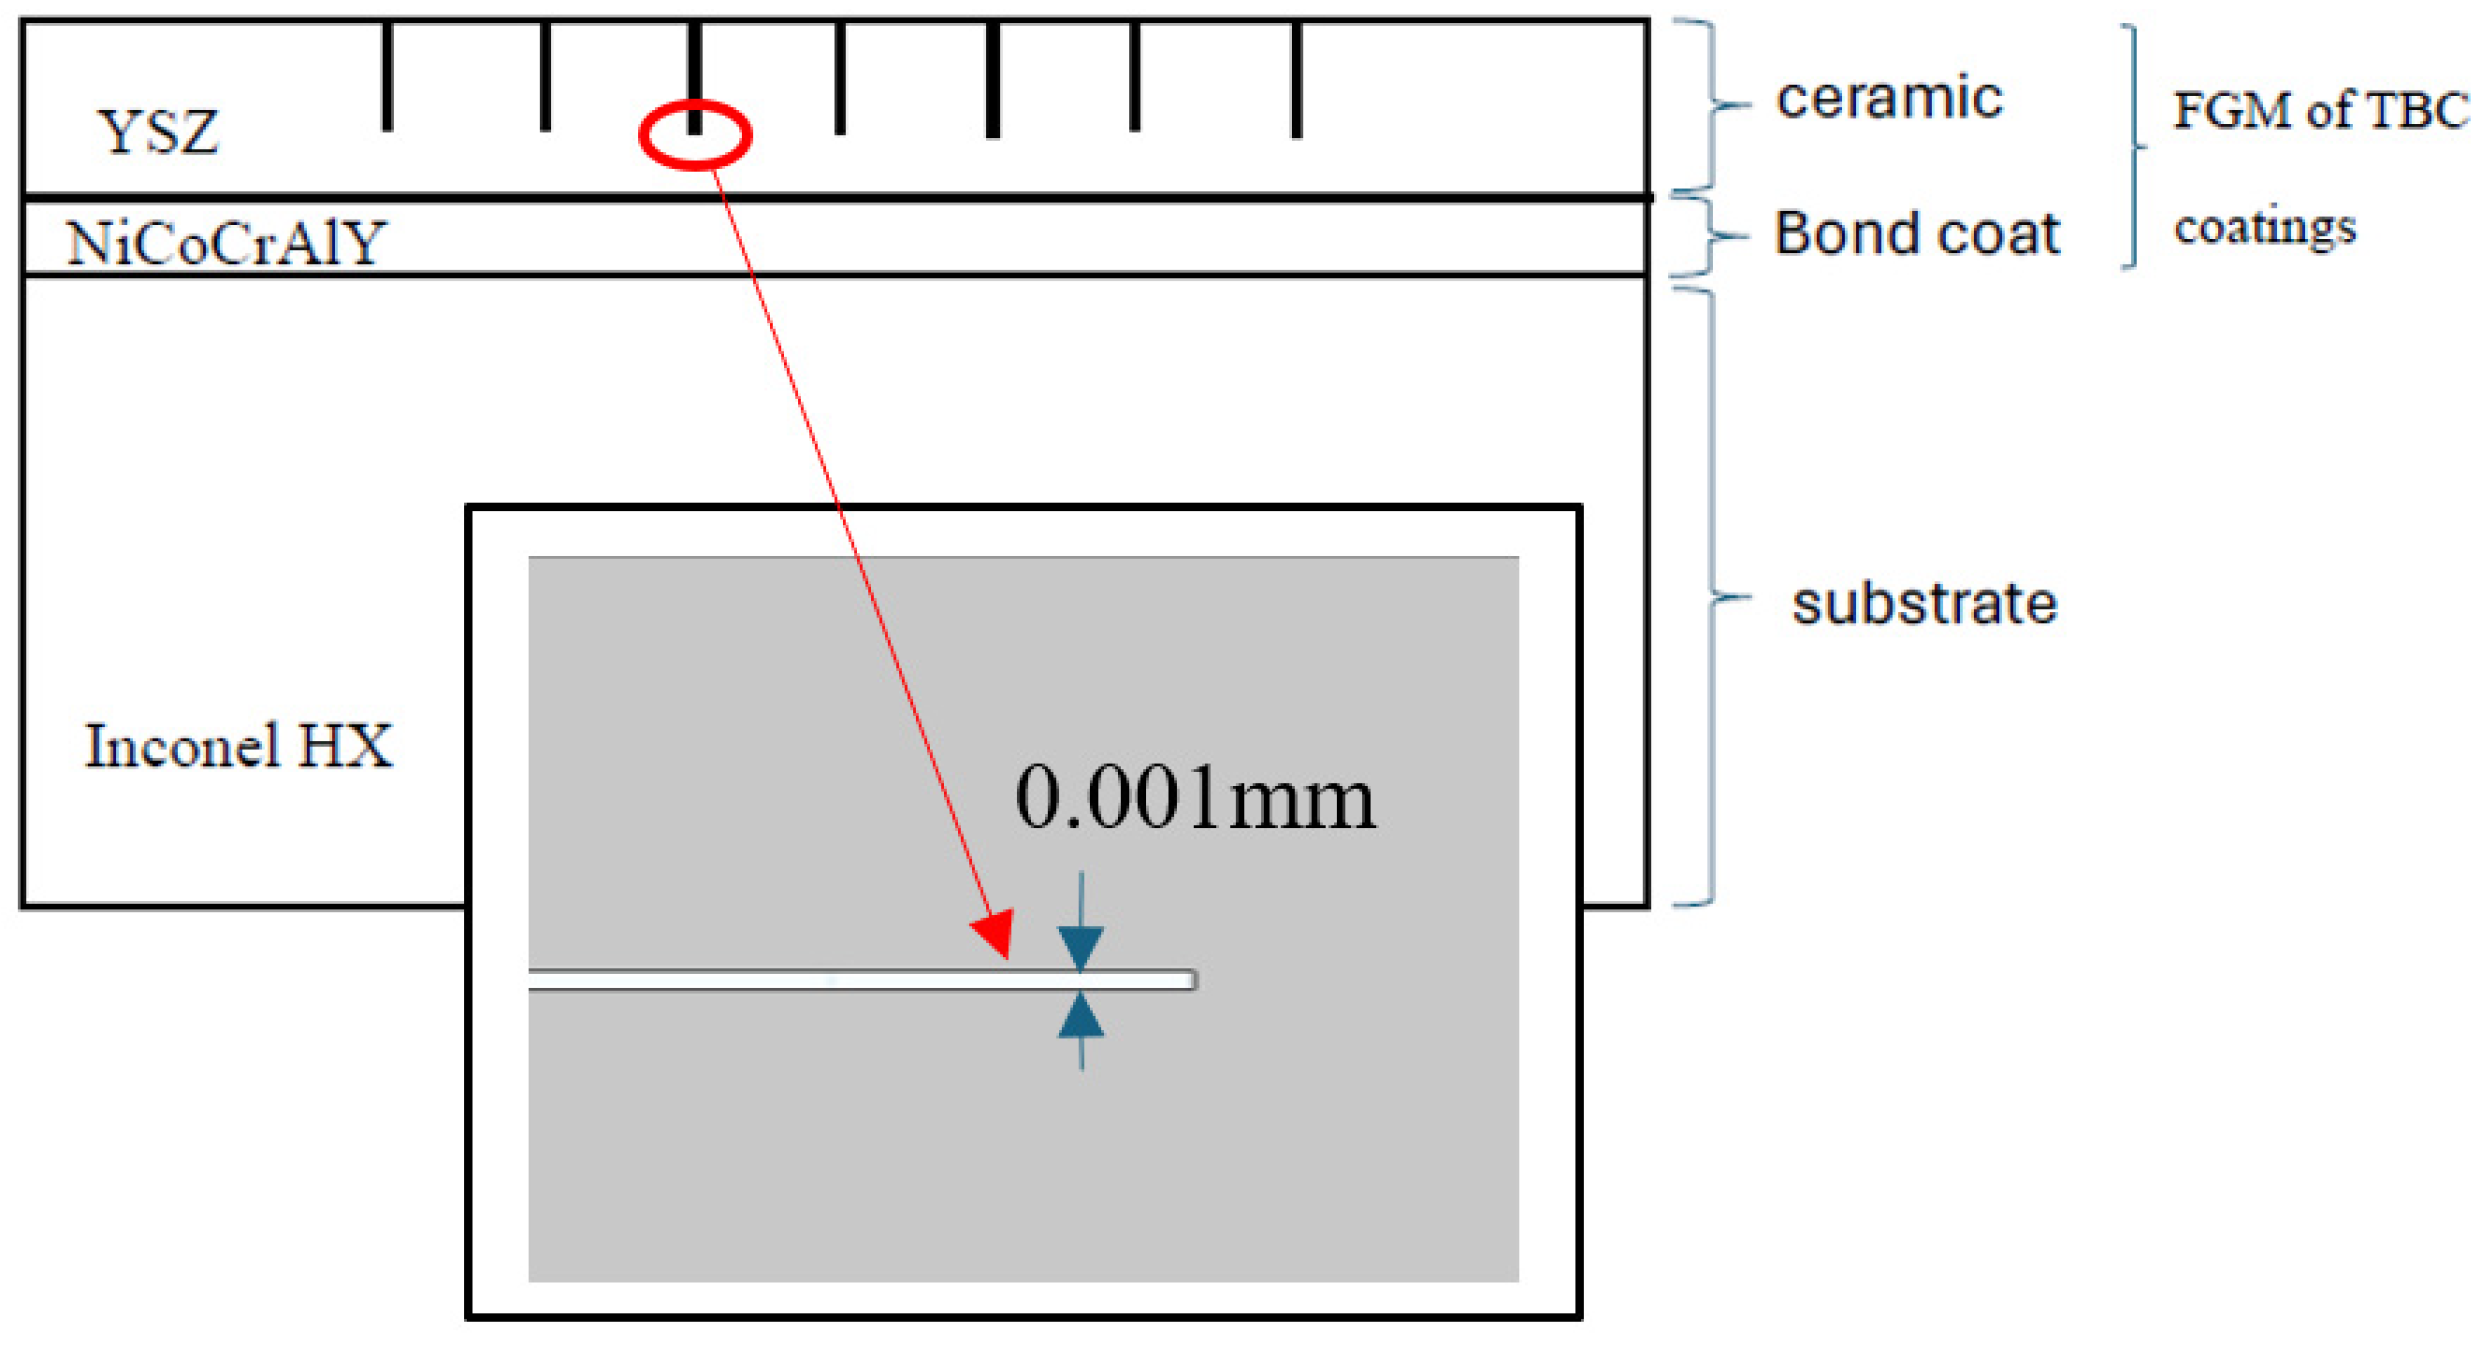
3. Coating Architecture

It was found in this study that the density of preexisting cracks and their length influenced the SIF value and tensile stress on the TBC coatings. The volume fraction also affected the SIF value and tensile stress. Cho et al. (2000) [3] simulated the thermoelasticity condition of a two-phase model using finite element analysis. In this study, the distributions of mechanical properties were classified using the linear rule of mixture, the modified rule of mixture, and the Wakashima–Tsukamoto method, all accurate when compared to the finite element method.
Kim and Paulino (2002) [22] said that the APS method could be used for isotropic TBC coatings. In this study, the main material mixtures used were isotropic. Kokini et al. (2003–2004). Refs. [9,23,24] showed that TBC coatings with an isotropic FGM structure had better mechanical properties than traditional ceramic-bond coatings. In this study, the FGM was 100% YSZ, gradually changing to 100% NiCoCrAlY on the bottom of the bond coat. The optimization of nonlinear and linear distribution was also compared.
The mechanical properties varied with temperature and are shown in Table 1. The data shown in the table were used for the volume fraction calculations. The linear rule of mixture formulas is shown below:
V m ( y ) = [ ( d G y ) / 2 d G ] N V c ( y ) = 1 V m ( y )
The mechanical properties are evaluated using the Wakashima–Tsukamoto method [3]:
K = K m + a V c K m ( K c K m ) V m K c + a V c K m
μ = μ m + b V c μ m ( μ c μ m ) V m μ c + b V c μ m
E = 9 K μ / ( 3 K + μ )
v = ( 3 K 2 μ ) / 2 ( 3 K + μ )  
α = α m + ( 1 K 1 K m ) ( α c α m ) 1 K c 1 K m
a = K c ( 3 K m + 4 μ m ) / K m ( 3 K + 4 μ c )  
b = μ c ( 1 + e ) / ( μ m + e μ c )  
e = ( 9 K m + 8 μ m ) / ( 6 K m + 12 μ m )
k = V m k m + ( 1 V m ) k c
ρ = V m ρ m + ( 1 V m ) ρ c
c p = V m c m + ( 1 V m ) c c
Vm: the volume fraction of the second component; Vc: the volume fraction of the first component; dG: thickness/2.
G: shear modulus; E: Young’s modulus; ρ: Poisson’s ratio; α: the thermal expansion coefficient; k: thermal conductivity; cp: specific heat; d: thickness of the coatings; K: bulk modulus; N: the volume fraction of the first layers. Figure 2 exhibits the variation of volume fraction in the FGM model.
In this research, the stress distribution of traditional TBC coatings based on the research of Kokini et al. [23,24] is compared to functionally graded TBC coatings. The TBC structure of both models is presented in Figure 3. In this case, the width of preexisting crack tips is assumed to be 0.001 mm, which is the same as the distance from the first node to the second node of the quadrilateral element on the crack tip. The finite element model will be described in detail in Section 7.

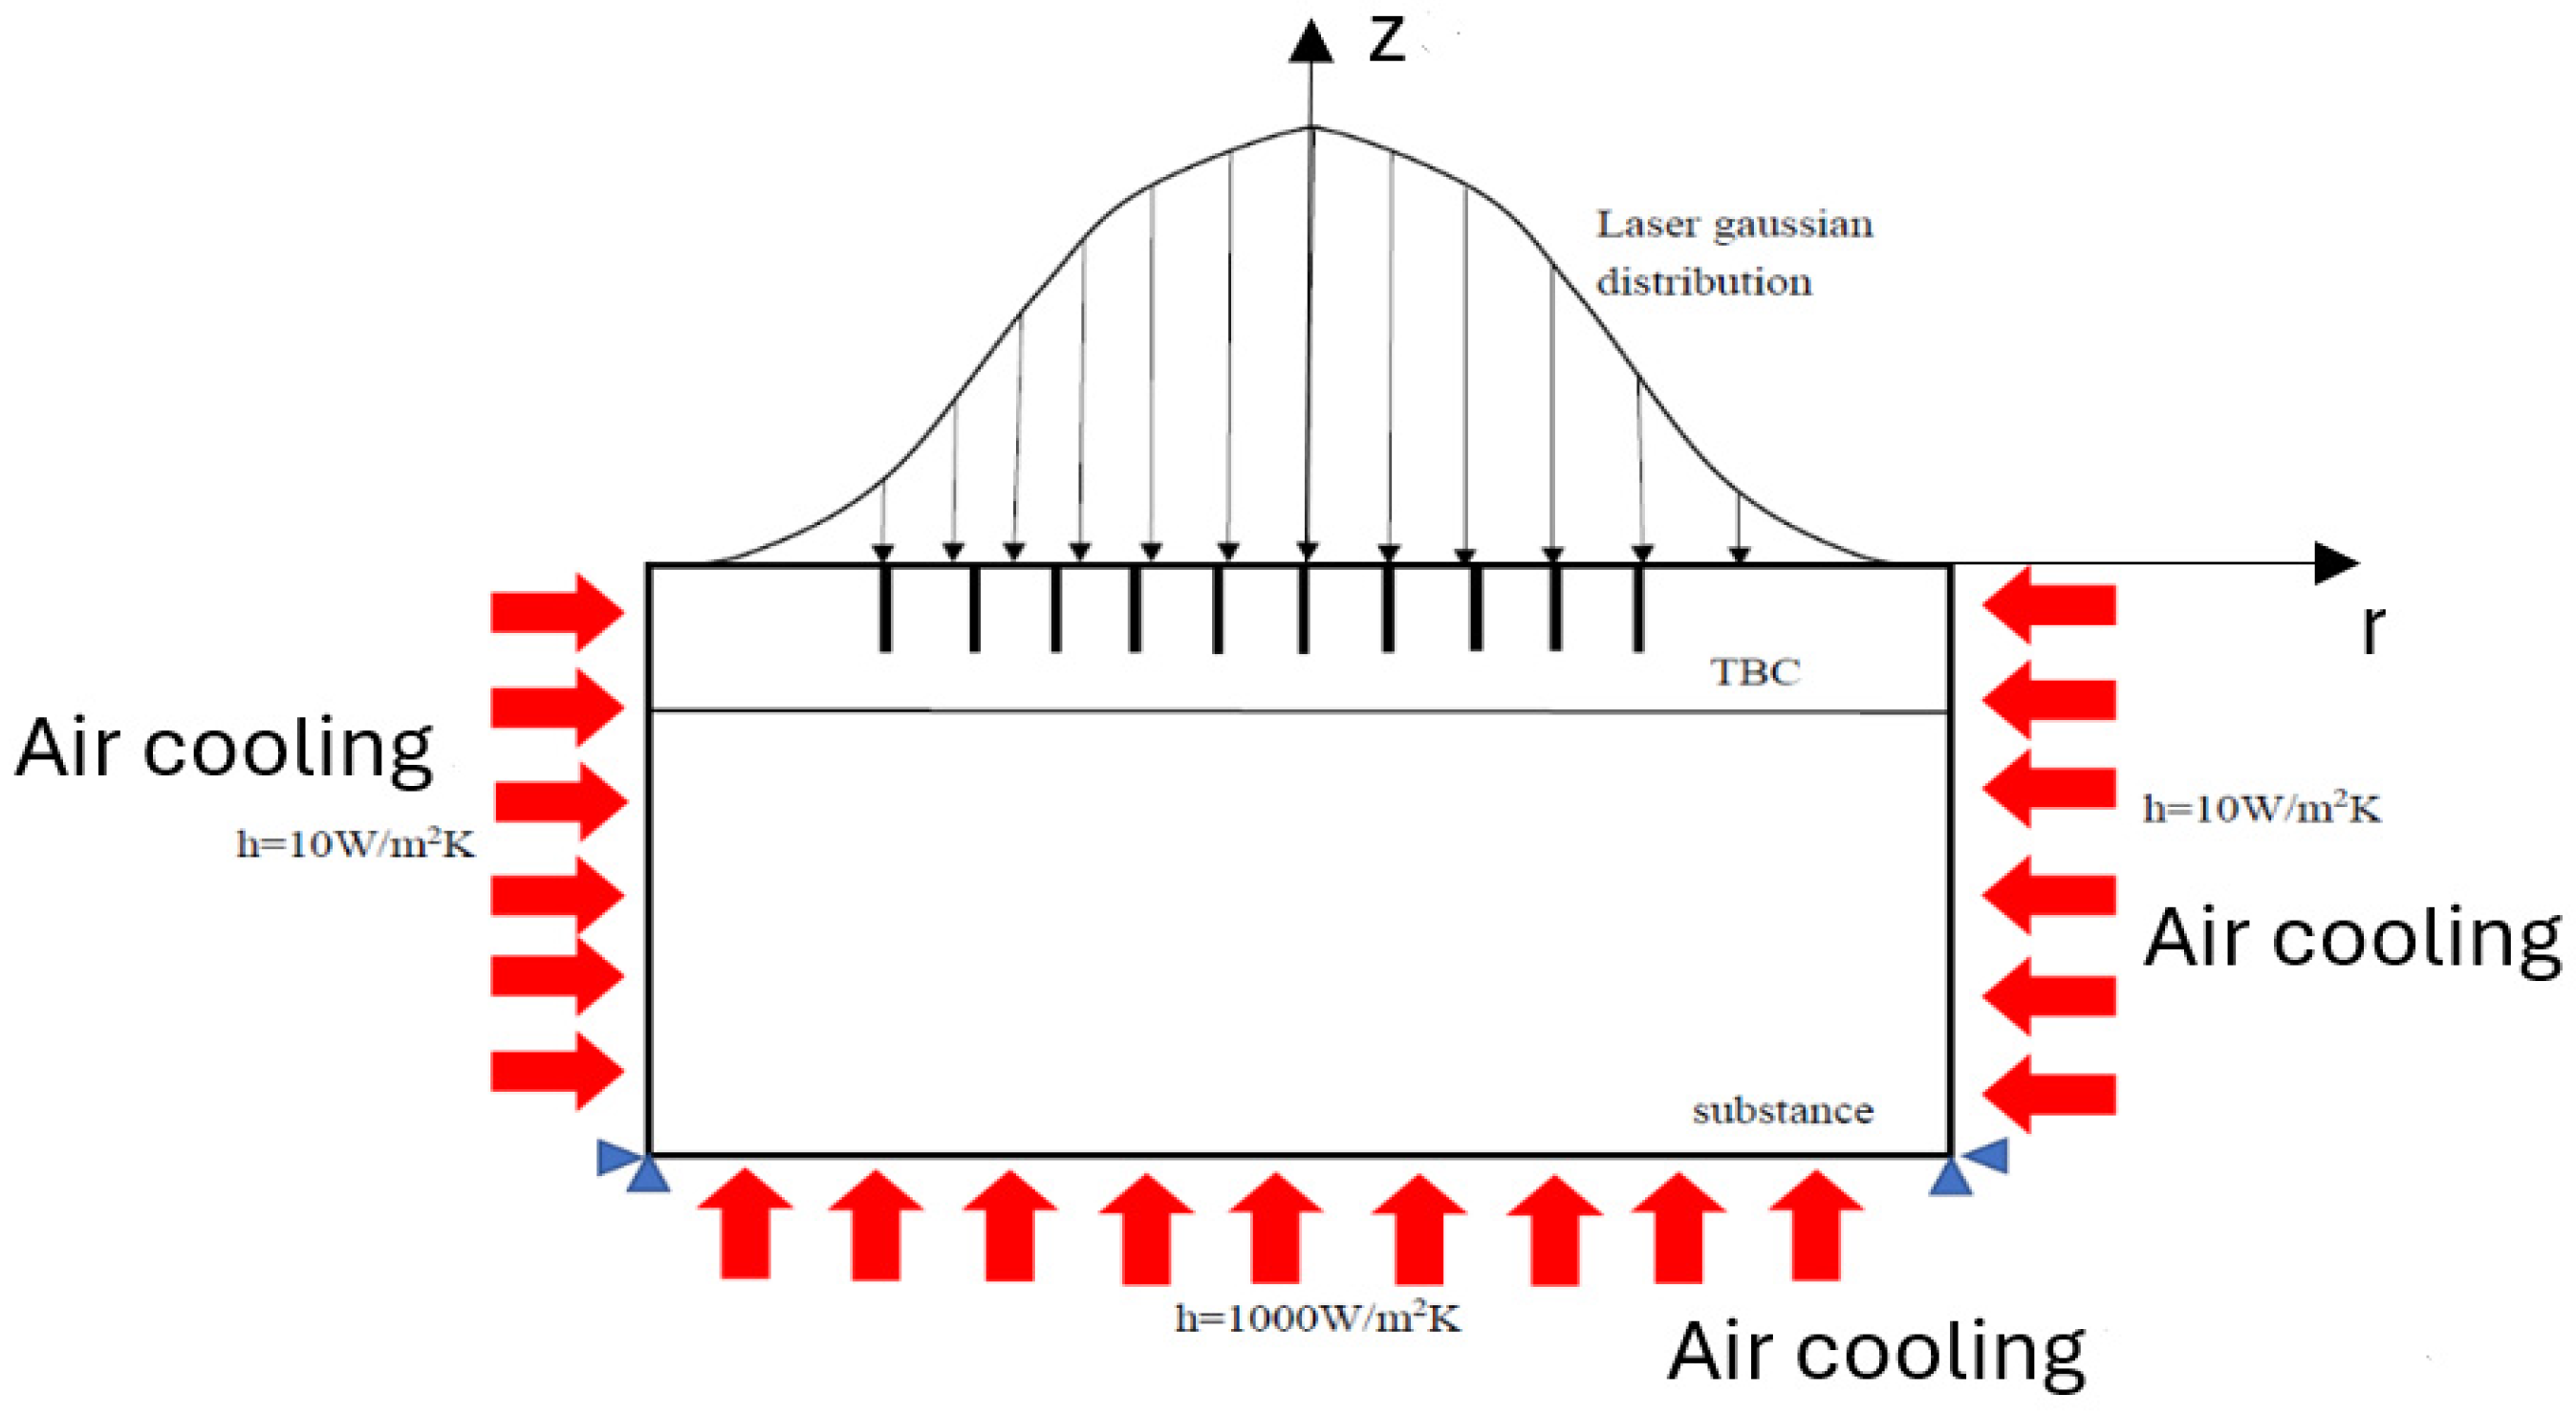
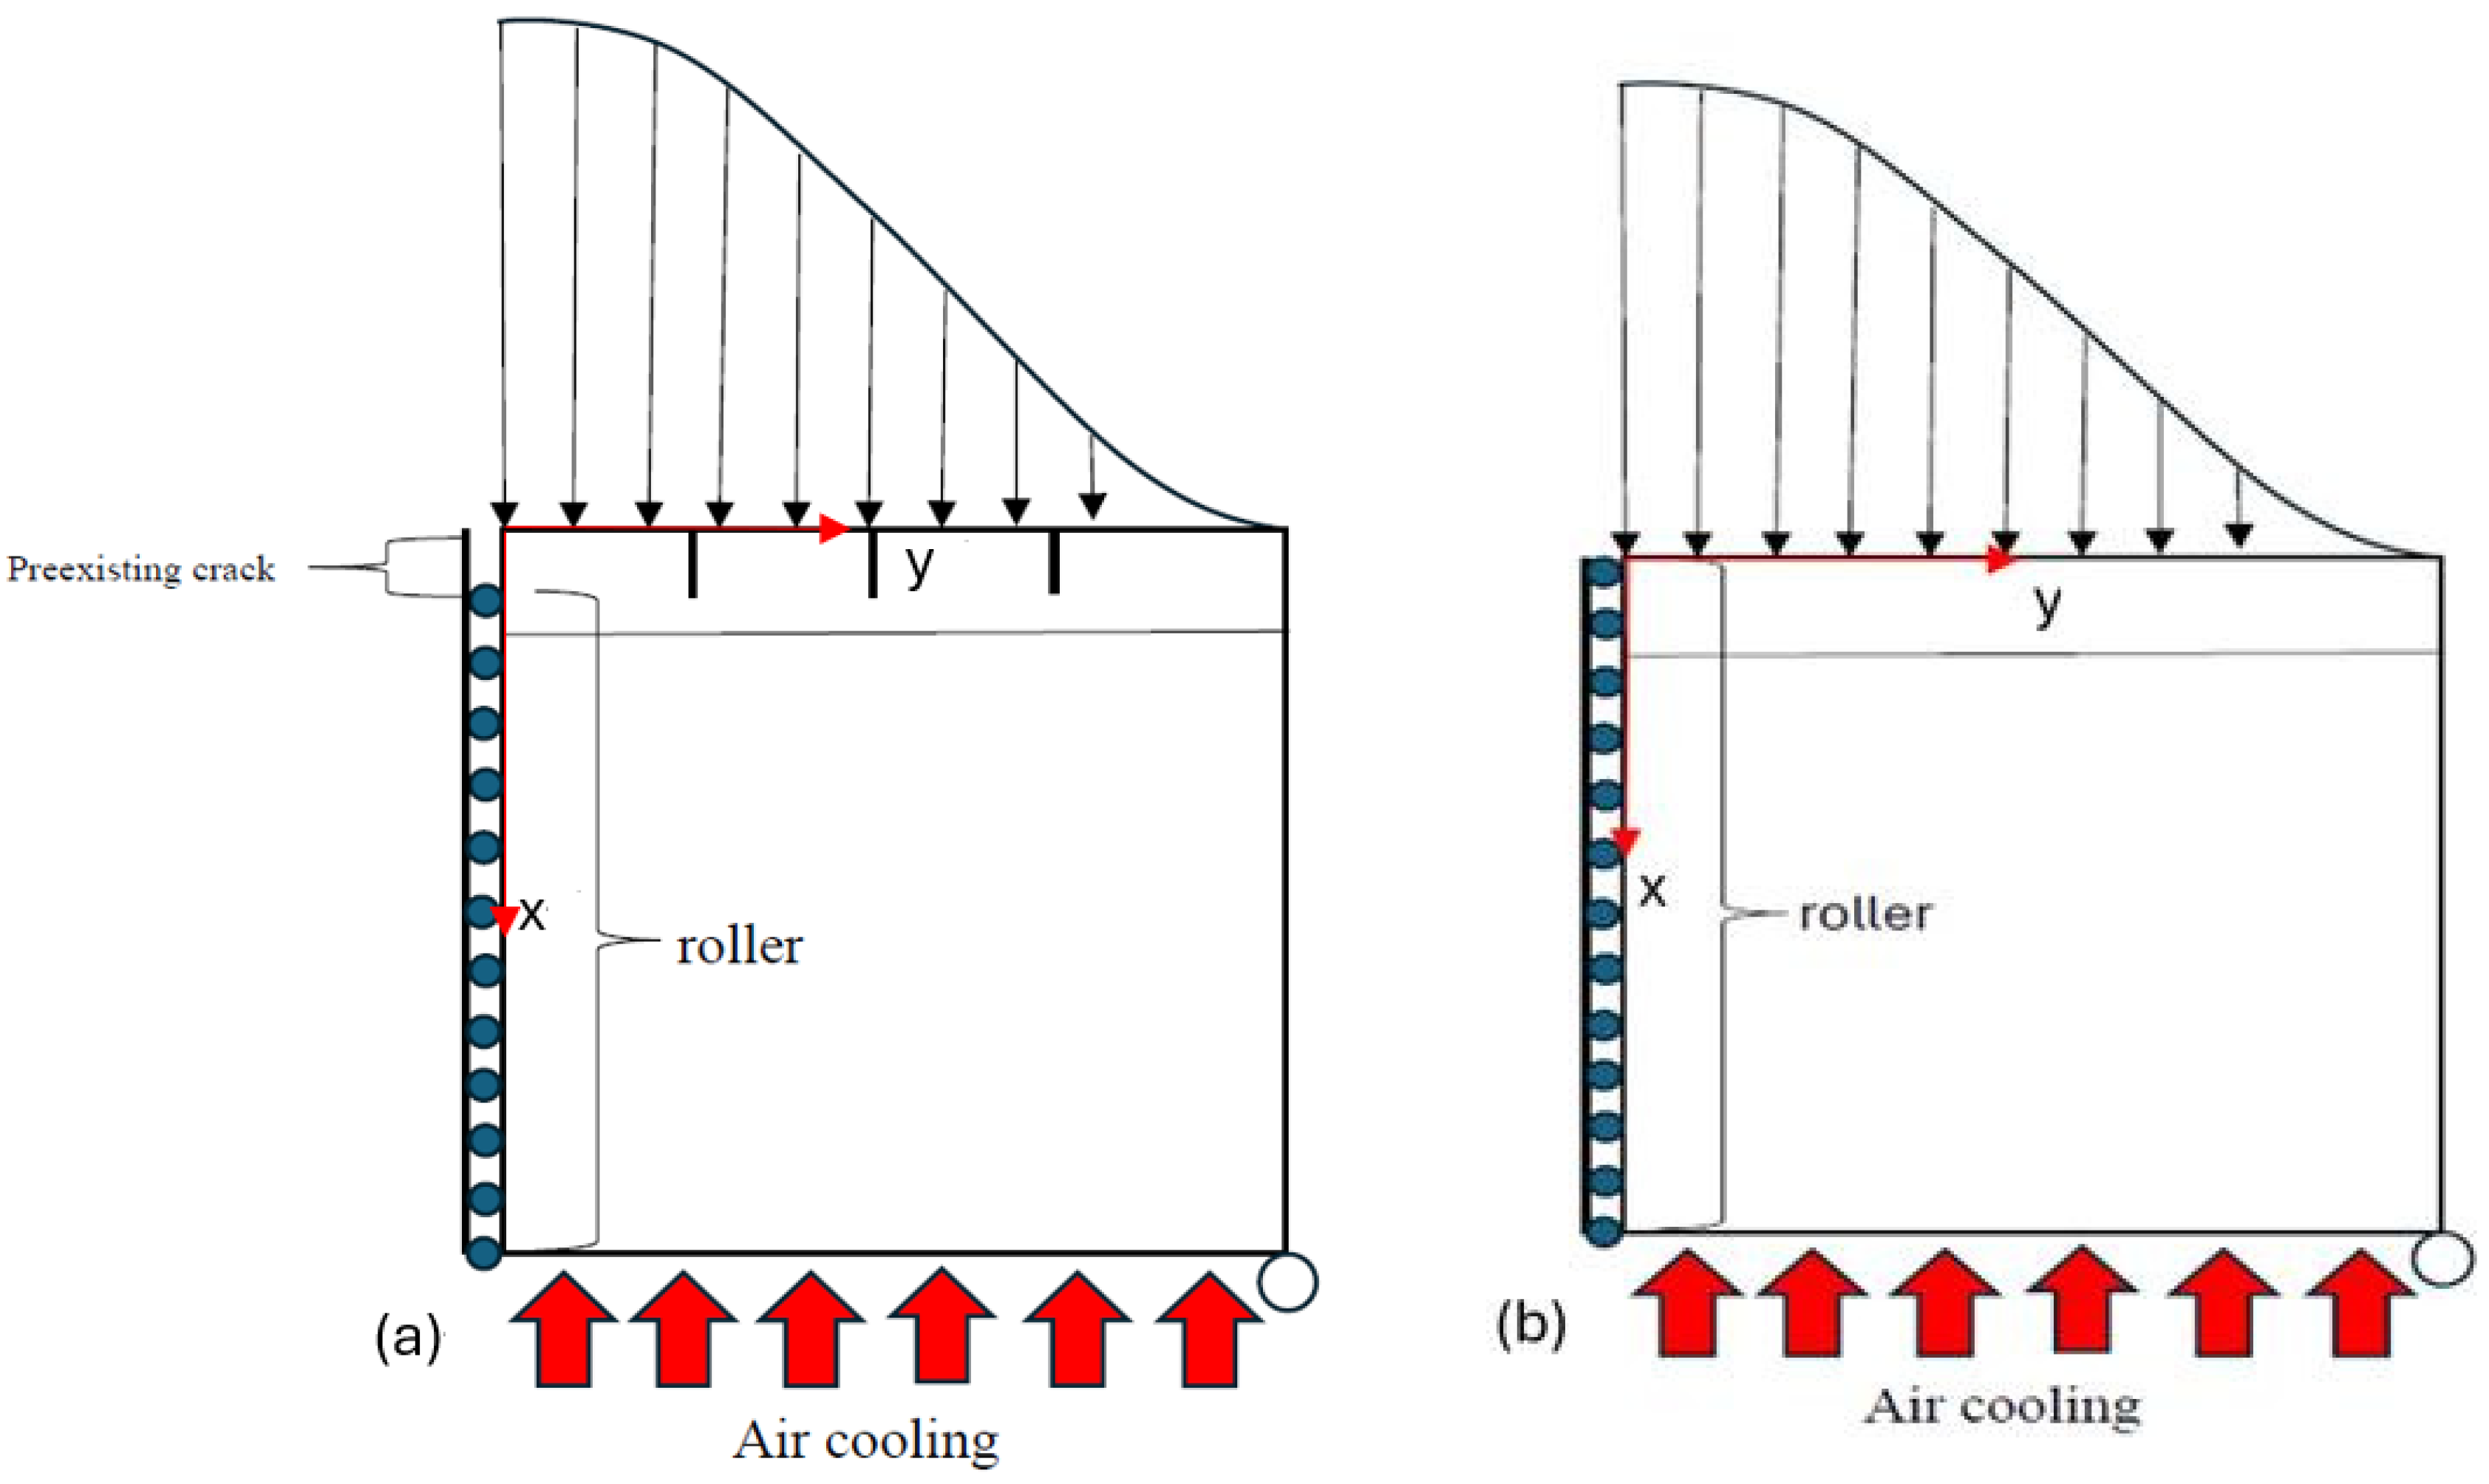
4. The Construction of Pulsed Laser Boundary and the Air-Cooling Conditions

Thermal shock testing is a very common experiment used in thermal resistance studies, especially for those involving ceramic materials. In one such experimental procedure, part of the test object is heated by a pulsed CO2 laser, while the other parts are cooled by water or air. Temperature variation on the object is monitored using a thermal imaging system. Kokini et al. (2008) [25] simulated thermal fatigue failure in turbine blades using thermal shock testing, where the air-cooling thermal convective coefficient boundary was h = 1000 W/m2K. In this study, thermal shock was applied to a plane strain model, as shown in Figure 4. The heating boundary was a Coherent model C-20 60W CO2 laser (Coherent Inc., Saxonburg, PA, USA), which was used to heat the surface of the object for 4 s. This raised the surface temperature of the object (from room temperature) to 1400~1500 °K. Water cooling was used on the bottom of the test object, and the other boundaries, front, back, and sides, were cooled by air, with h = 10 W/m2K. The sample was constrained by simple support, and no external forces were applied.
The shape of the pulsed laser heating boundary was Gaussian when the absorption was dependent on the skin depth of the thermal barrier coating. The thermal equation can be demonstrated by an axisymmetric model:
Q ( r , z , t ) = I 0 ( 1 R ) e x p ( z δ 2 r 2 a 2 ) f ( t ) / δ
f ( t ) = u ( t ) u ( t 4 ) R = ( n 1 ) 2 + k 2 ( n + 1 ) 2 + k 2   , δ = λ 4 π k .
R: the reflectivity of laser energy; I0: the maximum power of the pulsed laser; δ: skin depth; u(t): time step function; Q (r, z, t): heat transfer function; f(t): delta function; a: the spot radius of pulsed laser.
In Equation (4), the reflectivity of laser energy is a function of the refractive index (n) and the extinction coefficient (k). The refractive index describes how light propagates through a medium, while the extinction coefficient quantifies the absorption of light within the medium. The wavelength of the CO2 laser was 10.64 µm. Dombrovsky et al. [27] calculated the reflectance and emissivity of YSZ material and subsequently performed a curve fit to describe the relationship between the two variables:
ε = 1 R 1 R exp ( φ h ) [ 1 e x p ( φ h ) ]
Here, φ is the absorption coefficient. When the porosity is zero, the absorption coefficient is the inverse of the skin depth. Furthermore,  ε  is the emissivity and h is the thickness of the experimental sample. However, the experimental results showed that the absorption was influenced by the ceramic porosity.
φ = φ 0 ( 1 p ξ )   ,   ξ = 9 2 2 n 4 + n 2 1 ( 2 n 2 + 1 ) 2 ,   φ 0 = 4 π k λ ,   p : p o r o s i t y
The model used in this study was based on plane strain conditions. To take the porosity of YSZ into consideration, Equation (3) was modified as follows:
Q ( x , y , t ) = I 0 ( 1 R ) e x p ( y φ 2 r 2 a 2 ) f ( t ) φ

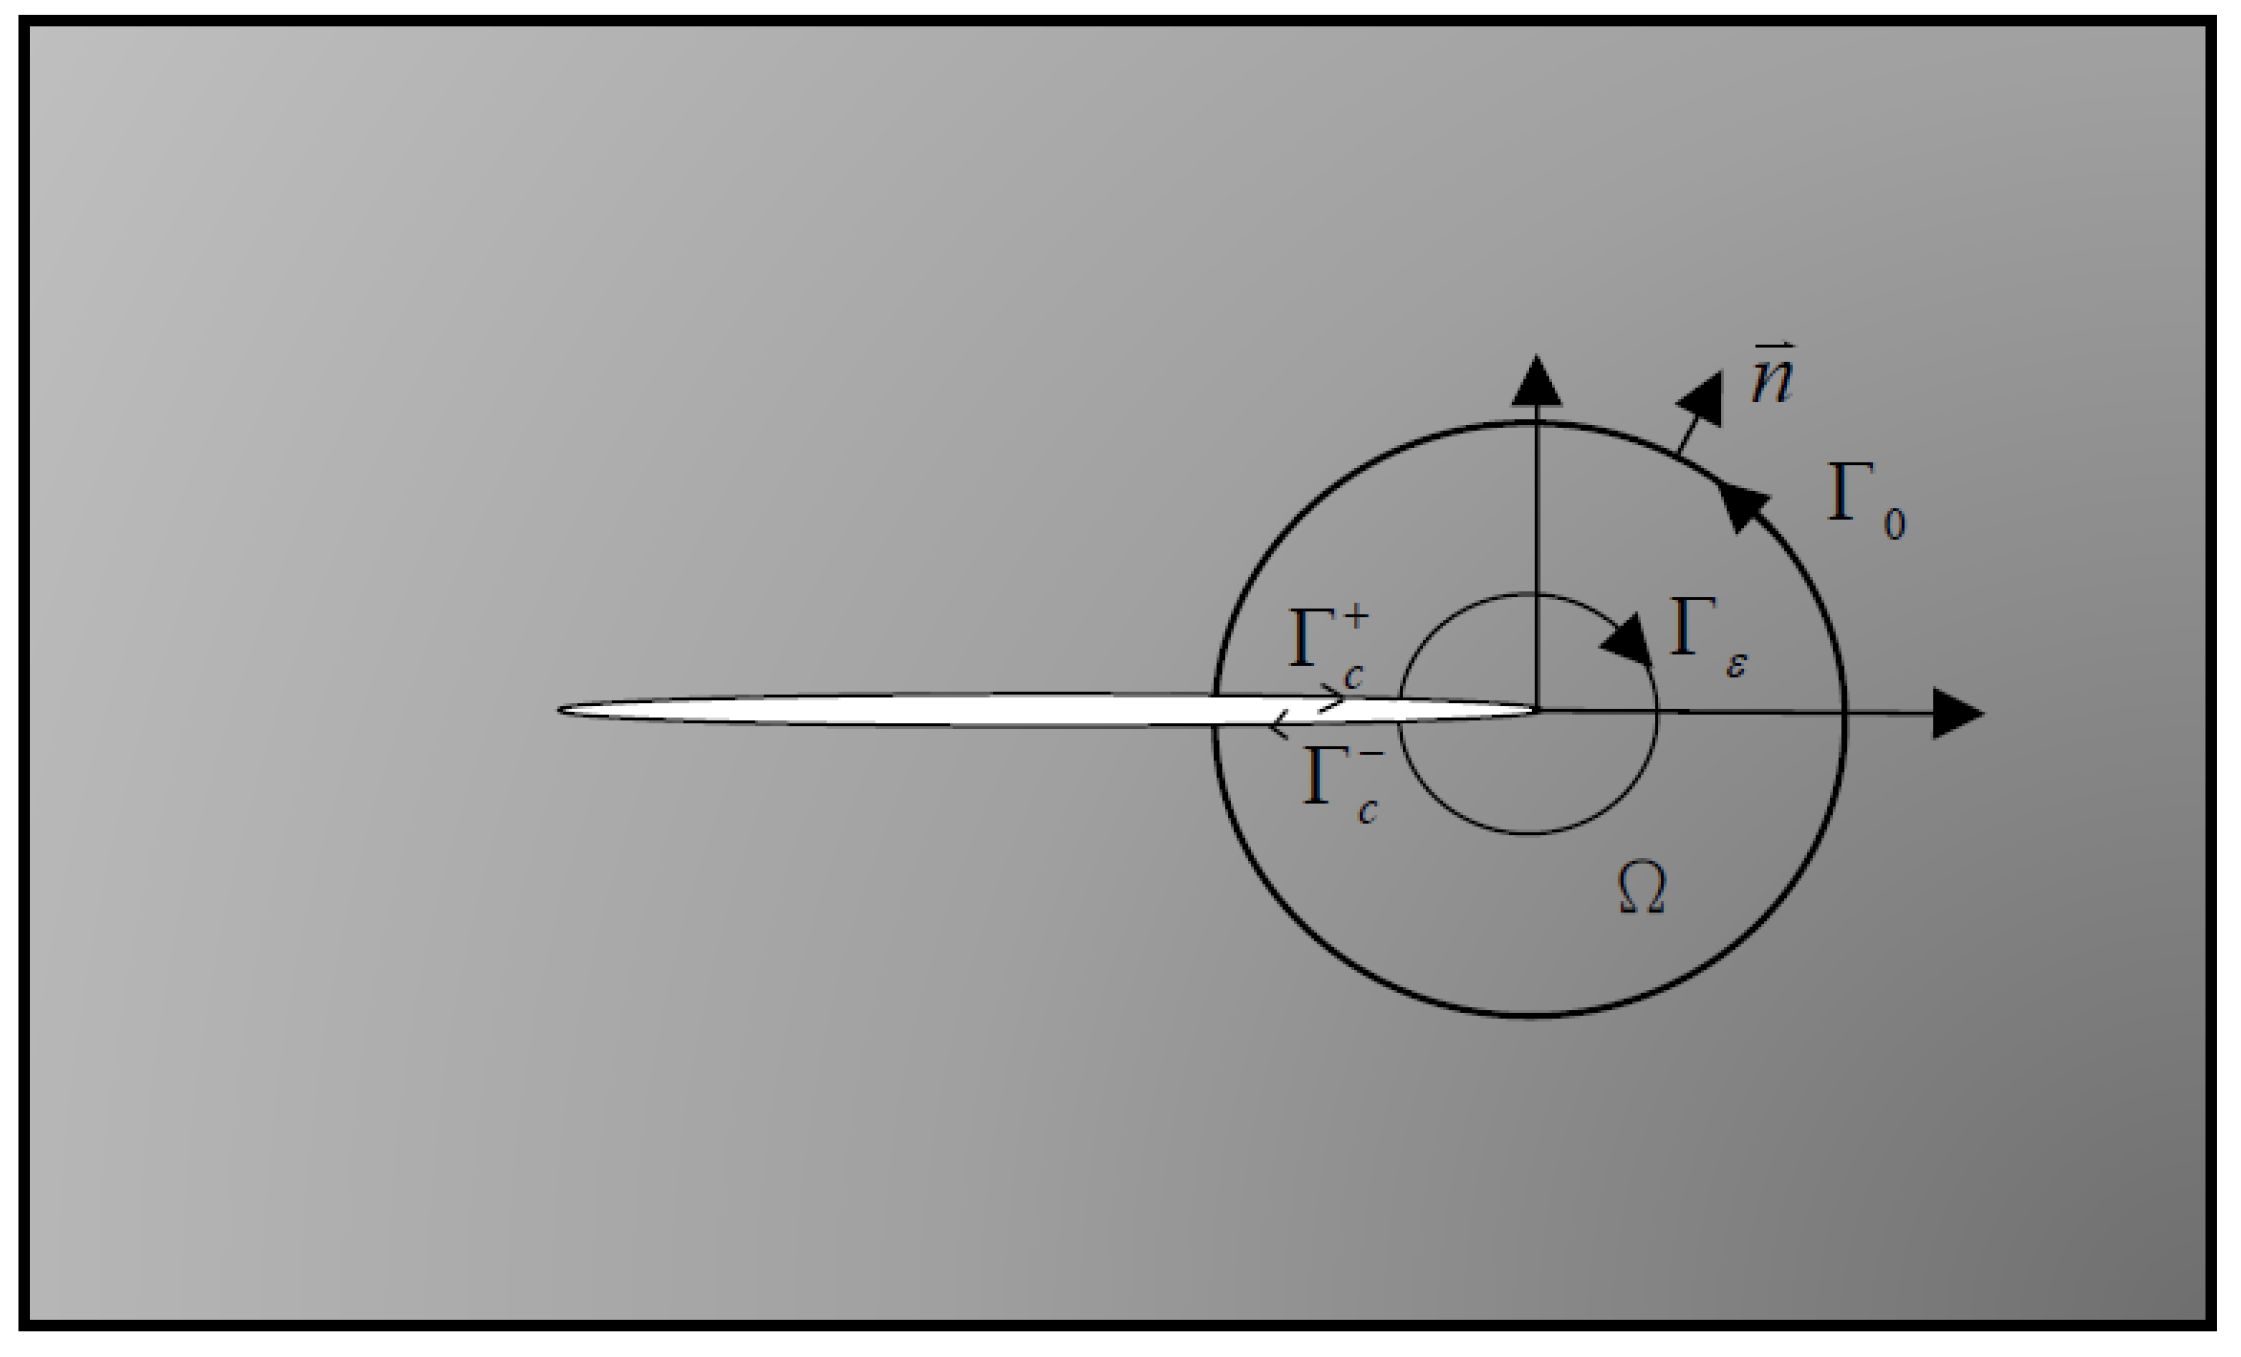
5. J-Integral for Thermally Loaded Isotropic TBC Coating

The dynamic behavior of a linear elastic material that occupies the domain Ω is modeled by the following equations for the stresses σ, the strain  ε , and the displacements u, which hold for every point in Ω.
σ + b = ρ u
ε ( u ) = 1 2 ( u + ( u ) T )
σ = C ε = λ ( t r   ε ) + 2 μ ε
In the previous equations, b represents the body force and ρ the material density. As for λ and μ, these are called Lame’s constants. They are related to the parameters E and ν, respectively, the material Young’s modulus and Poisson’s ratio:
E = μ ( 2 μ + 3 λ ) μ + λ
υ = λ 2 ( μ + λ )
According to the static problem of elasticity in the absence of body force, Equation (8) would be transformed into the equation below due to the quasi-static stress equilibrium,
σ = 0
Considering the heat conduction from the pulsed laser boundary, the constitutive equation for isotropic linear thermoelasticity, which expresses strain in terms of stress and temperature change, is,
ε i j = 1 + υ E σ i j υ E σ k k δ i j + α Δ T δ i j
Based on the linear elastic fracture mechanics (LEFM) theory, the SIF value of the preexisting model was evaluated. The plane strain model was used to simplify the simulation process. The stress–strain relationship was evaluated, and the model was analyzed under thermoelasticity conditions.
ε 11 ε 22 ε 12 = 1 υ 2 E υ ( 1 + υ ) E 0 υ ( 1 + υ ) E 1 υ 2 E 0 0 0 1 2 G σ 11 σ 22 τ 12 + α Δ T 1 + υ 1 + υ 0
The strain energy density of thermoelasticity can be shown as
W = 1 2 σ i j ( ε i j α δ i j Δ T ) + 1 2 σ 33 ( α Δ T ) ( i ,   j = 1 ,   2 )
The J-integral method was used to calculate the energy release rate and SIF value. The calculating process was an integration around the crack, avoiding the stress singular point of the crack tip.
It is considered the kinetic equation of crack tips and is defined in terms of the elastic and kinetic energy densities, respectively [28].
J k = lim Γ ε 0 Γ ε ( ( W + T ) n k σ i j n j u i , k ) d s ( i ,   j ,   k = 1 ,   2 ) W = 1 2 σ i j ε i j ,   T = 1 2 ρ u i · u i ·
However, preexisting cracks’ propagation is not considered in this study. Kinetic energy is neglected. Eischen (1986) [29] calculated SIF using the J-integral method for anisotropic and isotropic material. The J-integral value in the 2D plane is shown with strain energy density, stress, and displacement as follows:
J k = lim Γ ε 0 Γ ε ( W n k σ i j n j u i , k ) d s ( i ,   j ,   k = 1 ,   2 )
where  n k (k = 1,2) is the vertical vector on the integral path, and the relation of the SIF and the J-integral on the crack tip is shown below,
J 1 = ( κ + 1 ) ( 1 + υ t i p ) 4 E t i p ( K Ι 2 + K Ι Ι 2 ) J 2 = ( κ + 1 ) ( 1 + υ t i p ) 2 E t i p K Ι K Ι Ι
κ 4 1 + υ t i p 1 ( plane   stress ) 3 4 υ t i p ( plane   strain )
where  E t i p  and  υ t i p  are the elastic modulus and Poisson’s ratio on the crack tip, respectively. The integral path of the J-integral was calculated using the finite element method (see Equation (18)), and the SIF can be determined using Equation (19a). Figure 5 presents the closed path around the crack tip. The closed path integration is represented below:
Γ ( W n k σ i j n j u i , k ) d Γ Ω ( W , k ) exp l d Ω = 0 ( Γ = Γ 0 + Γ + + Γ + Γ ε )
where  ( W , k ) exp l  is the constant partial differentiation of strain energy density, and the variables include material properties and temperature parameters. The closed path includes the outer path  Γ 0 , the crack tip path  Γ + , the button path of the crack tip  Γ  and the very small path on the crack tip  Γ ε .
Then, the relationship between J-integral and strain energy density can be further transformed:
J k = Γ 0 + Γ + + Γ ( W n k σ i j n j u i , k ) d Γ Ω ( W , k ) exp l d Ω
and  K Ι  and  K Ι Ι  can be calculated using the J-integral:
K Ι = ± E J 1 2 1 ± 1 J 2 J 1 2 1 / 2
K Ι Ι = ± E J 1 2 1 ± 1 J 2 J 1 2 1 / 2
E E t i p ( plane   stress ) E t i p 1 υ t i p 2   ( plane   strain )

6. Displacement Correlation Technique (DCT)

The DCT method calculation is based on the crack opening displacement (COD) and crack sliding displacement (CSD) SIF equations. The stress and strain field must be evaluated before the COD and CSD are calculated. Sollero et al. (1993) [30] used the equations below and the Airy stress function for compatibility relationships:
a 11 μ 4 + ( 2 a 12 + a 66 ) μ 2 + a 22 = 0
a 11 = a 22 = 1 υ 2 E   ,   a 12 = a 21 = υ ( 1 + υ ) E   ,   a 66 = 1 2 G
where  μ  is the complex root of Equation (25), and G is shear modulus; then the stress functions and displacements can be depicted as
u 1 = 2 Re p 1 ϕ 1 ( z 1 ) + p 2 ϕ 2 ( z 2 ) u 2 = 2 Re q 1 ϕ 1 ( z 1 ) + q 2 ϕ 2 ( z 2 )
p j = a 11 μ j 2 + a 12 a 16 μ j q j = a 12 μ j a 26 + a 22 μ j   ( j = 1   ,   2 )
z 1 = x + μ 1 y z 2 = x + μ 2 y
where  ϕ 1 ( z )  and  ϕ 2 ( z )  are the stress functions around a crack, and  μ 1  and  μ 2  are the roots of the positive image function from Equation (25). Liebowitz et al. (1968) [31] showed that stress functions could be determined using the SIF:
ϕ 1 ( z ) = μ 2 k 1 k 2 2 π ( μ 1 μ 2 ) z 1 2 ϕ 2 ( z ) = μ 1 k 1 + k 2 2 π ( μ 1 μ 2 ) z 1 2
Then, Equation (19) can become Equation (23) and
u 1 = k 1 2 r π Re 1 μ 1 μ 2 μ 1 p 1 cos θ + μ 2 sin θ μ 2 p 1 cos θ + μ 1 sin θ   + k 2 2 r π Re 1 μ 1 μ 2 p 2 cos θ + μ 2 sin θ p 1 cos θ + μ 1 sin θ
u 2 = k 1 2 r π Re 1 μ 1 μ 2 μ 1 q 1 cos θ + μ 2 sin θ μ 2 q 1 cos θ + μ 1 sin θ   + k 2 2 r π Re 1 μ 1 μ 2 q 2 cos θ + μ 2 sin θ + q 1 cos θ + μ 1 sin θ
where r is the radius from crack tip, and θ is the angle of polar coordinates. Then, because the DCT method is used to calculate the SIF from the crack opening, Equations (31a) and (31b) are limited between θ = ±π. The equations are shown below:
u 1 u 2 = 2 r π D 11 D 12 D 21 D 22 k 1 k 2
D 11 = Im μ 2 p 1 μ 1 p 2 μ 1 μ 2 ,   D 12 = Im p 1 p 2 μ 1 μ 2 D 21 = Im μ 2 q 1 μ 1 q 2 μ 1 μ 2 ,   D 22 = Im q 1 q 2 μ 1 μ 2
Kim et al. (2002) [22] analyzed the SIF value by adjusting the nodes to a quarter of the distance from the end of the crack tip, which was meshed by a triangular 6-node element when the outer surface was constructed by a quadrilateral serendipity element. The COD and CSD can be described by nodal displacement.
C O D = ( 4 u 2 , i 1 u 2 , i 2 ) r Δ a
C S D = ( 4 u 1 , i 1 u 1 , i 2 ) r Δ a
where i − 1 is the very first node close to the crack tip, i − 2 is the second node, and Δa is the width of the elements. The elements and node construction are presented in Figure 6 [22]. Equation (32) can be rewritten as Equation (35) below:
K Ι = 1 4 2 π Δ a D 22 ( 4 u 1 , i 1 u 1 , i 2 ) D 21 ( 4 u 2 , i 1 u 2 , i 2 ) D 11 D 22 D 12 D 21 K Ι Ι = 1 4 2 π Δ a D 12 ( 4 u 1 , i 1 u 1 , i 2 ) + D 11 ( 4 u 2 , i 1 u 2 , i 2 ) D 11 D 22 D 12 D 21

7. Simulation of Thermal Shock Testing

In this study, the most tensile stress distribution and the SIF of preexisting crack tips of the FGM TBC model were shown to have been reduced, and this was verified by analysis using the J-integral and DCT methods for finite element analysis. Preexisting crack distribution varied by the ratio of crack length to TBC thickness, in this case 15% and 50% of the TBC coating’s length. The single precrack model was simulated, and the SIF was evaluated first. Then, the precrack intensity was raised to 10 CPI, and the SIF value was compared to the single model result. The volume fraction was also a significant parameter in both linear and nonlinear formulations.

7.1. The Evaluation of Stress Intensity Factors

In this study, the first evaluation is the SIF of a single crack and multiple cracks calculated using the J-integral and DCT, respectively. The simulation process is performed using Comsol 6.2 Multiphysics. Due to the consideration of the calculation of the finite element and the symmetric boundary, the half model from Figure 4 is simulated rather than the whole TBC model. Figure 7a exhibits the half model with a preexisting crack, while Figure 7b exhibits the half model with a pure roller boundary. The half TBC coating model is constructed by a roller on the middle region compared to Figure 4. The surface of the preexisting crack model is traction-free, and the thermal flux is zero (insulated) when the crack is open. Furthermore, as illustrated in Figure 7, the x–y coordinate system was overlaid on the half model of the TBC coatings, with the y-axis indicating the width direction and the x-axis representing the depth. The x-axis is the direction of depth, when the y-axis is depicted as the direction of width.
On the other hand, the CO2 Gaussian laser boundary of the TBC coating model is calculated using Equation (5). Considering the skin depth of YSZ, the CO2 Gaussian laser is depicted by the 2D heat flux. The pulse duration is 4 s. The total heating process is 10 s. All this coding work is performed using Matlab 2022 and Python (version 3.12.4). Figure 8 presents the Gaussian laser boundary and pulse duration of the step function, respectively.
Shih et al. (1976) [16] analyzed the SIF value by adjusting the nodes to a quarter of the distance from the end of the crack tip, indicating that the SIF values calculated by the J-integral and DCT methods are almost the same even though the meshes on the crack tips are constructed differently. The DCT method is evaluated by the quadrilateral elements when the J-integral is calculated using triangular elements, which are shown in Figure 9. The KI data results are listed in Table 2. The raw list is the ratio of crack length and the model’s width.
In the DCT method, quadrilateral elements are more conveniently used in the symmetric model compared to the triangular elements. The finite element in Figure 10 is formulated with an 8-node quadrilateral element on the crack tip, while the main body of the TBC model is constructed with a 6-node tetragonal element. The quadrilateral element can make the integration of the J-integral range simpler. The first and second nodes are selected from the first quadrilateral element on the crack tip for the calculation of the DCT method. Seven preexisting cracks are established in the symmetric model, which corresponds to a CPI density of 10. The width of the element is 0.001 mm, and Δa is the distance between first and second nodes.
In this study, the central precrack SIF was taken as the main thermal resistance on the TBC coating. This is obvious because the highest temperature is at the center of the TBC coating, and the most intense stress is at the crack tip. In this section, the SIF value, influenced by the number of preexisting cracks per unit area, will be evaluated, as well as the effective reduction in the SIF achieved by fracture toughness and the reduction in crack propagation.
First, single precrack models with crack lengths of 15% (0.36 mm) and 50% (1.1 mm) of the TBC thickness were simulated using linear FGM distribution (N = 1). The fracture toughness can be calculated using Formula (36) below, from Jin et al. (1996) [32].
K I C ( x ) = K I C c E ( x ) 1 v 2 ( x ) V m ( x ) 1 v m 2 E m ( K I C m K I C c ) 2 + ( 1 V m ( x ) ) 1 v 0 2 E 0 1 / 2
In this section, the fracture toughness of a TBC coating composed of two-phase materials was evaluated. The assessment was first conducted for the top 100% of the top coating material and then for the bottom 100% of the bond coating. The fracture toughness of the top 100% was represented by that of YSZ, while that of the bottom 100% corresponded to NiCoCrAlY. Figure 11 presents the SIF of a single precrack model with a length of 0.36 mm, whereas Figure 12 illustrates the SIF for a precrack length of 1.1 mm.
The results from Figure 11 and Figure 12 illustrate that the SIF calculated using the J-integral and DCT has high accuracy in both algorithms when the finite element method is used. When a pulsed CO2 laser heats the surface of the TBC coating, the SIF from the 0.36 mm single preexisting crack model decreases significantly and then gradually rises at 4 s. High temperature influences the crack tip and causes thermal stress, promoting the SIF value as the heat flux reaches the crack tip. On the other hand, the SIF from the 1.1 mm single preexisting crack model varies slightly because the preexisting crack length is longer than 0.36 mm. The heat flux might promote the SIF value after 10 s. The fracture toughness results in Figure 11 and Figure 12 indicate that the SIF value is higher than it usually is, and that there is a possibility for preexisting crack propagation.
However, when the crack intensity is increased to CPI 10 (10 cracks per inch), the fracture toughness increases to about 1.2 × 10⁸  p a m . Due to the increment in crack intensity, the heat flux distribution is different compared to the single-crack model. As a result of the temperature difference, the fracture toughness increases when the temperature at the crack tip decreases, which is shown in Figure 13.
According to the number of functionally graded volume fractions in Figure 14, the fracture toughness increases as the number increases because the volume ratio of NiCoCrAlY gradually becomes higher than that of YSZ. Eventually, the SIF values of all FGM coatings are lower than the fracture toughness.

7.2. Stress Analysis on the Interface and Surface

In addition to the SIF of preexisting crack evaluation, the stress on the surface and interface of TBC coatings is also very important because tensile stress and higher shear stress may introduce crack propagation and the appearance of cracks in these regions. First, the FGM TBC coating model without preexisting cracks will be simulated and compared to the normal TBC coating model. Then, the preexisting crack model will be simulated, and the stress will be examined. The thermal shock testing with Coherent model C-20 60W CO2 laser heats the TBC’s surface from room temperature (293.15 °K) to 750~1506 °K in 4 s. The central temperature evolution is shown in Figure 15. Due to the higher volume ratio of YSZ in the FGM model compared to NiCoCrAlY, the increment in volume fraction number of the functionally graded TBC model will raise the surface temperature of the coatings. This illustrates that the higher volume fraction number may have better thermal shock resistance.
The influence of volume fraction on temperature is shown in Figure 16; the temperature variation of N = 1 in Figure 16a–c rises to 1000 °K and shrinks to 350 °K in six seconds. However, the temperature shown in Figure 16d–f indicates that the N = 3 model can reduce the temperature from 1400 °K to 500 °K during the same time. On the other hand, the model of N = 1/3 can alleviate the temperature rise from 0 s to 4 s under pulsed laser heating, although the temperature rise from 4 s to 10 s is only 425 °K. According to the temperature analysis from those diagrams, the nonlinear distribution of volume fraction can certainly promote the TBC coating’s thermal shock resistance.
In Figure 17, the interface tensile stress at 4 s is evaluated because the the highest temperature occurs on the coating surface at 4th second. The functionally graded TBC coating raises the tensile stress at the beginning. However, the CPI 10 structure reduces the tensile stress greatly with a functionally graded linear exponential number (N = 1).
In Figure 18, the range of interface tensile stress of CPI 10 is wider than that of the traditional TBC model. However, the tensile stress can be effectively reduced by the nonlinear volume fraction number of the functionally graded material.
In Figure 19, the traditional TBC coating consists of two layers, the topcoat and the bond coat. The maximum shear stress at the interface in this structure is approximately 18 MPa. When the single preexisting crack is introduced into the coating’s surface, the shear stress at the interface is reduced to 10 MPa. When it comes to CPI 10 density of preexisting cracks, the maximum shear stress is only 5.87 MPa. Thus, in Figure 20, the two-phase functionally graded material is the main structure of TBC coatings. Increasing the number of volume fractions can effectively reduce the shear stress because of the YSZ volume concentrated on the surface and interface. The strength of the TBC coating is decent due to this nonlinear volume fraction distribution.
Tensile stress on the TBC surface is also an important issue for the lifespan of TBC coatings. Crack delamination in TBC coatings occurs at the junction of surface cracks and interface cracks. In this study, cracks on the surface are the cause of a great amount of tensile stress. Traditional TBC coatings indicate that the highest tensile stress is compressive on the surface. When TBC coatings are formed by CPI 10 preexisting cracks and functionally graded materials, the normal stress becomes positive compared to the traditional two-layer structure. Figure 21 exhibits the conditions of normal stress. However, increasing the volume fraction can reduce the normal stress to below 1.15 MPa, making it compressive, as shown in Figure 22. As a result, an appropriate number of volume fractions and high-intensity cracks on the TBC surface can optimize stress distribution in the coatings.
According to the data distribution in Figure 22, the normal stress associated with the highest heat flux can be effectively reduced as the volume fraction increases. When surface stress is evaluated transiently, the heat flux from the laser power penetrates the TBC coatings, causing significant variations in normal stress. Initially, a slightly larger temperature difference places the material near the surface under greater compression. However, with prolonged heating, even though the compression is relatively smaller, the compressive stress further relaxes due to air cooling, as shown in Figure 23. This demonstrates that a higher volume fraction helps maintain compressive stress on the surface of TBC coatings.
During the laser heating process, significant tensile stress develops at the preexisting crack tips. Figure 24, Figure 25 and Figure 26 illustrate the normal stress distribution along the TBC surface and the central line of the coating at 1, 4, and 11 s for different FGM models. Initially, the materials in the hot zone experience the highest compressive stress. As cooling progresses, this stress relaxes and transitions into large tensile stress.
The highest normal stress is concentrated at the crack tips. In the first second, the tensile stress at the crack tips ranges from 97.73 to 143.57 MPa. By the fourth second, due to the opening of the preexisting cracks, the normal stress increases significantly to 600–800 MPa. However, with the higher volume fraction of the FGM model in Figure 26, the tensile stress effectively diminishes to near zero by the 11th second. The YSZ material, with its lower thermal expansion coefficient, helps reduce thermal stress.

8. Conclusions

In this research, the J-integral and DCT methods were used to calculate the SIF value of preexisting crack tips during thermal shock testing with Comsol Multiphysics. The higher tensile stress on the coating’s surface is due to the CPI 10 structure. The two-phase functionally graded material effectively reduces the surface stress. The interface stress is also optimized because of the preexisting cracks and the two-phase functionally graded model. The simulation and calculation results of TBC coatings under 60 W CO2 laser thermal shock testing can be summarized as follows:
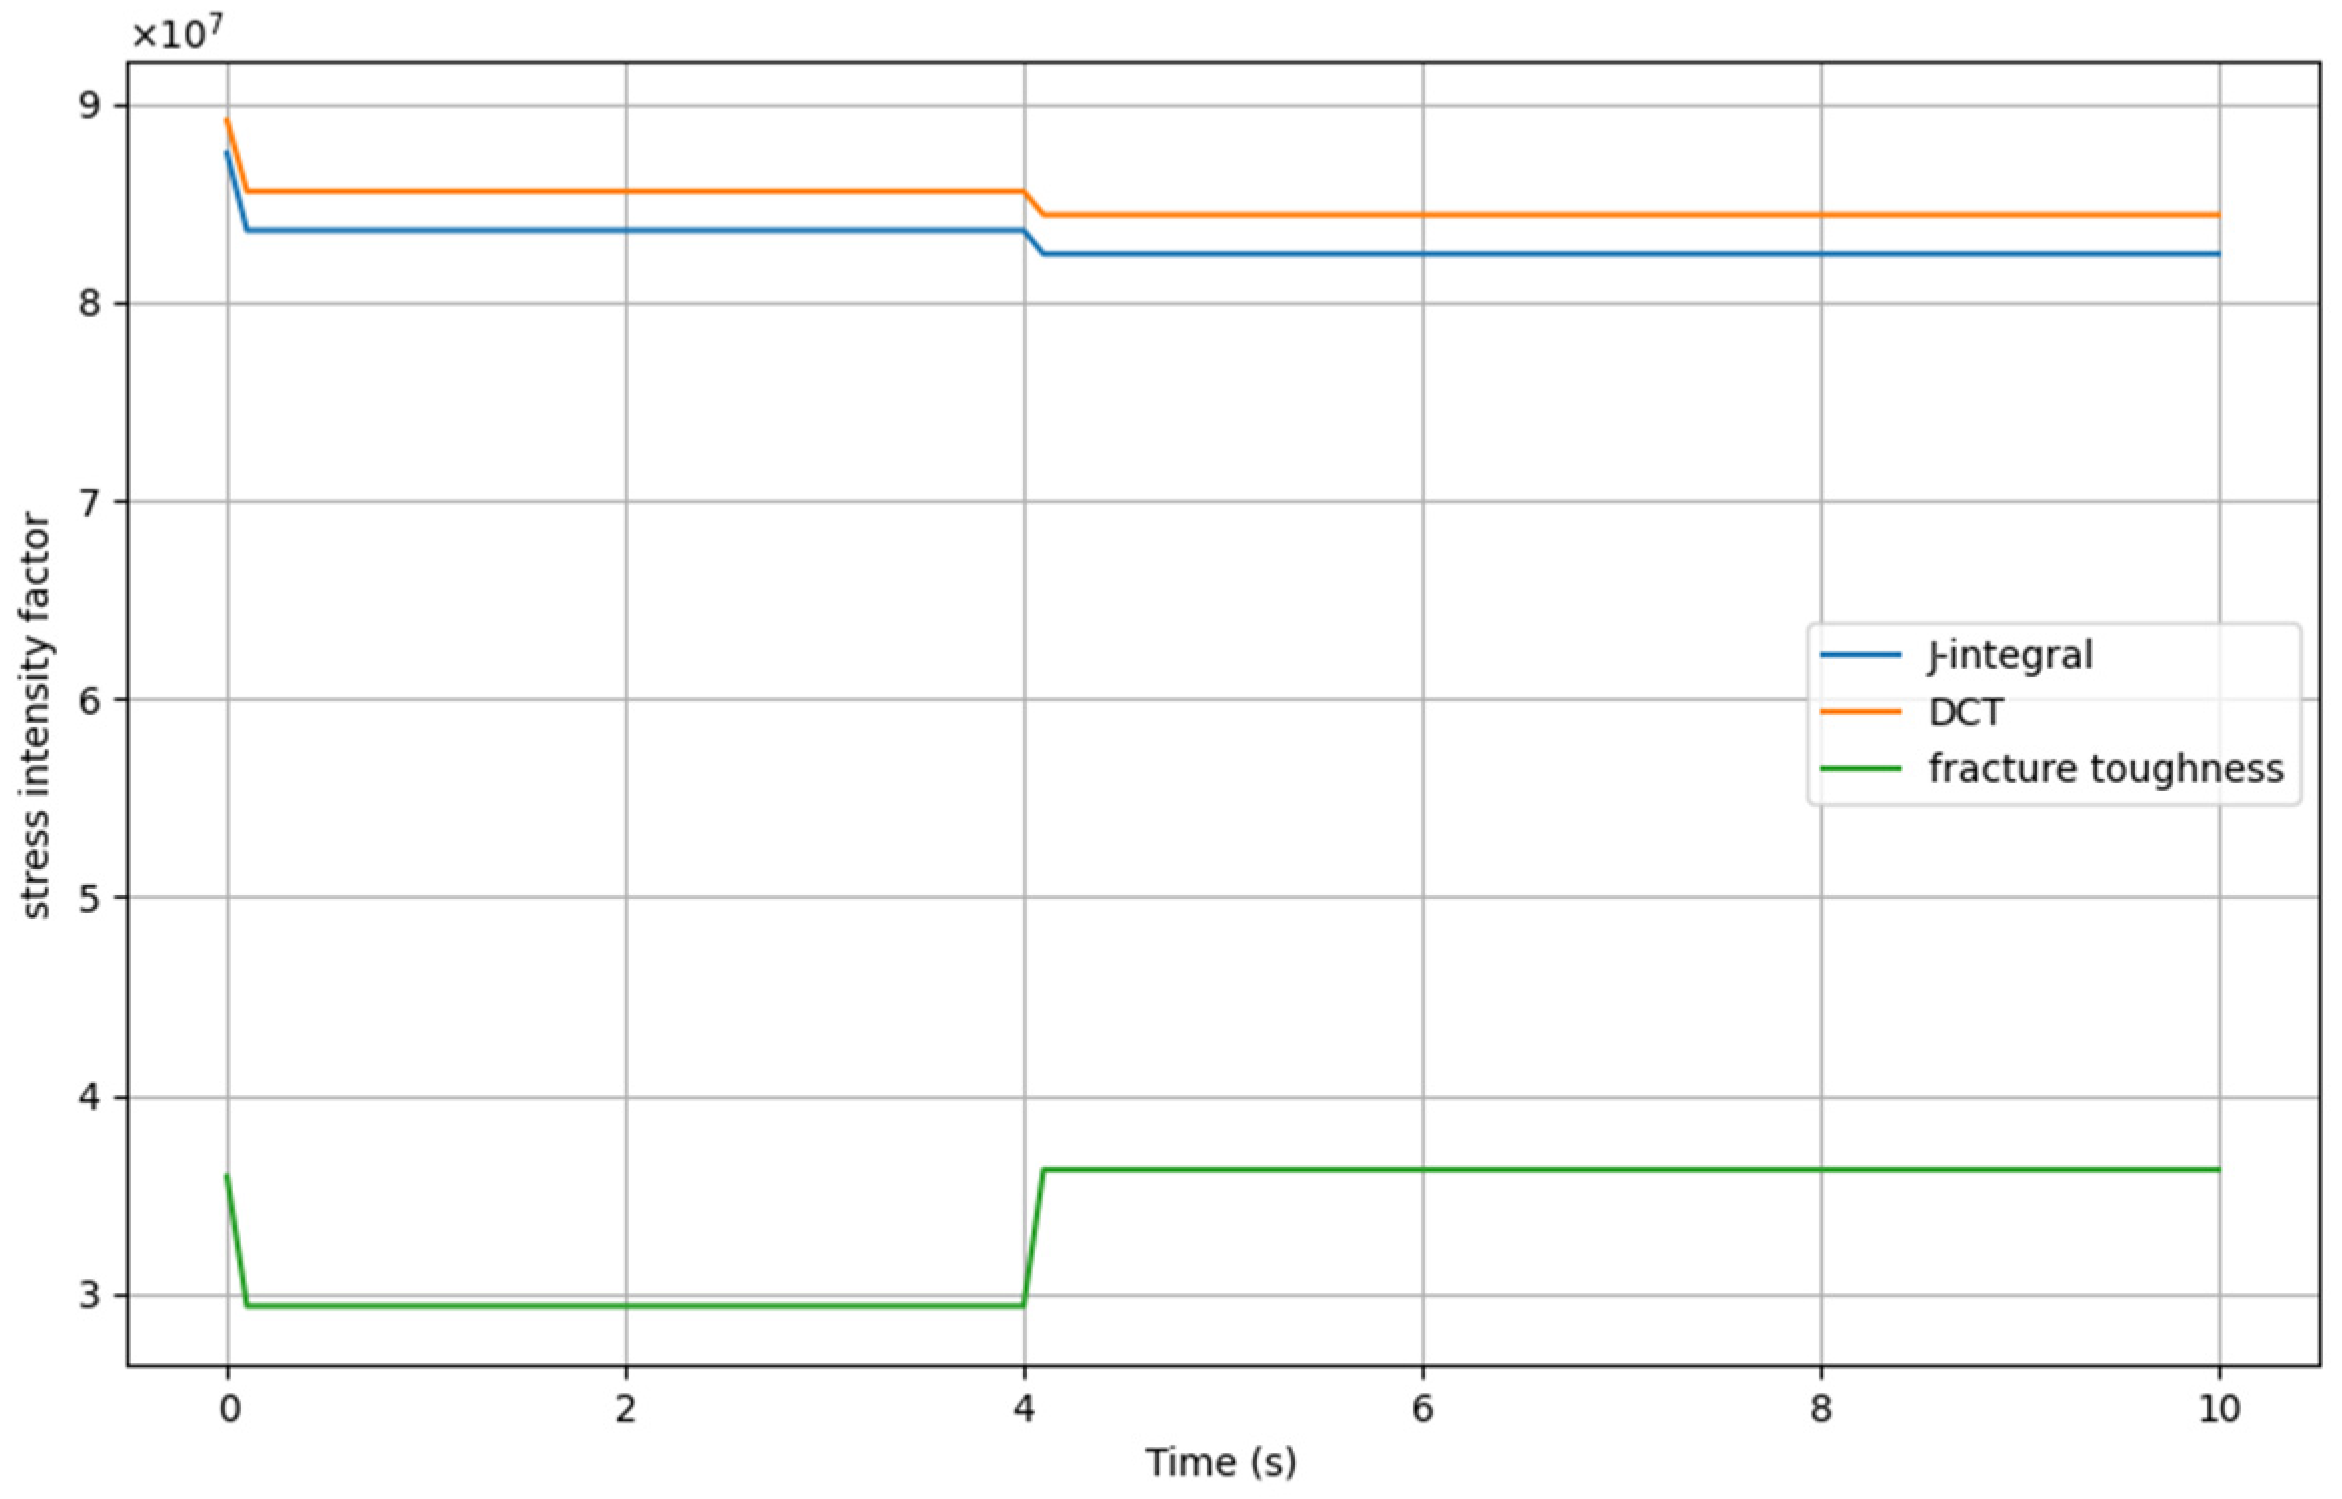
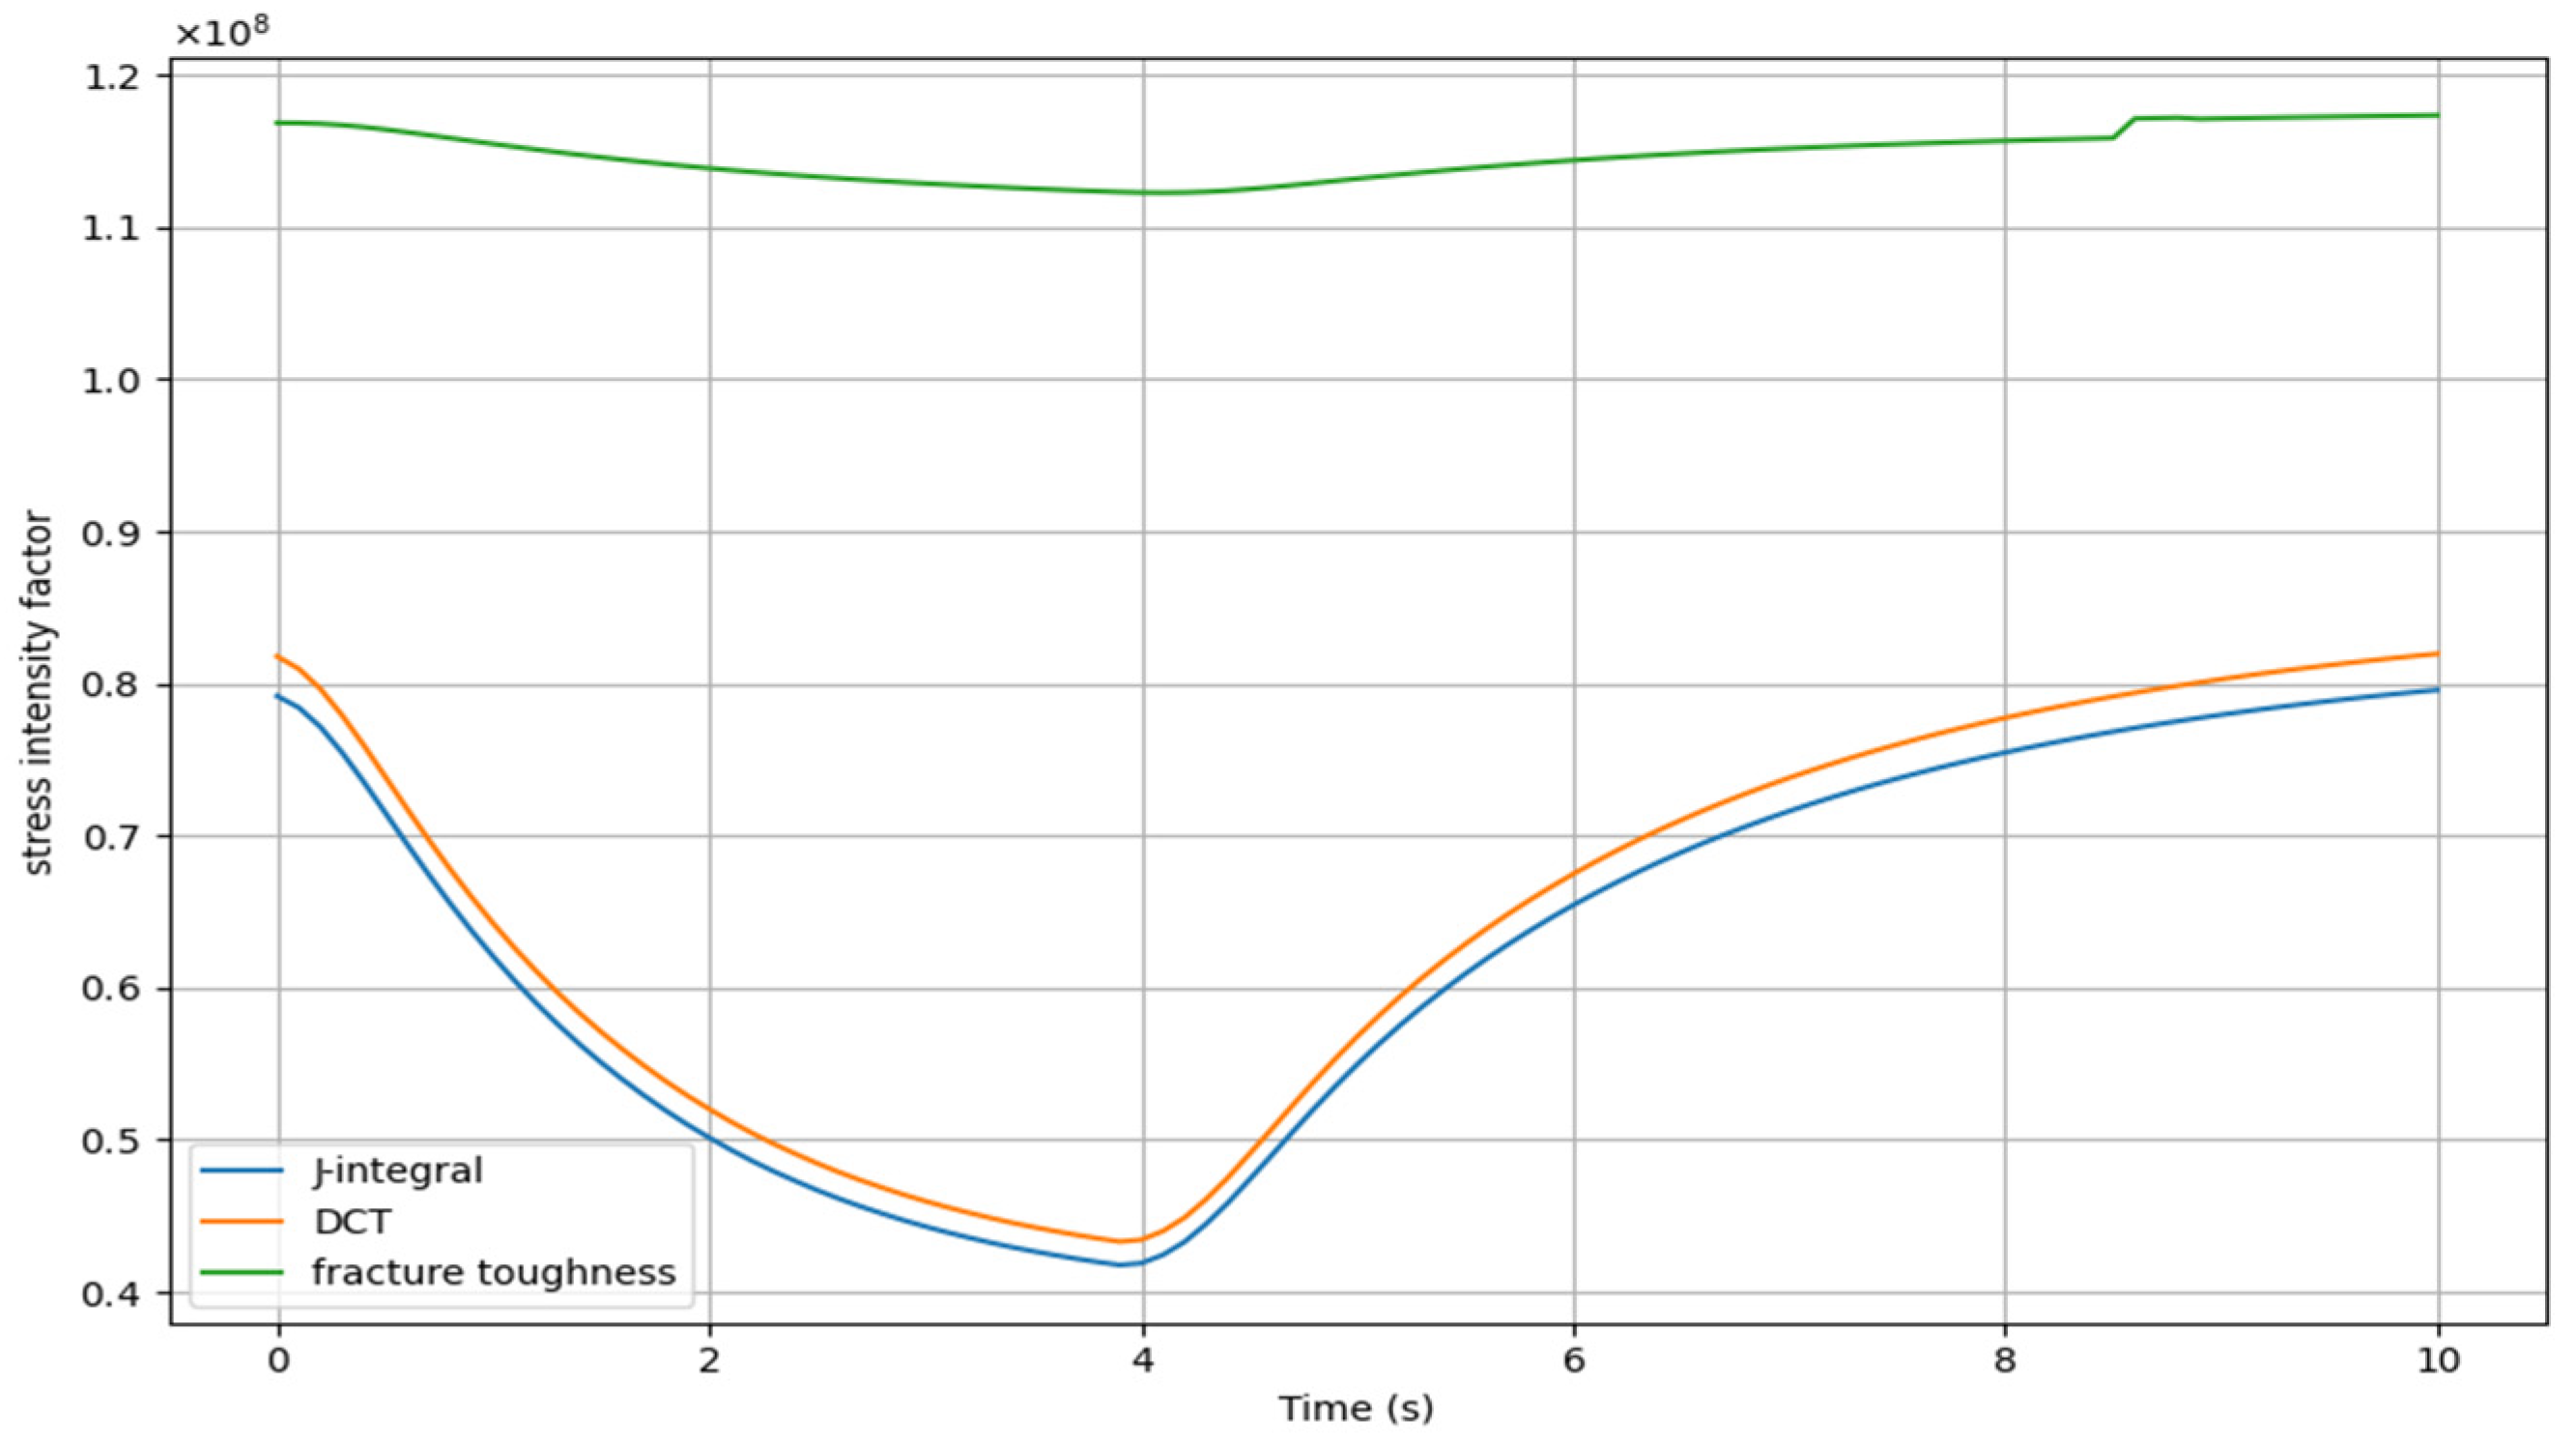
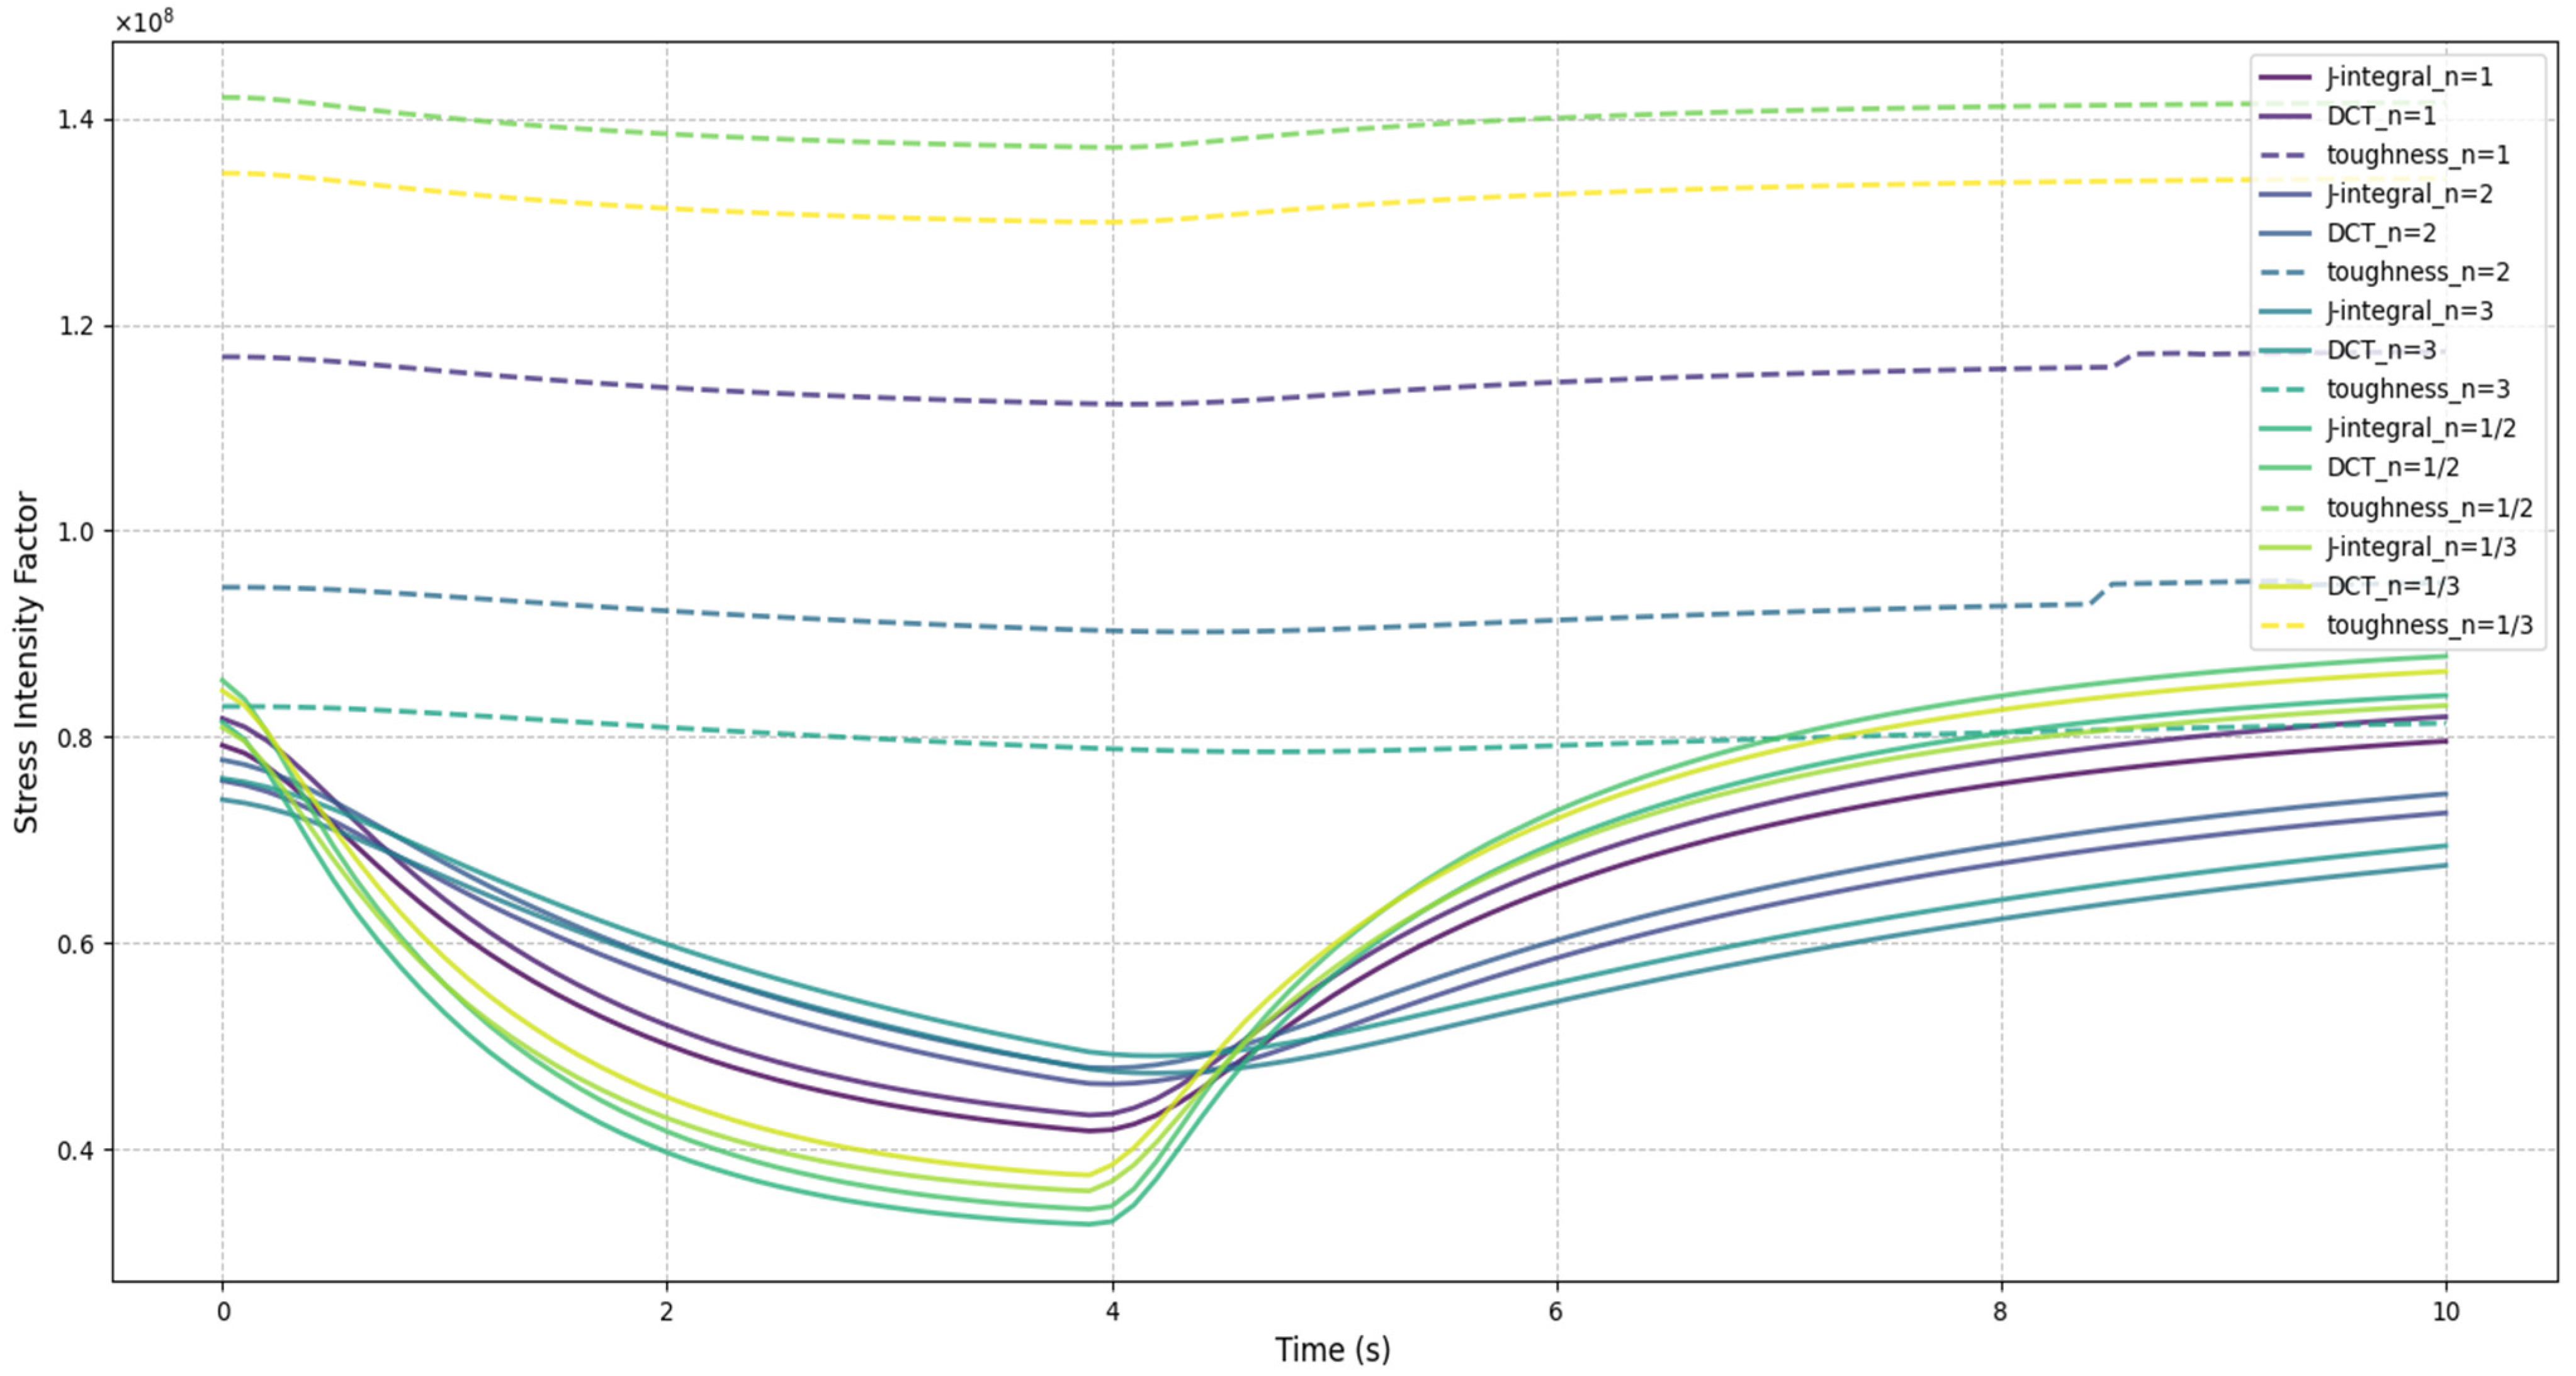
  • Our analysis, based on LEFM theory and evaluated using the J-integral and DCT methods, shows a high agreement in SIF values from Figure 11, Figure 12, Figure 13 and Figure 14, with low error estimates. The presence of high-intensity preexisting cracks, as in the CPI 10 design, effectively reduces SIF values relative to fracture toughness, except when a single crack exhibits higher SIF than the fracture toughness. Additionally, given that elastoplastic or viscoplastic behaviors may occur at the crack tip under thermoelastic conditions, future work should consider methods such as the strain energy release rate and XFEM for a more thorough analysis of crack propagation.
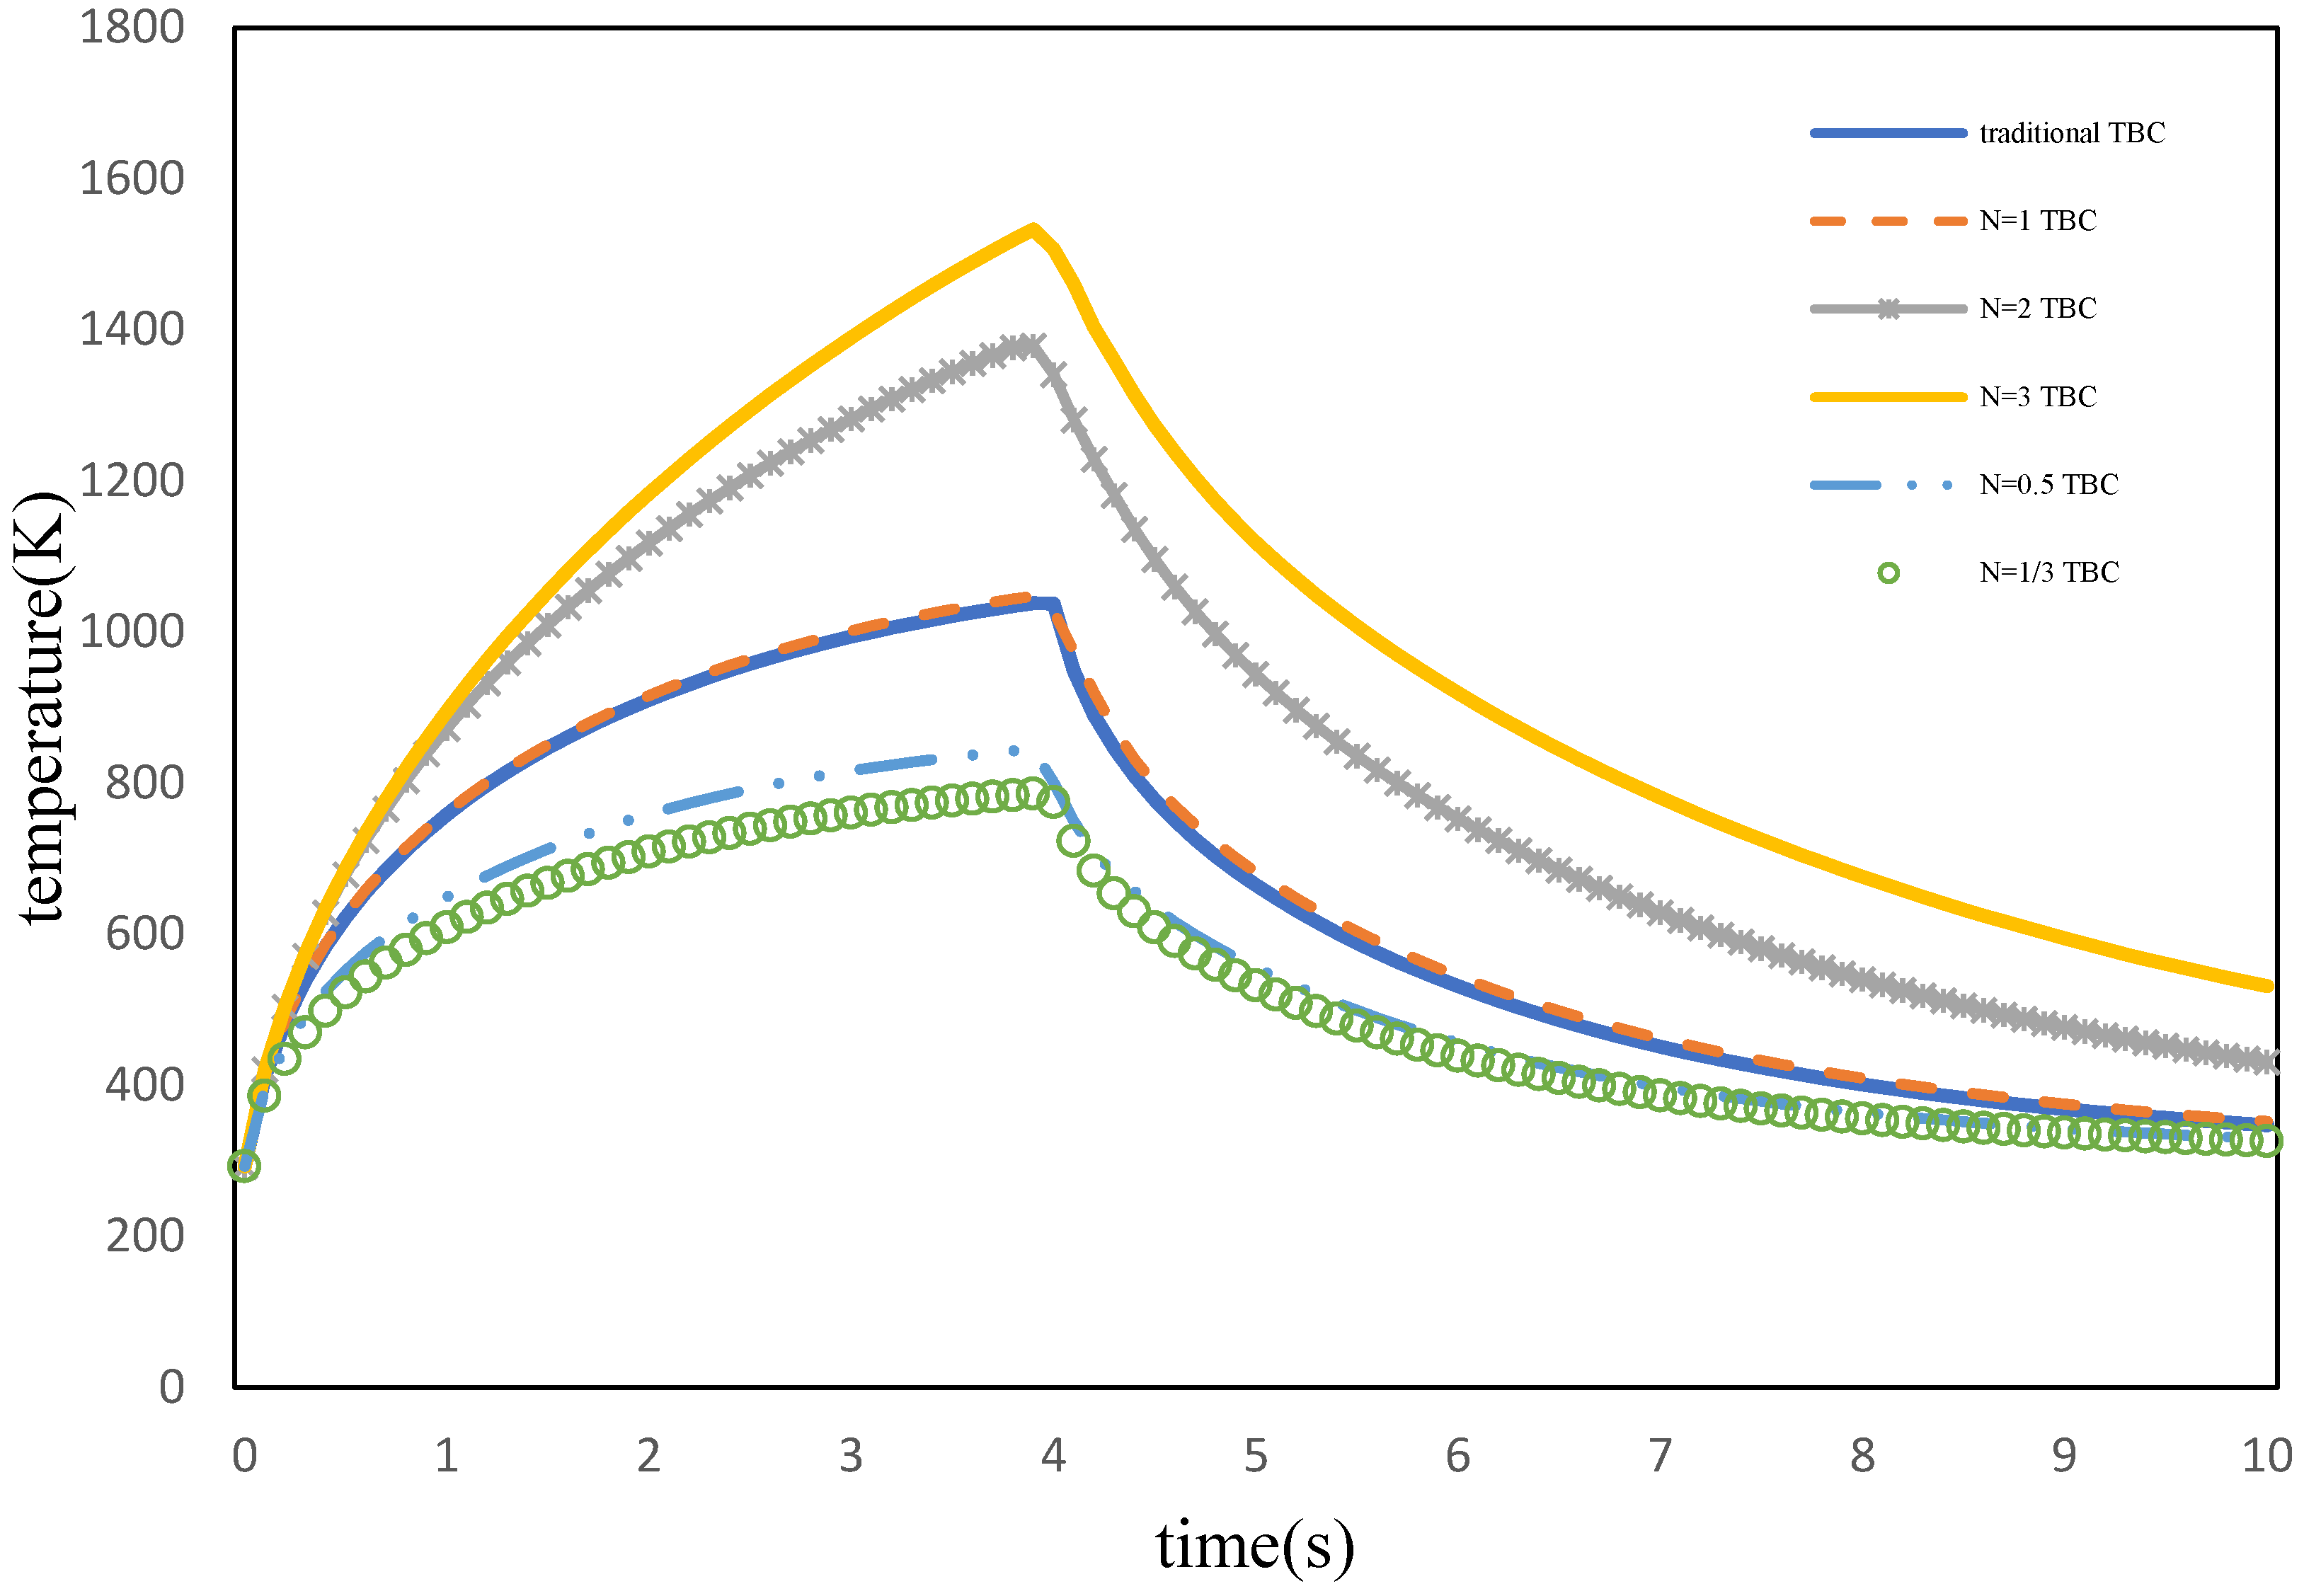
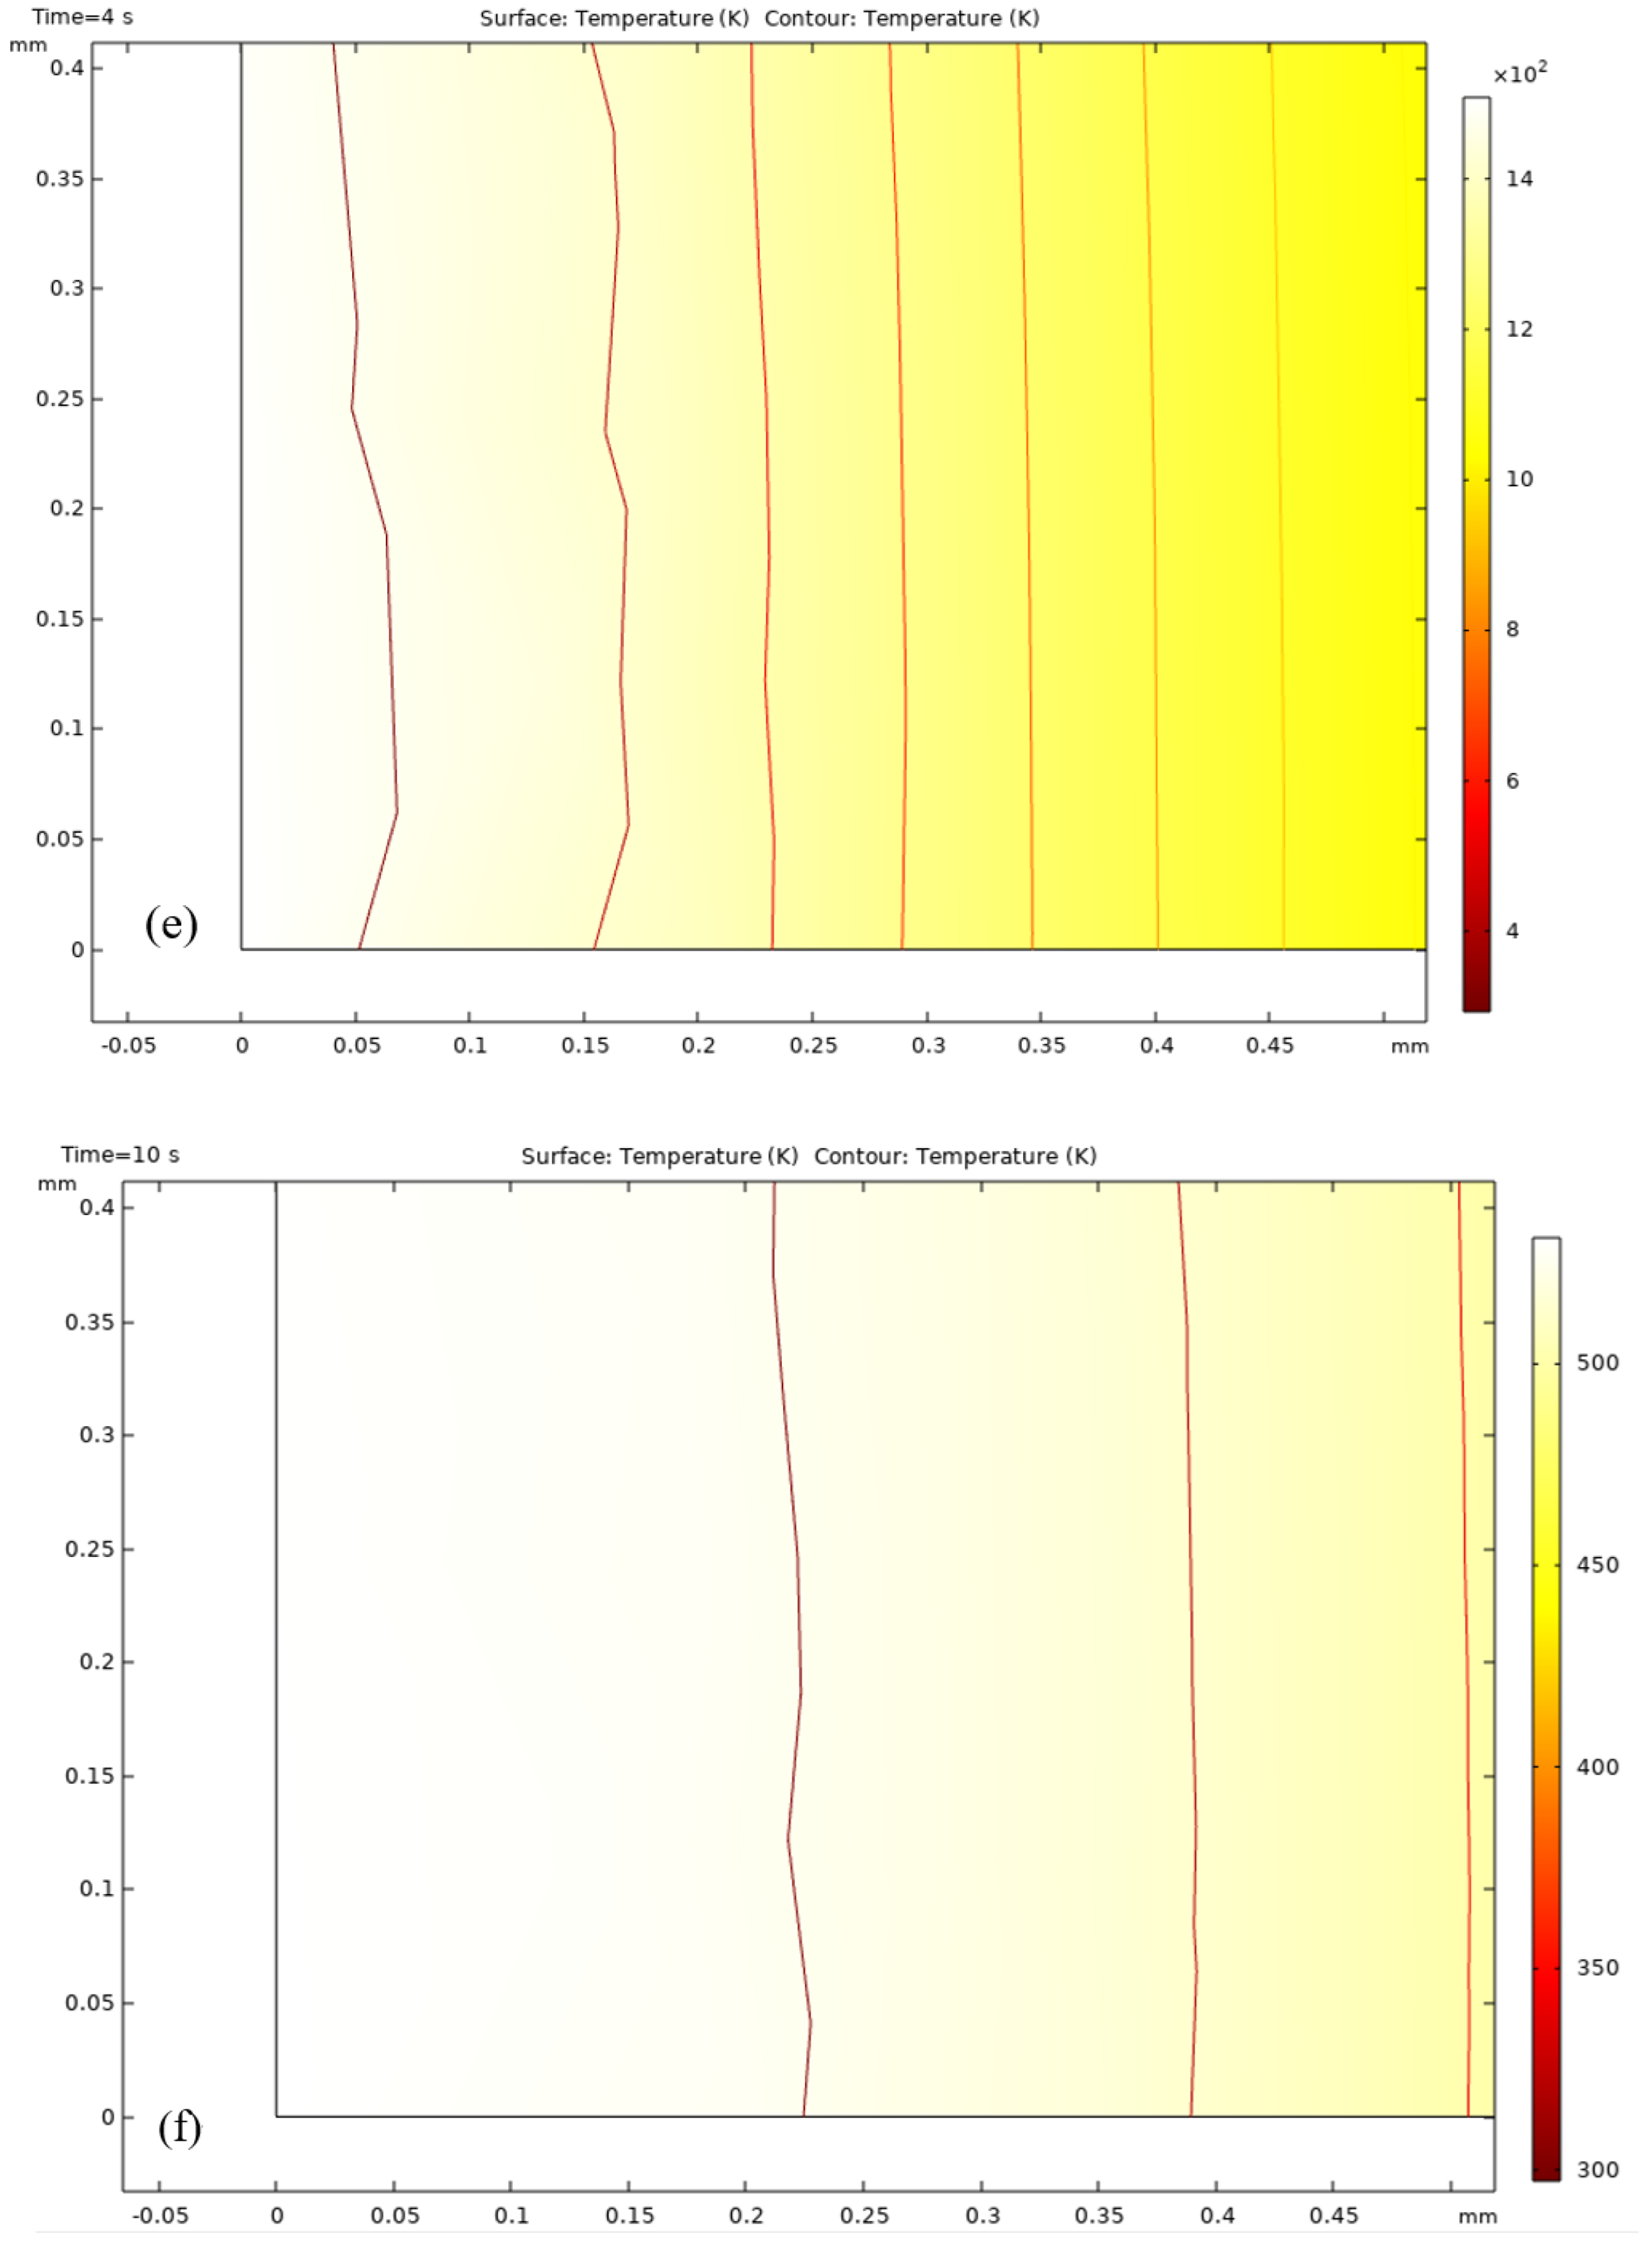
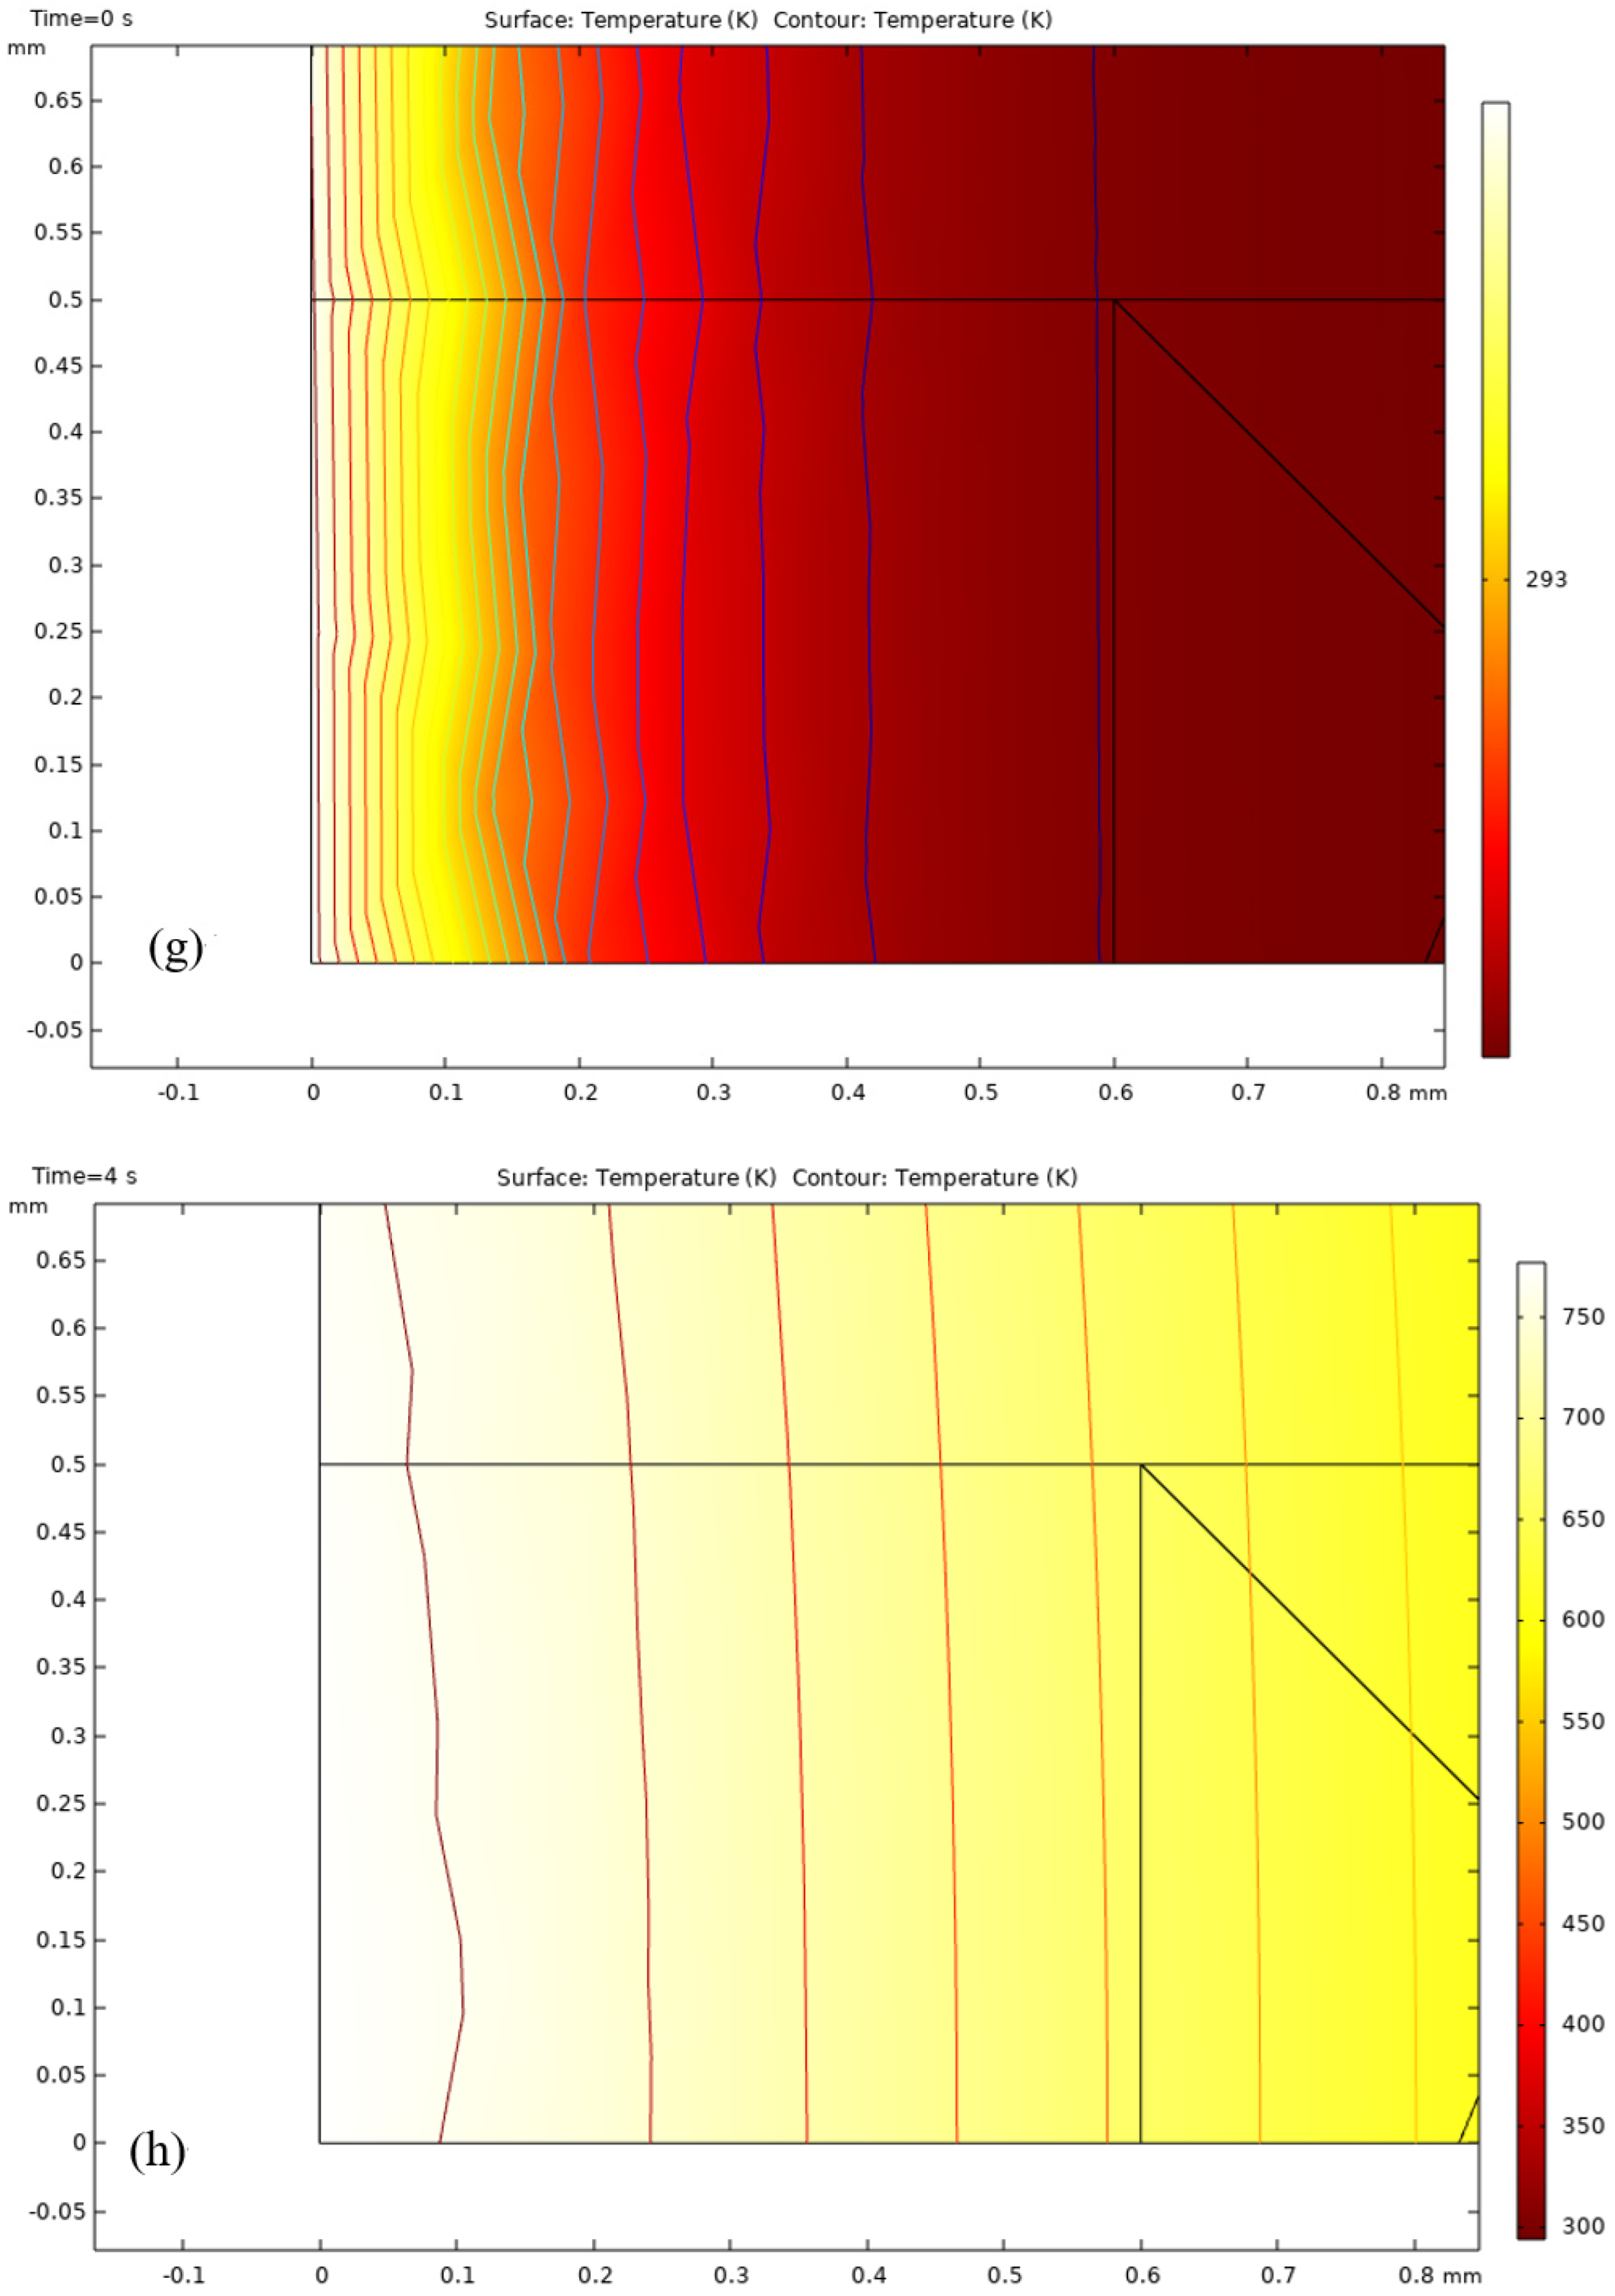
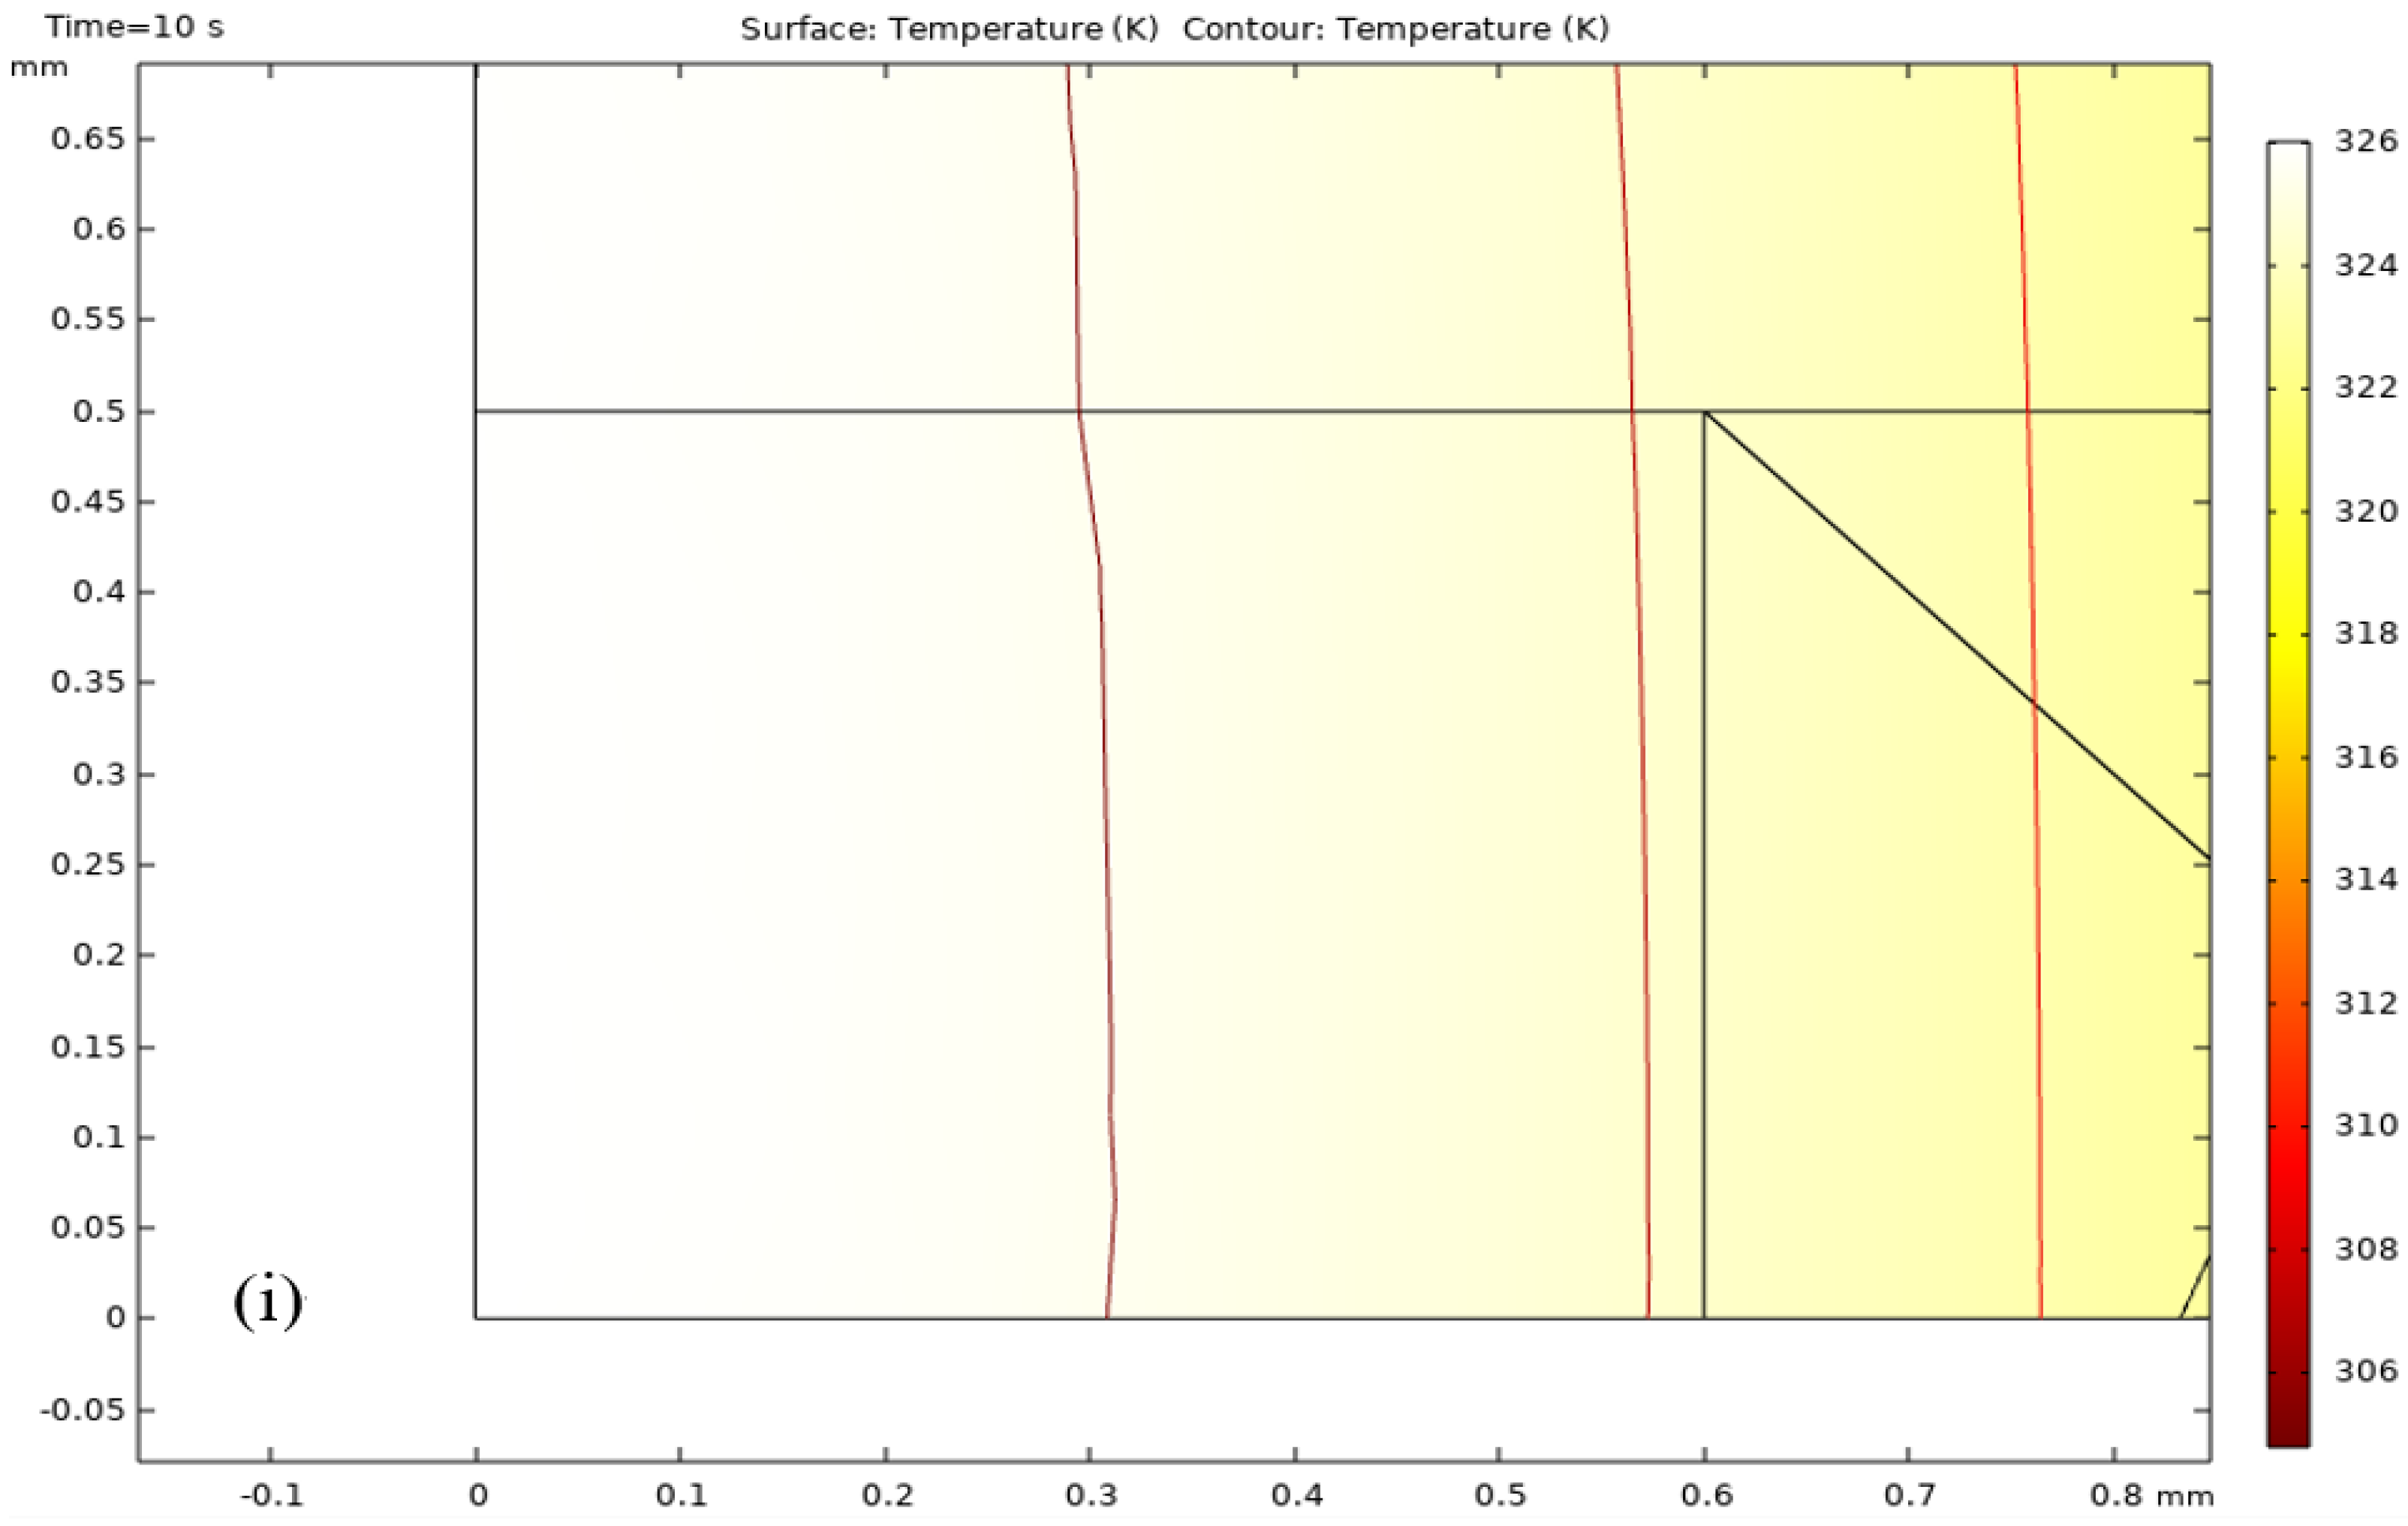
  • Thermal shock resistance is a critical parameter for TBC coatings. Figure 15 demonstratehaus that traditional TBC coatings operate within a temperature range of 293.15 K to 1027 K, while an increased volume fraction mixture in the functionally graded material coating can elevate the maximum temperature to 1533 K. This finding underscores the significant impact of the volume fraction mixture on enhancing the thermal shock resistance of the coating.
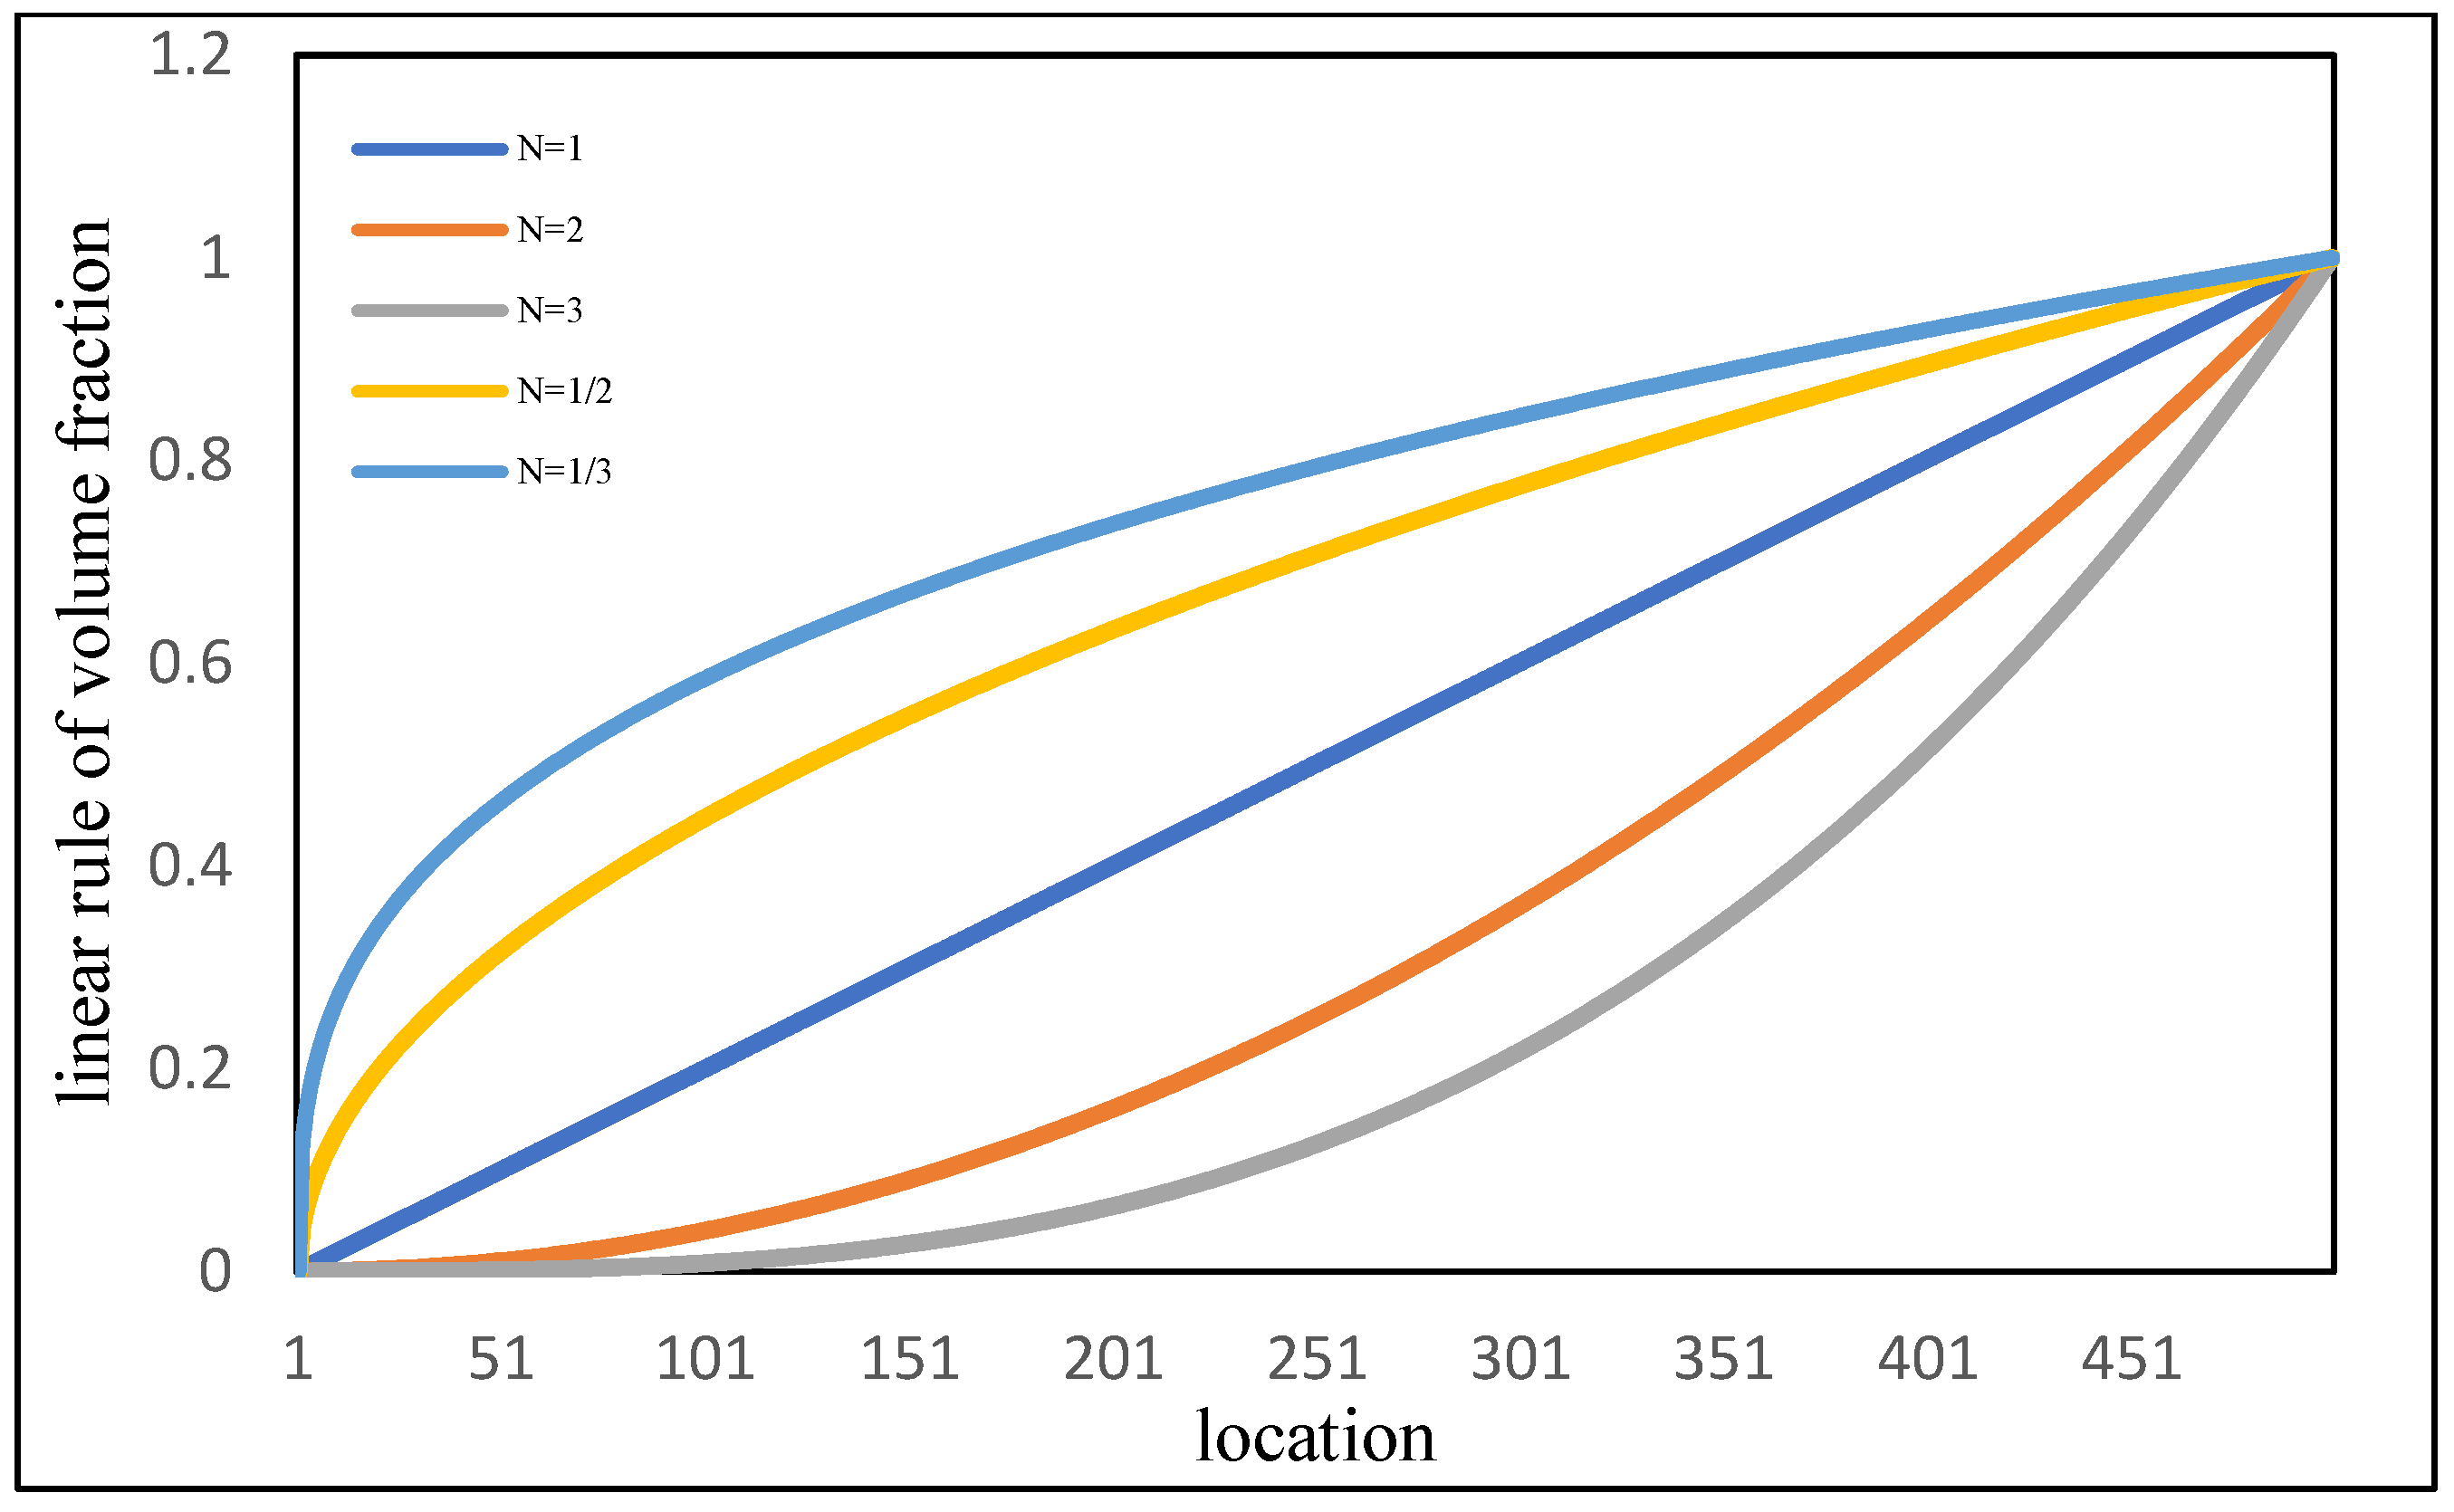
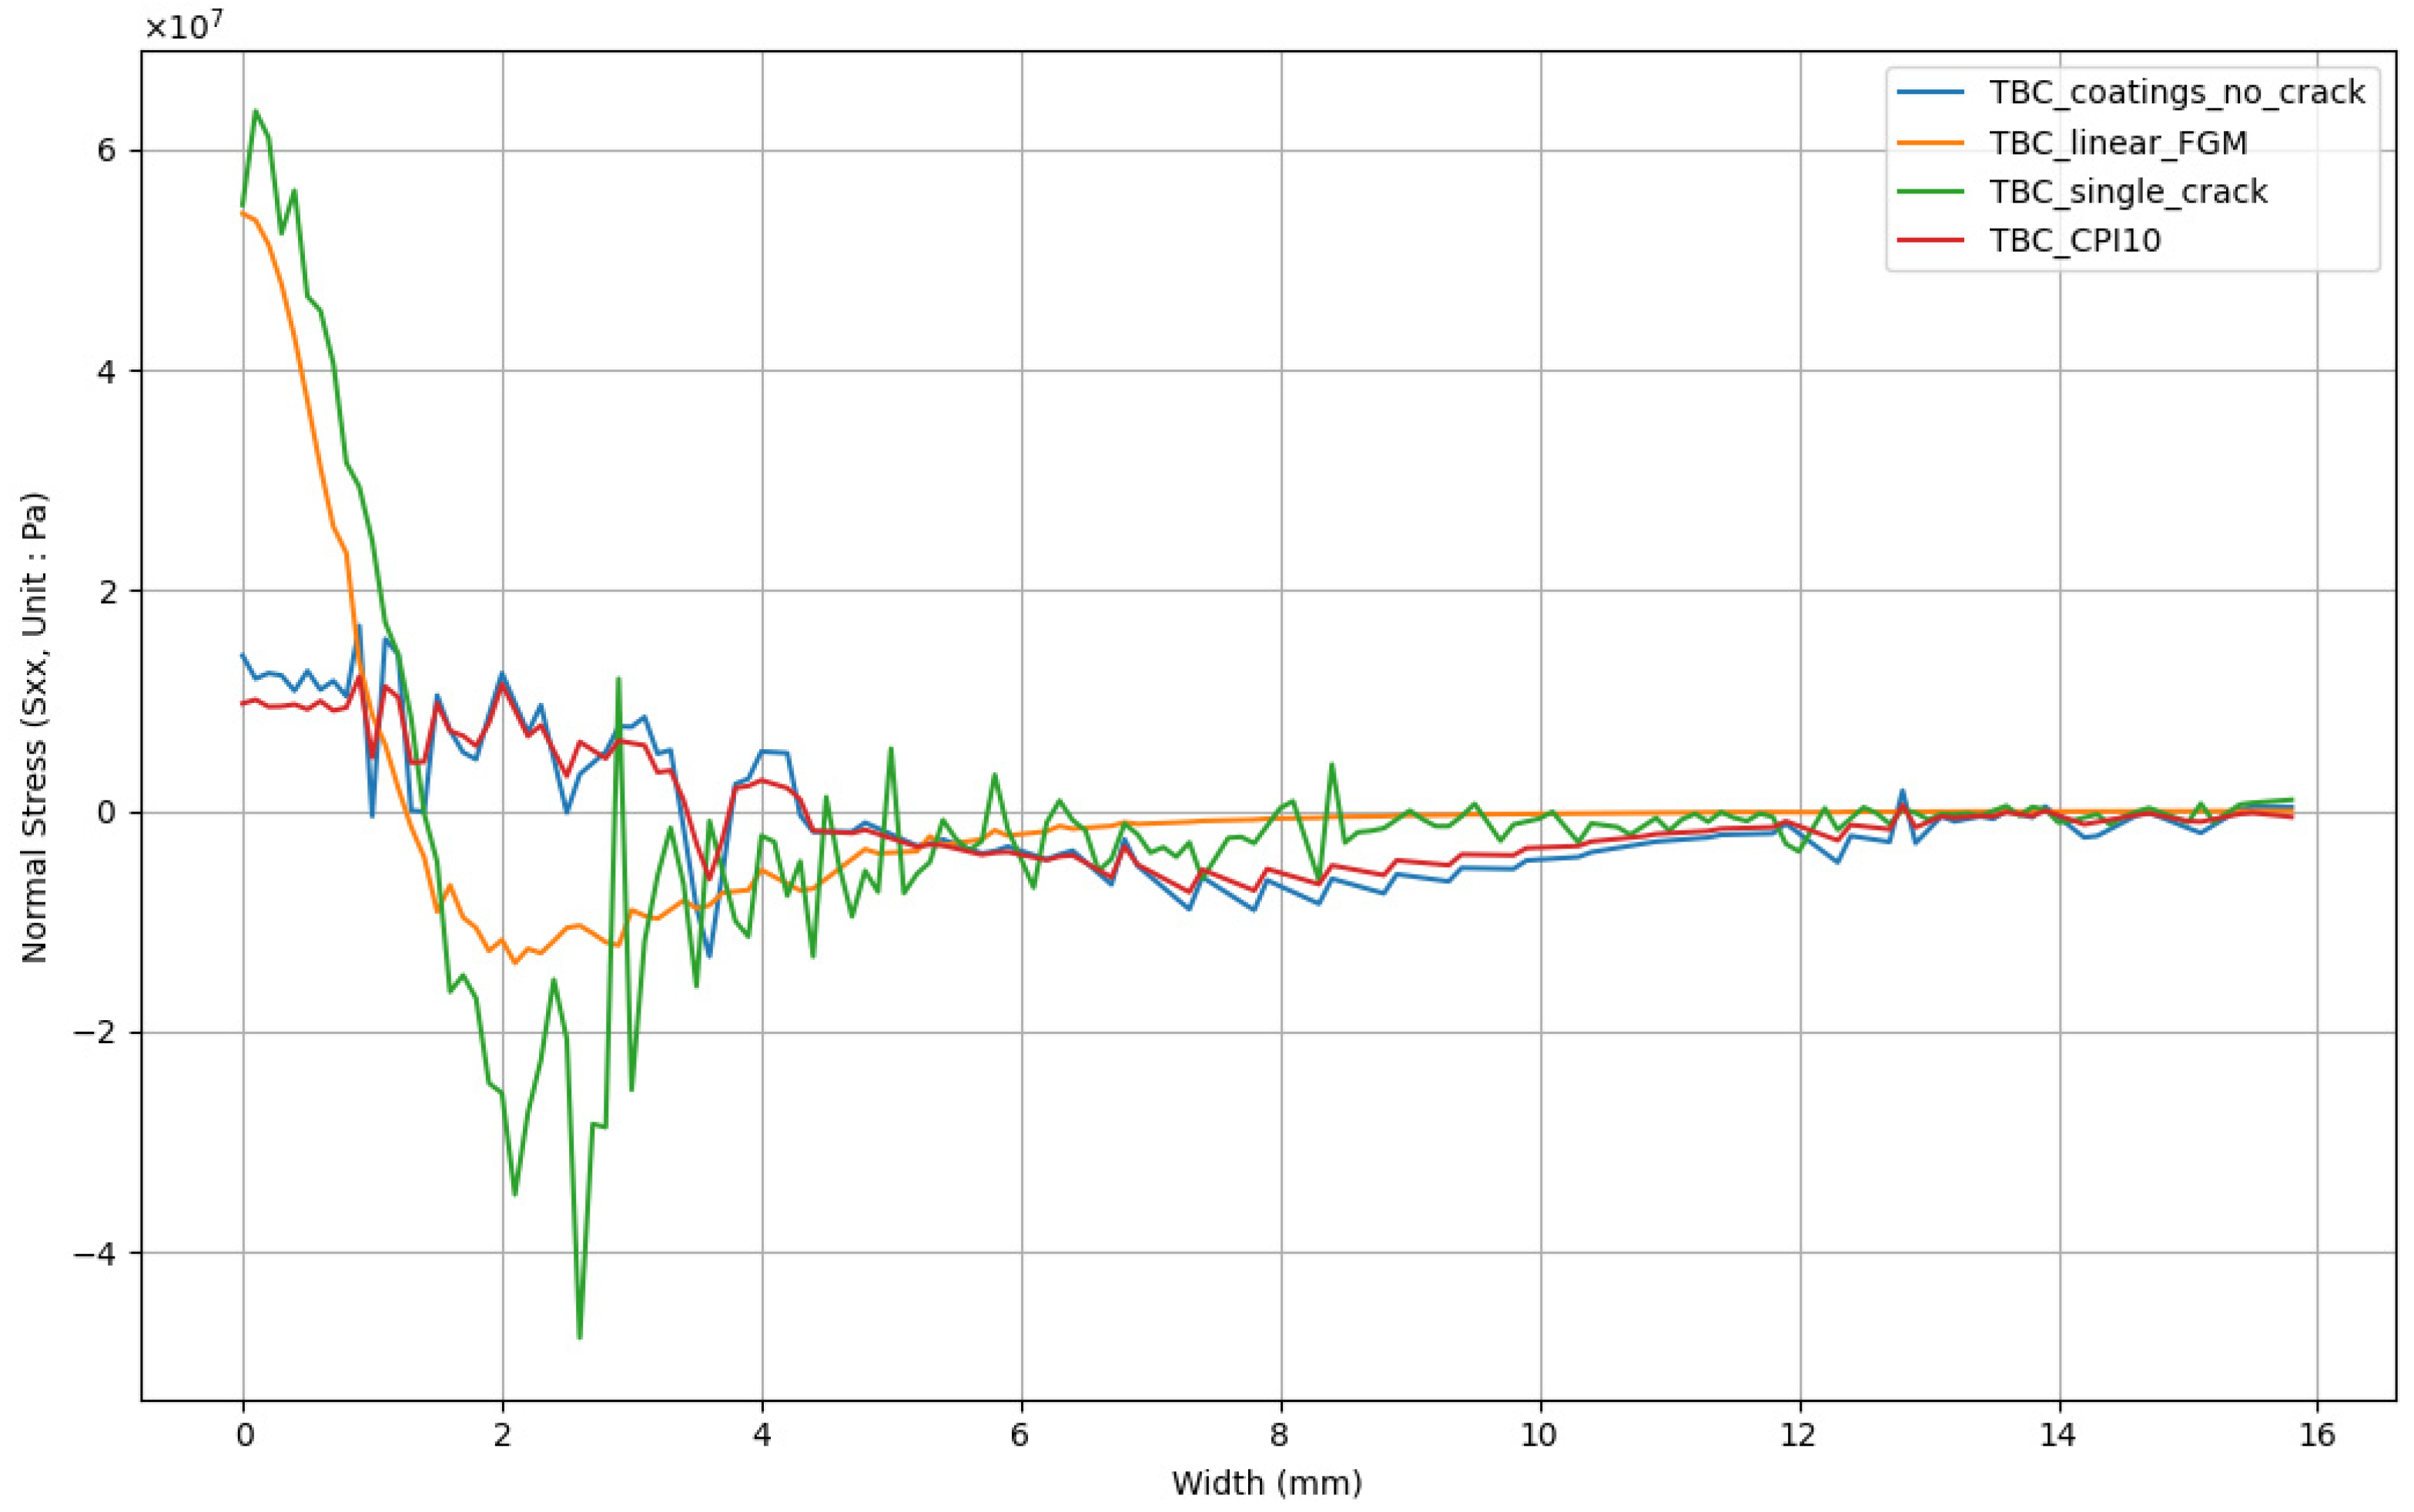
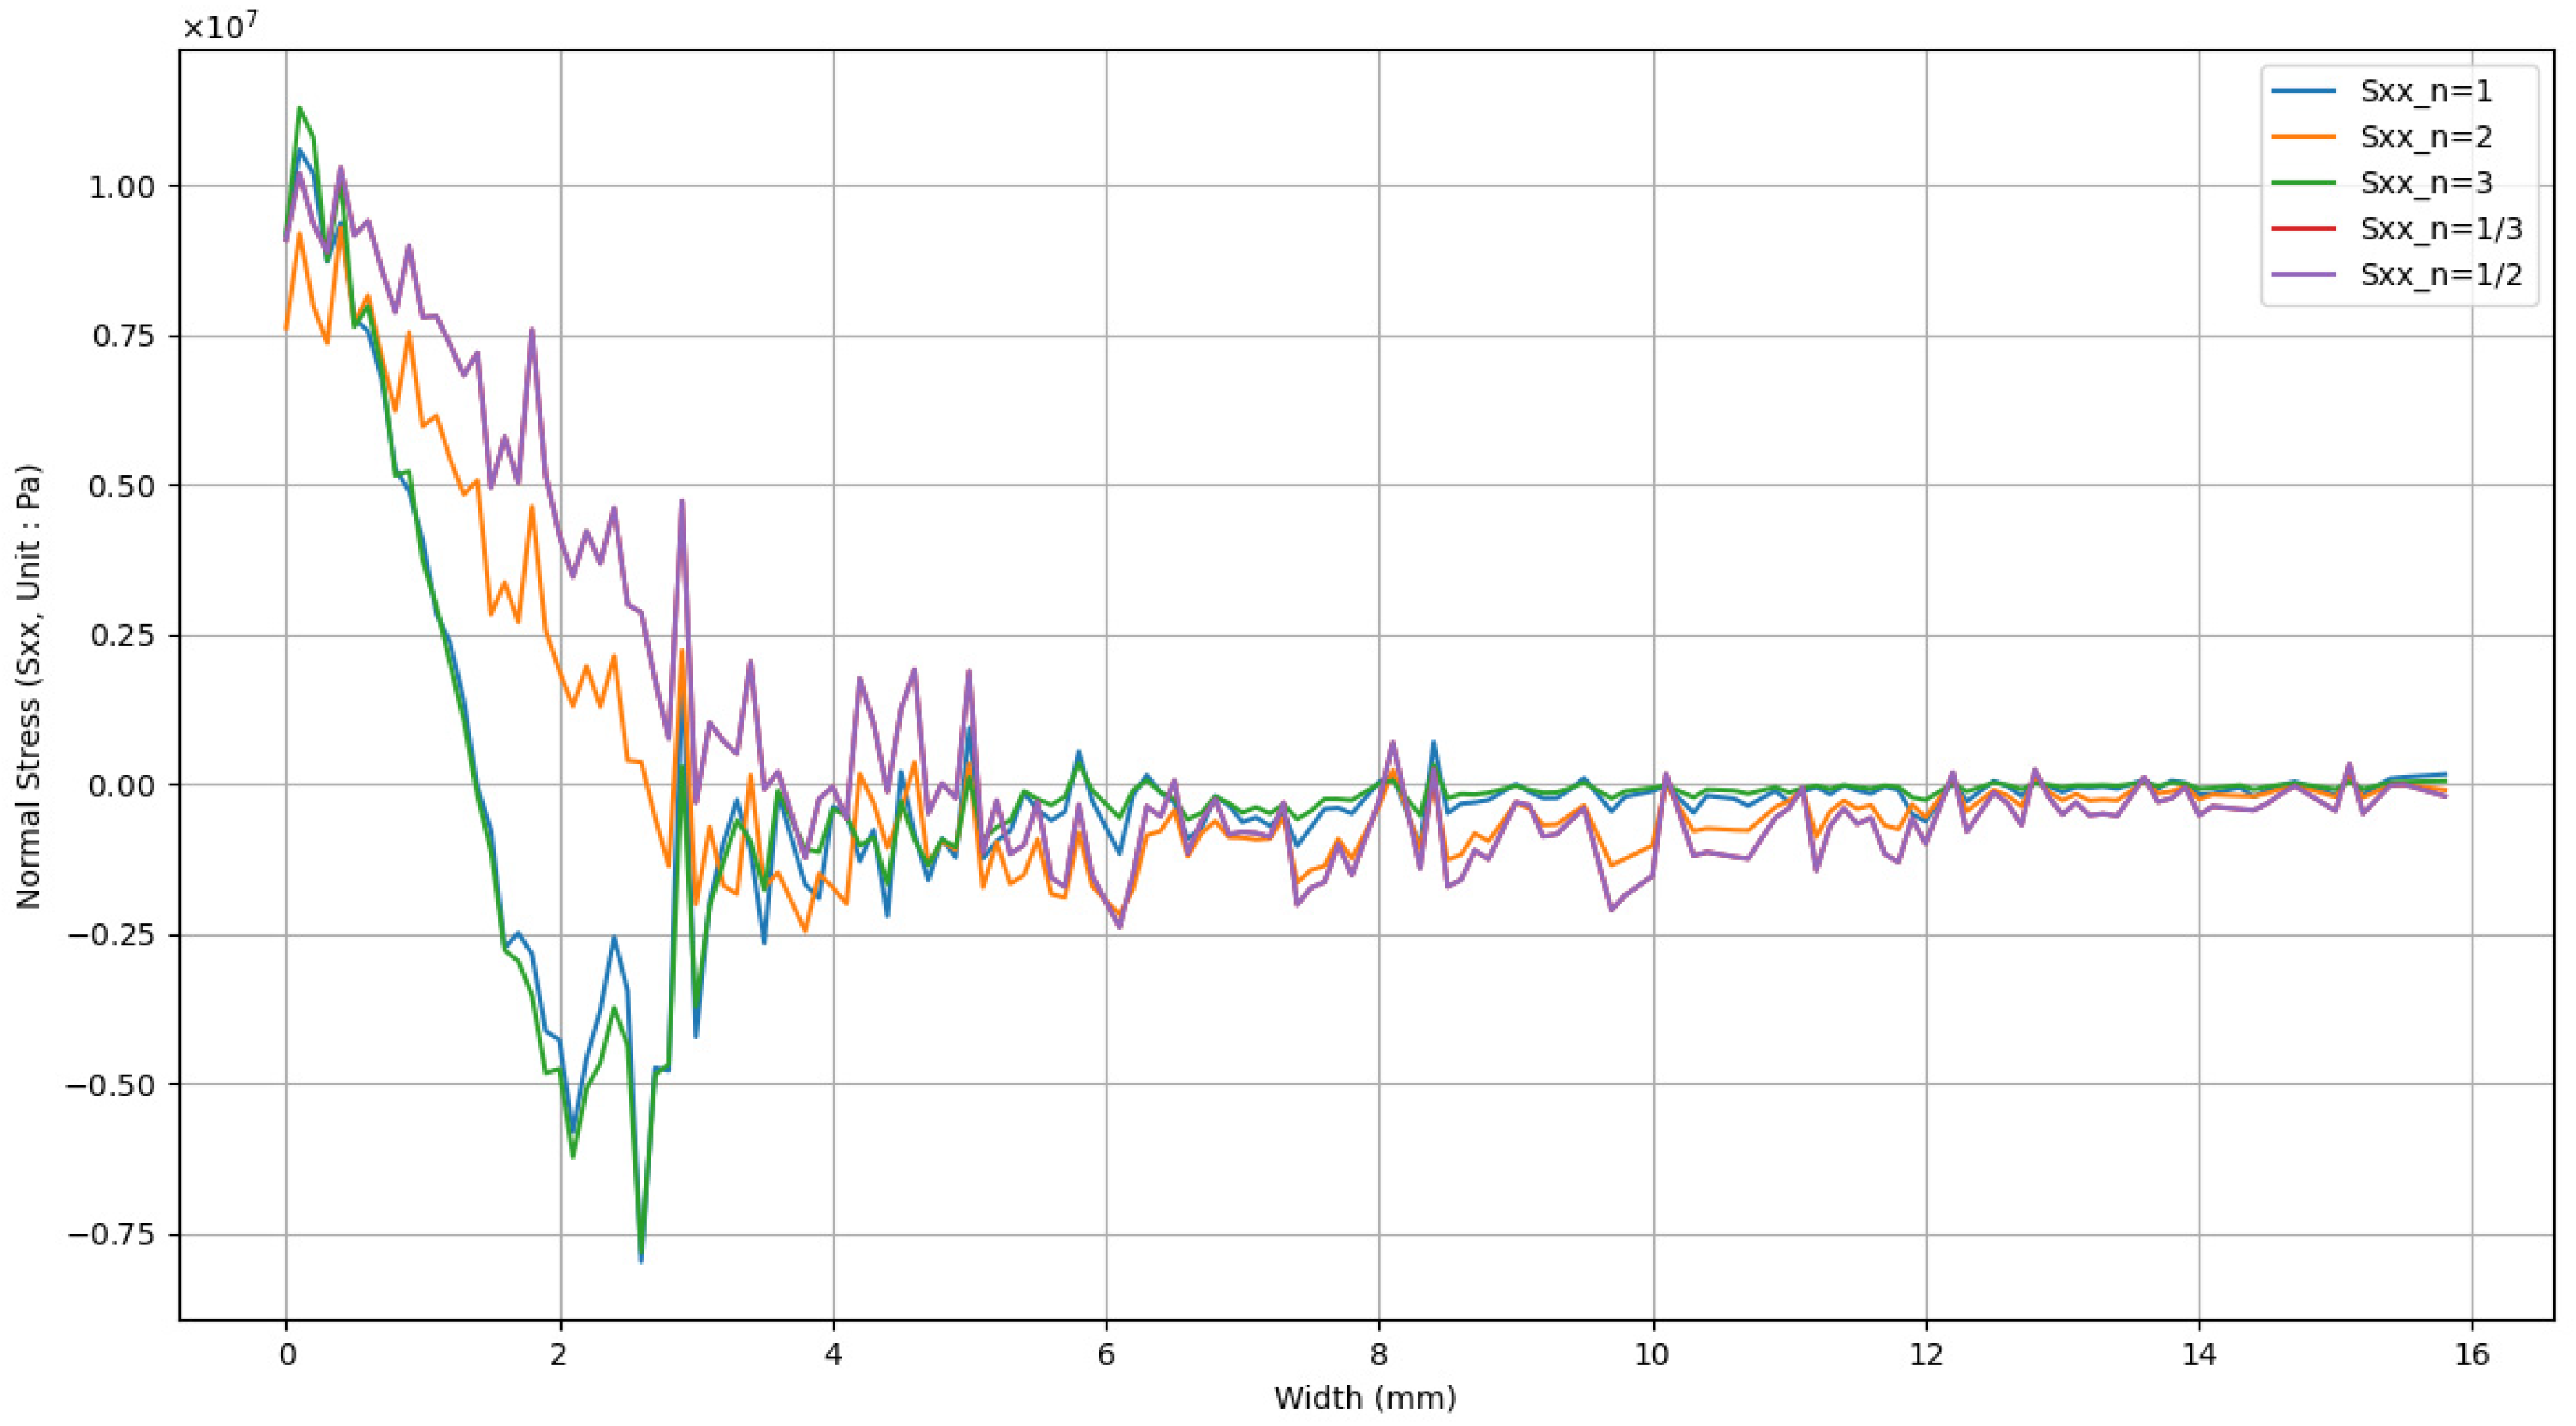
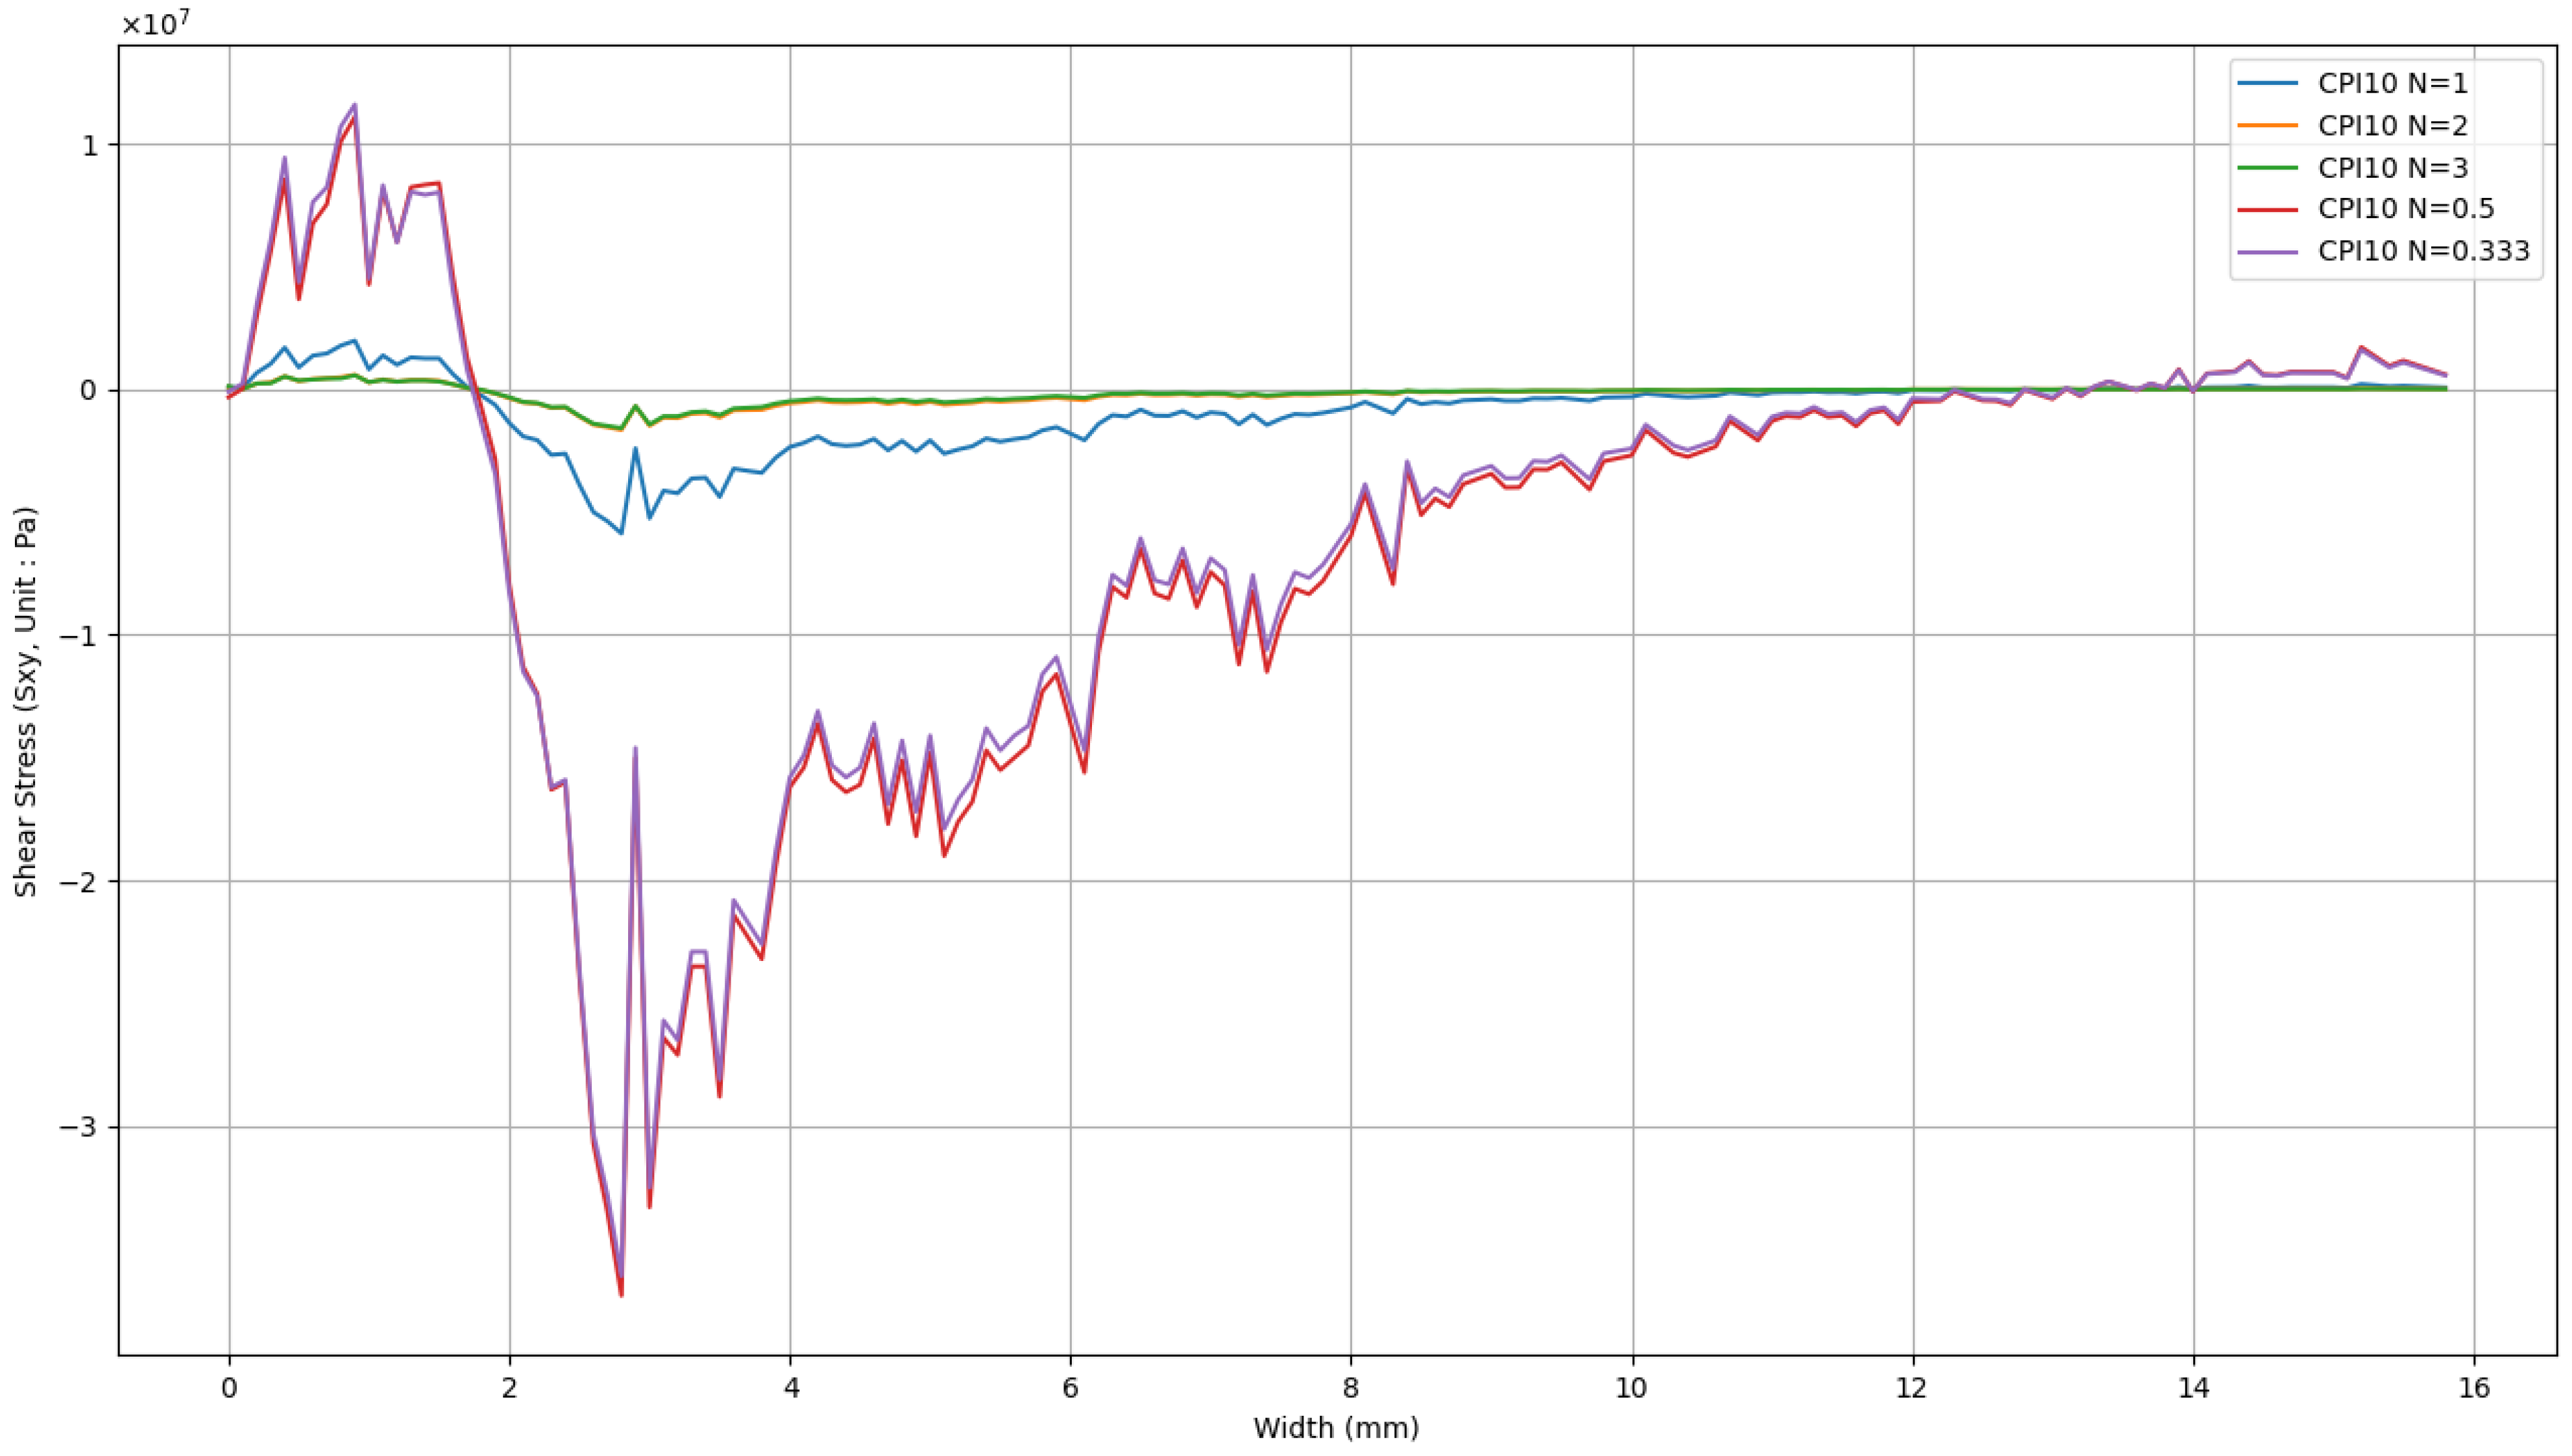
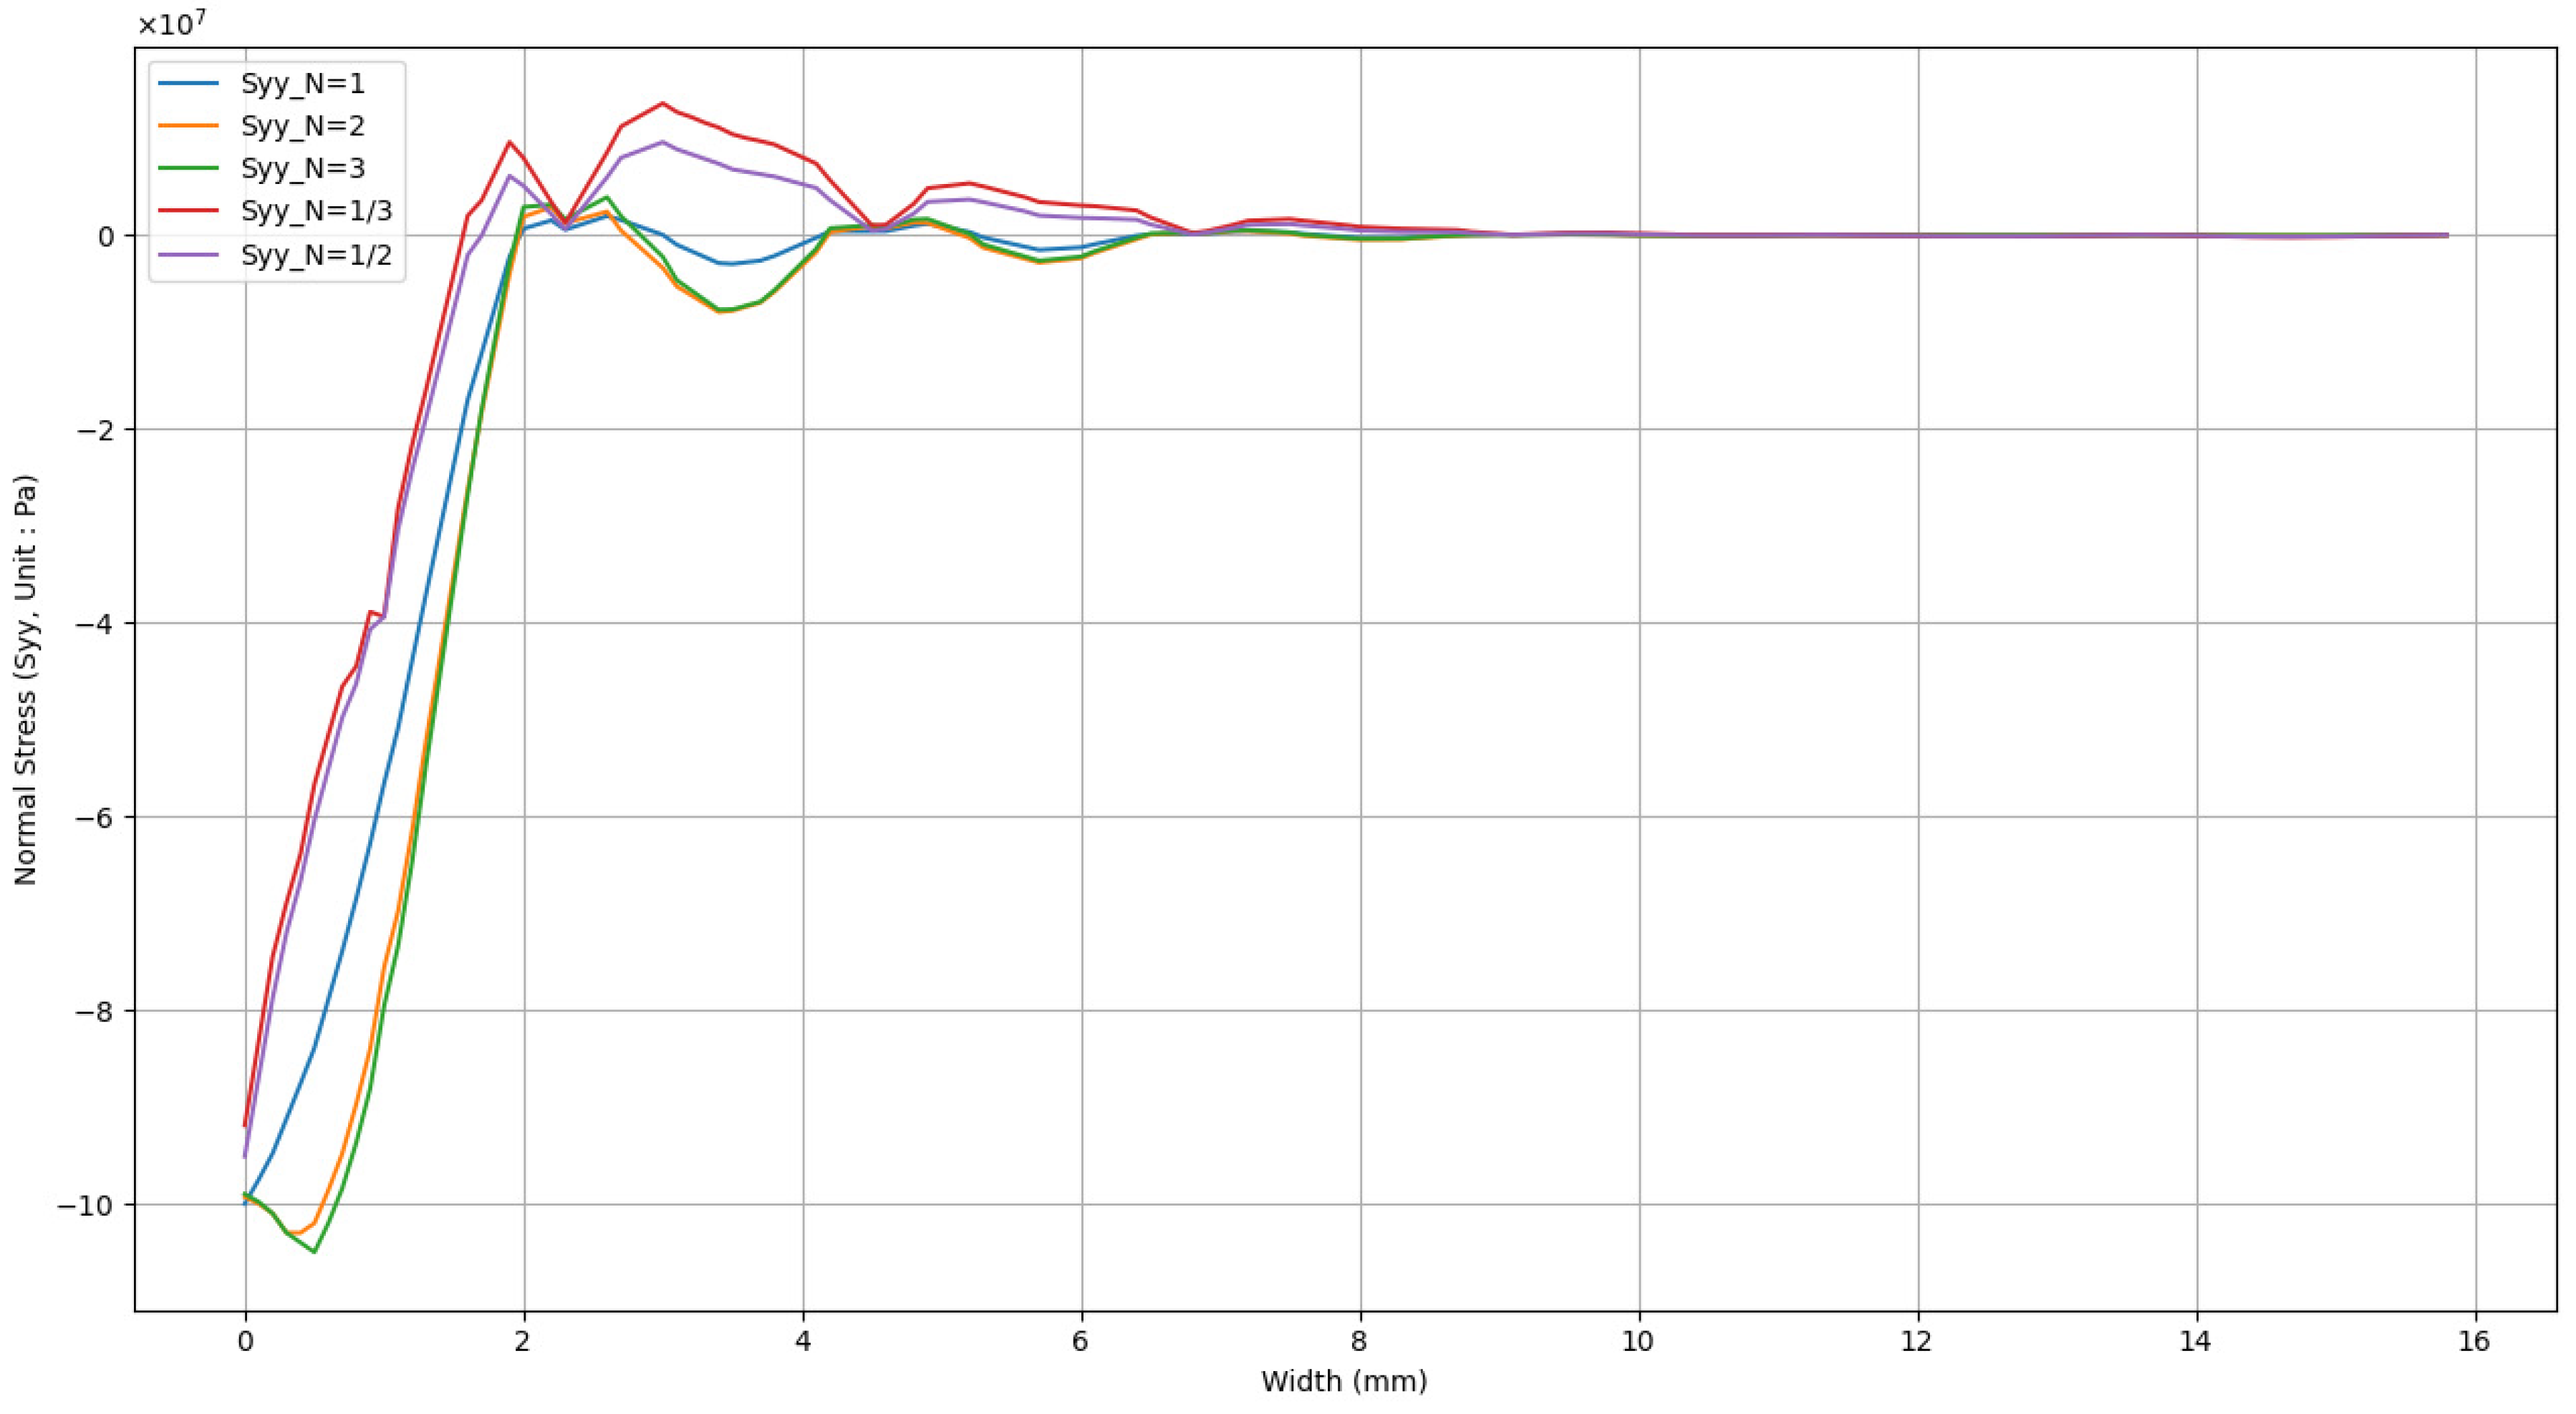
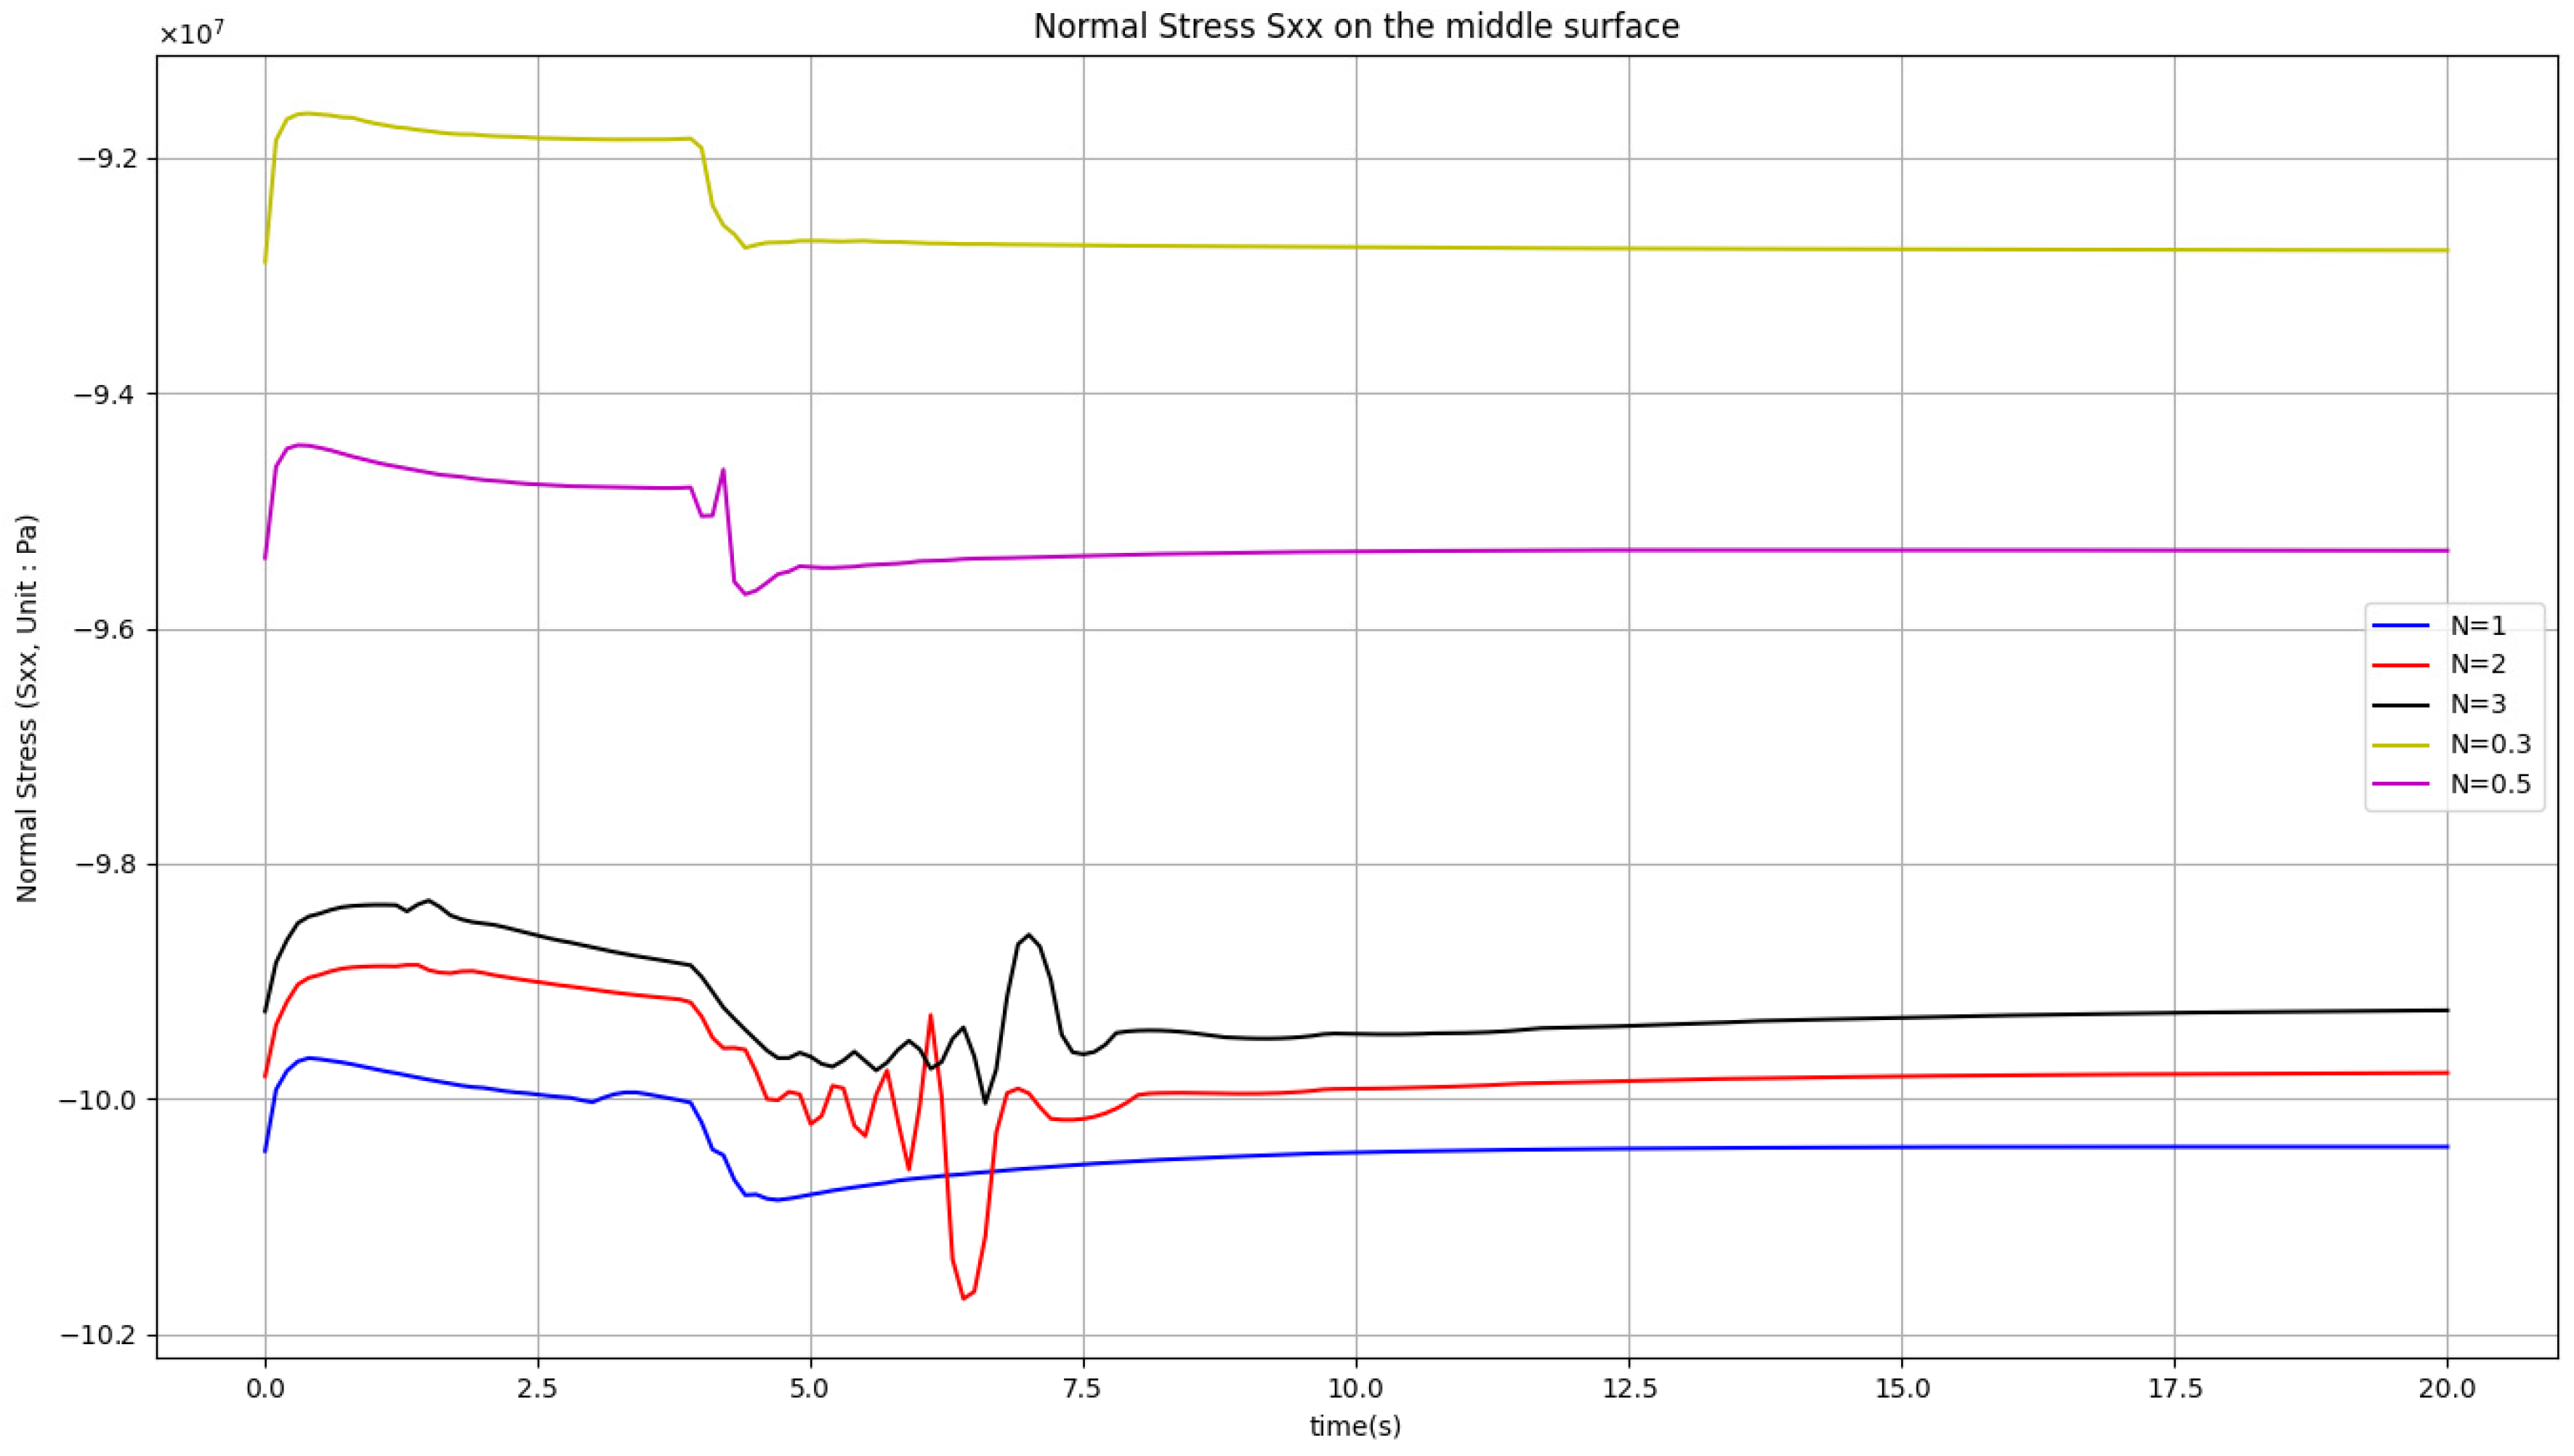
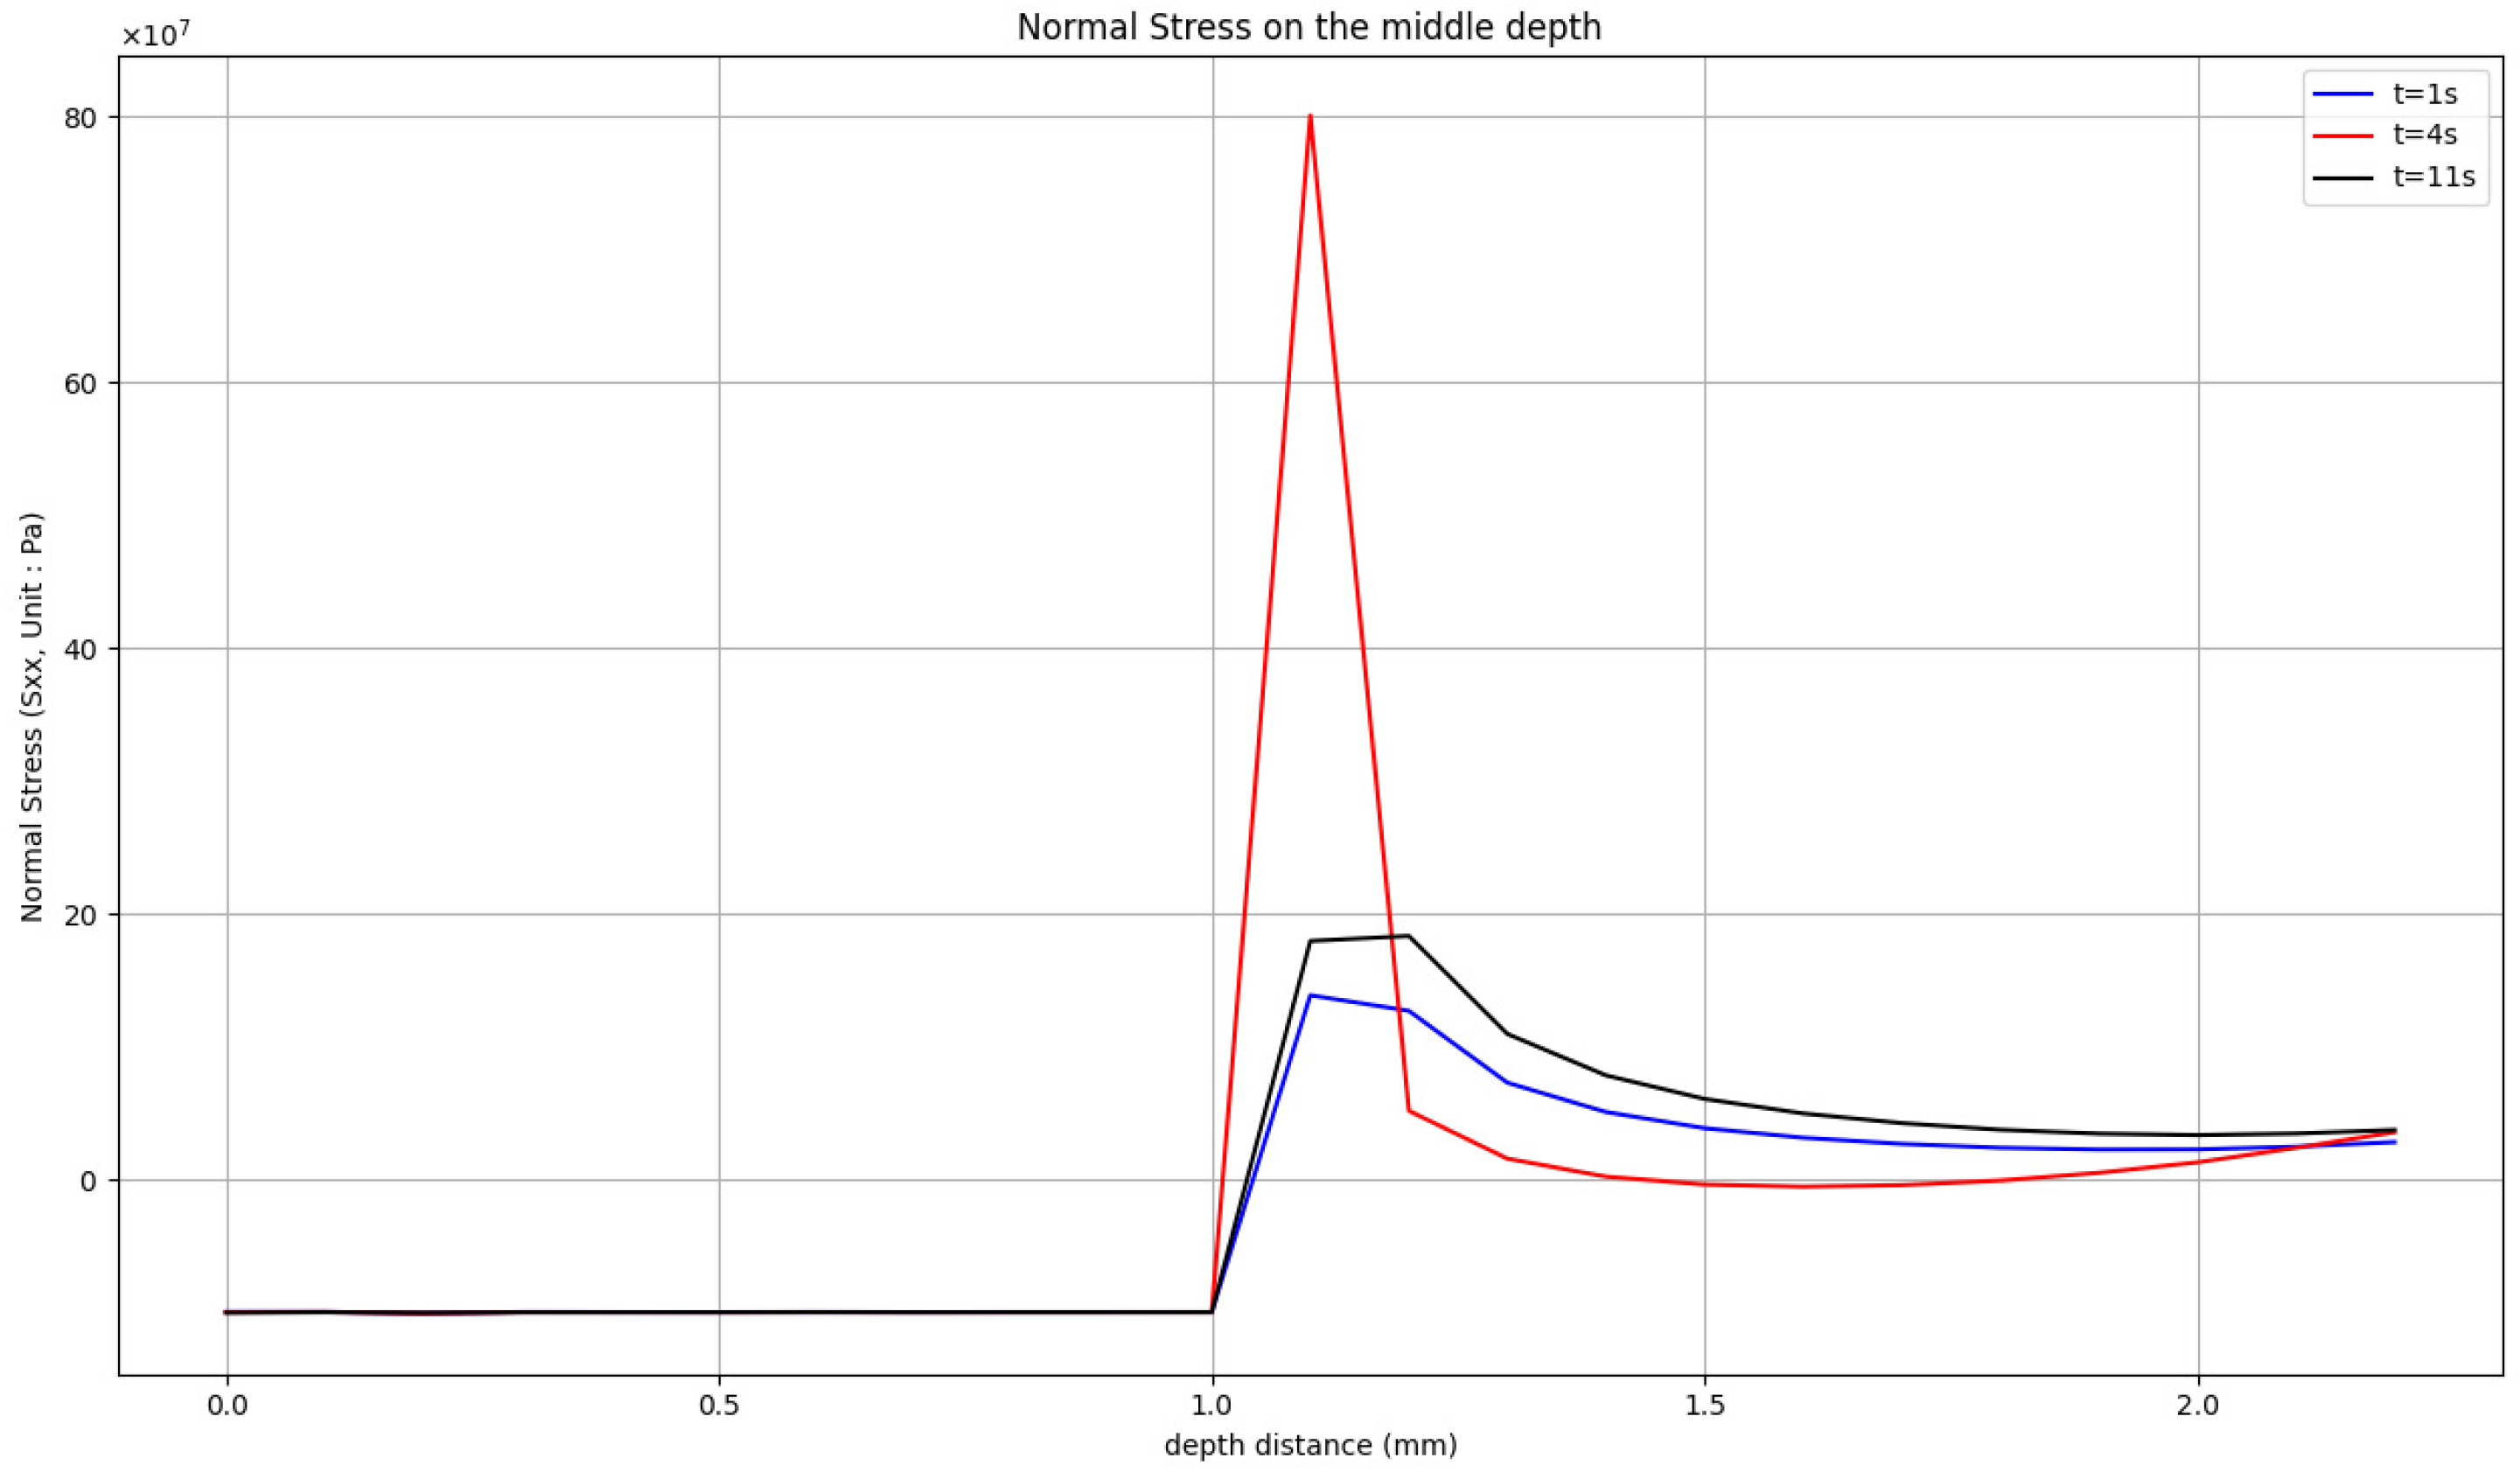
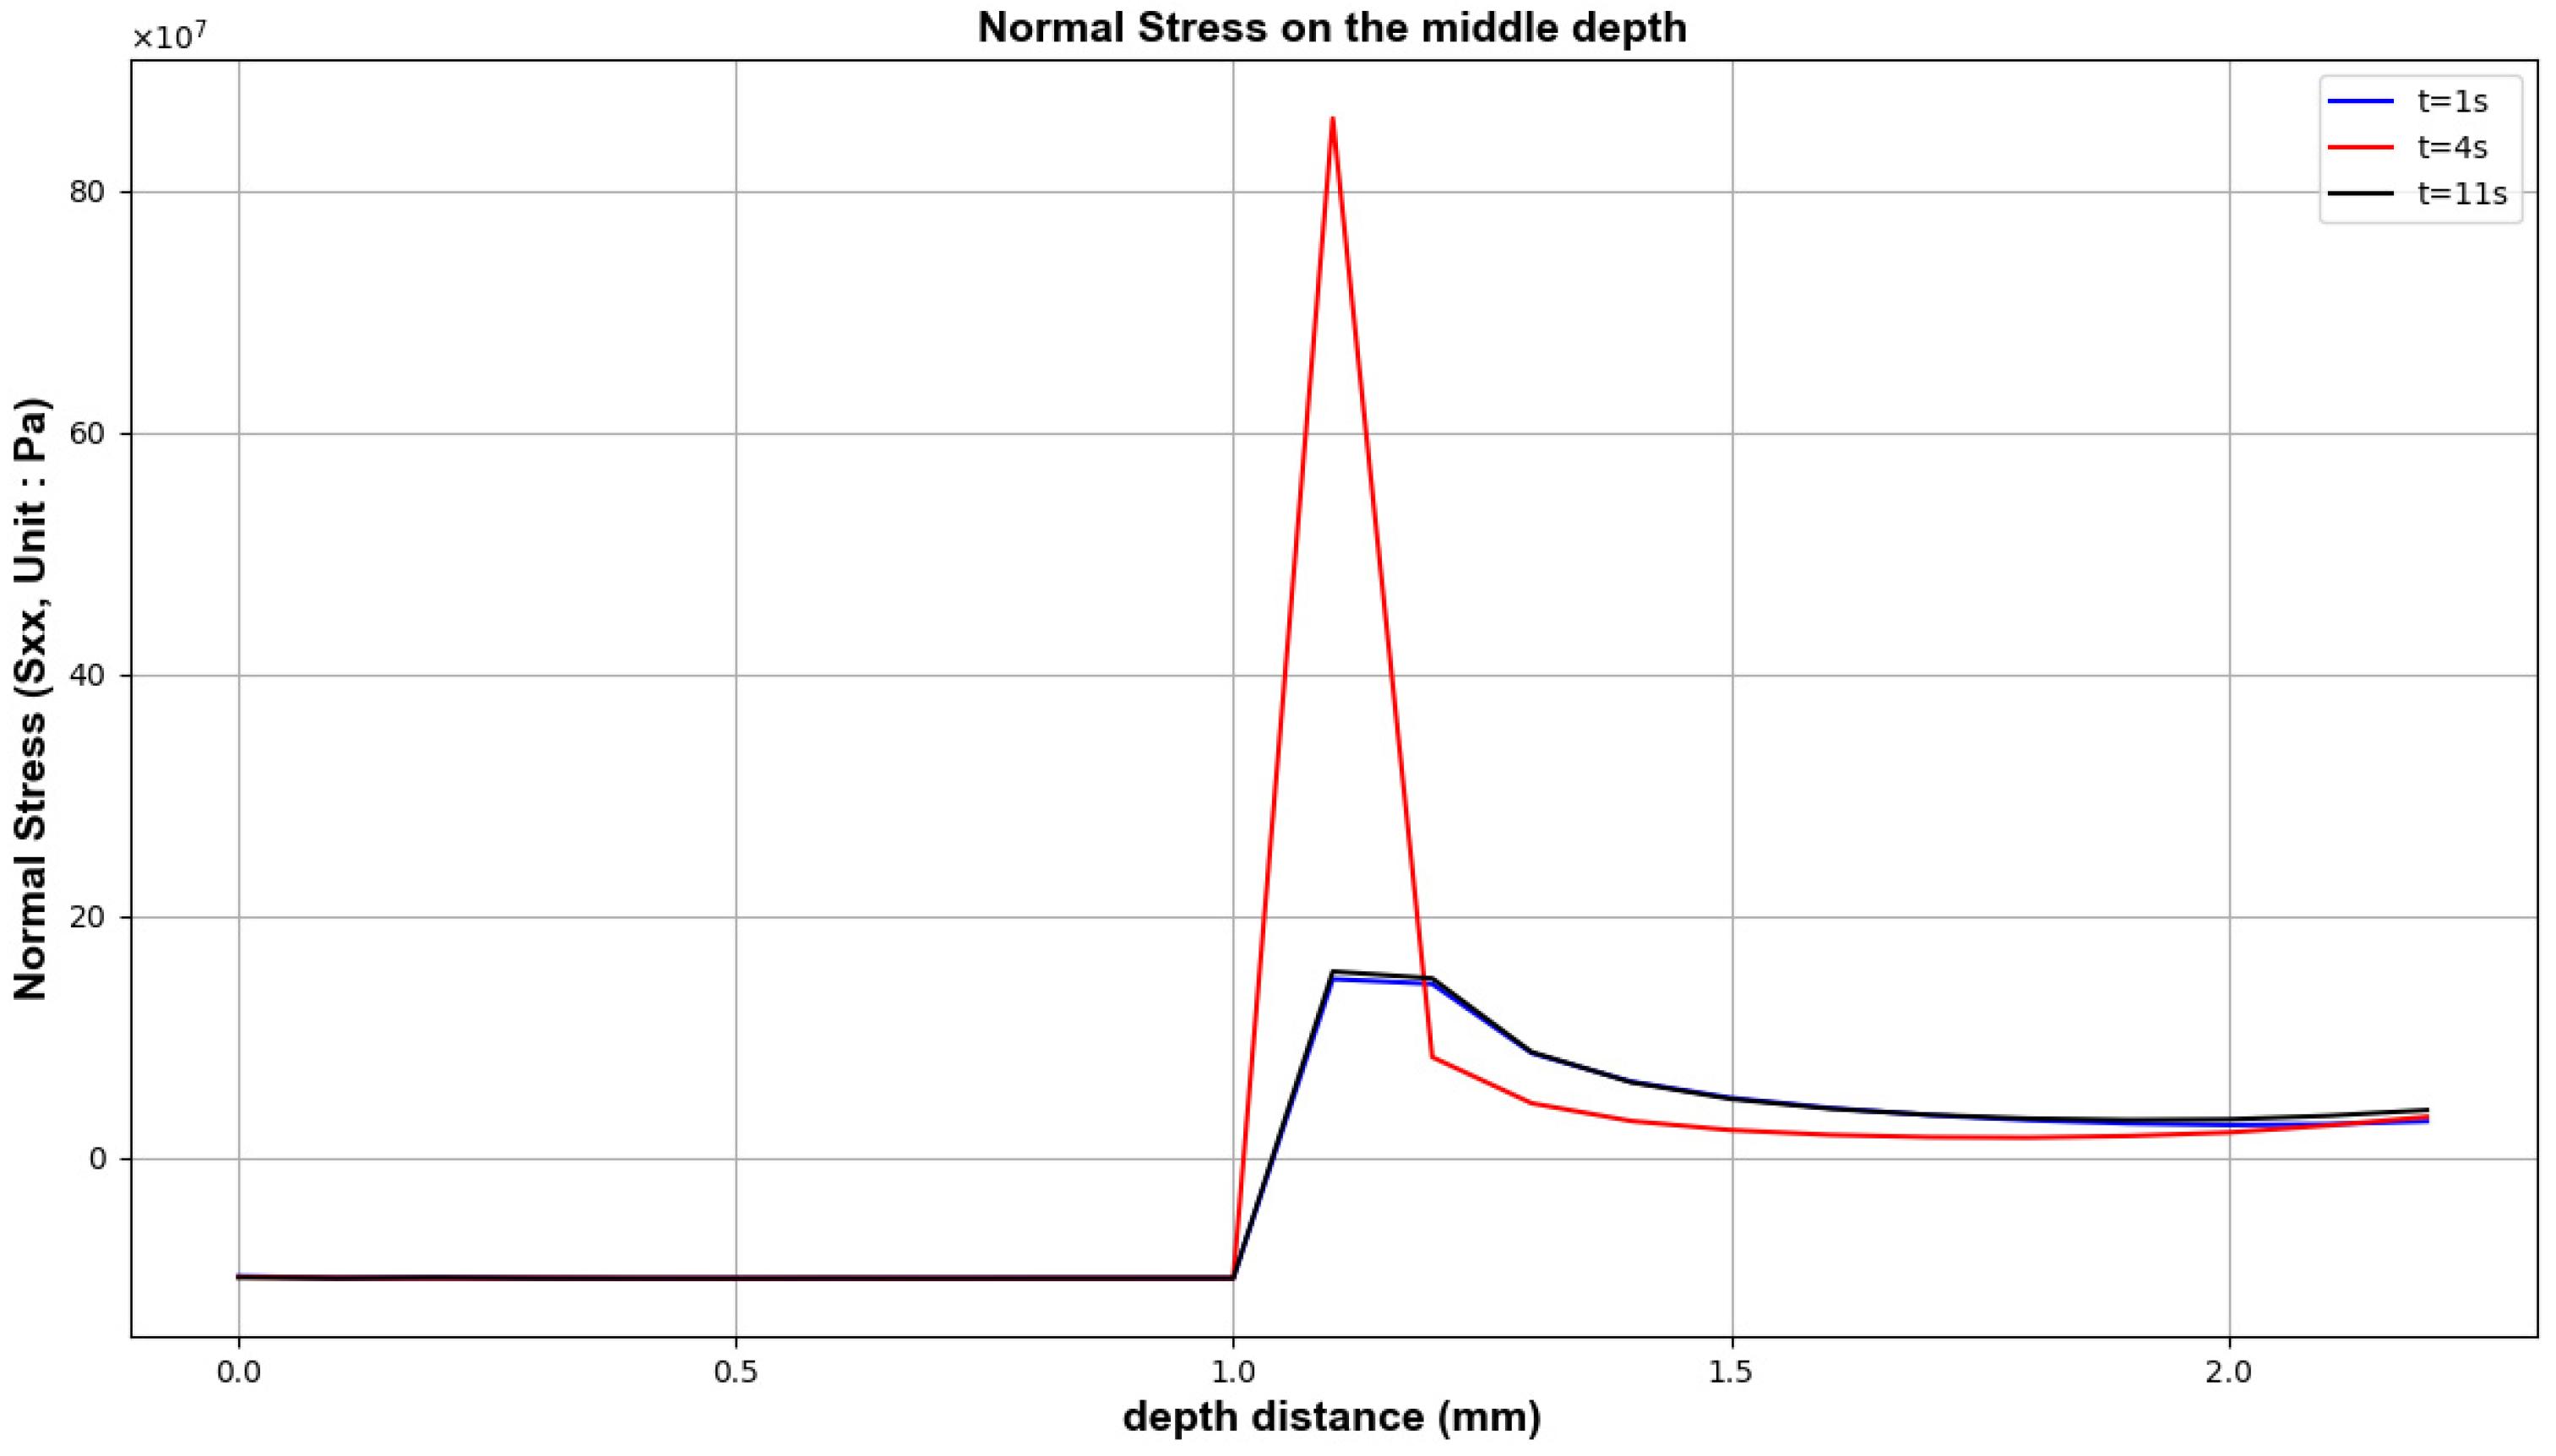
  • Stress analysis at both the interface and surface reveals that the CPI 10 design effectively reduces tensile and shear stresses at the interface as the volume fraction mixture increases. Although the CPI 10 design does not lower the surface tensile stress, the two-phase functionally graded coatings can reduce it to below 1.15 MPa, even rendering it compressive. This is an acceptable level for ceramic materials. Furthermore, evaluations of the normal stress distribution along the TBC surface and coating central line indicate that a higher volume ratio of yttria-stabilized zirconia (YSZ) relative to the NiCoCrAlY bond coat results in lower thermal stress during shock testing. This suggests that further optimization of the stress distribution is possible by applying the CPI 10 design to the surface and adopting a three-rule linear distribution (N = 3) in the functionally graded coatings.

Author Contributions

Writing—original draft, K.-C.L.; Writing—review & editing, J.-K.K., P.-H.H. and C.-Y.H. All authors have read and agreed to the published version of the manuscript.

Funding

This research received no external funding.

Institutional Review Board Statement

Not applicable.

Informed Consent Statement

Not applicable.

Data Availability Statement

Data are contained within the article.

Conflicts of Interest

The authors declare no conflict of interest.

References

  1. Yanyan, Z.; Wei, Z.; Licheng, G. Investigations of the Fracture Mechanics of Nonhomogeneous Materials Under Thermal Shock Loading. Doctoral Dissertation, Harbin Institute of Technology, Harbin, China, 2014. [Google Scholar]
  2. Erdogan, F.; Wu, B.H. Crack problems in FGM layers under thermal stress. J. Therm. Stress. 1995, 19, 237–265. [Google Scholar] [CrossRef]
  3. Cho, J.R.; Ha, D.Y. Averaging and finite element discretization approaches in the numerical analysis of functionally graded materials. Mater. Sci. Eng. A 2001, 302, 187–196. [Google Scholar] [CrossRef]
  4. Wang, T.; Xueling, F.; Yongle, S. The stress and cracks in thermal barrier coating system: A review. Chin. J. Solid Mech. 2016, 37, 477–517. [Google Scholar]
  5. Xu, Z.; Huang, G.; He, L.; Mu, R.; Wang, K.; Dai, J. Effect of grit blasting on the thermal cycling behavior of diffusion aluminide/YSZ TBCs. J. Alloys Compd. 2014, 586, 1–9. [Google Scholar] [CrossRef]
  6. Jian, C.Y.; Hashida, T.; Takahashi, H.; Saito, M. Thermal shock and fatigue resistance evaluation of functionally graded coating for gas turbine blades by laser heating method. Compos. Eng. 1995, 5, 879–889. [Google Scholar]
  7. Xiong, H.P.; Kawasaki, A.; Kang, Y.S.; Watanabe, R. Experimental study on heat insulation performance of functionally graded metal/ceramic coatings and their fracture behavior at high surface temperatures. Surf. Coat. Technol. 2005, 194, 203–214. [Google Scholar] [CrossRef]
  8. Taylor, T.A.; Appleby, D.L.; Weatherill, A.E. Plasma-sprayed yttria-stabilized zirconia coatings: Structure-property relationships. Surf. Coat. Technol. 1990, 43, 470–480. [Google Scholar] [CrossRef]
  9. Zhou, B.; Kokini, K. Effect of preexisting surface cracks on the interfacial thermal fracture of thermal barrier coatings: An experimental study. Surf. Coat. Technol. 2004, 187, 17–25. [Google Scholar] [CrossRef]
  10. Bhattacharya, S.; Singh, I.V.; Mishra, B.K. Fatigue-life estimation of functionally graded materials using XFEM. Eng. Comput. 2013, 29, 427–448. [Google Scholar] [CrossRef]
  11. Thamburaja, P.; Sarah, K.; Srinivasa, A.; Reddy, J.N. Fracture of viscoelastic materials: FEM implementation of a non-local & rate form-based finite-deformation constitutive theory. Comput. Methods Appl. Mech. Eng. 2019, 354, 871–903. [Google Scholar] [CrossRef]
  12. Paulino, H.; Kim, J.H. Mixed-mode J-integral formulation and implementation using graded elements for fracture analysis of nonhomogeneous orthotropic materials. Mech. Mater. 2003, 35, 107–128. [Google Scholar]
  13. Kim, J.H.; Paulino, G.H. Finite element evaluation of mixed mode stress intensity factors in functionally graded materials. Int. J. Numer. Methods Eng. 2001, 53, 1903–1935. [Google Scholar] [CrossRef]
  14. Ozturk, M.; Erdogan, F. Mode I crack problem in an inhomogeneous orthotropic medium. Int. J. Eng. Sci. 1997, 35, 869–883. [Google Scholar] [CrossRef]
  15. Erdogan, F.; Wu, B.H. The surface crack problem for a plate with functionally graded properties. J. Appl. Mech. 1997, 64, 449–456. [Google Scholar] [CrossRef]
  16. Shih, C.F.; Loreniz, H.G.; German, M.D. Crack extension modeling with singular quadratic isoparametric elements. Int. J. Fract. 1976, 12, 647–651. [Google Scholar] [CrossRef]
  17. Leslie, B.S.; Hershokovitz, I.; Wawrzynek, P.A. Methods for calculating stress intensity factors in anisotropic materials: Part I-z=0 is a symmetric plane. Eng. Fract. Mech. 2004, 72, 2328–2358. [Google Scholar]
  18. Zhou, B.; Kokini, K. Effect of surface pre-crack morphology on the fracture of thermal barrier coatings under thermal shock. Acta Mater. 2004, 52, 4189–4197. [Google Scholar] [CrossRef]
  19. Mehboob, G.; Xu, T.; Li, G.-R.; Hussain, S.; Mehboob, G.; Tahir, A. Strain-Induced Cracking Behavior of Coating/Substrate Systems and Strain Tolerant Design for Thick Coatings. Coatings 2020, 10, 1066. [Google Scholar] [CrossRef]
  20. Mehboob, G.; Xu, T.; Li, G.-R.; Yang, G.-J.; Tahir, A.; Ragab, M.; Hussain, S. Tailoring Periodic Vertical Cracks in Thermal Barrier Coatings Enabling High Strain Tolerance. Coatings 2021, 11, 720. [Google Scholar] [CrossRef]
  21. Lee, S.S.; Yoon, D.J.; Lee, J.H. Finite element analysis of residual stress in NiCrAlY/yttria-stabilized Zirconia Coatings by Nanoscale Multi-layered Deposition. Key Eng. Mater. 2004, 270–273, 58–63. [Google Scholar]
  22. Kim, J.H.; Paulino, G.H. Mixed-mode fracture of orthotropic functionally graded materials using finite elements and the modified crack closure method. Eng. Fract. Mech. 2002, 69, 1557–1586. [Google Scholar] [CrossRef]
  23. Rangaraj, S.; Kokini, K. Interface thermal fracture in functionally graded zirconia-mullite-bond coat alloy thermal barrier coatings. Acta Mater. 2003, 51, 251–267. [Google Scholar] [CrossRef]
  24. Zhou, B.; Kokini, K. The Effect of the Pre-Existing Surface Crack Morphologies on the Thermal Fracture of Ceramic Coatings. Doctoral Dissertation, Purdue University, West Lafayette, IN, USA, 2003. [Google Scholar]
  25. Gilber, A.; Kokini, A. Thermal fracture of zirconia-mullite composite thermal barrier coatings under thermal shock: A numerical study. Surf. Coat. Technol. 2008, 202, 2152–2161. [Google Scholar] [CrossRef]
  26. Khor, K.A.; Gu, Y.W. Effects of residual stress on the performance of plasma sprayed functionally graded ZrO2/NiCoCrAlY coatings. Mater. Sci. Eng. 2000, 277, 64–76. [Google Scholar] [CrossRef]
  27. Dombrovsky, L.A.; Rousseau, B.; Echegut, P.; Randrianalisoa, J.H.; Baillis, D. High Temperature Infrared Properties of YSZ Electrolyte Ceramics for SOFCs: Experimental Determination and Theoretical Modeling. Am. Ceram. Soc. 2011, 94, 4310–4316. [Google Scholar] [CrossRef]
  28. Patricio, M.; Mattheij, R.M.M. Crack Propagation Analysis; (CASA-Report; Vol. 0723); Eindhoven University of Technology: Eindhoven, The Netherlands, 2007. [Google Scholar]
  29. Eischien, J.R. Fracture of nonhomogeneous materials. Int. J. Fract. 1987, 34, 3–22. [Google Scholar] [CrossRef]
  30. Sollero, P.; Aliabodi, M.H. Fracture mechanics analysis of anisotropic plates by the boundary element method. Int. J. Fract. 1993, 64, 269–284. [Google Scholar] [CrossRef]
  31. Liebowitz, H.; Sih, G. Mathematical Theory of Brittle Fracture; Academic Press: New York, NY, USA, 1968. [Google Scholar]
  32. Batra, R.C.; Jin, Z.H. Some basic fracture mechanics concepts in functionally graded materials. J. Mech. Phys. Solids 1996, 44, 1221–1235. [Google Scholar]
Figure 1. Structure of the substrate samples used for the preparation of TBC coatings with preexisting cracks. (a) 3D diagram; (b) 2D diagram.
Coatings 15 00362 g001
Figure 2. Diagram of the two-phase model.
Coatings 15 00362 g002
Figure 3. The traditional structure of the TBC coating and FGM coating model.
Coatings 15 00362 g003
Figure 4. Thermal shock test diagram.
Coatings 15 00362 g004
Figure 5. The closed integral crack tip path.
Coatings 15 00362 g005
Figure 6. Finite element DCT construction close to the crack tip [22].
Coatings 15 00362 g006
Figure 7. (a) The TBC-substrate model with preexisting cracks; (b) the TBC-substrate model without preexisting cracks.
Coatings 15 00362 g007
Figure 8. (a) Gaussian laser boundary; (b) pulse duration of step function.
Coatings 15 00362 g008
Figure 9. (a) Quadrilateral element; (b) triangular element. [16].
Coatings 15 00362 g009
Figure 10. The finite element model close to the preexisting crack tip. (a) The symmetric model of TBC coatings established by Comsol−Multiphysics; (b) the finite elements close to the crack tips.
Coatings 15 00362 g010
Figure 11. The fracture toughness and SIF comparison for single crack with a length of 0.36 mm.
Coatings 15 00362 g011
Figure 12. The fracture toughness and SIF comparison for a single crack with a length of 1.1 mm.
Coatings 15 00362 g012
Figure 13. The fracture toughness and SIF comparison for a CPI 10 preexisting crack.
Coatings 15 00362 g013
Figure 14. The fracture toughness and SIF comparison for a CPI 10 preexisting crack (functionally graded TBC coating model).
Coatings 15 00362 g014
Figure 15. The temperature evolution of traditional TBC coatings and functionally graded TBC coatings.
Coatings 15 00362 g015
Figure 16. The temperature distribution at the crack tip for different volume fractions: (a) N = 1, t = 0 s; (b) N = 1, t = 4 s; (c) N = 1, t = 10 s; (d) N = 3, t = 0 s; (e) N = 3, t = 4 s; (f) N = 3, t = 10 s; (g) N = 1/3, t = 0 s; (h) N = 1/3, t = 4 s; (i) N = 1/3, t = 10 s.
Coatings 15 00362 g016aCoatings 15 00362 g016bCoatings 15 00362 g016cCoatings 15 00362 g016dCoatings 15 00362 g016e
Figure 17. Diagram depicting the interface normal stress in the x direction (traditional TBC coatings and preexisting crack model).
Coatings 15 00362 g017
Figure 18. Diagram depicting the interface normal stress in the x direction (CPI10 model with functionally graded material).
Coatings 15 00362 g018
Figure 19. The interface shear stress diagram (traditional TBC coatings and preexisting crack model).
Coatings 15 00362 g019
Figure 20. The interface shear stress diagram (CPI 10 model with functionally graded material).
Coatings 15 00362 g020
Figure 21. Diagram depicting the surface normal stress in the y direction (traditional TBC coatings and preexisting crack model).
Coatings 15 00362 g021
Figure 22. Diagram depicting the surface normal stress in the y direction (CPI 10 model with functionally graded material).
Coatings 15 00362 g022
Figure 23. The transient surface normal stress (Sxx) diagram of the middle preexisting crack of TBC coatings (CPI 10 model with functionally graded material).
Coatings 15 00362 g023
Figure 24. The normal stress distributions (x-axis) along the TBC surface and along the central line through the TBC thickness at different stages (CPI 10 model with functionally graded material, N = 1).
Coatings 15 00362 g024
Figure 25. The normal stress distributions (x-axis) along the TBC surface and along the central line through the TBC thickness at different time stages (CPI 10 model with functionally graded material, N = 0.3).
Coatings 15 00362 g025
Figure 26. The normal stress distributions (x-axis) along the TBC surface and along the central line through the TBC thickness at different time stages (CPI 10 model with functionally graded material, N = 3).
Coatings 15 00362 g026
Table 1. Mechanical properties [14,25,26].
Temperature
(°K)
Young’s Modulus (GPa)Density (kg/m3)Poisson’s Ratio
(m/m)
Thermal Conductivity
(W/m°K)
Specific HeatThermal Expansion Coefficient
(10−6/°K)
INCO HX29320788800.31290.5461 (J/kg·K)12.7
67318288800.31265.3460 (J/kg·K)16.4
107315088800.31273.9460 (J/kg·K)-
NiCoCrAlY
(BC, bond coating)
30064.562910.33.82460 (J/kg·K)10.3
100053.062910.37.93617 (J/kg·K)10.5
150043.062910.39.86617 (J/kg·K)11.4
YSZ30013.656000.251.01500 (J/kg·K)7.5
100010.456000.250.83637 (J/kg·K)9.0
15008.056000.250.83656 (J/kg·K)9.7
Table 2. The comparison of SIF values calculated using the DCT method and J-integral with different element types [16].
a/wKI Calculated Using DCT MethodKI Calculated Using J-Integral
0.251.1291.109
0.501.1811.162
0.751.4651.437
Disclaimer/Publisher’s Note: The statements, opinions and data contained in all publications are solely those of the individual author(s) and contributor(s) and not of MDPI and/or the editor(s). MDPI and/or the editor(s) disclaim responsibility for any injury to people or property resulting from any ideas, methods, instructions or products referred to in the content.

