Abstract
This study examines the microstructure and corrosion resistance of FeCrNiAl0.7Cu0.3Six (x = 0, 0.1, 0.3, and 0.5) high-entropy alloys (HEAs) in a 3.5% NaCl solution. X-ray diffraction (XRD), scanning electron microscopy (SEM), energy-dispersive spectroscopy (EDS), and electrochemical testing were employed to systematically analyze the alloys’ microstructures and corrosion behavior. The XRD results indicate that the addition of Si affects the phase structure of the alloy. At Si = 0, the alloy exhibits a single BCC phase. By increasing the Si content to 0.1 and 0.3, a BCC2 phase appears. At Si = 0.5, Si-containing intermetallic compounds form. SEM observations reveal that as the Si content increases, the alloy develops a distinct dendritic structure. Polarization tests in the 3.5% NaCl solution show that the corrosion current density first decreases and then increases with increasing Si content. At Si contents of 0.1, 0.3, and 0.5, the corrosion current densities are 4.275 × 10⁻⁶ A·cm−2, 4.841 × 10⁻⁷ A·cm−2, and 2.137 × 10⁻⁶ A·cm−2, respectively. FeCrNiAl0.7Cu0.3S0.3 HEA exhibits the lowest corrosion current density, indicating a lower corrosion rate. Electrochemical impedance spectroscopy (EIS) tests show that at Si = 0.3, the alloy has the largest capacitive arc radius. The charge-transfer resistance (RCT) for the alloys with the Si contents of 0.1, 0.3, and 0.5 are 2.532 × 10⁵ Ω·cm2, 4.088 × 10⁵ Ω·cm2, 4.484 × 10⁵ Ω·cm2, and 2.083 × 10⁵ Ω·cm2, respectively. FeCrNiAl0.7Cu0.3Si0.3 HEA has the highest RCT, which indicates a more stable passivation film and better resistance to chloride ion intrusion. The corrosion morphology observed after polarization testing shows that all alloys exhibit intergranular corrosion characteristics. The Si content alters the distribution of passivation film-forming elements, Cr and Ni. Compared to other alloys, the corrosion morphology of FeCrNiAl0.7Cu0.3Si0.3 HEA is more complete. Combining the polarization, EIS, and corrosion morphology results, it can be concluded that FeCrNiAl0.7Cu0.3Si0.3 HEA exhibits the best corrosion resistance in the 3.5% NaCl solution.
1. Introduction
High-entropy alloys (HEAs) are a new type of alloy system developed in recent years, based on multi-element design [1,2]. These alloys are composed of five or more metals, with each metal’s atomic fraction ranging from 5% to 35% [3,4]. Unlike traditional alloys, which rely on one or a few base elements, HEAs use the “high-entropy effect” to prevent the formation of complex intermetallic compounds. This allows them to form simple solid solution structures, such as BCC, FCC, or HCP phases [5,6,7]. As a result, HEAs offer improved mechanical properties, corrosion resistance, and high-temperature performance [8,9,10,11].
Due to their comprehensive properties, HEAs show promising application prospects across various fields. In practical applications, the safety and service life of materials are determined by both their corrosion resistance and mechanical properties. Therefore, considering the complex environments that materials may encounter, improving their corrosion resistance is crucial. Significant research has been conducted on the corrosion resistance of HEAs. For instance, Qiu et al. [12] tested nearly 20 HEAs in a 0.6 mol/L NaCl solution and found that their corrosion resistance was superior to that of carbon steel and aluminum alloys. Shi et al. [13] studied AlNiLaCe amorphous HEAs and found that increasing the Al and Ni contents raised the corrosion current density, thereby reducing their corrosion resistance. Hsu et al. [14] investigated the electrochemical behavior of FeCoNiCrCux HEAs and revealed that Cu segregation in the interdendritic region led to passive film breakdown and aggravated localized corrosion. Santos et al. [15] investigated the effect of chromium (Cr) content on the corrosion resistance of WC-Ni-Cr-Mo composites in chloride environments. They found that as the Cr content increased, the corrosion current density of the alloys decreased significantly. Specifically, when the Cr content was 11%, the corrosion current density was 18.60 × 10⁻⁵ A/cm2; at 13% Cr, it decreased to 3.65 × 10⁻⁵ A/cm2; and at 18% Cr, it further decreased to 1.10 × 10⁻⁶ A/cm2. This indicates that alloys with higher Cr content exhibit better corrosion resistance. The improved corrosion resistance with increased Cr content is primarily due to the formation of a denser protective oxide film on the alloy surface, which reduces the penetration of corrosive media and thereby lowers the corrosion current density.
In addition to the studies on traditional alloying elements, introducing nonmetallic elements (e.g., B, C, N, Si) to regulate the microstructure and phase stability is another active research area in the HEA field. For instance, in (VAlTiCrMo)Nx HEAs [16], the addition of N not only changes phase composition and growth patterns but also significantly increases hardness and wear resistance through interstitial solid solution strengthening. Wan et al. [17] found that as C content increased, the alloy transitioned from a single BCC phase to a BCC + FCC structure. Similarly, B has a notable effect on improving high-temperature performance [18]. Regarding Si, altering phase stability or inducing martensitic transformation has been experimentally confirmed to enhance both strength and ductility. Hou et al. [19] added Si to Fe50Mn30Co10Cr10 and observed a transformation from metastable FCC to martensite during deformation, achieving simultaneous improvements in both strength and ductility. Yuan et al. [20] employed induction melting to produce HfMo0.5NbTiV0.5Six alloys and found that the introduction of Si generated multiple silicides (Hf, Nb, Ti)ccSi3(Hf, Nb, Ti) 5 Si 3, accompanied by a sub-eutectic → eutectic → hypereutectic structural evolution; this not only increased the alloys’ hardness and strength but also enhanced their wear resistance. Shen et al. [21] used gas atomization to prepare AlCoCrCuFeNiSixHEAs and reported that the Si addition lowered segregation while increasing hardness. Currently, vacuum arc melting is commonly employed to synthesize HEAs, allowing the fabrication of high-melting-point, refractory alloys under oxygen-free conditions to remove impurities.
In prior work [22,23,24], our research group studied HEAs based on Fe, Cr, Co, Al, and Cu for laser cladding coatings on aluminum alloys, confirming their excellent wear and corrosion resistance. To address cost and resource concerns associated with Co, this study focuses on Fe, Cr, Ni, Al, and Cu to design a FeCrNiAl0.7Cu0.3 HEA. Based on previous findings and the literature on Si’s effect on phase structure and corrosion behavior, different amounts of Si (x = 0, 0.1, 0.3, 0.5) were introduced into the alloy via vacuum arc melting to produce FeCrNiAl0.7Cu0.3Six. This work investigates the impact of Si content on the alloy’s microstructure and corrosion resistance, providing insights into the underlying mechanisms and offering new perspectives for HEA designs and applications. The purpose of this paper is to explore the influence of Si content on the alloy’s properties, focusing on its effects on phase structure, microstructure, and corrosion resistance and to offer a deeper understanding of the design principles for HEAs with enhanced performance in harsh environments.
2. Materials and Methods
The metal raw materials used in this experiment include Fe, Ni, Cr, Al, Cu, and Si, all with a purity of 99.99%. First, the target compositions of each element are calculated based on the alloy’s molar ratio. Fe, Ni, and Cr are set to have equal molar ratios, with Al having a molar ratio of 0.7, Cu having a molar ratio of 0.3, and Si content varying at 0, 0.1, 0.3, and 0.5. These compositions result in the designations FeNiCrAl0.7Cu0.3Six (where x = 0, 0.1, 0.3, and 0.5). For simplicity, these alloys are referred to as Si0, Si1, Si3, and Si5, respectively.
The alloy was melted using a vacuum arc furnace (MTDH-600 model, Shanghai Mengting, China) with high-purity argon as the protective gas. The arc furnace allows current regulation, enabling the arc temperature to exceed 1500 °C, thereby melting high-melting-point elements and ensuring uniform mixing in the liquid state. This experiment involved multiple metallic elements with significant differences in melting points and densities. To minimize metal splashing during arc melting, a layered sample placement strategy was adopted, prioritizing low-melting-point metals at the bottom of the crucible. First, Al, the metal with the lowest melting point, was placed at the bottom, followed by the other metals in ascending order of melting point, and the furnace chamber was sealed.
Subsequently, the furnace was evacuated to 6.0 × 10⁻³ Pa, and argon was introduced to 0.5 atm to prevent sample oxidation, maintaining this pressure throughout the melting process. The initial arc ignition was used to remove residual oxygen, followed by melting at a current of 20 A and a voltage of 350 V. To ensure compositional homogeneity, the alloy was flipped five times during melting, ultimately forming button-shaped ingots.
First, the prepared high-entropy alloy ingot was cut using an electrical discharge wire-cutting machine. Subsequently, the sample surface was progressively polished using 200#, 600#, 1000#, 1500#, and 2000# silicon carbide sandpaper, from coarse to fine. After completing the sandpaper polishing, the sample was further polished with diamond polishing paste to enhance surface smoothness. Finally, the sample was placed in anhydrous ethanol and ultrasonically cleaned for 10 min to remove residual contaminants from the surface, ensuring it was prepared for subsequent microstructural observation and performance testing.
The crystal structure of the alloy was characterized using an XRD7000S X-ray diffractometer (XRD) manufactured Shimadzu Corporation, Tokyo, Japan. The experimental parameters included a Cu target with Kα radiation (wavelength of 0.154056 nm), an operating voltage of 40 kV, an operating current of 40 mA, a scanning range (2θ) of 10–90°, a scan speed of 4°/min, and a step size of 0.02°. The microstructure was analyzed using an FEI Quanta 650 FEG scanning electron microscope (SEM) from the FEI Company, Hillsboro, OR, USA. The Netherlands, equipped with an Oxford energy-dispersive spectroscopy (EDS) system for elemental analysis.
The sample preparation method for electrochemical corrosion testing is as follows: First, the 10 mm × 10 mm × 3 mm corrosion test sample underwent metallographic preparation, which included sequential grinding with 200#, 600#, 1000#, and 1500# silicon carbide sandpaper, followed by polishing with a diamond polishing paste to ensure surface smoothness. Then, a copper wire was soldered to the back of the sample using a soldering iron for electrical connection. After soldering, the sample was placed in a metallographic mold and encapsulated with epoxy resin, leaving only the 10 mm × 10 mm unwelded test surface exposed. The epoxy resin was fully cured, and the sample was removed, providing a prepared specimen for subsequent electrochemical corrosion testing.
The electrochemical tests were conducted at room temperature using the CHI660E electrochemical workstation manufactured by Shanghai Chenhua Instrument Co., Ltd., Shanghai, China. A three-electrode system was employed, with the working electrode being the test sample with an exposed area of approximately 1 cm2, the reference electrode being a saturated calomel electrode (SCE), and the counter electrode being a large-area platinum sheet electrode. The corrosion medium was a 3.5% (mass fraction) NaCl solution, prepared using single-distilled water, with analytical-grade reagents. Prior to the electrochemical tests, the open-circuit potential (OCP) was recorded for 400 s to ensure better electrochemical stability of the entire system during testing. Once a stable OCP was achieved, electrochemical impedance spectroscopy (EIS) testing was conducted using a 10 mV sinusoidal perturbation over a frequency range of 0.01 Hz to 105 Hz. The EIS data were fitted and analyzed using Zsimpwin software (Version 3.30). To comprehensively evaluate the EIS performance of the samples, two sets of experiments were conducted: one without prior immersion and another after 24 h of immersion. For polarization curve measurements, the potential range was set from −0.8 V (vs. SCE) to 1 V (vs. SCE), with a scanning rate of 10 mV/s.
3. Results and Discussion
3.1. XRD Analysis
Figure 1 presents the XRD pattern of the alloy. At Si = 0, the alloy exhibits a solid solution structure with a BCC phase. With the addition of Si, a new diffraction peak forms at approximately 31°, suggesting the emergence of a BCC2 phase, which is identified as the Al-Ni phase [25]. The emergence of the Al-Ni phase can be attributed to its more negative enthalpy of mixing, which favors its thermodynamic stability. As the Si content reaches 0.3, the alloy retains both BCC1 and BCC2 phases. Si has an atomic radius similar to that of other alloying elements, and its addition further increases the atomic radius difference between the elements in the alloy. This increased atomic radius disparity facilitates the easier insertion of Si into the interstitial spaces between different elements, leading to lattice expansion and deformation, which induces lattice distortion [26]. Additionally, the enhanced atomic radius difference also promotes the stability and formation of the BCC phase [27].
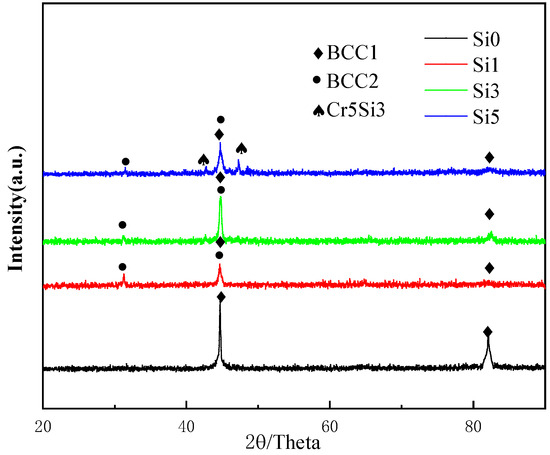
Figure 1.
XRD patterns of FeCrNiAl0.7Cu0.3Six HEA with different Si contents.
When the Si content reaches five, the addition of Si exceeds the solubility limit of the BCC high-entropy phase, resulting in the formation of the Cr5Si3 phase. The number of phases observed after alloy melting is significantly lower than the predicted number of phases according to the Gibbs phase rule [28]. This phenomenon is primarily related to the combined effects of entropy and enthalpy. As the Si content increases, the mixing entropy rises, and the mixing enthalpy becomes increasingly negative [29]. Consequently, when an appropriate amount of Si is added, the system tends to favor a simpler phase constitution, predominantly stabilizing the existing high-entropy phases.
3.2. Microstructure Analysis
Figure 2 presents the backscattered electron images (BSIs) of the various specimens. For the alloy, no apparent phase separation was observed in the microstructure, which aligns with the XRD results indicating the presence of a single BCC phase, as shown in Figure 2a. With the introduction of Si into the alloy, gray-white regions emerged within the microstructure, and these regions did not exhibit a continuous distribution, as illustrated in Figure 2b. As the Si content increased to 0.3, the microstructure displayed a continuous dendritic gray-white region, accompanied by the formation of fine, dispersed precipitates within the grains, exhibiting a typical multiphase morphology; Figure 2c. Upon further increasing the Si content to 0.5, the dendritic structure became fragmented, the gray regions thickened, and an island-like distribution was observed (Figure 2d). In conjunction with the XRD analysis, it is evident that the Si addition promotes phase separation in the alloy, confirming its influence on the microstructural evolution. To gain deeper insights into the effects of Si on the elemental distribution within the HEA, EDS mapping analysis was performed on the representative region’s electrochemical stability.
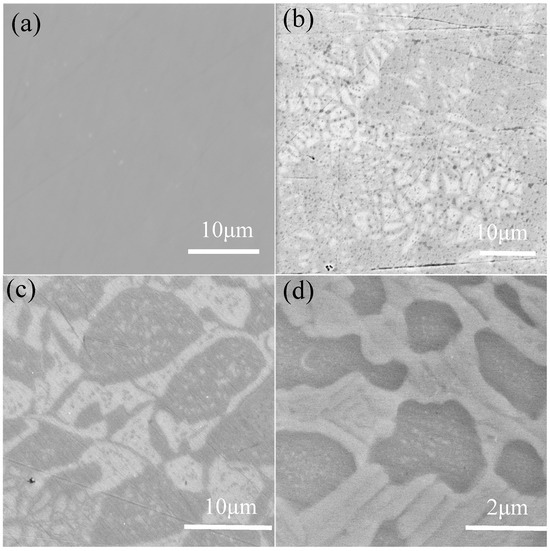
Figure 2.
The microstructure of FeCrNiAl0.7Cu0.3Six HEA in backscattered mode: (a) Si0, (b) Si1, (c) Si3, and (d) Si5.
Figure 3 displays the Si0, where the measured data closely match the nominal composition, indicating that no significant compositional evaporation losses occurred during the alloy preparation process.
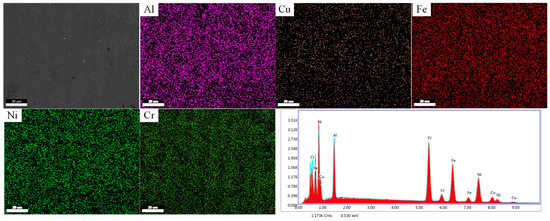
Figure 3.
SEM image of Si0 alloy with X-ray maps and EDS spectrum.
Figure 4a reveals that for the Si1 alloy, the distribution of Fe is relatively uniform, with the distribution patterns of Al and Ni showing consistency. However, these two elements exhibit a distinct distribution compared to Cr. The distribution of Si and Cu is largely consistent with that of Fe. In the gray-white regions, Al and Ni are enriched, while Cr content is lower, indicating that the addition of Si promotes phase separation between Al, Ni, and Cr. In Figure 4b, the distribution patterns of the elements in the Si3 alloy become more pronounced. Al, Ni, and Cu are mainly concentrated in the gray-white regions, while Fe, Cr, and Si are more localized in the gray regions. Si transitions from its initial solid solution form to a compositional phase formed jointly by Fe and Cr. Figure 4c displays the compositional distribution of the Si5 alloy, where the distribution of Al and Si is similar, suggesting that Si participates in the distribution process of Al. Al, Ni, and Cu are enriched in the gray-white regions, while Cr is concentrated in the gray regions. Compared to Si3, the Si element in Si5 is more evenly distributed, indicating that the further addition of Si exceeds the solubility limit of Fe and Cr in the phases while promoting a more uniform distribution of Fe across the phases.
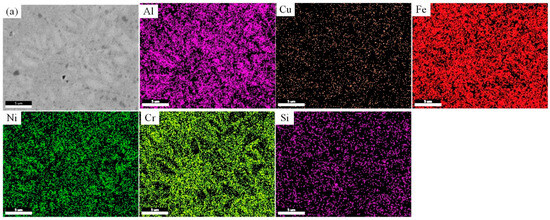
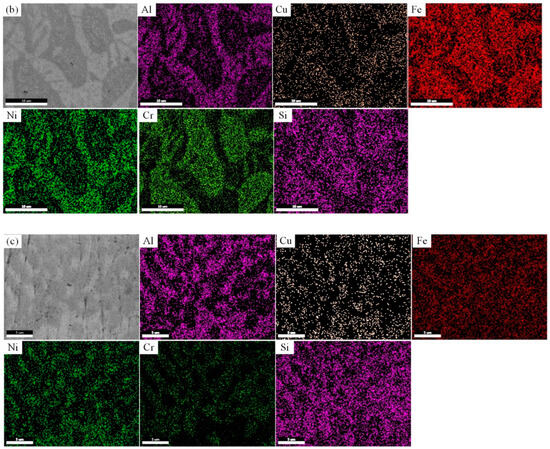
Figure 4.
The compositional scan images of FeCrNiAl0.7Cu0.3Six HEAs. (a) Si1; (b) Si3; (c) Si5.
3.3. Corrosion Resistance Analysis
The open-circuit potential curve changes in the FeCrNiAl0.7Cu0.3Six HEAs in the 3.5% NaCl solution are shown in Figure 5. From the figure, it can be seen that the OCP values differ under different Si contents. The magnitude of the OCP represents the tendency for corrosion; the more negative the OCP value, the greater the tendency for corrosion, and vice versa, the smaller the tendency for corrosion [30]. The OCP values of all samples increase with the experimental time and eventually reach a stable state [31]. At Si1, the OCP value is −0.285 V, and as the Si content increases, at Si5, the OCP value becomes −0.365 V. The OCP of the high-entropy alloy first decreases and then increases, with the material showing the greatest tendency for corrosion at Si5.
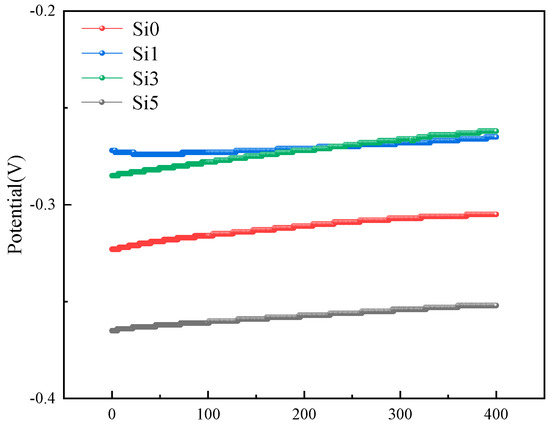
Figure 5.
The OCP FeCrNiAl0.7Cu0.3Six HEAs in 3.5% NaCl solution.
The four groups of specimens were subjected to potentiodynamic polarization scanning, and electrochemical parameters such as corrosion potential (Ecorr) and corrosion current density (Icorr) were derived through Tafel extrapolation, as shown in Table 1. Figure 6 presents the polarization curves of the four FeCrNiAl0.7Cu0.3Six HEA samples in a 3.5% NaCl solution. The pitting potential (Epit) appeared in the anodic regions of all the samples. A passive film formed on the material surface and began to enter the passivation stage, where the current almost no longer increased until the voltage reached the corresponding pitting potential, causing the passive film to break down. Above the Epit point, the corrosion current increased sharply, and all four alloys showed significant passivation behavior. The Si3 and Si5 alloys exhibited a characteristic wave feature, which is related to secondary passivation. According to the electrochemical corrosion theory, Ecorr and Icorr are two important indicators of the corrosion resistance of metals: Ecorr indicates the difficulty of alloy corrosion, with higher potential meaning more difficult corrosion and better corrosion resistance; Icorr is a parameter that measures the corrosion rate, with lower current density indicating better corrosion resistance [32,33]. The Icorr of the Si3 material is the smallest, 4.841 × 10⁻⁷ A·cm−2, and its Ecorr is −0.422 V. The breakdown potential (Eb) is 0.006 V, indicating good corrosion resistance; the Icorr values of the Si1 and Si4 alloys are 1.345 × 10⁻⁶ A·cm−2 and 2.137 × 10⁻⁶ A·cm−2, respectively, both greater than that of the Si3 alloy, and Si2alloy has the Eb (0.131 V); the Icorr of Si0 is the largest at 4.275 × 10⁻⁶ A·cm−2. A moderate increase in Si content can enhance the alloy’s corrosion resistance, as it exhibits more positive Ecorr and smaller Icorr. However, the excessive addition of Si elements reduces these properties.

Table 1.
Fitting values of polarization data for FeNiCrAl0.7Cu0.3Six HEA in 3.5% NaCl solution.
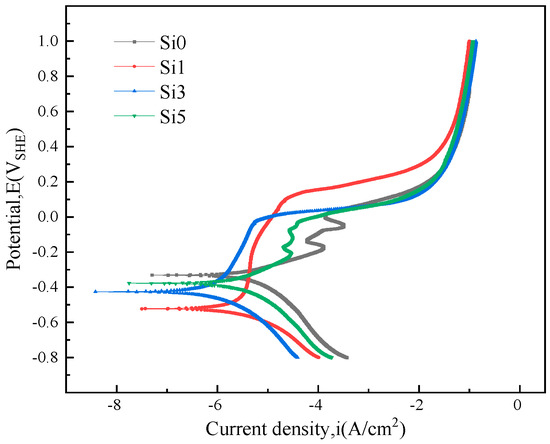
Figure 6.
The polarization curves of FeNiCrAl0.7Cu0.3Six HEA in 3.5% NaCl solution.
In the early corrosion resistance tests [24] of FeCoNiCrAl0.7Cu0.3 and FeCoNiCrAl0.7Cu0.3Si0.2 HEAs in a 3.5% NaCl solution, the Icorr values were found to be 3.25 × 10⁻⁸ A·cm−2 and 3.61 × 10⁻⁸ A·cm−2, respectively. These values are two orders of magnitude lower than those of the Co-free FeNiCr Al0.7Cu0.3Six HEAs, indicating that the Co-containing HEAs exhibit superior corrosion resistance. This improvement is attributed to the presence of Co, which may contribute to the formation of a more stable BCC or FCC phase. Additionally, Co facilitates the development of a more stable Cr and Ni oxide film, further enhancing the alloy’s corrosion resistance. Therefore, in practical engineering applications, a comprehensive selection can be made by balancing corrosion resistance and the lower cost characteristics of low-Co alloys.
For a deeper insight into the alloy’s corrosion mechanism, the morphology of the corroded samples was studied. Figure 7 shows the corrosion morphology of FeCrNiAl0.7Cu0.3Six HEAs. The results indicate that the Si content affects the corrosion resistance of the alloy. With an increase in Si content, the corrosion behavior of the alloy shows noticeable differences. The Si3 alloy exhibits a relatively smooth corrosion surface with only localized corrosion. In contrast, the corrosion traces on the Si0 and Si4 alloys are more prominent, with wider corrosion cracks forming at the grain boundaries. In all samples, corrosion spreads from the grain boundaries to the grain interior, indicating that the primary corrosion mechanism is intergranular corrosion.
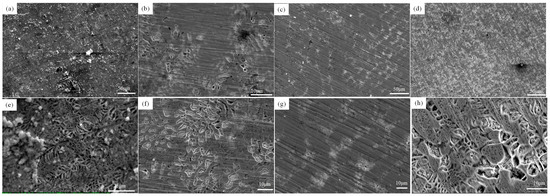
Figure 7.
Corrosion morphology of the alloys after polarization testing in 3.5% NaCl solution: (a,e) Si0, (b,f) Si1, (c,g) Si3, and (d,h) Si5.
The corrosion morphology of the alloy was analyzed using EDS area scanning, and the results are shown in Figure 8. Figure 8a presents the compositional analysis of the Si0, where certain regions exhibit significant Cr and Fe depletion, while these areas show a high Cl concentration. Based on the corrosion morphology characteristics, it can be inferred that these regions mainly consist of Al-rich corrosion products, whereas Fe, Cr, and Ni elements are distributed relatively uniformly. Figure 8b shows the compositional analysis of the Si. Unlike Si0, Al and Ni exhibit a consistent distribution pattern. As shown in Figure 8c, in the Si3, the elemental distribution trend is similar to that of the Si1. The Cl-enriched regions correspond to corrosion pits, where Al and Ni are depleted, while Fe and Cr are enriched. As depicted in Figure 8d, the Si5 also exhibits Al and Ni depletion in the Cl-rich corrosion pits, further confirming that Al and Ni are the easily corroded phases. Moreover, compared to Si3, the Si5 shows more voids in Cr distribution relative to Fe. XRD analysis indicates the formation of intermetallic compounds such as CrSi5 in the Si5, which reduces the corrosion resistance of Cr. This reduction is attributed to the increased heterogeneity of the passive film due to the precipitation of intermetallic compounds, leading to a decline in corrosion resistance in NaCl solution [34]. Additionally, the precipitation of intermetallic compounds forms micro-galvanic cells, further exacerbating galvanic corrosion. Therefore, the corrosion resistance of the Si5 alloy is lower than that of the Si3.
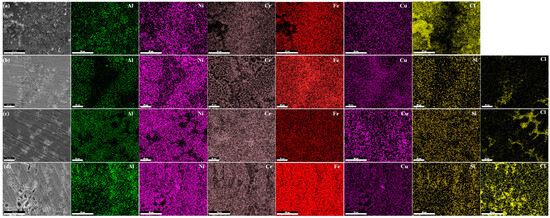
Figure 8.
Elemental mapping after polarization testing in 3.5% NaCl solution: (a) Si0, (b) Si1, (c) Si3, and (d) Si5.
EIS is important for studying the corrosion properties and mechanisms of materials. Analyzing the kinetic characteristics and polarization behavior during the electrochemical reaction process can reveal the structural and compositional features of the electrode surface. EIS tests were conducted to evaluate the corrosion process of the coating, and the EIS data were analyzed using an equivalent circuit.
Figure 9 shows the EIS test results of the FeNiCrAl0.7Cu0.3Six HEA. Two sets of EIS experiments were conducted on four samples: non-immersed samples (Figure 9) and samples immersed in a 3.5% NaCl solution for 24 h (Figure 9). The non-immersed samples were designated as the first group, while the samples immersed for 24 h were designated as the second group. Table 2 presents the data fitting and results for each sample, including Si0, Si1, Si3, and Si5, as well as Si0-24h, Si1-24h, Si3-24h, and Si5-24h, which represent the results after 24 h of immersion. The test results were analyzed using a circuit model for the electrolyte solution resistance (Rs), the charge-transfer resistance (Rct), and the passive film resistance (Rf) [35]. A constant phase element (CPE) is used to compensate for the inhomogeneity of the system (surface roughness and surface defects), denoted as CPEf and CPEdl, respectively [36]. The range of n is 0 ≤ n ≤ 1. When n = 1, the CPE behaves as an ideal capacitor, and when n = 0, the CPE acts as a pure resistor.
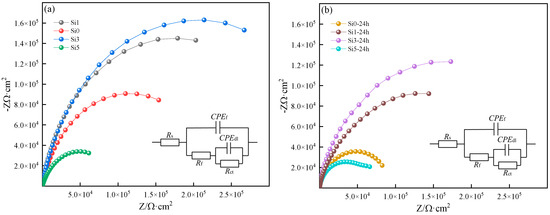
Figure 9.
(a,b) EIS of FeNiCrAl0.7Cu0.3Six HEAs in 3.5% NaCl solution.
Table 2.
Fitting parameters of EIS for FeNiCrAl0.7Cu0.3Six HEAs.
Based on the fitting results, all samples’ Nyquist plots exhibited typical semicircular shapes, with the center of the semicircle located below the x-axis, indicating that charge-transfer occurs at the uneven interface [37]. In both the first and second groups of EIS test results, among the four alloys with different Si contents, Si3 exhibited the largest capacitive arc radius, indicating that its surface passivation film was more compact and uniform, leading to higher impedance values and improved corrosion resistance [38,39].
Polarization resistance (Rp), equal to the sum of Rf and Rct, is commonly used to evaluate the corrosion resistance of materials, with its value being inversely proportional to the corrosion rate. A comparison of the polarization resistance of different samples reveals that Si3 exhibits the highest polarization resistance (5.03 × 10⁵ Ω·cm2), indicating its superior corrosion resistance. This trend is also confirmed across different immersion durations.
After immersion, the polarization resistance of all samples decreases. Specifically, Si0 decreases by 27.21%, while Si5 experiences a significant reduction of 69.47%, suggesting that extended immersion has a greater impact on Si5, likely due to the lower stability and higher dissolution rate of its passive film. It is important to note that Hajilou et al. [40] studied the EIS behavior of AlCoCrFeNi-10wt% ZrO2 high-entropy alloy composites after 24 h, 48 h, and 72 h of immersion. Their findings showed that after 48 h, Rct increased from 1010 Ω·cm2 to 445,000 Ω·cm2, and further to 116,400 Ω·cm2 after 72 h, indicating that charge-transfer resistance increases with immersion time.
The researchers attributed this phenomenon to two factors: on the one hand, the high surface roughness of the high-entropy alloy composite material, and on the other hand, the formation of ZrO2 or higher oxidation state metal oxides, which acted as secondary passivation. As a result, after prolonged immersion, the Rct value of AlCoCrFeNi-10wt% ZrO2 high-entropy alloy composites increased. Therefore, when analyzing the corrosion behavior of high-entropy alloys under different EIS test conditions, it is essential to consider the stability of the passive film, dissolution rate, surface roughness, and the evolution of corrosion products to accurately assess the long-term corrosion performance of the alloy.
4. Conclusions
This study investigates the effect of Si content on the microstructure and corrosion resistance of FeCrNiAl0.7Cu0.3Six HEAs in 3.5% NaCl solution. The main results are as follows:
(1) At 0% Si, the alloy exhibited a single BCC phase. As the Si content increased, a second BCC2 phase appeared in the alloy. When the Si content reached 0.5, intermetallic compounds began to form.
(2) Polarization tests in 3.5% NaCl solution indicate that the corrosion current density of FeCrNiAl0.7Cu0.3Six HEAs decreases and then increases with increasing Si content. Si0 has the highest corrosion current density of 4.275 × 10⁻⁶ A·cm, while Si3 has the lowest corrosion current density of 4.841 × 10⁻⁷ A·cm. All alloys show intergranular corrosion morphology, with Si0 and Si5 exhibiting deeper and wider corrosion grain boundaries. In contrast, Si3 displays a more intact corrosion morphology.
(3) EIS tests indicated that Si3 has the highest charge-transfer resistance of 4.484 × 10⁵ Ω·cm2 and film resistance of 5.447 × 10⁴ Ω·cm2, and its surface formed a dense and stable passive film that effectively isolated the corrosive medium. The Si-free FeCrNiAl0.7Cu0.3 HEA exhibited a lower charge-transfer resistance of 2.532 × 10⁵ Ω·cm2 and a film resistance of 2.532 × 10⁴ Ω·cm2, with a thinner passive film that was more susceptible to corrosion. FeCrNiAl0.7Cu0.3Si0.3 HEA exhibited better corrosion resistance in 3.5% NaCl solution.
Author Contributions
Conceptualization, Y.L. and. X.S.; methodology, X.S.; validation, X.S.; formal analysis, X.S.; investigation, X.S.; resources, X.S.; data curation, Y.L.; writing—original draft preparation, Y.L.; writing—review and editing, Y.L.; visualization, H.L.; supervision, Y.L.; project administration, Y.L.; funding acquisition, H.L. All authors have read and agreed to the published version of the manuscript.
Funding
This research was funded by the school-enterprise cooperation project of the Yancheng Institute of Technology (YG20241224014). 2024 Anhui Provincial University Scientific Research Project (Natural Science Category, Key Project, No. 2024AH052003); 2024 Provincial Department of Education Science and Engineering Teachers’ Internship Program in Enterprises (No. 2024jsqygz76).
Institutional Review Board Statement
Not applicable.
Informed Consent Statement
Not applicable.
Data Availability Statement
Data is contained within the article.
Conflicts of Interest
The authors declare no conflicts of interest.
References
- Tong, C.J.; Chen, Y.L.; Chen, S.K.; Yeh, J.W.; Shun, T.T.; Tsau, C.H.; Lin, S.J.; Chang, S.Y. Microstructure characterization of AlxCoCrCuFeNi high-entropy alloy system with multiprincipal elements. Metall. Mater. Trans. A—Phys. Metall. Mater. Sci. 2005, 36A, 881–893. [Google Scholar] [CrossRef]
- Yeh, J.W.; Chen, S.K.; Lin, S.J.; Gan, J.Y.; Chin, T.S.; Shun, T.T.; Tsau, C.H.; Chang, S.Y. Nanostructured high-entropy alloys with multiple principal elements: Novel alloy design concepts and outcomes. Adv. Eng. Mater. 2004, 6, 299–303. [Google Scholar] [CrossRef]
- Li, D.X.; Liu, C.; Tao, S.S.; Cai, J.M.; Zhong, B.; Li, J.; Deng, W.T.; Hou, H.S.; Zou, G.Q.; Ji, X.B. High-Entropy Electrode Materials: Synthesis, Properties and Outlook. Nano-Micro Lett. 2025, 17, 22. [Google Scholar] [CrossRef] [PubMed]
- Xu, X.T.; Song, Z.; Wang, K.L.; Li, H.Q.; Pan, Y.; Hou, H.; Zhao, Y.H. Cryo-rolling and annealing-mediated phase transformation in Al5Ti2.5Fe25Cr25Ni42.5 high-entropy alloy: Experimental, phase-field and CALPHAD investigation. J. Mater. Sci. Technol. 2025, 219, 307–325. [Google Scholar] [CrossRef]
- Shen, J.J.; Choi, Y.T.; Yang, J.; He, J.J.; Zeng, Z.; Zhou, N.; Baptista, A.C.; Kim, H.S.; Oliveira, J.P. Fabrication of spatially-variable heterostructured CoCrFeMnNi high entropy alloy by laser processing. Mater. Sci. Eng. A—Struct. Mater. Prop. Microstruct. Process. 2024, 896, 146272. [Google Scholar] [CrossRef]
- Li, Z.; Zhao, W.; Yu, K.D.; Guo, N.; Xiao, G.C.; Wang, Z.M.; Zhang, H. Effect of Y2O3 on microstructure and properties of CoCrFeNiTiNb high entropy alloy coating on Ti-6Al-4V surface by laser cladding. J. Rare Earths 2024, 42, 586–599. [Google Scholar] [CrossRef]
- Zhang, C.; Zhao, Z.R.; Lin, X.H.; Wang, S.B.; Wang, J.R.; Li, Y.C.; Li, Y.Q.; Zhang, Y.B.; Zhao, H.W. Molybdenum-14Rhenium alloy-The most promising candidate for high-temperature semiconductor substrate materials. J. Alloys Compd. 2024, 991, 174391. [Google Scholar] [CrossRef]
- Li, Z.Y.; Wang, X.H.; Huang, Y.Y.; Xu, Z.X.; Deng, Y.L.; Jiang, X.Y.; Yang, X.H. Microstructure, Mechanical Property, and Wear Behavior of NiAl-Based High-Entropy Alloy. Coatings 2023, 13, 1737. [Google Scholar] [CrossRef]
- Zheng, W.J.; Lu, S.L.; Wu, S.S.; Chen, X.H.; Guo, W. Development of MoNbVTx refractory high entropy alloy with high strength at elevated temperature. Mater. Sci. Eng. A—Struct. Mater. Prop. Microstruct. Process. 2022, 850, 143554. [Google Scholar] [CrossRef]
- Zhang, H.Z.; Zhu, Z.B.; Huang, H.F.; He, T.; Yan, H.W.; Zhang, Y.A.; Lu, Y.P.; Wang, T.M.; Li, T.N.G. Microstructures, mechanical properties, and irradiation tolerance of the Ti-Zr-Nb-V-Mo refractory high-entropy alloys. Intermetallics 2023, 157, 107873. [Google Scholar] [CrossRef]
- Zhang, F.L.; Qian, K.; Lu, P.; Liu, S.Y.; Lu, S.; Liu, Q.M.; Cui, B. Quasi-static compressive fracture behavior of three-period minimum surface Al2O3/Al composites fabricated by stereolithography. J. Mater. Res. Technol. 2024, 30, 4950–4960. [Google Scholar] [CrossRef]
- Qiu, Y.; Gibson, M.A.; Fraser, H.L.; Birbilis, N. Corrosion characteristics of high entropy alloys. Mater. Sci. Technol. 2015, 31, 1235–1243. [Google Scholar] [CrossRef]
- Shi, Y.; Yang, B.; Xie, X.; Brechtl, J.; Dahmen, K.A.; Liaw, P.K. Corrosion of AlxCoCrFeNi high-entropy alloys: Al-content and potential scan-rate dependent pitting behavior. Corros. Sci. 2017, 119, 33–45. [Google Scholar] [CrossRef]
- Hsu, Y.-J.; Chiang, W.-C.; Wu, J.-K. Corrosion behavior of FeCoNiCrCux high-entropy alloys in 3.5% sodium chloride solution. Mater. Chem. Phys. 2005, 92, 112–117. [Google Scholar] [CrossRef]
- Santos, R.F.; Rocha, A.M.F.; Bastos, A.C.; Cardoso, J.P.; Rodrigues, F.; Fernandes, C.M.; Sacramento, J.; Ferreira, M.G.S.; Senos, A.M.R.; Fonseca, C.; et al. The effect of Cr content on the corrosion resistance of WC-Ni-Cr-Mo composites. Int. J. Refract. Met. Hard Mater. 2021, 95, 105434. [Google Scholar] [CrossRef]
- Chen, R.; Cai, Z.; Pu, J.; Lu, Z.; Chen, S.; Zheng, S.; Zeng, C. Effects of nitriding on the microstructure and properties of VAlTiCrMo high-entropy alloy coatings by sputtering technique. J. Alloys Compd. 2020, 827, 153836. [Google Scholar] [CrossRef]
- Wan, Y.; Wang, X.; Zhang, Z.; Mo, J.; Shen, B.; Liang, X. Structures and properties of the (NbMoTaW)100−xCx high-entropy composites. J. Alloys Compd. 2021, 889, 161645. [Google Scholar] [CrossRef]
- Jia, Y.; Wang, Z.; Wu, Q.; Wei, Y.; Bai, X.; Liu, L.; Wang, J.; Liu, X.; Wang, L.; He, F.; et al. Boron microalloying for high-temperature eutectic high-entropy alloys. Acta Mater. 2024, 262, 119427. [Google Scholar] [CrossRef]
- Hou, Y.X.; Liu, T.; He, D.D.; Li, Z.J.; Chen, L.; Su, H.H.; Fu, P.X.; Dai, P.Q.; Huang, W.D. Sustaining strength-ductility synergy of SLM Fe50Mn30Co10Cr10 metastable high-entropy alloy by Si addition. Intermetallics 2022, 145, 107565. [Google Scholar] [CrossRef]
- Liu, Y.; Zhang, Y.; Zhang, H.; Wang, N.; Chen, X.; Zhang, H.; Li, Y. Microstructure and mechanical properties of refractory HfMo0.5NbTiV0.5Six high-entropy composites. J. Alloys Compd. 2017, 694, 869–876. [Google Scholar] [CrossRef]
- Shen, Z.; Liu, G.; He, L.; Mu, R.; Dai, J. Thermal property and failure behaviors of Gd doped LaZrCeO coatings with feathery microstructure. NPJ Mater. Degrad. 2022, 6, 17. [Google Scholar] [CrossRef]
- Li, Y.Z.; Shi, Y. Microhardness, wear resistance, and corrosion resistance of AlxCrFeCoNiCu high-entropy alloy coatings on aluminum by laser cladding. Opt. Laser Technol. 2021, 134, 106632. [Google Scholar] [CrossRef]
- Li, Y.Z.; Shi, Y.; Chen, R.N.; Wang, H.X.; Zhang, P.; Zhou, B.J.; Li, D.F.; Lin, H.; Ding, L. Influence of Al content on the elastic properties and various anisotropies of AlxCrFeCoNiCu high entropy alloys base on the first-principles calculation. Mater. Res. Express 2023, 10, 066505. [Google Scholar] [CrossRef]
- Xi, R.; Li, Y. Influence of Si Content on the Microstructure, Wear Resistance, and Corrosion Resistance of FeCoNiCrAl0.7Cu0.3Six High Entropy Alloy. Coatings 2024, 14, 1309. [Google Scholar] [CrossRef]
- Li, M.; Gazquez, J.; Borisevich, A.; Mishra, R.; Flores, K.M. Evaluation of microstructure and mechanical property variations in AlxCoCrFeNi high entropy alloys produced by a high-throughput laser deposition method. Intermetallics 2018, 95, 110–118. [Google Scholar] [CrossRef]
- Liu, H.; Sun, S.; Zhang, T.; Zhang, G.; Yang, H.; Hao, J. Effect of Si addition on microstructure and wear behavior of AlCoCrFeNi high-entropy alloy coatings prepared by laser cladding. Surf. Coat. Technol. 2021, 405, 126522. [Google Scholar] [CrossRef]
- Kumar, A.; Swarnakar, A.K.; Basu, A.; Chopkar, M. Effects of processing route on phase evolution and mechanical properties of CoCrCuFeNiSix high entropy alloys. J. Alloys Compd. 2018, 748, 889–897. [Google Scholar] [CrossRef]
- Dias, D.A.; Lima, F.W.S.; Plascak, J.A. Generalized Gibbs Phase Rule and Multicriticality Applied to Magnetic Systems. Entropy 2022, 24, 63. [Google Scholar] [CrossRef]
- Huang, L.; Wang, X.; Jia, F.; Zhao, X.; Huang, B.; Ma, J.; Wang, C. Effect of Si element on phase transformation and mechanical properties for FeCoCrNiSix high entropy alloys. Mater. Lett. 2021, 282, 128809. [Google Scholar] [CrossRef]
- Nagaraj, M.; Kumar, D.R.; Suresh, K.S.; Neelakantan, S. Effect of equal channel angular pressing on the microstructure and tribocorrosion characteristics of 316L stainless steel. Vacuum 2023, 210, 111908. [Google Scholar] [CrossRef]
- Han, B.; Zhu, S.G.; Dong, W.W.; Bai, Y.F.; Ding, H.; Luo, Y.L.; Di, P. Improved electrochemical corrosion resistance of hot-press sintered WC-Al2O3 composites with added TiC in alkaline solutions. Ceram. Int. 2021, 47, 32168–32178. [Google Scholar] [CrossRef]
- Brito, C.; Vida, T.; Freitas, E.; Cheung, N.; Spinelli, J.E.; Garcia, A. Cellular/dendritic arrays and intermetallic phases affecting corrosion and mechanical resistances of an Al–Mg–Si alloy. J. Alloys Compd. 2016, 673, 220–230. [Google Scholar] [CrossRef]
- Wang, N.; Wang, R.; Feng, Y.; Xiong, W.; Zhang, J.; Deng, M. Discharge and corrosion behaviour of Mg-Li-Al-Ce-Y-Zn alloy as the anode for Mg-air battery. Corros. Sci. 2016, 112, 13–24. [Google Scholar] [CrossRef]
- Bogdanov, R.I.; Vorkel, V.A.; Ignatenko, V.E.; Gavrushina, M.A.; Voennov, A.V.; Teplyakova, S.N.; Bachurina, D.M.; Sevrukov, O.N.; Marshakov, A.I. Corrosion and electrochemical behavior of CoCrFeNiMo high-entropy alloy in acidic oxidizing and neutral chloride solutions. Mater. Chem. Phys. 2023, 295, 127123. [Google Scholar] [CrossRef]
- Souto, C.A.; Mirhan, A.L.R.; Yao, J.Y.; Serrano, L.B.; Travessa, D.N.; Cardoso, K.R. Microstructural characteristics and corrosion behaviour of AlCoCrFeNi high-entropy alloys containing Vanadium. Electrochim. Acta 2024, 503, 144867. [Google Scholar] [CrossRef]
- Sun, J.B.; Zhang, G.A.; Liu, W.; Lu, M.X. The formation mechanism of corrosion scale and electrochemical characteristic of low alloy steel in carbon dioxide-saturated solution. Corros. Sci. 2012, 57, 131–138. [Google Scholar] [CrossRef]
- Raza, A.; Abdulahad, S.; Kang, B.; Ryu, H.J.; Hong, S.H. Corrosion resistance of weight reduced AlxCrFeMoV high entropy alloys. Appl. Surf. Sci. 2019, 485, 368–374. [Google Scholar] [CrossRef]
- da Silva, L.S.; Ferreira, T.L.; de Oliveira, M.C.L.; Antunes, R.A.; da Silva, R.A.G. Novel CuxFeMnNiSnTi high entropy alloys: Microstructure, surface chemistry, and corrosion resistance. J. Mater. Res. Technol. 2023, 26, 5409–5424. [Google Scholar] [CrossRef]
- Zhou, Z.Y.; Wang, L.; Zhao, X.H.; Wu, J.L.; Zhang, F.; Pi, J.H. Effects of W addition on the Corrosion Behaviors of FeCoNiCrMn High Entropy Alloy Composites in the 3.5 wt.% NaCl solution. Surf. Interfaces 2021, 23, 100956. [Google Scholar] [CrossRef]
- Hajilou, N.; Javaheri, M.; Ebadzadeh, T.; Farvizi, M. Investigation of the electrochemical behavior of AlCoCrFeNi-ZrO2 high entropy alloy composites prepared with mechanical alloying and spark plasma sintering. J. Appl. Electrochem. 2024, 54, 457–466. [Google Scholar] [CrossRef]
Disclaimer/Publisher’s Note: The statements, opinions and data contained in all publications are solely those of the individual author(s) and contributor(s) and not of MDPI and/or the editor(s). MDPI and/or the editor(s) disclaim responsibility for any injury to people or property resulting from any ideas, methods, instructions or products referred to in the content. |
© 2025 by the authors. Licensee MDPI, Basel, Switzerland. This article is an open access article distributed under the terms and conditions of the Creative Commons Attribution (CC BY) license (https://creativecommons.org/licenses/by/4.0/).