Article

The Effect of Warm Shot Peening on Microstructure Evolution and Residual Stress in Gradient Nanostructured Mg-8Gd-3Y-0.4Zr Alloys

1
Green & Smart River-Sea-Going Ship, Cruise and Yacht Research Center, Wuhan University of Technology, Wuhan 430063, China
2
School of Naval Architecture, Ocean and Energy Power Engineering, Wuhan University of Technology, Wuhan 430063, China
3
State Grid Gansu Electric Power Research Institute, Lanzhou 730070, China
4
School of Materials Science and Engineering, Shanghai Jiao Tong University, No.800 Dongchuan Road, Shanghai 200240, China
*
Author to whom correspondence should be addressed.
Coatings 2025, 15(3), 316; https://doi.org/10.3390/coatings15030316
Submission received: 19 February 2025 / Revised: 5 March 2025 / Accepted: 6 March 2025 / Published: 9 March 2025
(This article belongs to the Special Issue Advancement in Heat Treatment and Surface Modification for Metals)

Abstract

:
This work systematically investigated the effects of warm shot peening (WSP) on the microstructure evolution, residual stress, and microhardness of the Mg-8Gd-3Y-0.4Zr (GW83) alloy by X-ray diffraction line profile analysis, transmission electron microscopy, and X-ray stress analyzer and hardness tester. The results indicated that severe plastic deformation induced by WSP resulted in a gradient nanostructure in the GW83 alloy, accompanied by significant compressive residual stress. In contrast to conventional SP, WSP led to working softening due to the dynamic recrystallization behavior. The formation of nanograins in the GW83 alloy during WSP occurs in three steps: (i) at an early stage, the introduction of a high density of dislocations and a few deformation twins subdivide bulk grains into substructures; (ii) through the processes of dislocation gliding, accumulation, and rearrangement, these substructures undergo further refinement, gradually evolving into ultrafine grains; and (iii) the inhomogeneous ultrafine grains develop into nanograins through dislocation-assisted lattice rotation and dynamic recrystallization.

1. Introduction

Mg alloys have emerged as a promising class of materials for diverse applications, ranging from electronics and automotive engineering to biomedical devices, owing to their exceptional combination of high strength-to-weight ratio, excellent stiffness, and favorable biocompatibility characteristics [1,2]. Nevertheless, their limited mechanical properties pose a significant barrier to broader utilization. Grain refinement, particularly to achieve nanograins, has emerged as an efficacious strategy to augment the strength of metallic materials. Given that numerous failures, encompassing corrosion, wear, and fatigue fracture, typically initiate at material surfaces, surface mechanical processing techniques aimed at producing a gradient nanostructured deformation layer have garnered considerable attention [3,4,5].
Shot peening (SP) represents a widely adopted surface engineering strategy that effectively improves mechanical performance through the generation of beneficial compressive residual stress (CRS) fields and microstructural refinement in the near-surface region [6,7]. In comparison to alternative surface modification approaches, SP offers several notable advantages, including versatility across various component shapes, straightforward control of peening parameters, and cost-effectiveness, which collectively contribute to its broad adoption [8,9]. Researchers have diligently explored the potential of SP to augment the surface properties of Mg alloys. Notably, P. Zhang et al. reported a substantial 60%–75% increase in fatigue strength for wrought AZ80 alloy subjected to SP [10]. In parallel, Wencai Liu et al. optimized the fatigue properties of diverse Mg alloys through meticulous tuning of peening parameters [11,12,13]. These contributions underscore the efficacy of SP in advancing Mg alloy surface properties. Nevertheless, a significant limitation emerges from the tendency for excessive surface damage at relatively low peening intensities, stemming from the constrained plastic deformability of hexagonal close-packed (hcp) Mg alloys at room temperature. This over-peening effect constrains the process windows of SP and restricts its application within the Mg industry. Consequently, the development of advanced SP methodologies, including stress-assisted SP and warm SP (WSP), has been pursued to overcome existing limitations and expand the applicability of surface treatment in Mg alloys.
When it comes to Mg alloys, WSP is considered a more effective approach. On one hand, stress SP is typically used for thin components in aerospace applications, such as Al alloy sheets. On the other hand, the WSP technique readily activates non-basal slip systems in Mg alloys [14,15,16]. In particular, Huang et al. reported that compared to conventional SP, WSP improved the fatigue property of the Mg-9Gd-2Y alloy by inducing higher subsurface hardening and greater CRS [17]. Recent studies have also shown that WSP provides substantial benefits over CSP in enhancing microstructural characteristics, optimizing CRS profiles, and improving fatigue performance in materials such as AISI 4140 steel [18,19,20], the Ti-6Al-4V alloy [21], and SiCw/Al composites [22]. These enhancements in fatigue strength were linked to the effects of dynamic and static strain aging, which help stabilize the dislocation structure and the residual stresses induced during the process. Additionally, Yiliang Liao and Chang Ye et al. demonstrated that warm laser shock peening can significantly enhance the microstructural characteristics and mechanical properties of Al and Ti alloys through the synergistic effects of dynamic strain aging and dynamic precipitation [23,24]. However, L.B. Peral et al. reported that WSP led to the work softening of AZ31 alloy due to dynamic recrystallization (DRX) behavior [25]. These conflicting research findings suggest that the mechanisms underlying the effects of WSP on Mg alloys remain unclear and deserve investigation.
The objective of this study is to investigate the impact of WSP on the surface characteristics and microstructure evolution process of GW83 alloys. To this end, the microstructure features of the processed samples were examined using X-ray diffraction line profile analysis and transmission electron microscopy (TEM). Additionally, the residual stress field was analyzed via X-ray stress analysis. This study aspires to offer valuable references for understanding the severe plastic deformation behavior of Mg alloys at elevated temperatures.

2. Material Preparation and Measurement Methods

2.1. Materials Preparation and WSP Processing

The Mg-Gd-Y-Zr alloy investigated in this work, designated GW83, had a composition of 8 wt.% Gd, 3 wt.% Y, 0.4 wt.% Zr, and the remainder Mg. As visualized in Figure 1a,b, fabricated in accordance with established methodologies [26], the as-extruded GW83 alloy displayed a microstructure that was predominantly composed of α-Mg solid solution, possessing an average grain size of 22 μm. The mechanical properties of this alloy are outlined in Table 1.
The specimens, prepared with a 6-mm thickness and cut normal to their direction, underwent WSP using a standard machine from Carthing Machinery Company (Kunshan city, China). Before WSP, they were preheated to 240 °C for 15 min. The peening was conducted with 0.15 mmA Almen intensity, 200% coverage, and ZrO2 ceramic beads (B40, 0.35 mm avg. diameter), with the peened surface perpendicular to the extrusion direction.

2.2. Measurement and Analysis Method

The surface topography of the peened samples was measured using a stylus profilometer DektakXT (Bruker Corporation, Billerica, MA, USA), and the surface roughness (arithmetic mean roughness (Ra) and maximum height of the profile (Rz)) was subsequently calculated. XRD patterns were acquired utilizing a Rigaku Ultima IV diffractometer (Rigaku Corporation, Tokyo, Japan), employing Cu Kα radiation. Residual stresses were quantified via the iso-inclination method using an X-ray stress analyzer (Proto Manufacturing, Ottawa, ON, Canada), employing Cr Kα radiation for detection [27]. The Cr Kα radiation was used to detect the (202) diffraction peaks. TEM was performed on a JEM-2100F instrument (JEOL Ltd., Tokyo, Japan) to analyze grain refinement induced by WSP in the GW83 alloy. TEM samples were prepared through mechanical grinding and ion milling. Hardness tests were conducted using a microhardness tester, and residual stress and microhardness distribution were established through successive layers of material removal by electrochemical polishing.
To characterize microstructural variations within the deformation layer, crystallite size and microstrain were quantified through XRD analysis. The Voigt method was employed to deconvolute contributions from the (0002) and (10 1 ¯ 1) diffraction peaks, with procedural details outlined as follows. The experimentally measured XRD profile h(x) is expressed as a convolution of the structurally broadened profile f(x) and the instrumental profile g(x):
h x = + g ( y ) f ( x y ) d y
In the Voigt method [28,29], the integral breadth (β) of the diffraction peak is decomposed into Gaussian (βG) and Lorentzian (βL) components:
β G h 2 = β G f 2 + β G g 2 ,   β C h = β C f + β C g
where subscripts h, f, and g denote the measured, physical, and instrumental profiles, respectively. Instrumental broadening was corrected using a silicon standard reference. In this method, the Gaussian component of the physical profile (βG) is linked to crystallite size (D), whereas the Lorentzian component (βL) arises from microstrain (ε). These parameters are calculated as:
D = λ β c f · c o s θ ,   ε = β G f 4 t a n θ
where λ is the X-ray wavelength and θ represents the Bragg angle corresponding to the (0002) and (10 1 ¯ 1) reflections.

3. Results

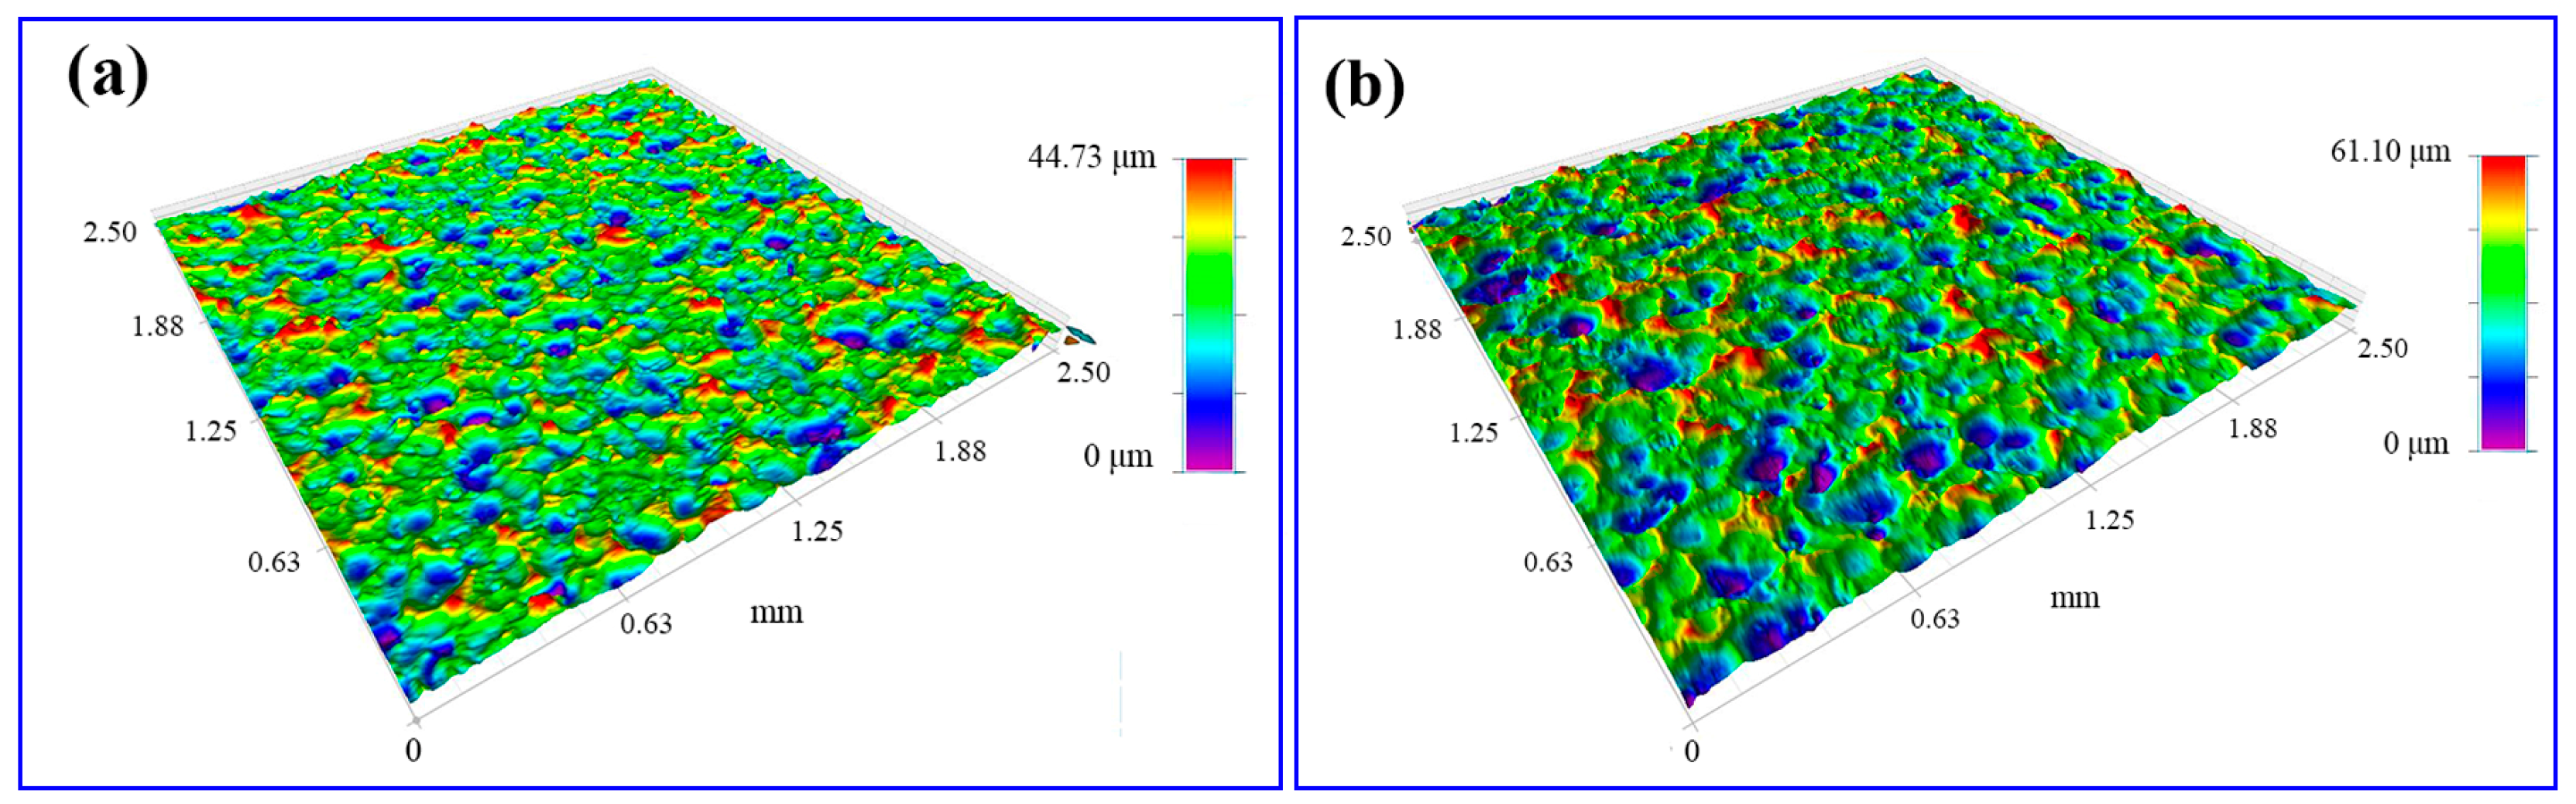
3.1. Surface Morphology and Roughness

Figure 2 displays the 3D surface morphology of the processed samples. Inspection of Figure 2a reveals that WSP creates numerous crater-like depressions and extruded peaks, a result of the drastic plastic deformation imparted by high-velocity shots. In comparison, notable alterations in surface morphology are more evident in the WSP sample. As depicted in Figure 2b, the surface exhibits greater irregularity, characterized by deeper crater-like features and sharper extrusion ridges. Notably, the surface height variations increase from 44.73 to 61.10 μm. This enhancement is primarily attributed to the more severe plastic deformation brought about by WSP when compared to CSP.
A comprehensive analysis of the 3D surface morphology has been conducted, and the surface roughness parameters for each sample are summarized in Table 2. For the conventionally peened sample, the Ra and Rz values are recorded as 2.88 and 15.41 μm, respectively. After applying WSP treatment, both Ra and Rz show significant increases, rising to 4.59 and 23.38 μm, respectively. These changes in surface roughness following WSP treatment align with findings reported from previous research [17,25].

3.2. Microstructural Characterization Through XRD Line Profile Analysis Method

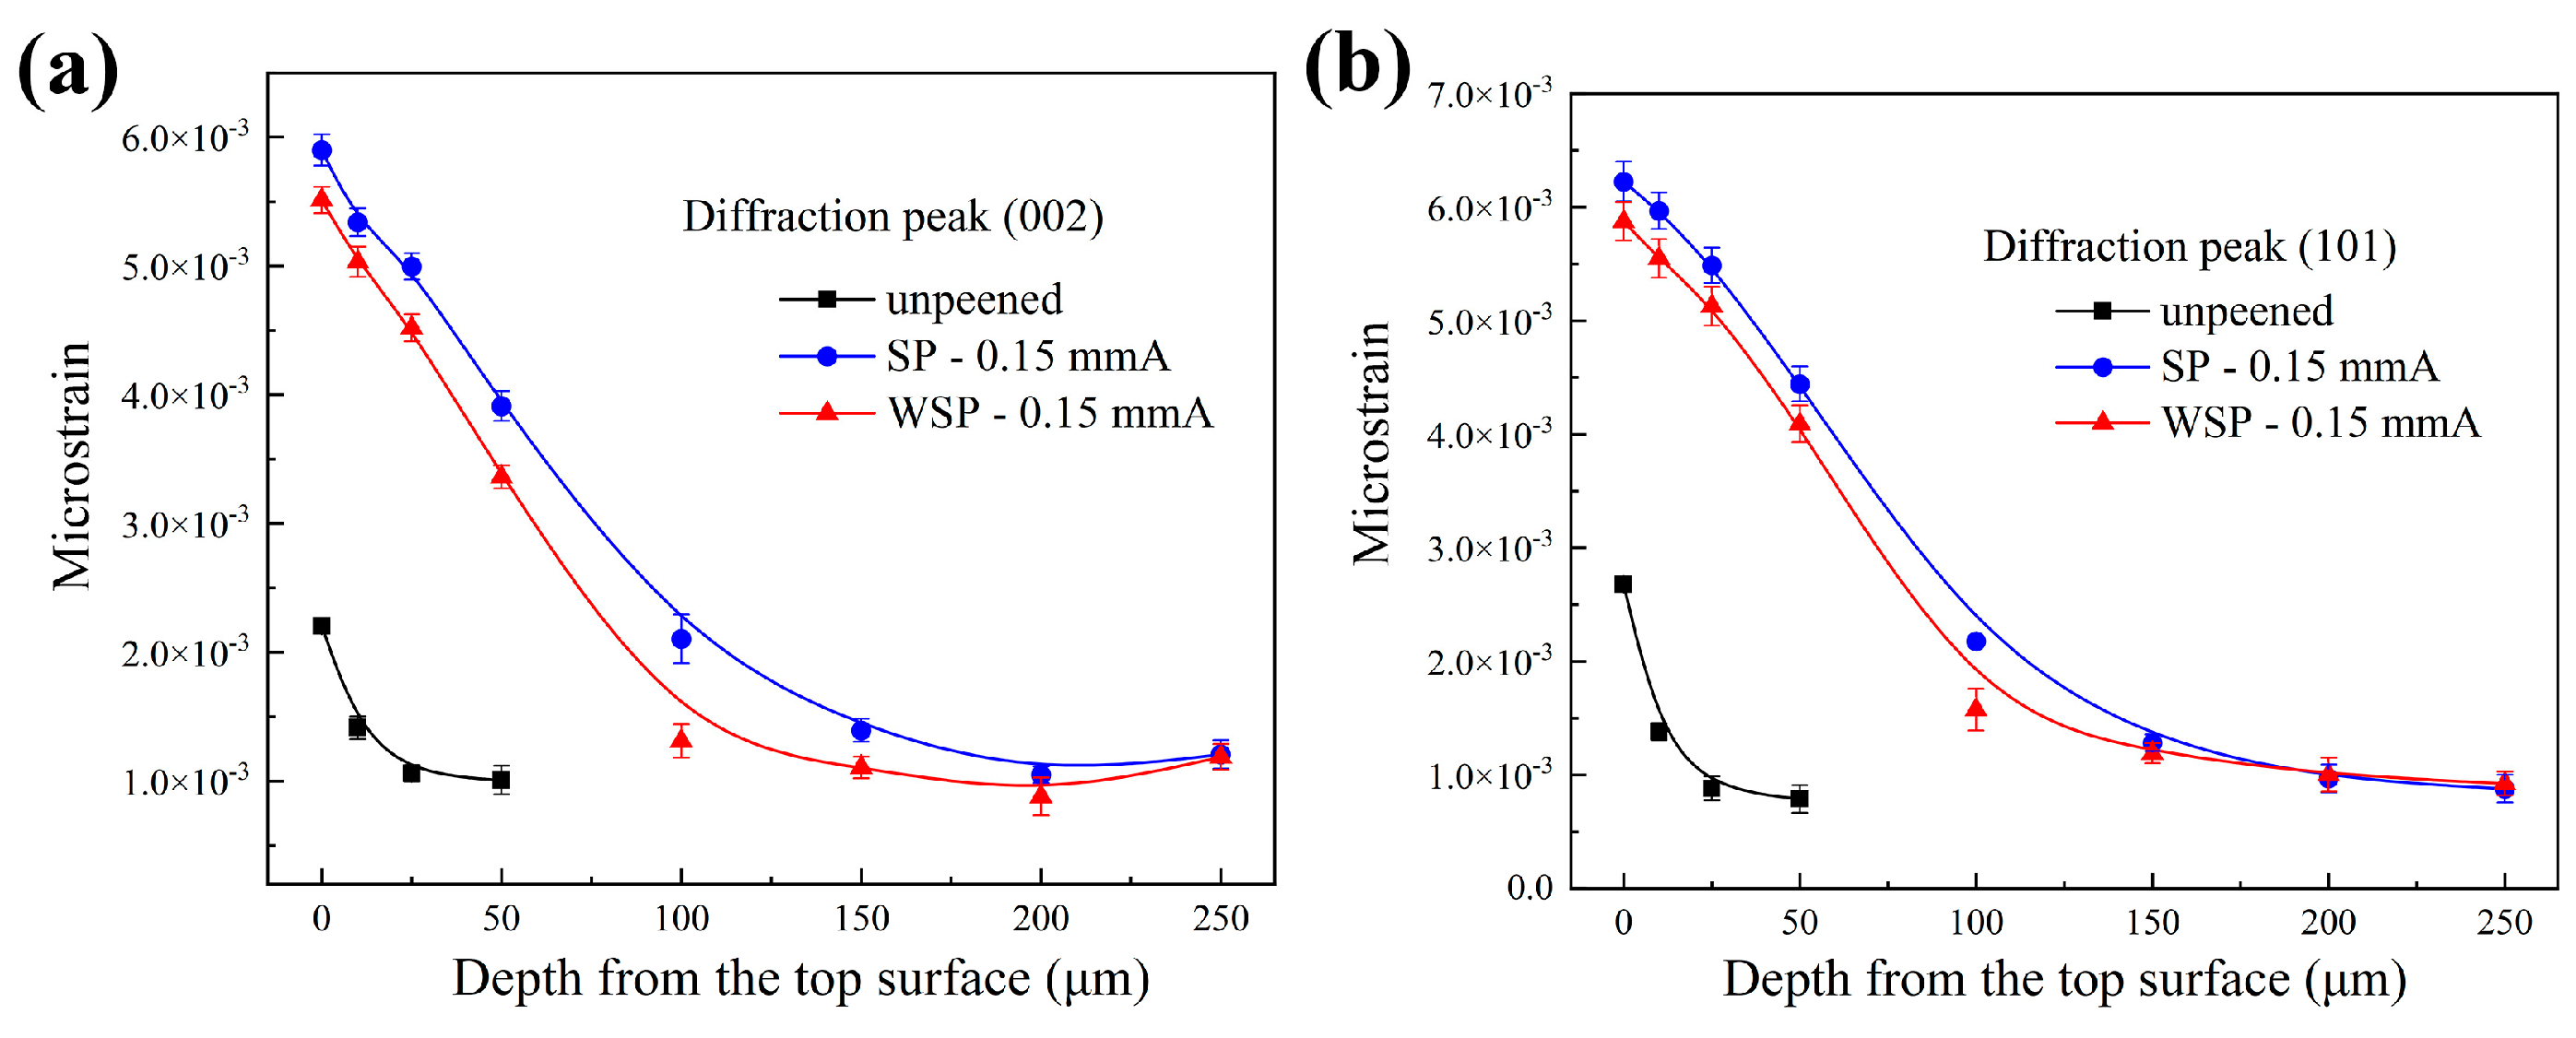
3.2.1. Quantification of Crystallite Size and Microstrain

Figure 3 compares the XRD patterns of GW83 alloy surfaces subjected to CSP and WSP. The analysis shows that both treatments maintain the original phase composition, with no secondary phases detected. Notably, peak broadening occurred in peened samples, indicative of grain refinement and lattice distortion from severe plastic deformation. Moreover, the initial (0002) basal fiber texture developed during hot extrusion [12,30] shows significant attenuation upon CSP, with texture intensity decreasing from 2.01 to 1.02. This texture randomization arises from multidirectional plastic flow induced by high-velocity spherical projectiles, which disrupt preferential grain orientation through mechanical twinning and dislocation slip.
Figure 4 quantifies the full width at half maximum (FWHM) of (0002) and (10 1 ¯ 1) diffraction peaks across surface-modified layers. It is evident that CSP and WSP increase the FWHM values that present gradient variations with maximum values located near the surface layer. For the CSP sample, the maximum FWHM values are 0.4° for the (0002) crystal plane and 0.47° for the (10 1 ¯ 1) crystal plane. In contrast, WSP unexpectedly lowers the FWHM values at each depth.
To quantitatively evaluate the effect of WSP on the microstructure, Equation (3) is utilized to calculate the crystalline size and microstrain from the (0002) and (10 1 ¯ 1) crystal planes, as depicted in Figure 5 and Table 3. Regarding the crystalline size, despite being derived from distinct diffraction peaks, the observed trends are consistent and inverse to those seen in the FWHM values shown in Figure 4. Each sample exhibits a gradient in crystalline size, with the smallest dimensions located near the surface layer, progressively increasing to a steady value as depth increases to the undeformed region. Specifically, the crystalline sizes for the CSP sample at the top surface are 25 and 28 nm corresponding to the (0002) and (10 1 ¯ 1) planes, respectively. In contrast, the WSP sample shows larger crystallite sizes of 33 and 34 nm for the (0002) and (10 1 ¯ 1) planes, respectively. This indicates that the crystalline sizes of the WSP sample are larger than those in the CSP sample.
In contrast to the trends in crystalline size, the microstrain displays an opposing pattern, as shown in Figure 6. It decreases from the surface to a depth of approximately 150–200 µm, subsequently remaining largely constant. At the same depth, the lattice distortions in the WSP sample are less severe compared to those in the CSP sample.

3.2.2. Quantification of Dislocation Density

Utilizing the calculation results from Figure 5 and Figure 6, the dislocation density (ρ) as a function of depth can be determined through the Williamson method [31], as depicted in the equation:
ρ = 2 3 b < ε 2 > 1 2 D
In this equation, b denotes the Burgers vector. The distribution of dislocation density is illustrated in Figure 7, revealing a trend similar to that of the FWHM values. Specifically, the maximum dislocation densities of the CSP sample reach 2.12 × 10¹⁵ and 2.51 × 10¹⁵ m−2 corresponding to the (0002) and (10 1 ¯ 1) planes, respectively. The WSP sample exhibits maximum values of 1.53 × 10¹⁵ m−2 for the (0002) plane and 1.82 × 10¹⁵ m−2 for the (10 1 ¯ 1) plane. The dislocation densities are two orders of magnitude higher than those of the untreated counterpart. Microstructural characterization through XRD line profile analysis indicates that WSP treatment negatively affects the microstructure, which aligns with the findings of L.B. Peral et al. [25]. This deterioration is attributed to the predominant DRX behavior occurring during the WSP process.

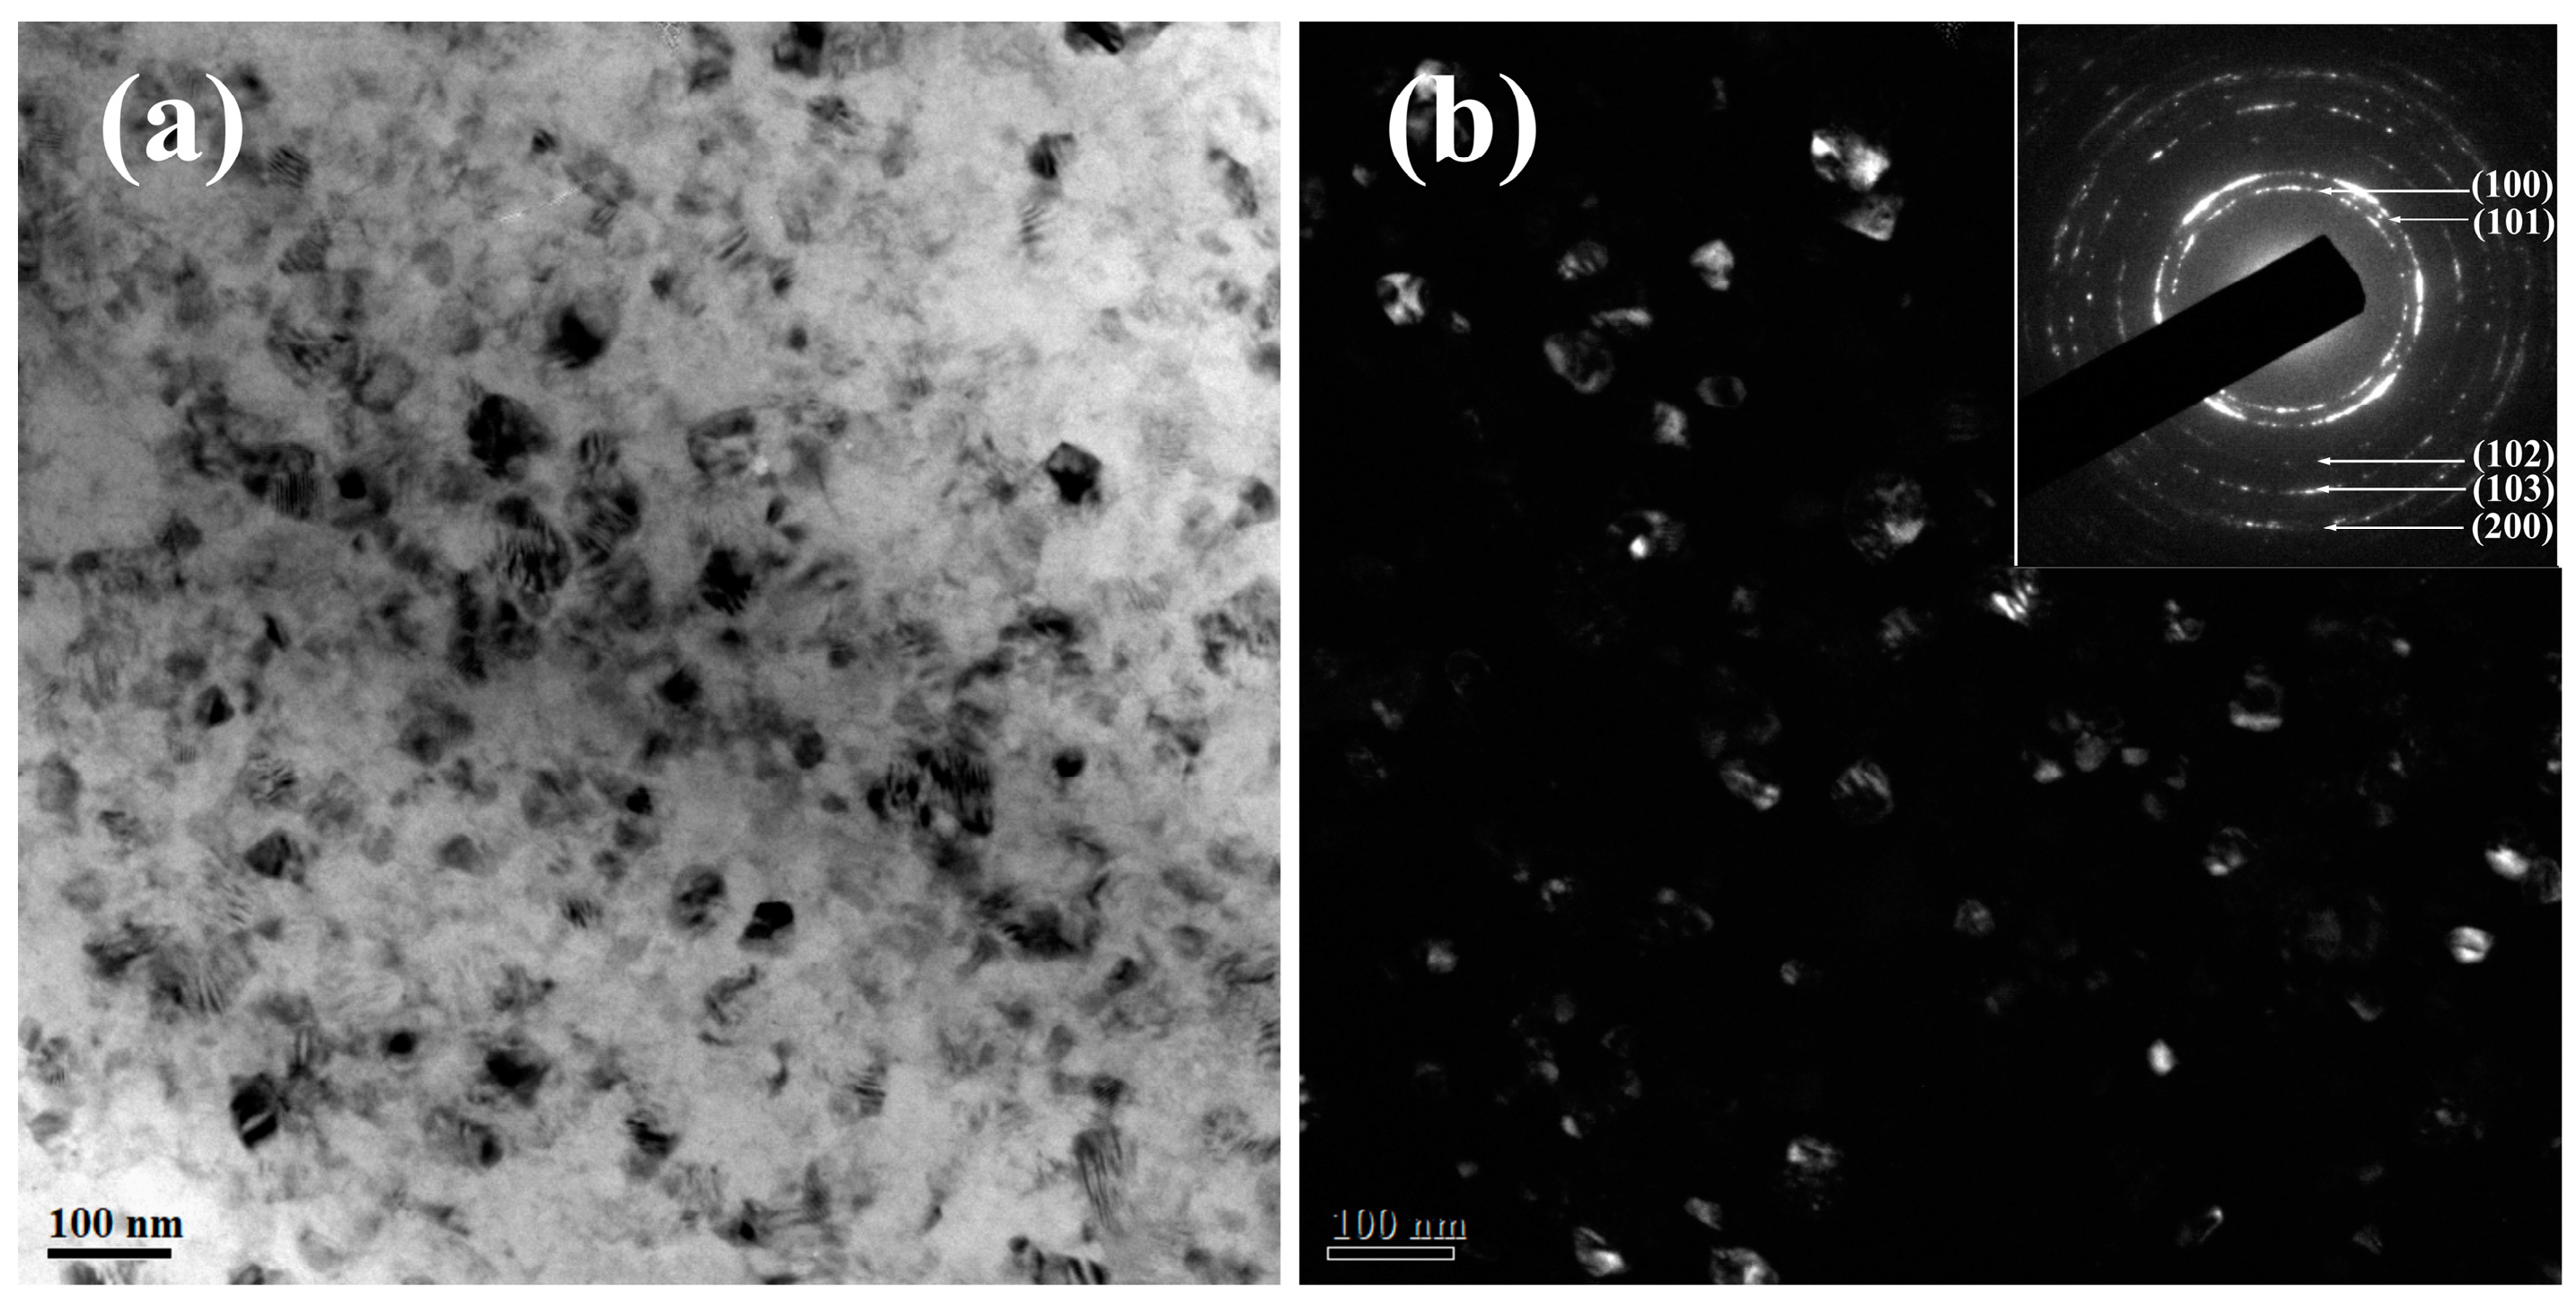
3.3. Microstructure Observations by TEM

3.3.1. Surface Microstructural Evolution of the GW83 Alloy Treated by CSP and WSP

To intuitively compare the effects of WSP on the microstructure, the surface microstructures of the CSP and WSP samples were observed using TEM. In CSP specimens (Figure 8a,b), surface grains refined to 50–100 nm, with intra-granular contrast variations (arrows) indicating substantial lattice distortion and residual stress accumulation. Meanwhile, the corresponding selected-area electron diffraction (SAED) pattern (Figure 8b inset) exhibits continuous diffraction rings, confirming nanocrystalline formation with random orientation distribution. As shown in Figure 8c–e, a high-resolution TEM (HRTEM) analysis of region A resolves lattice fringes with 0.256 nm spacing, consistent with Mg (0002) crystal planes. Moreover, inverse fast Fourier transform (IFFT) reconstruction in Figure 8d reveals discontinuous lattice fringes and localized strain fields, characteristic of high-density dislocation.
Figure 9 displays the TEM and the corresponding SAED patterns of the WSP sample. Notably, WSP results in the refinement of grains to the nanograins in the near-surface region with distinct internal contrasts within the grains. In comparison with those of the CSP sample, the grain boundaries of the nanograins induced by WSP are more clearly defined. The “clean” grains should be attributed to the occurrence of typical DRX. Additionally, this microstructure characteristic indicates that WSP introduces a lower dislocation density and reduced lattice distortion, which is consistent with the results obtained from XRD calculations (see Figure 6 and Figure 7).

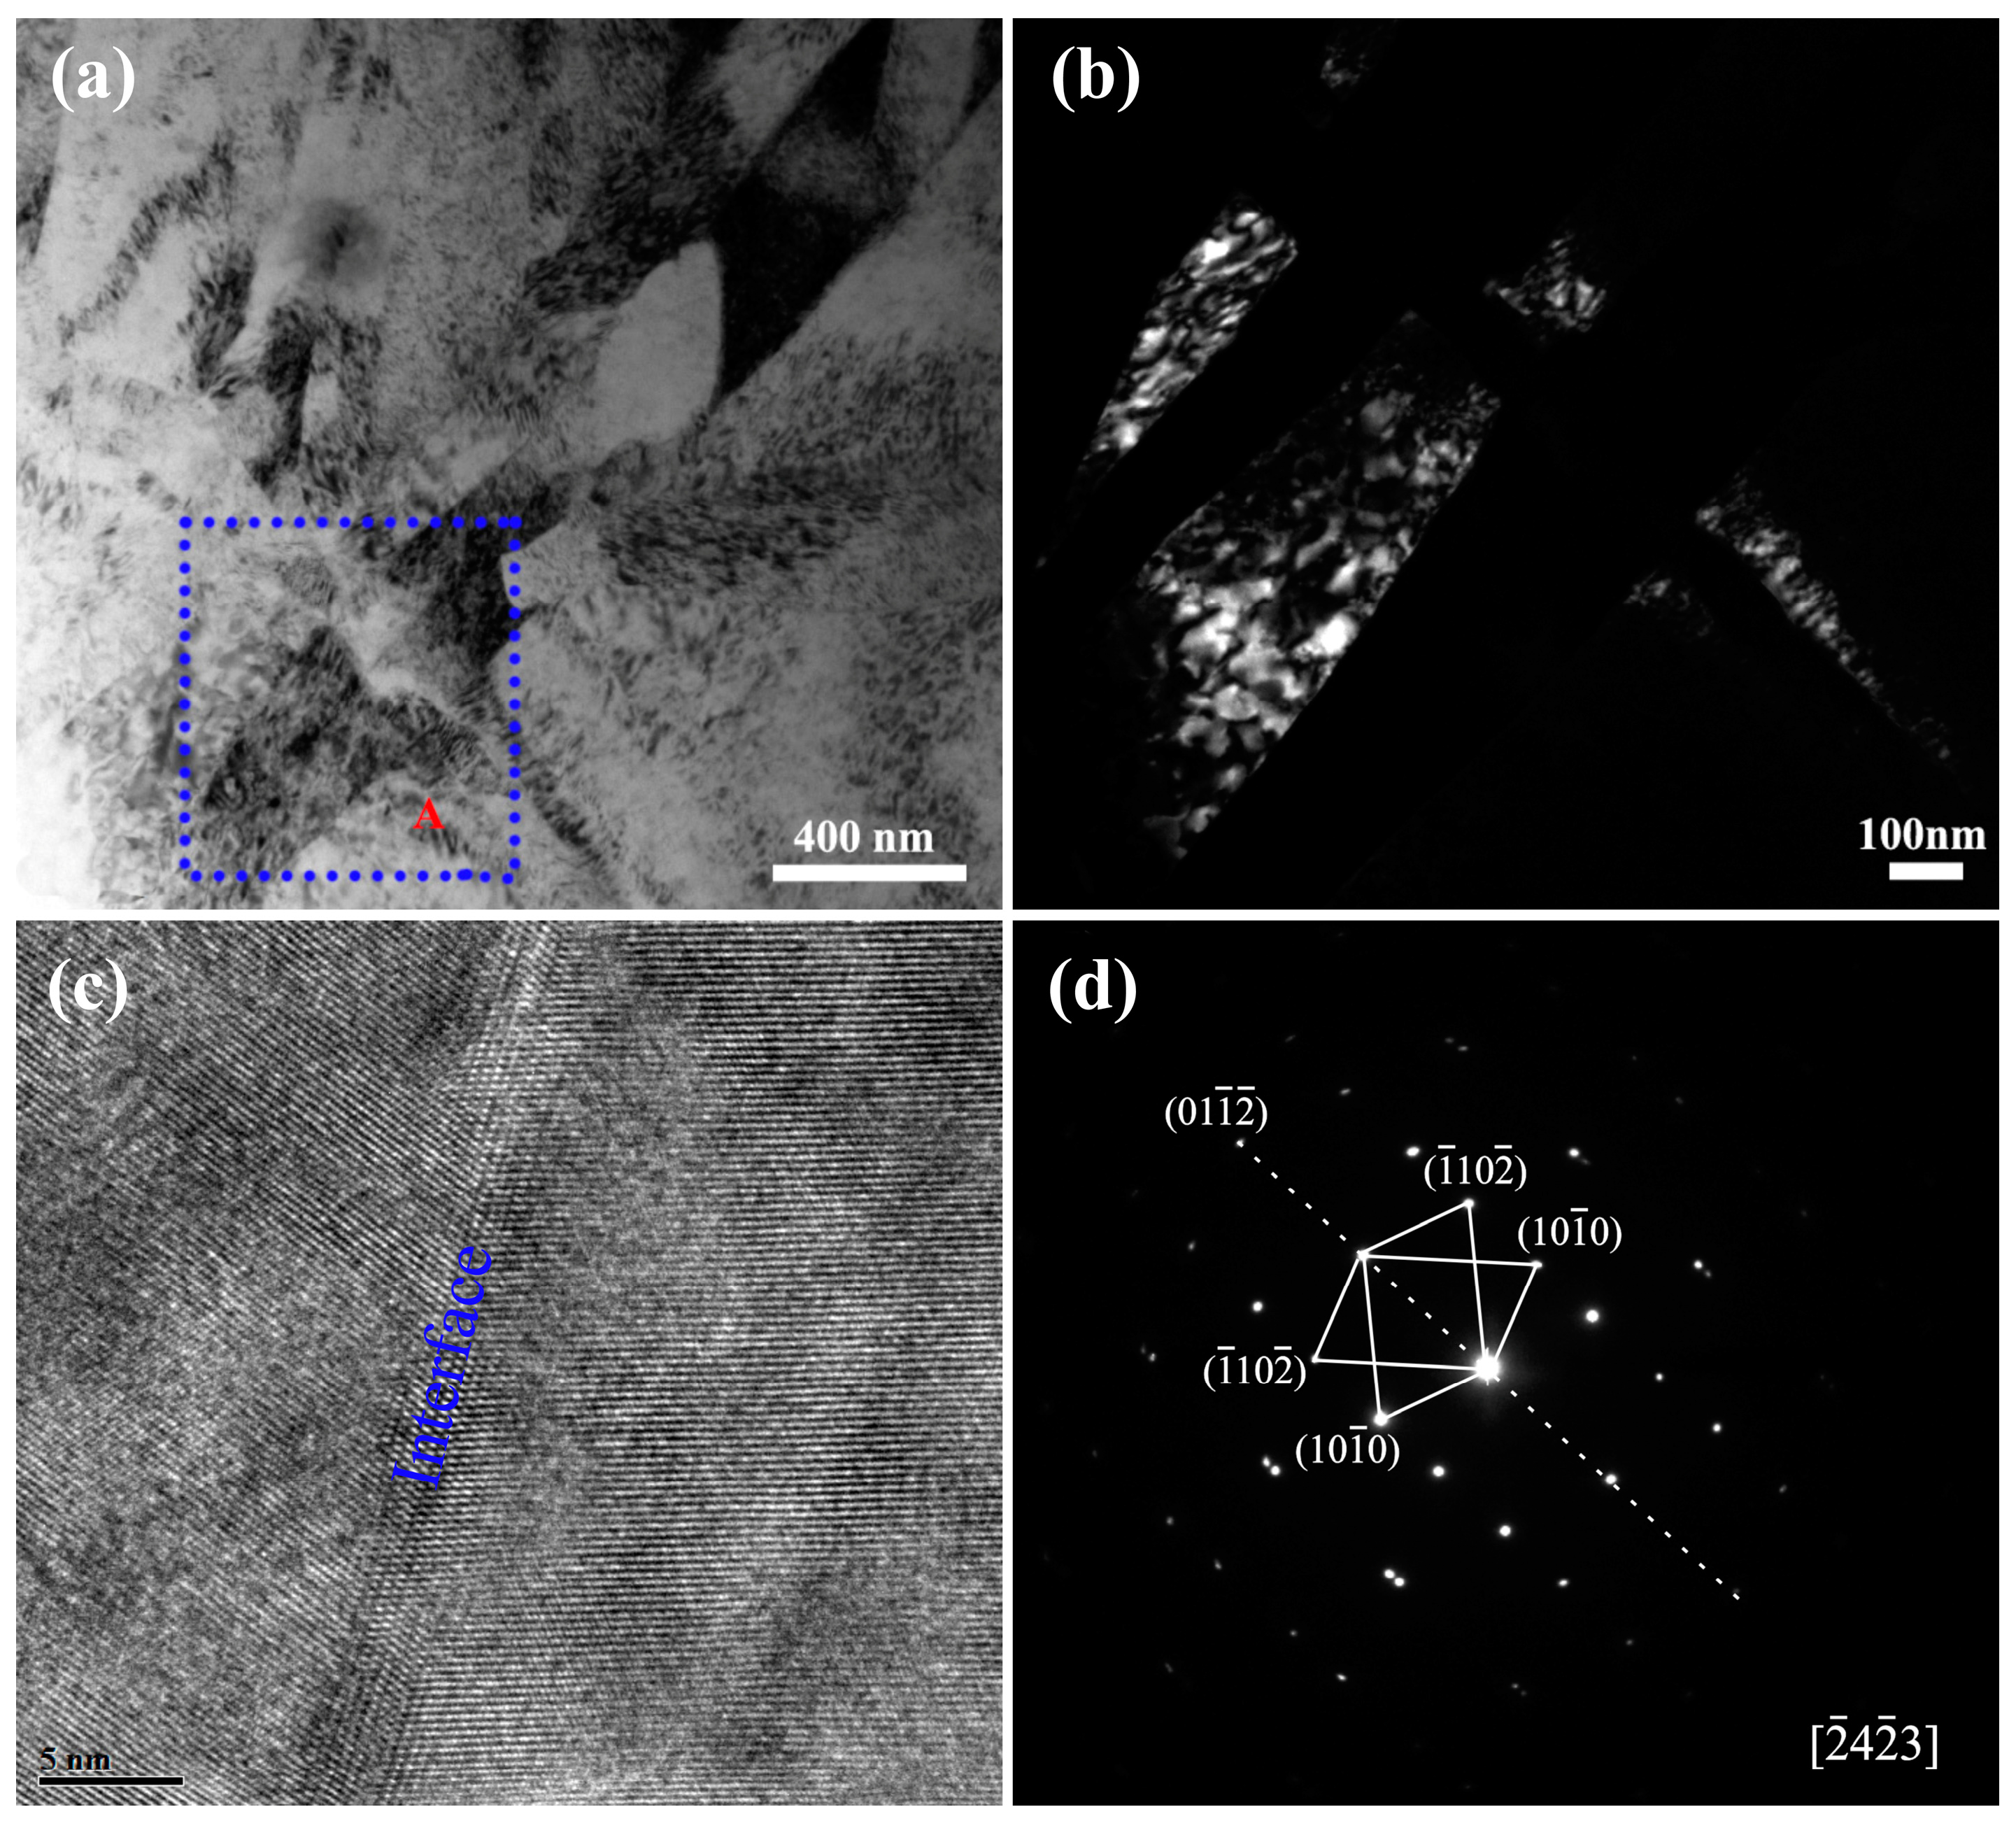
3.3.2. Microstructure Evolution of the GW83 Alloy upon WSP

The results clearly suggest that nanograins are developed in the near-surface region of the GW83 alloy during WSP. To gain insights into the grain refinement mechanisms during WSP treatment, it is essential to examine the microstructural characteristics of the deformation layer at diverse strain stages. Since both strain and strain rate present a gradient decrease from their maximum values at the surface to zero within the bulk material, the microstructural evolution during WSP can be elucidated by analyzing the distinctive microstructural features at varying depths. Analyzing the unique microstructural features at varying depths can reveal the microstructure evolution mechanism during WSP. Therefore, TEM observations of cross-sections are conducted.
Figure 10 displays the bright-field TEM and the corresponding SAED patterns in the middle layer of the WSP GW83 alloy. At this stage, ultrafine grains have formed, and the grain size distribution is non-uniform, ranging from 150 to 400 nm. Meanwhile, within some grains, some dislocations intersect with one another, creating a network-like structure, while others are tangled together. However, many grains have clean interiors and interfaces, indicating the absence of a large number of dislocations. This is mainly due to the DRX of the GW83 alloy induced by high temperature.
Figure 11 presents microstructure information based on TEM observations in the low-strain region. As illustrated in Figure 11a,b, a significant number of dislocations are activated and become entangled with one another in this area. Additionally, twins of varying sizes are also observed to activate and interact with the dislocations. Some regions within the twins appear clean, which can be attributed to the effects of DRX. In Figure 11c,d, the indexing of diffraction spots reveals that the twin system is characterized as {10 1 ¯ 2}/<10 1 ¯ 1> tensile twins, which is recognized as one of the major twin systems in Mg alloys [32].

3.4. Distribution of Residual Stress

Figure 12 and Table 4 illustrate the residual stress fields of the CSP and WSP samples. It is noteworthy that a high level of CRS is generated for each peened sample. The induced CRS fields play a crucial role in enhancing fatigue properties by inhibiting crack initiation and propagation. For the untreated counterpart, a low level of CRS is induced with the value of 50 MPa, indicating the grinding process causes some degree of plastic deformation. Following CSP, a significantly high CRS field is formed with a maximum value reaching 200.5 MPa observed at the surface. With the depth progressing, the CRS value diminishes and transitions to residual tensile stress at approximately 130 μm deep. In the case of the WSP sample, both the magnitude of CRS and its affected zone are diminished. Specifically, the maximum CRS is measured at 187 MPa and the affected depth is approximately 110 μm. The detailed values are displayed in Table 4. Based on the above analysis of the microstructure evolution during the WSP process, although WSP can activate a greater number of dislocation slips, the process also results in DRX [24,33]. In comparison, the effects of DRX are more pronounced. Consequently, the magnitude of residual stress introduced by WSP is lower than that induced by CSP.

3.5. Distribution of Microhardness

Figure 13 illustrates the microhardness profiles of the samples as a function of depth. The WSP treatment results in a hardened layer that extends to a depth of 150 µm. The hardness of the peened GW83 alloy exhibits a gradient distribution with the highest values at the surface. Specifically, the surface hardness after CSP and WSP treatments are 142 HV and 133 HV, respectively. The increase in surface hardness due to SP is primarily attributed to grain refinement and the generation of dislocations. Grain refinement can be explained by the Hall–Petch relationship [34,35], while the contribution of dislocation density to hardness is described by the Taylor equation [36]. XRD line profile analysis (shown in Figure 5, Figure 6 and Figure 7) confirms that both CSP and WSP effectively refine the grains and introduce dislocations, thereby enhancing surface layer hardness. However, compared to CSP, WSP results in larger grains and fewer dislocations due to DRX behavior induced by elevated temperatures, leading to lower surface hardness.

4. Discussion

4.1. Grain Refinement Process in GW83 Alloy During WSP

Based on the observations of the microstructure characteristics at different sections, the grain refinement mechanism in the GW83 alloy during WSP could be described as follows. In the zone close to the matrix, the strain and strain rate are relatively low, which signifies the initial deformation stage. Dislocations are activated and begin to glide when the shear stress on certain grains exceeds the critical resolved shear stress (CRSS). With the accumulation of dislocations, high-density dislocations would pile up on the grain boundary and might lead to stress concentration, consequently inducing deformation twinning. Twinning is beneficial for changing the crystallographic orientation of grains, facilitating the dislocation slips in turn. Moreover, twin boundaries serve as active sources for the emission of dislocations [37,38]. Thus, deformation twinning acts as the supplement role for the early-stage plastic accommodation within the alloy microstructure.
As plastic strain and strain rate increase, different dislocation systems are activated, encompassing sliding, accumulation, interaction, tangling, and spatial rearrangement behaviors. It should be noted that compared to the microstructural features observed in the moderately deformed region of Mg alloy samples subjected to severe shot peening at room temperature [30,39], the middle layer of samples treated with WSP exhibits no evidence of twins and twin intersections. The suppression of twinning can be attributed to several synergistic mechanisms. First, the increased grain boundary density enhances grain boundary sliding and diffusion creep, which become the predominant deformation modes, diminishing the necessity for twinning [40,41]. Second, thermal activation at elevated temperatures facilitates non-basal slip systems, introducing additional dislocations and promoting cross-slip from basal to non-basal planes, thereby alleviating stress concentrations. Third, DRX induced by WSP generates defect-free grains with orientations less conducive to twinning while homogenizing stress distribution. Consequently, grain refinement in this region is primarily driven by dislocation slip and DRX rather than deformation twinning. As strain progresses, dislocation cellular structures destabilize and evolve into subboundaries by absorbing dislocations, increasing misorientations. Continued strain leads to the development and annihilation of dislocations within these subboundaries, accompanied by subgrain rotation, ultimately resulting in the formation of nanograins with random crystallographic orientations. In summary, dislocation slip governs the grain refinement in the GW83 alloy during WSP, with twinning playing a coordinating role at the initial stage of deformation.

4.2. The Evolution of Microstructure and Mechanical Property of the GW83 Alloy After WSP

Previous works pointed out that the formation of ultrafine grains or nanograins of Mg alloys during severe plastic deformation generally depends on the DRX behavior. This behavior includes two types: discontinuous dynamic recrystallization (dDRX) and continuous dynamic recrystallization (cDRX) [42,43]. In the process of dDRX behavior, high temperatures or high stored strain energy can induce nucleation and growth of new grains, commonly known as typical recrystallization. This behavior could result in the work softening of the material. It can be observed that the WSP process involves two types of DRX behaviors. As for cDRX, a number of dislocations are activated, engaging in slip activities and accompanied by grain rotation. This process continues until the dislocations are absorbed by grain boundaries, ultimately leading to the formation of high-angle fine grains or subgrains. This mechanism is also referred to as dynamic rotational recrystallization.
In Mg alloys, the CRSS for non-basal slip systems is significantly higher by approximately one order of magnitude compared to basal <a> slip at ambient temperatures, resulting in limited plastic deformation capabilities [44,45]. The CRSS values for these non-basal slip systems exhibit a substantial temperature dependence, decreasing markedly with elevated temperatures [14,15,16,46,47]. Consequently, the application of WSP facilitates the activation of these non-basal slip systems, enhancing the material’s plastic deformation capacity. Nevertheless, the microstructural evolution during WSP remains predominantly governed by dDRX.
On the other hand, for alloys with low recrystallization temperatures, such as Mg and Al alloys, severe plastic deformation processes like SP can induce temperature increases due to the intense impingement of shot particles on the specimen surface. This localized heating can trigger dDRX, leading to material softening. For example, recent studies have shown that high-intensity SP (0.2 mmA, 100% coverage) can elevate the surface temperature of 2060 Al-Li alloy to 210 °C [48]. Our previous research also observed work softening in GW83 alloys during CSP [49]. Therefore, the combined effects of ambient temperature and SP-induced local heating contribute to the softening observed in the GW83 alloy during WSP. This softening results in subgrains coarsening and the reduction of CRS and microhardness, as evidenced by the experimental data presented in Figure 5, Figure 6, Figure 7, Figure 12 and Figure 13.

5. Conclusions

A comprehensive investigation was conducted to evaluate the impact of WSP on surface roughness, microstructural evolution, residual stress distribution, and hardness within the deformation layer of GW83 alloys. The key findings are summarized as follows:
Both CSP and WSP generated a gradient deformation layer characterized by nanograins (50–100 nm) near the surface. These processes introduced high levels of CRS, with maximum values reaching 200 MPa and 187 MPa, respectively.
In contrast to CSP, WSP promoted work softening dominated by dDRX. The work softening is embodied in a larger crystalline size, a lower lattice distortion, dislocation density, CRS, and microhardness. This phenomenon manifested as grain coarsening and reduction in lattice distortions, dislocation densities, CRS, and microhardness compared to the CSP samples.

Author Contributions

Conceptualization, J.G. and C.J.; methodology, H.L.; software, H.L. and X.Z.; validation, H.L., X.Z. and X.W.; formal analysis, H.L. and J.G.; investigation, H.L. and X.Z.; resources, J.G., C.J. and H.L.; data curation, H.L., X.Z. and X.W.; writing—original draft preparation, H.L. and X.Z.; writing—review and editing, J.G. and C.J.; visualization, H.L., J.G. and C.J.; supervision, J.G. and C.J.; project administration, H.L. and J.G.; funding acquisition, H.L. and J.G. All authors have read and agreed to the published version of the manuscript.

Funding

This research was financially supported by the National Natural Science Foundation of China (52371335) and the Natural Science Foundation of the Hubei Provincial Department of Science and Technology (20231j0222).

Institutional Review Board Statement

Not applicable.

Informed Consent Statement

Not applicable.

Data Availability Statement

Data is contained within the article.

Conflicts of Interest

The authors declare no conflict of interest.

References

  1. Yang, J.; Han, S.; Gu, Y.; Zhu, Z.; Zhang, H. Evolution, limitations, advantages, and future challenges of magnesium alloys as materials for aerospace applications. J. Alloys Compd. 2024, 1008, 176707. [Google Scholar] [CrossRef]
  2. Zhang, T.; Wang, W.; Liu, J.; Wang, L.; Tang, Y.; Wang, K. A review on magnesium alloys for biomedical applications. Front. Bioeng. Biotechnol. 2022, 10, 953344. [Google Scholar] [CrossRef] [PubMed]
  3. Li, X.; Lu, L.; Li, J.; Zhang, X.; Gao, H. Mechanical properties and deformation mechanisms of gradient nanostructured metals and alloys. Nat. Rev. Mater. 2020, 5, 706–723. [Google Scholar] [CrossRef]
  4. Pan, Q.; Lu, L.J. Synthesis and deformation mechanics of gradient nanostructured materials. Natl. Sci. Open 2022, 1, 20220010. [Google Scholar] [CrossRef]
  5. Li, J.; Soh, A. Modeling of the plastic deformation of nanostructured materials with grain size gradient. Int. J. Plast. 2012, 39, 88–102. [Google Scholar] [CrossRef]
  6. Unal, O.; Maleki, E.; Karademir, I.; Husem, F.; Efe, Y.; Das, T. Effects of conventional shot peening, severe shot peening, re-shot peening and precised grinding operations on fatigue performance of AISI 1050 railway axle steel. Int. J. Fatigue 2021, 155, 106613. [Google Scholar] [CrossRef]
  7. Bagherifard, S. Enhancing the Structural Performance of Lightweight Metals by Shot Peening. Adv. Eng. Mater. 2019, 21, 1801140. [Google Scholar] [CrossRef]
  8. Świetlicki, A.; Szala, M.; Walczak, M. Effects of Shot Peening and Cavitation Peening on Properties of Surface Layer of Metallic Materials-A Short Review. Materials 2022, 15, 2476. [Google Scholar] [CrossRef]
  9. Zhang, Y.; Zhang, K.; Hu, Z.; Chen, T.; Susmel, L.; Wei, B. The synergetic effects of shot peening and laser-shot peening on the microstructural evolution and fatigue performance of a medium carbon steel. Int. J. Fatigue 2022, 166, 107246. [Google Scholar] [CrossRef]
  10. Zhang, P.; Lindemann, J.; Leyens, C. Shot peening on the high-strength wrought magnesium alloy AZ80—Effect of peening media. J. Mater. Process. Technol. 2010, 210, 445–450. [Google Scholar] [CrossRef]
  11. Liu, W.; Dong, J.; Zhang, P.; Zhai, C.; Ding, W. Effect of shot peening on surface characteristics and fatigue properties of T5-treated ZK60 alloy. Mater. Trans. 2009, 50, 791–798. [Google Scholar] [CrossRef]
  12. Liu, W.C.; Dong, J.; Zhang, P.; Korsunsky, A.M.; Song, X.; Ding, W.J. Improvement of fatigue properties by shot peening for Mg–10Gd–3Y alloys under different conditions. Mater. Sci. Eng. A 2011, 528, 5935–5944. [Google Scholar] [CrossRef]
  13. Liu, W.; Jiang, L.; Cao, L.; Mei, J.; Wu, G.; Zhang, S.; Xiao, L.; Wang, S.; Ding, W. Fatigue behavior and plane-strain fracture toughness of sand-cast Mg–10Gd–3Y–0.5 Zr magnesium alloy. Mater. Des. 2014, 59, 466–474. [Google Scholar] [CrossRef]
  14. Flynn, P.W.; Mote, J.; Dorn, J.E. On the thermally activated mechanism of prismatic slip in magnesium single crystals. Trans. Metall. Soc. AIME 1961, 221, 1148–1154. [Google Scholar]
  15. Barnett, M. A Taylor model based description of the proof stress of magnesium AZ31 during hot working. Metall. Mater. Trans. A 2003, 34, 1799–1806. [Google Scholar] [CrossRef]
  16. Chapuis, A.; Driver, J.H. Temperature dependency of slip and twinning in plane strain compressed magnesium single crystals. Acta Mater. 2011, 59, 1986–1994. [Google Scholar] [CrossRef]
  17. Huang, Y.; Liu, W.; Dong, J. Surface characteristics and fatigue performance of warm shot peened wrought magnesium alloy Mg–9Gd–2Y. Mater. Sci. Technol. 2014, 30, 1481–1487. [Google Scholar] [CrossRef]
  18. Wick, A.; Schulze, V.; Vöhringer, O. Effects of stress- and/or warm peening of AISI 4140 on fatigue life. Steel Res. Int. 2000, 71, 316–321. [Google Scholar] [CrossRef]
  19. Wick, A.; Schulze, V.; Vöhringer, O. Effects of warm peening on fatigue life and relaxation behavior of residual stresses in AISI 4140 steel. Mater. Sci. Eng. A 2000, 293, 191–197. [Google Scholar] [CrossRef]
  20. Menig, R.; Schulze, V.; Vöhringer, O. Optimized warm peening of the quenched and tempered steel AISI 4140. Mater. Sci. Eng. A 2002, 335, 198–206. [Google Scholar] [CrossRef]
  21. SLim, S.H.; Zhang, Z.; Seng, D.H.L.; Lin, M.; Teo, S.L.; Wei, F.; Cheong, A.K.H.; Wang, S.; Pan, J. In-situ warm shot peening on Ti-6Al-4V alloy: Effects of temperature on fatigue life, residual stress, microstructure and mechanical properties. J. Alloys Compd. 2021, 882, 160701. [Google Scholar]
  22. Huang, J.; Wang, Z.; Gan, J.; Yang, Y.; Wu, G.; Meng, Q. Investigation of fatigue performance improvement in SiC w/Al composites with different modified shot peening treatments by considering surface mechanical properties. J. Alloys Compd. 2017, 728, 169–178. [Google Scholar] [CrossRef]
  23. Liao, Y.; Ye, C.; Cheng, G.J. [INVITED] A review: Warm laser shock peening and related laser processing technique. Opt. Laser Technol. 2016, 78, 15–24. [Google Scholar] [CrossRef]
  24. Ye, C.; Liao, Y.; Cheng, G.J. Warm Laser Shock Peening Driven Nanostructures and Their Effects on Fatigue Performance in Aluminum Alloy 6160. Adv. Eng. Mater. 2010, 12, 291–297. [Google Scholar] [CrossRef]
  25. Peral, L.; Zafra, A.; Bagherifard, S.; Guagliano, M.; Fernández-Pariente, I. Effect of warm shot peening treatments on surface properties and corrosion behavior of AZ31 magnesium alloy. Surf. Coat. Technol. 2020, 401, 126285. [Google Scholar] [CrossRef]
  26. Liu, H.; Jiang, C.; Chen, M.; Wang, L.; Ji, V. Surface layer microstructures and wear properties modifications of Mg-8Gd-3Y alloy treated by shot peening. Mater. Charact. 2019, 158, 109952. [Google Scholar] [CrossRef]
  27. Liu, H.; Chen, M.; Wang, L.; Zhan, K.; Ji, V.; Jiang, C. Investigation on microstructure and properties of Al18B4O33 whisker reinforced Al Mg Si matrix composite after shot peening. Vacuum 2018, 160, 303–310. [Google Scholar] [CrossRef]
  28. Langford, J.I.; Wilson, A.J.C. Scherrer after sixty years: A survey and some new results in the determination of crystallite size. J. Appl. Crystallogr. 1978, 11, 102–113. [Google Scholar] [CrossRef]
  29. Vives, S.; Gaffet, E.; Meunier, C. X-ray diffraction line profile analysis of iron ball milled powders. Mater. Sci. Eng. A 2004, 366, 229–238. [Google Scholar] [CrossRef]
  30. Liu, H.; Zhu, W.; Jiang, C.; Guagliano, M.; Xing, S.; Wang, L.; Ji, V.; Zhan, K. Microstructure evolution and residual stress distribution of nanostructured Mg-8Gd-3Y alloy induced by severe shot peening. Surf. Coat. Technol. 2020, 404, 126465. [Google Scholar] [CrossRef]
  31. Williamson, G.; Smallman, R., III. Dislocation densities in some annealed and cold-worked metals from measurements on the X-ray debye-scherrer spectrum. Philos. Mag. 1956, 1, 34–46. [Google Scholar] [CrossRef]
  32. Kadiri, H.E.; Barrett, C.D.; Wang, J.; Tomé, C.N. Why are {101¯2} twins profuse in magnesium? Acta Mater. 2015, 85, 354–361. [Google Scholar] [CrossRef]
  33. Kobayashi, M.; Matsui, T.; Murakami, Y. Mechanism of creation of compressive residual stress by shot peening. Int. J. Fatigue 1998, 20, 351–357. [Google Scholar] [CrossRef]
  34. Weertman, J. Hall-Petch strengthening in nanocrystalline metals. Mater. Sci. Eng. A 1993, 166, 161–167. [Google Scholar] [CrossRef]
  35. Ren, X.; Huang, J.; Zhou, W.; Xu, S.; Liu, F. Surface nano-crystallization of AZ91D magnesium alloy induced by laser shock processing. Mater. Des. 2015, 86, 421–426. [Google Scholar] [CrossRef]
  36. Ashby, M.F. The deformation of plastically non-homogeneous materials. Philos. Mag. J. Theor. Exp. Appl. Phys. 1970, 21, 399–424. [Google Scholar] [CrossRef]
  37. Wang, Y.B.; Sui, M.L. Atomic-scale in situ observation of lattice dislocations passing through twin boundaries. Appl. Phys. Lett. 2009, 94, 737. [Google Scholar] [CrossRef]
  38. Wang, Y.B.; Wu, B.; Sui, M.L. Dynamical dislocation emission processes from twin boundaries. Appl. Phys. Lett. 2008, 93, 684. [Google Scholar] [CrossRef]
  39. Shi, X.Y.; Liu, Y.; Li, D.J.; Chen, B.; Zeng, X.Q.; Lu, J.; Ding, W.J. Microstructure evolution and mechanical properties of an Mg-Gd alloy subjected to surface mechanical attrition treatment. Mater. Sci. Eng. A 2015, 630, 146–154. [Google Scholar] [CrossRef]
  40. Barnett, M.R. A rationale for the strong dependence of mechanical twinning on grain size. Scr. Mater. 2008, 59, 696–698. [Google Scholar] [CrossRef]
  41. Fan, H.; Aubry, S.; Arsenlis, A.; El-Awady, J.A. Grain size effects on dislocation and twinning mediated plasticity in magnesium. Scr. Mater. 2016, 112, 50–53. [Google Scholar] [CrossRef]
  42. Huang, K.E.; Logé, R.E. A review of dynamic recrystallization phenomena in metallic materials. Mater. Des. 2016, 111, 548–574. [Google Scholar] [CrossRef]
  43. Sakai, T.; Belyakov, A.; Kaibyshev, R.; Miura, H.; Jonas, J.J. Dynamic and post-dynamic recrystallization under hot, cold and severe plastic deformation conditions. Prog. Mater. Sci. 2014, 60, 130–207. [Google Scholar] [CrossRef]
  44. Lou, X.; Li, M.; Boger, R.; Agnew, S.; Wagoner, R. Hardening evolution of AZ31B Mg sheet. Int. J. Plast. 2007, 23, 44–86. [Google Scholar] [CrossRef]
  45. Aitken, Z.H.; Fan, H.; El-Awady, J.A.; Greer, J.R. The effect of size, orientation and alloying on the deformation of AZ31 nanopillars. J. Mech. Phys. Solids 2015, 76, 208–223. [Google Scholar] [CrossRef]
  46. Cepeda-Jiménez, C.M.; Molina-Aldareguia, J.M.; Pérez-Prado, M.T. Origin of the twinning to slip transition with grain size refinement, with decreasing strain rate and with increasing temperature in magnesium. Acta Mater. 2015, 88, 232–244. [Google Scholar] [CrossRef]
  47. Zhang, Z.; Yuan, L.; Ma, J.; Zheng, M.; Shan, D.; Guo, B. Role of <a> and <c+ a> dislocations on the room-temperature grain boundary migration in a deformed Mg alloy. Int. J. Plast. 2024, 172, 103862. [Google Scholar]
  48. Tao, X.; Gao, Y.; Kang, J.; Wang, Y. Softening Effects Induced by Shot Peening for an Aluminum-Lithium Alloy. Met. Mater. Trans. A 2019, 51, 410–418. [Google Scholar] [CrossRef]
  49. Liu, H.; Gan, J.; Jiang, C.; Wu, W.; Guagliano, M. Work softening mechanism and microstructure evolution of nanostructured Mg-8Gd-3Y alloy during severe shot peening. Surf. Coat. Technol. 2022, 441, 128601. [Google Scholar] [CrossRef]
Figure 1. (a) Optical micrographs and (b) XRD pattern of GW83 alloy before SP.
Coatings 15 00316 g001
Figure 2. Surface 3D morphology after SP and WSP treatments.
Coatings 15 00316 g002
Figure 3. Surface XRD profiles of each sample.
Coatings 15 00316 g003
Figure 4. Depth distributions of the structural breadths from two different diffraction peaks: (a) (0002) and (b) (10 1 ¯ 1) profiles.
Coatings 15 00316 g004
Figure 5. Depth distributions of crystalline size calculated from two different diffraction peaks: (a) (0002) and (b) (10 1 ¯ 1) profiles.
Coatings 15 00316 g005
Figure 6. Depth distributions of microstrain calculated from two different diffraction peak profiles: (a) (0002) and (b) (10 1 ¯ 1) profiles.
Coatings 15 00316 g006
Figure 7. Depth distributions of dislocation density calculated from two different diffraction peak profiles: (a) (0002) and (b) (10 1 ¯ 1) profiles.
Coatings 15 00316 g007
Figure 8. (a) Bright-field and (b) dark-field TEM images showing the microstructure of the WSP sample near the top surface, and the inset is the corresponding SAED pattern; (c) HRTEM pattern corresponding to the marked zone of A in (a); (d) IFFT images of the marked zone of B; (e) plot file of IFFT patterns from (d).
Coatings 15 00316 g008
Figure 9. (a) Bright-field and (b) dark-field TEM images showing the microstructure of the WSP sample near the top surface.
Coatings 15 00316 g009
Figure 10. (a,b) Bright-field TEM images taken from the middle deformation layer from the WSP sample surface.
Coatings 15 00316 g010
Figure 11. (a) Bright-field and (b) dark-field TEM images near the matrix zone; (c) HRTEM pattern corresponding to the marked zone A in (a); (d) corresponding SAED of deformation twinning.
Coatings 15 00316 g011
Figure 12. Depth distributions of residual stress after SP and WSP treatments.
Coatings 15 00316 g012
Figure 13. Depth distributions of microhardness after SP and WSP treatments.
Coatings 15 00316 g013
Table 1. Mechanical properties of the GW83 alloy used in this work.
SpecimenYield Strength (MPa)Tensile Strength (MPa)Elongation (%)Hardness (HV)
GW83215274980
Table 2. Surface roughness of the GW83 alloy after CSP and WSP.
SampleRaRz
Conventional SP2.8815.41
WSP4.5923.38
Table 3. The domain size, microstrain and dislocation density distribution of GW83 alloy (0002) diffraction peak after CSP and WSP treatment.
Domian Size
(nm)
MicrostrainDislocation Density (m−2)
CSPWSPCSPWSPCSPWSP
030380.00590.005512.52 × 10152.10 × 1015
1032430.005340.005032.22 × 10151.75 × 1015
2539560.0050.004521.85 × 10151.36 × 1015
5053780.003910.003361.258 × 10157.79 × 1014
1001662000.00210.001312.24 × 10141.35 × 1014
1502272360.001390.001118.87 × 10136.53 × 1013
2002372360.001050.0008795.98 × 10134.72 × 1013
2502372330.001210.001195.43 × 10135.45 × 1013
Table 4. Residual stress distribution of GW83 alloy after CSP and WSP treatment (Unit MPa).
0102550100150200250
CSP−200.5−193−179−116−60.5−5.5522.5
WSP−184.5−187−150−80−42−0.51110.5
Disclaimer/Publisher’s Note: The statements, opinions and data contained in all publications are solely those of the individual author(s) and contributor(s) and not of MDPI and/or the editor(s). MDPI and/or the editor(s) disclaim responsibility for any injury to people or property resulting from any ideas, methods, instructions or products referred to in the content.

