1. Introduction
Many bridges have been built in China. Among them, arch bridges are widely built with the advantages of low cost, good mechanical performance and good durability [
1,
2,
3]. The cantilever casting method is adopted to construct many concrete arch bridges both in China and overseas [
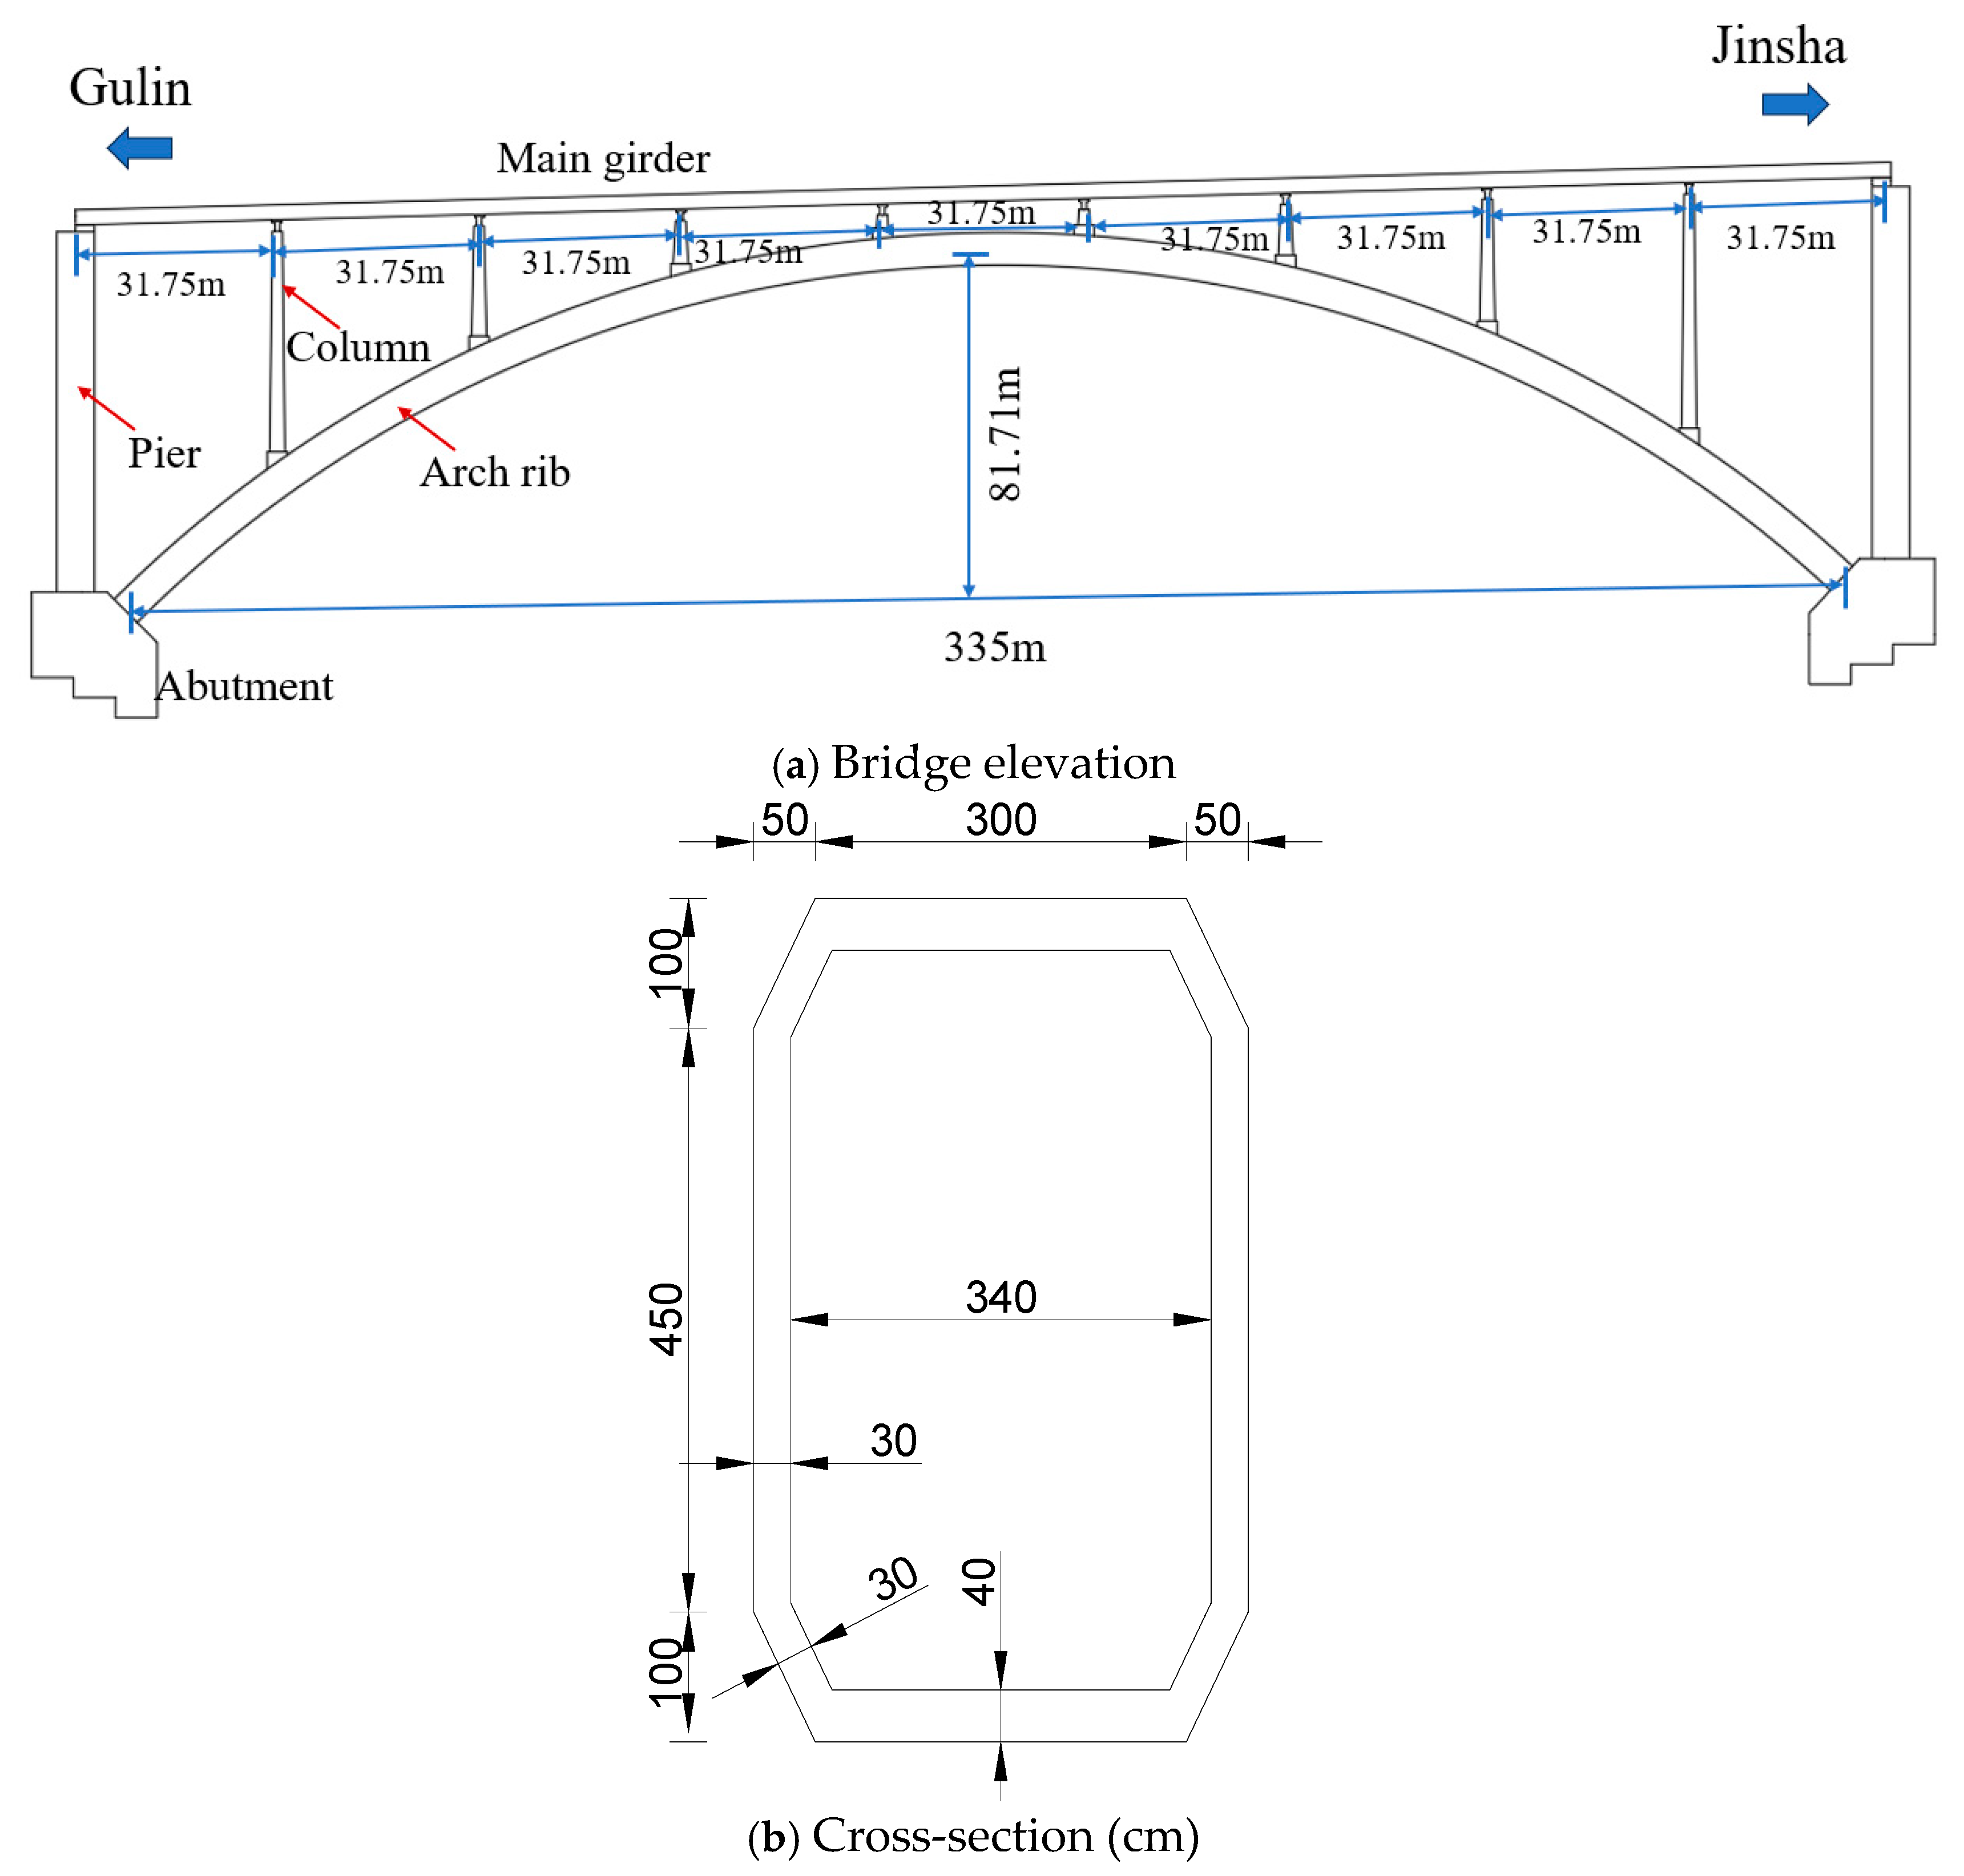
4]. With this method, China has built more than 10 long-span concrete arch bridges. Sichuan Shuiluo River Bridge, completed in 2024, has an arch rib span of 355 m. It is the concrete arch bridge with the second-largest span in the world built by the cantilever casting method. The height of the cross-section of the arch rib is 6.5 m, and the width is 4 m. The cross-section has a relatively small width and a relatively large height, which is a typical cross-section with a large height-to-width ratio. The arch rib will be affected by temperature during construction. As an important live load, temperature load should be considered in bridge design and construction. Ignoring or failing to correctly estimate the temperature load effect may lead to structural failure [
5].
The material of a concrete bridge is concrete. At the level of concrete materials, after the concrete structure is exposed to sunlight, the temperature of the concrete will change. Sunlight exposure can have a significant impact on the microstructure, mechanical properties, and durability of the concrete surface. When studying the interaction between the concrete surface and sunlight, scholars have made some important progress. For example, Weber et al. [
6] explored the heat transfer process of concrete at high temperatures. By comparing the results of five numerical models, they analyzed the thermodynamic behavior of concrete in a high-temperature environment. The research results show that temperature has a significant impact on the physical properties of concrete, such as thermal conductivity, porosity, and permeability. Xu et al. [
7] analyzed the technical problems in the application of heat-reflective coatings for reducing the temperature of concrete bridges. The research pointed out that concrete materials themselves have thermal inertia. When the temperature difference between the inside and outside is large, large surface stresses will occur on the concrete surface, even leading to cracks. For example, in the Champigny box-girder bridge in the United States, the change in support reaction force due to temperature difference reached 26%, and the tensile stress of the top plate reached 2.7 MPa. Wang et al. [
8] focused their research on the influence of temperature on the surface hydration products of cement-based materials and the interaction process between the surface and temperature. Through experiments, they revealed the microstructural changes and the evolution of mechanical properties of cement-based materials under low-temperature and high-temperature conditions. Zuo et al. [
9] and Zeng et al. [
10] studied the relationship between the external environment and the rheology and air content of concrete materials. Thomas et al. [
11] researched the impact of high temperature on the mechanical performance and microstructures of concrete containing steel fibers and analyzed the causes of temperature-induced damage to concrete. Wang et al. [
12] carried out a study on the problem that the brittleness of barite aggregates leads to poor strength and toughness of radiation-proof concrete, which limits its application in high-pressure and high-temperature nuclear engineering, and analyzed the influence of polypropylene fiber materials on the mechanical properties of concrete at high temperatures. In addition, Ada et al. [
13] studied the hygrothermal properties of hemp-lime concrete incorporated with phase-change materials, compared the heat-transfer properties of concrete materials with different mix ratios, and provided a reference for the thermal insulation applications of building materials. Adhikary et al. [
14] reviewed the application of expanded glass as a lightweight aggregate in concrete and explored its thermal insulation properties. Al-Yasiri et al. [
15] explored the influence of phase-change materials with different contents on the thermal insulation performance of concrete and presented the change in heat transfer caused by different contents of phase-change materials. Saffari et al. [
16] explored the application of phase-change-material-enhanced building envelopes in improving building energy flexibility. Sani et al. [
17] impregnated phase-change materials into lightweight aggregates to develop thermal-energy-storage composite materials. Research shows that the addition of phase-change materials can effectively absorb heat. Sawadogo et al. [
18] studied a new type of bio-based phase-change material and analyzed the temperature regulation ability of the material through experiments. Liu et al. [
19] proposed a multifunctional reflective thermal insulation coating based on magnesium phosphate cement (MPC). By adding functional components such as titanium dioxide and hollow glass microspheres, excellent reflective thermal insulation performance was achieved. Tian et al. [
20] conducted a study to analyze the thermal control and freeze-thaw resistance properties of microencapsulated phase-change materials in composite concrete bridge piers through numerical simulation. The results show that phase-change materials can significantly improve the thermal insulation performance of concrete and enhance its durability under extreme temperature conditions. These studies provide a reference for understanding the performance changes of concrete materials in complex environments. However, there are still deficiencies in existing research. For example, most studies focus on laboratory conditions and lack long-term monitoring of the performance of concrete materials and their surfaces in actual engineering environments. In addition, existing research mostly focuses on the influence of a single factor, while in actual engineering, the temperature change process of concrete materials after sunlight exposure is often affected by a combination of various environmental factors.
At the structural level of concrete bridges. Numerous scholars have carried out research on the law of temperature distribution in bridges and the impact of temperature on structural loading. Tong et al. [
21] conducted research on the temperature effects of steel beams within a particular temperature setting. They analyzed the impacts of sunlight exposure and shading on temperature distribution and presented the temperature distribution curves of steel beams featuring varying pavement thicknesses. Based on the Normandy Bridge, Lucas et al. [
22] monitored the temperatures of the steel box and stay cables and presented the distribution curves of temperature along the height of the section. However, the number of measuring points was relatively small. Lawson et al. [
23] conducted a study on the temperature variation of steel–concrete composite beams, but there are many influencing factors in the numerical analysis, and some parameters are difficult to determine, so the research results need to be verified by the real bridge. Kim et al. [
24] considered the influences of factors such as sunlight exposure and environmental changes, investigated the temperature field of the main beam of cable-stayed bridges, and proposed a numerical method for predicting temperature changes. However, due to the absence of a pavement layer, the research results cannot reflect the real temperature distribution of the main beam section upon the bridge’s completion. Xia et al. [
25] studied the temperature behavior of the Tsing Ma Bridge in Hong Kong. Through on-site monitoring and numerical methods, they analyzed the bridge’s temperature distribution and the resulting structural responses and concluded that temperature significantly affects the deformation of the main cable and the main girder. Tao et al. [
26] monitored the temperature changes of the concrete beam bridge, examined the connection between the temperature alterations of the concrete box and weather conditions, and proposed a temperature gradient curve by applying the extreme-value statistical theory. They further pointed out that the temperature model in the code could not well reflect the temperature changes of the bridge and was unfavorable. Li et al. [
27], relying on the Linyi Bridge, analyzed the temperature change laws and distribution features of the steel box–girder and investigated the impact of temperature on the deformation and stress of the steel box–girder under the maximum cantilever condition in the incremental-launching construction process by means of the finite-element method. It was pointed out that the temperature gradient can cause the large-scale deformation of the cantilever structure and affect the bending moment of the structure. Zhou et al. [
28] studied the influence of temperature changes on the deformation of the steel main girders and bridge towers of suspension bridges, proposed a temperature effect model, and verified it with monitoring data. Lin et al. [
29] computed the temperature field of the truss arch rib under summer sunlight by means of numerical approaches. They analyzed the corresponding laws of the temperature changes of each chord tube cross-section of the arch rib with sunlight exposure and reached the conclusion that steel tubes are sensitive to sunlight exposure, while the concrete inside the tubes is insensitive to it.
The above-mentioned scholars carried out wide-ranging studies on the temperature gradients of bridges and obtained useful conclusions. However, there is less research on the temperature gradient of the concrete arch bridge. Through field tests, Liu et al. [
30] studied the temperature gradient of I-shaped arch ribs of concrete arch bridges and put forward a calculation model for the temperature gradient but did not analyze the temperature difference at different positions of arch ribs. In addition, whether it is a girder bridge or an arch bridge, the sections studied by the above scholars all have flange plates. Under the action of sunlight, the flange plate has a shielding effect on the web plate. However, the temperature gradient model of the box arch rib of a concrete arch bridge without a flange plate is rarely studied. An important difference between the long-span concrete arch rib section and the traditional concrete girder bridge section is that there is no flange plate at the top of the section, the web of the section is not shielded, and the sun is fully illuminated. In addition, the arch rib is curved, and the main beam of the girder bridge is straight. In terms of appearance, there are also differences between the two. At present, the arch rib cross-sections of concrete arch bridges in China with spans greater than 200 m all have no flange plates. However, the current specification only specifies the temperature gradient mode for concrete box girders with a pavement layer and flange plates. There is no corresponding temperature gradient calculation model for a box arch without a flange plate.
To sum up, in order to figure out the temperature gradient distribution pattern of box-shaped arch ribs without flange plates, we provide suggestions for the design and construction of bridges. At the same time, we also provide a temperature model for the further development of corresponding thermal insulation materials for concrete surfaces or new types of concrete materials.
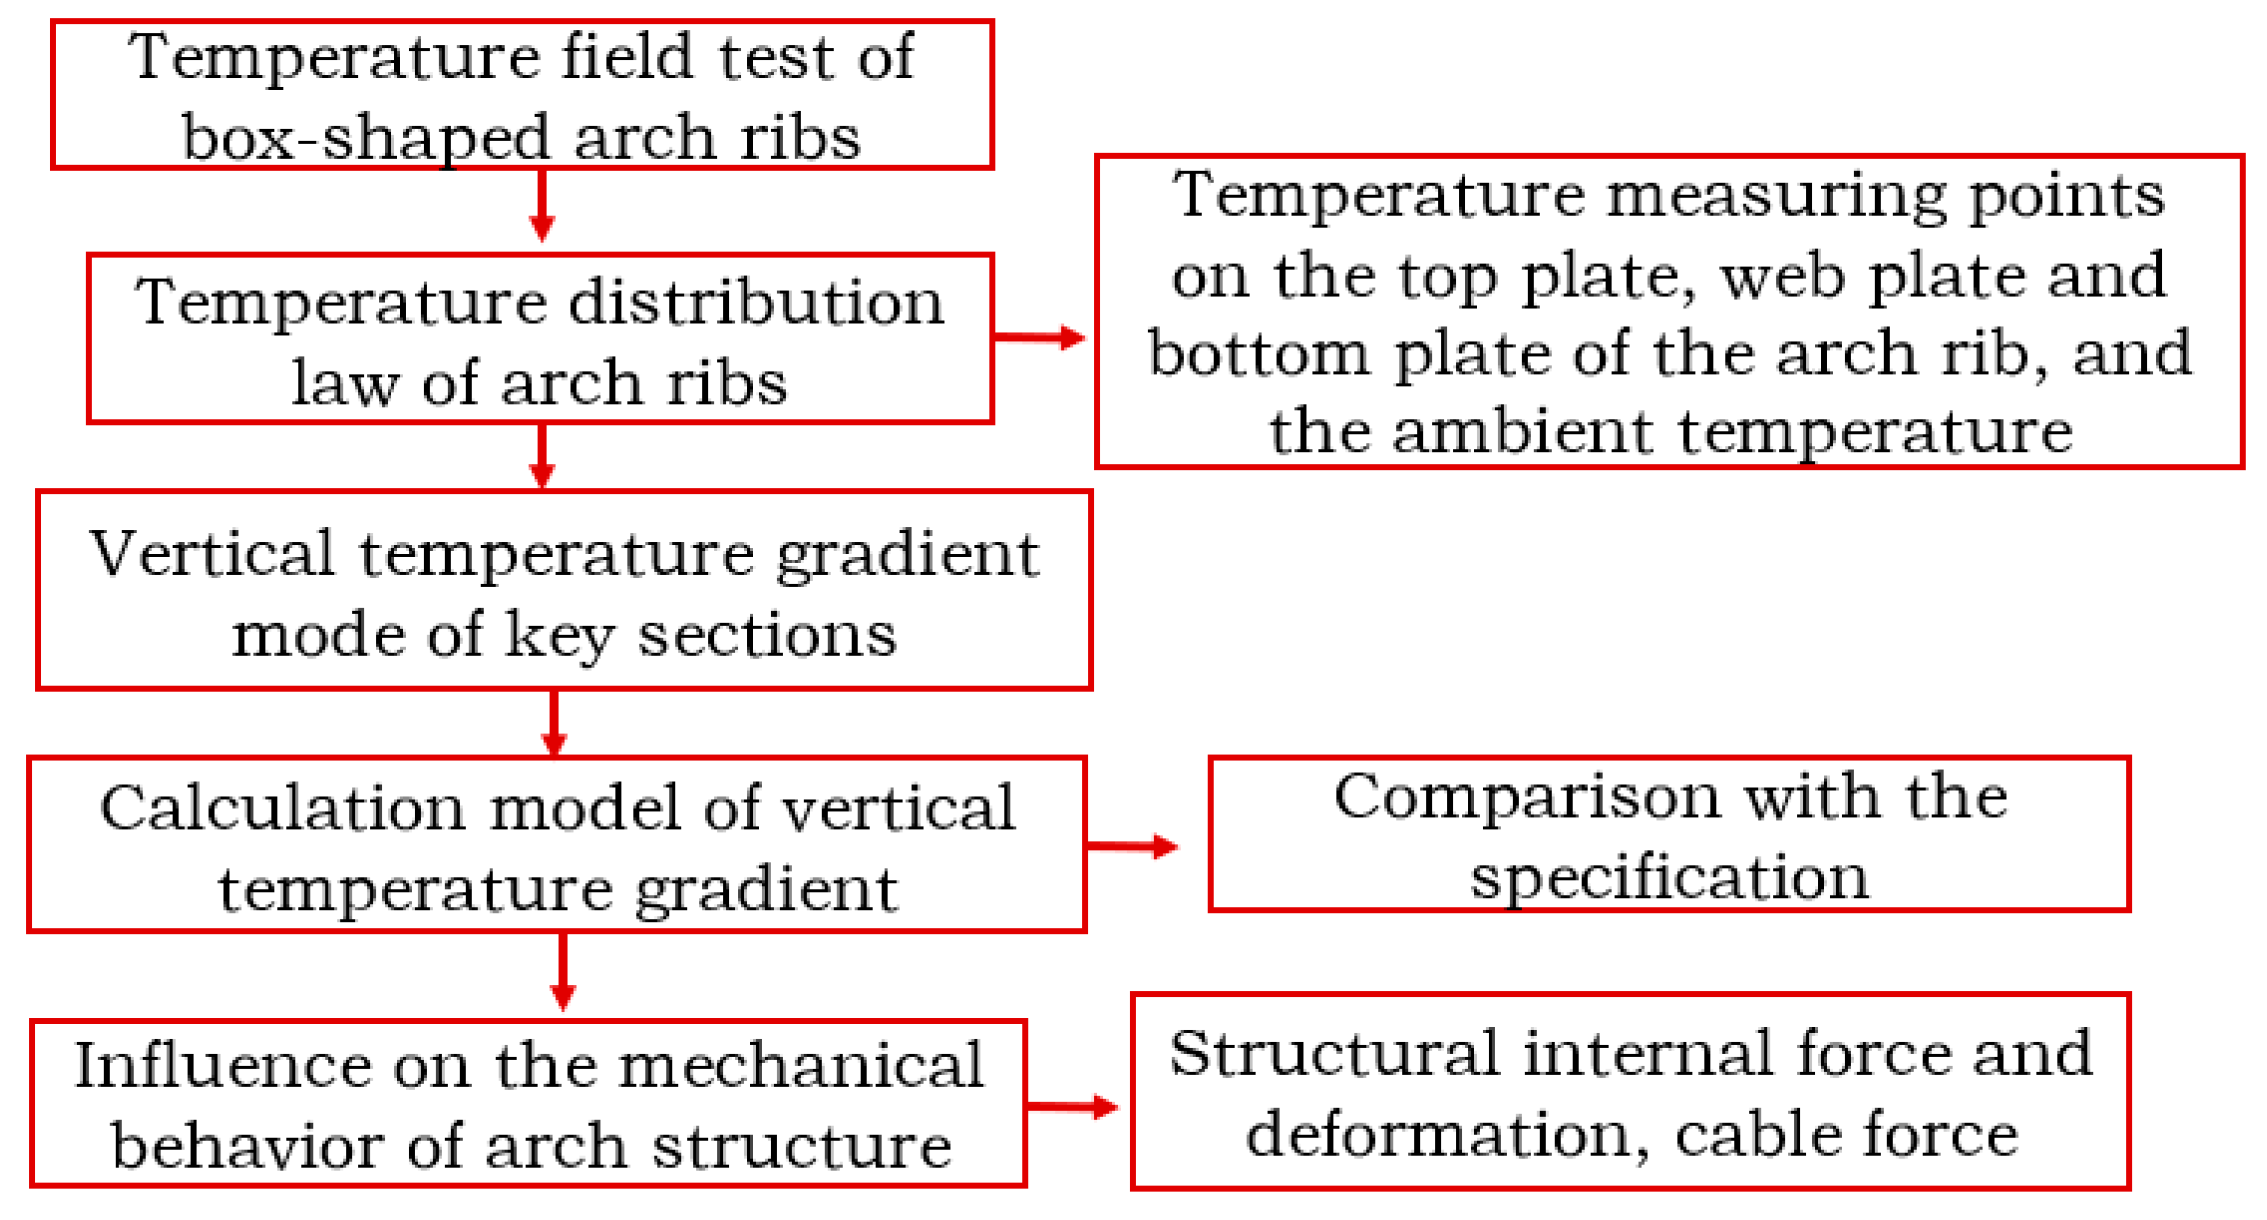
Relying on the Shuiluohe Bridge with a span of 355 m, this paper studies the temperature effect of the box section arch rib of a concrete arch bridge without a flange plate under the action of sunlight. Firstly, a temperature experiment of the arch rib without flange plates was conducted. According to the experimental data, the temperature distribution and changing rules of the arch rib cross-section were analyzed. Then, according to the measured temperature data, a calculation mode of the vertical temperature gradient of the arch rib was proposed and compared with the specification. Finally, in view of the most disadvantageous phases of the arch rib in the construction process, the influence of different gradient modes on the structural mechanical behavior was analyzed by means of a simulation model.
3. Analysis of Test Results
Figure 6 presents the test results of the ambient temperature in the springing region of the arch rib. The top plate and webs on both sides of the box are subject to sunlight for an extended period, and the ambient temperature changes greatly, while the ambient temperature in the box changes slightly.
In
Figure 6, the ambient temperature at the springing section changes as a sine function with time. The temperature generally began to rise at 6 a.m., peaked at 14 p.m. to 17 p.m. and then began to decline. The lowest and highest ambient temperatures of the measuring point at the top plate appeared at 5 a.m. and 4 p.m., respectively, with the temperatures being 27.9 °C and 38.1 °C. The maximum temperature difference within 24 h at this measuring point is 10.2 °C. The lowest and highest values of the environmental temperature at the measuring point on the east web of the box appear at 5 in the morning and 16 in the afternoon, respectively. The temperatures are 28.1 °C and 37.8 °C. The maximum temperature differential within 24 h for this measuring point is 9.7 °C. The lowest and highest values of the environmental temperature at the measuring point on the west web appeared at 5 a.m. and 16 p.m., respectively, with temperatures of 28.2 °C and 37.9 °C, and the maximum temperature differential within 24 h for this measuring point is 9.7 °C. The lowest and highest temperatures in the box appeared at 5 a.m. and 17 p.m., respectively, with temperatures of 29.9 °C and 32.2 °C, and the maximum temperature difference within 24 h at this measuring point was 2.3 °C. The temperature variation in the box is small, and the temperature is relatively stable.
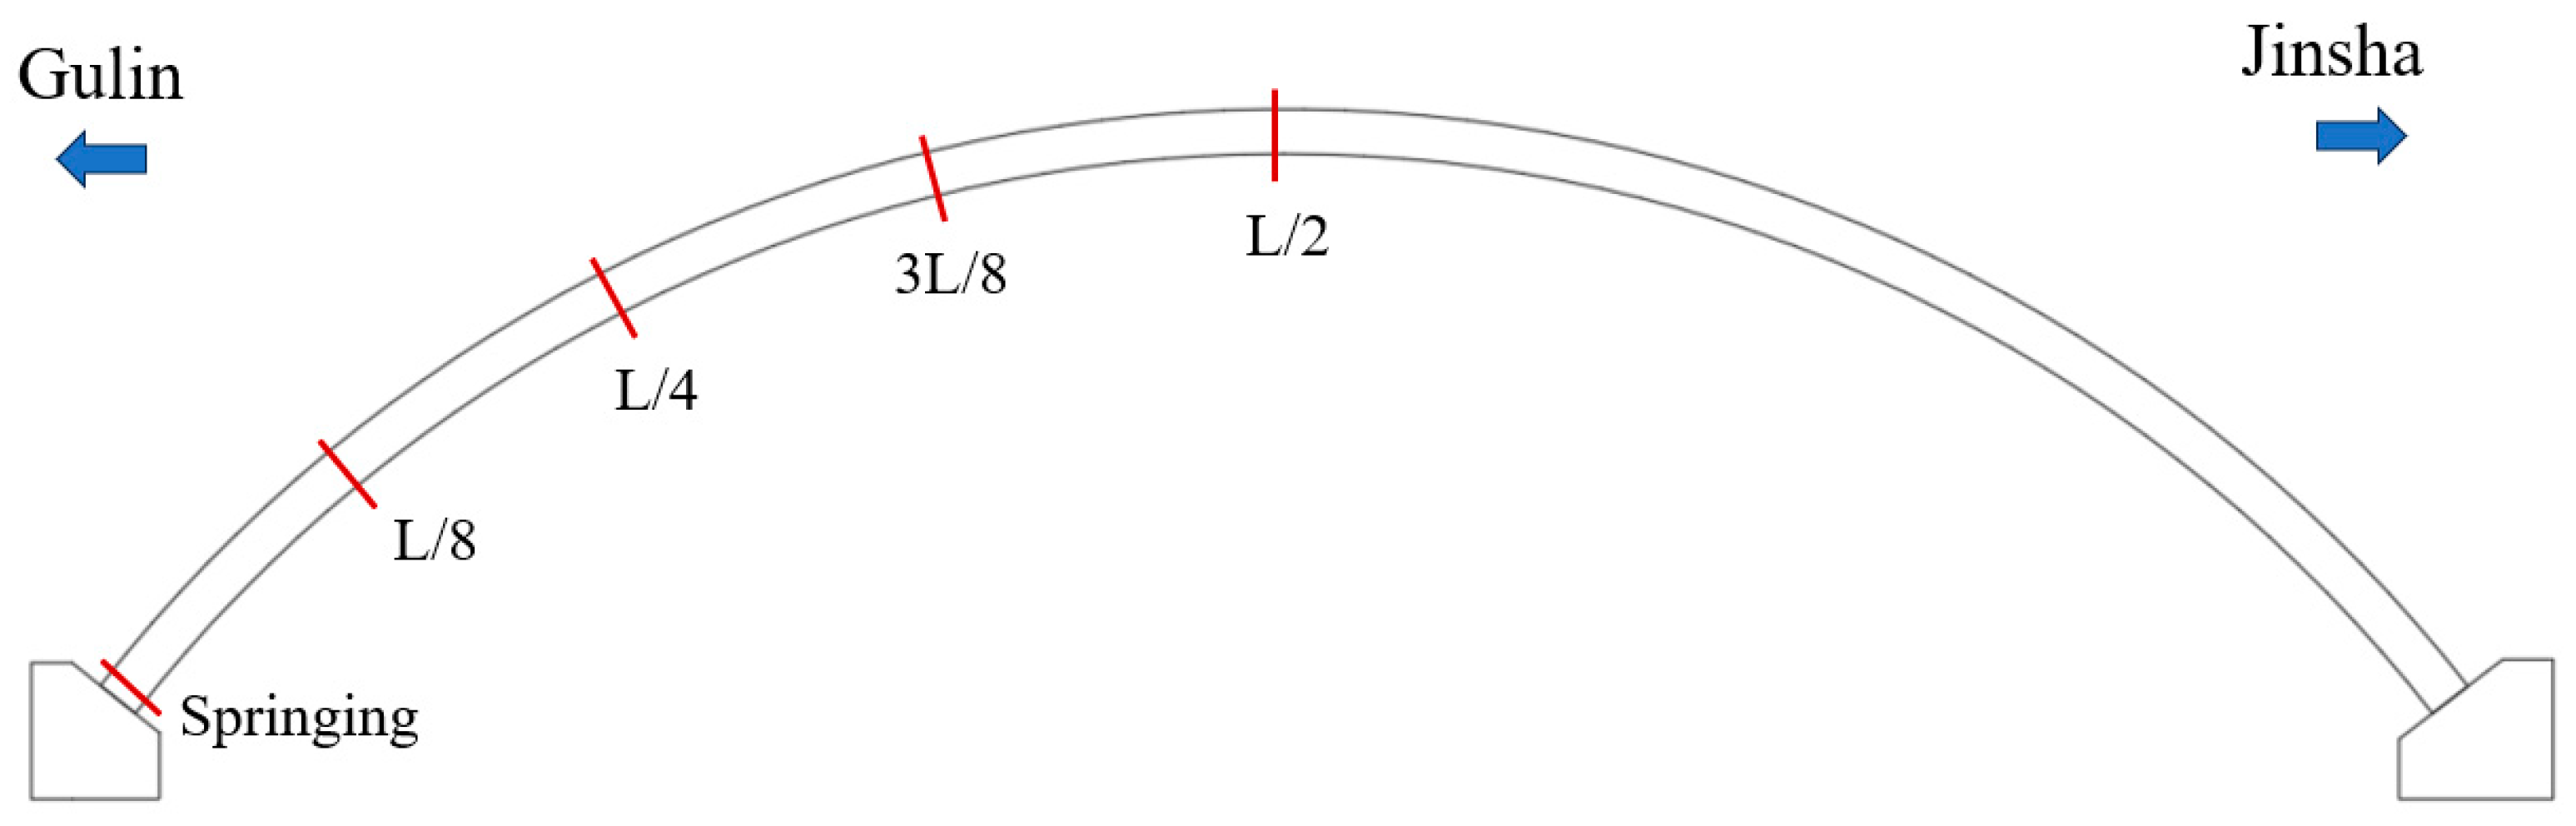
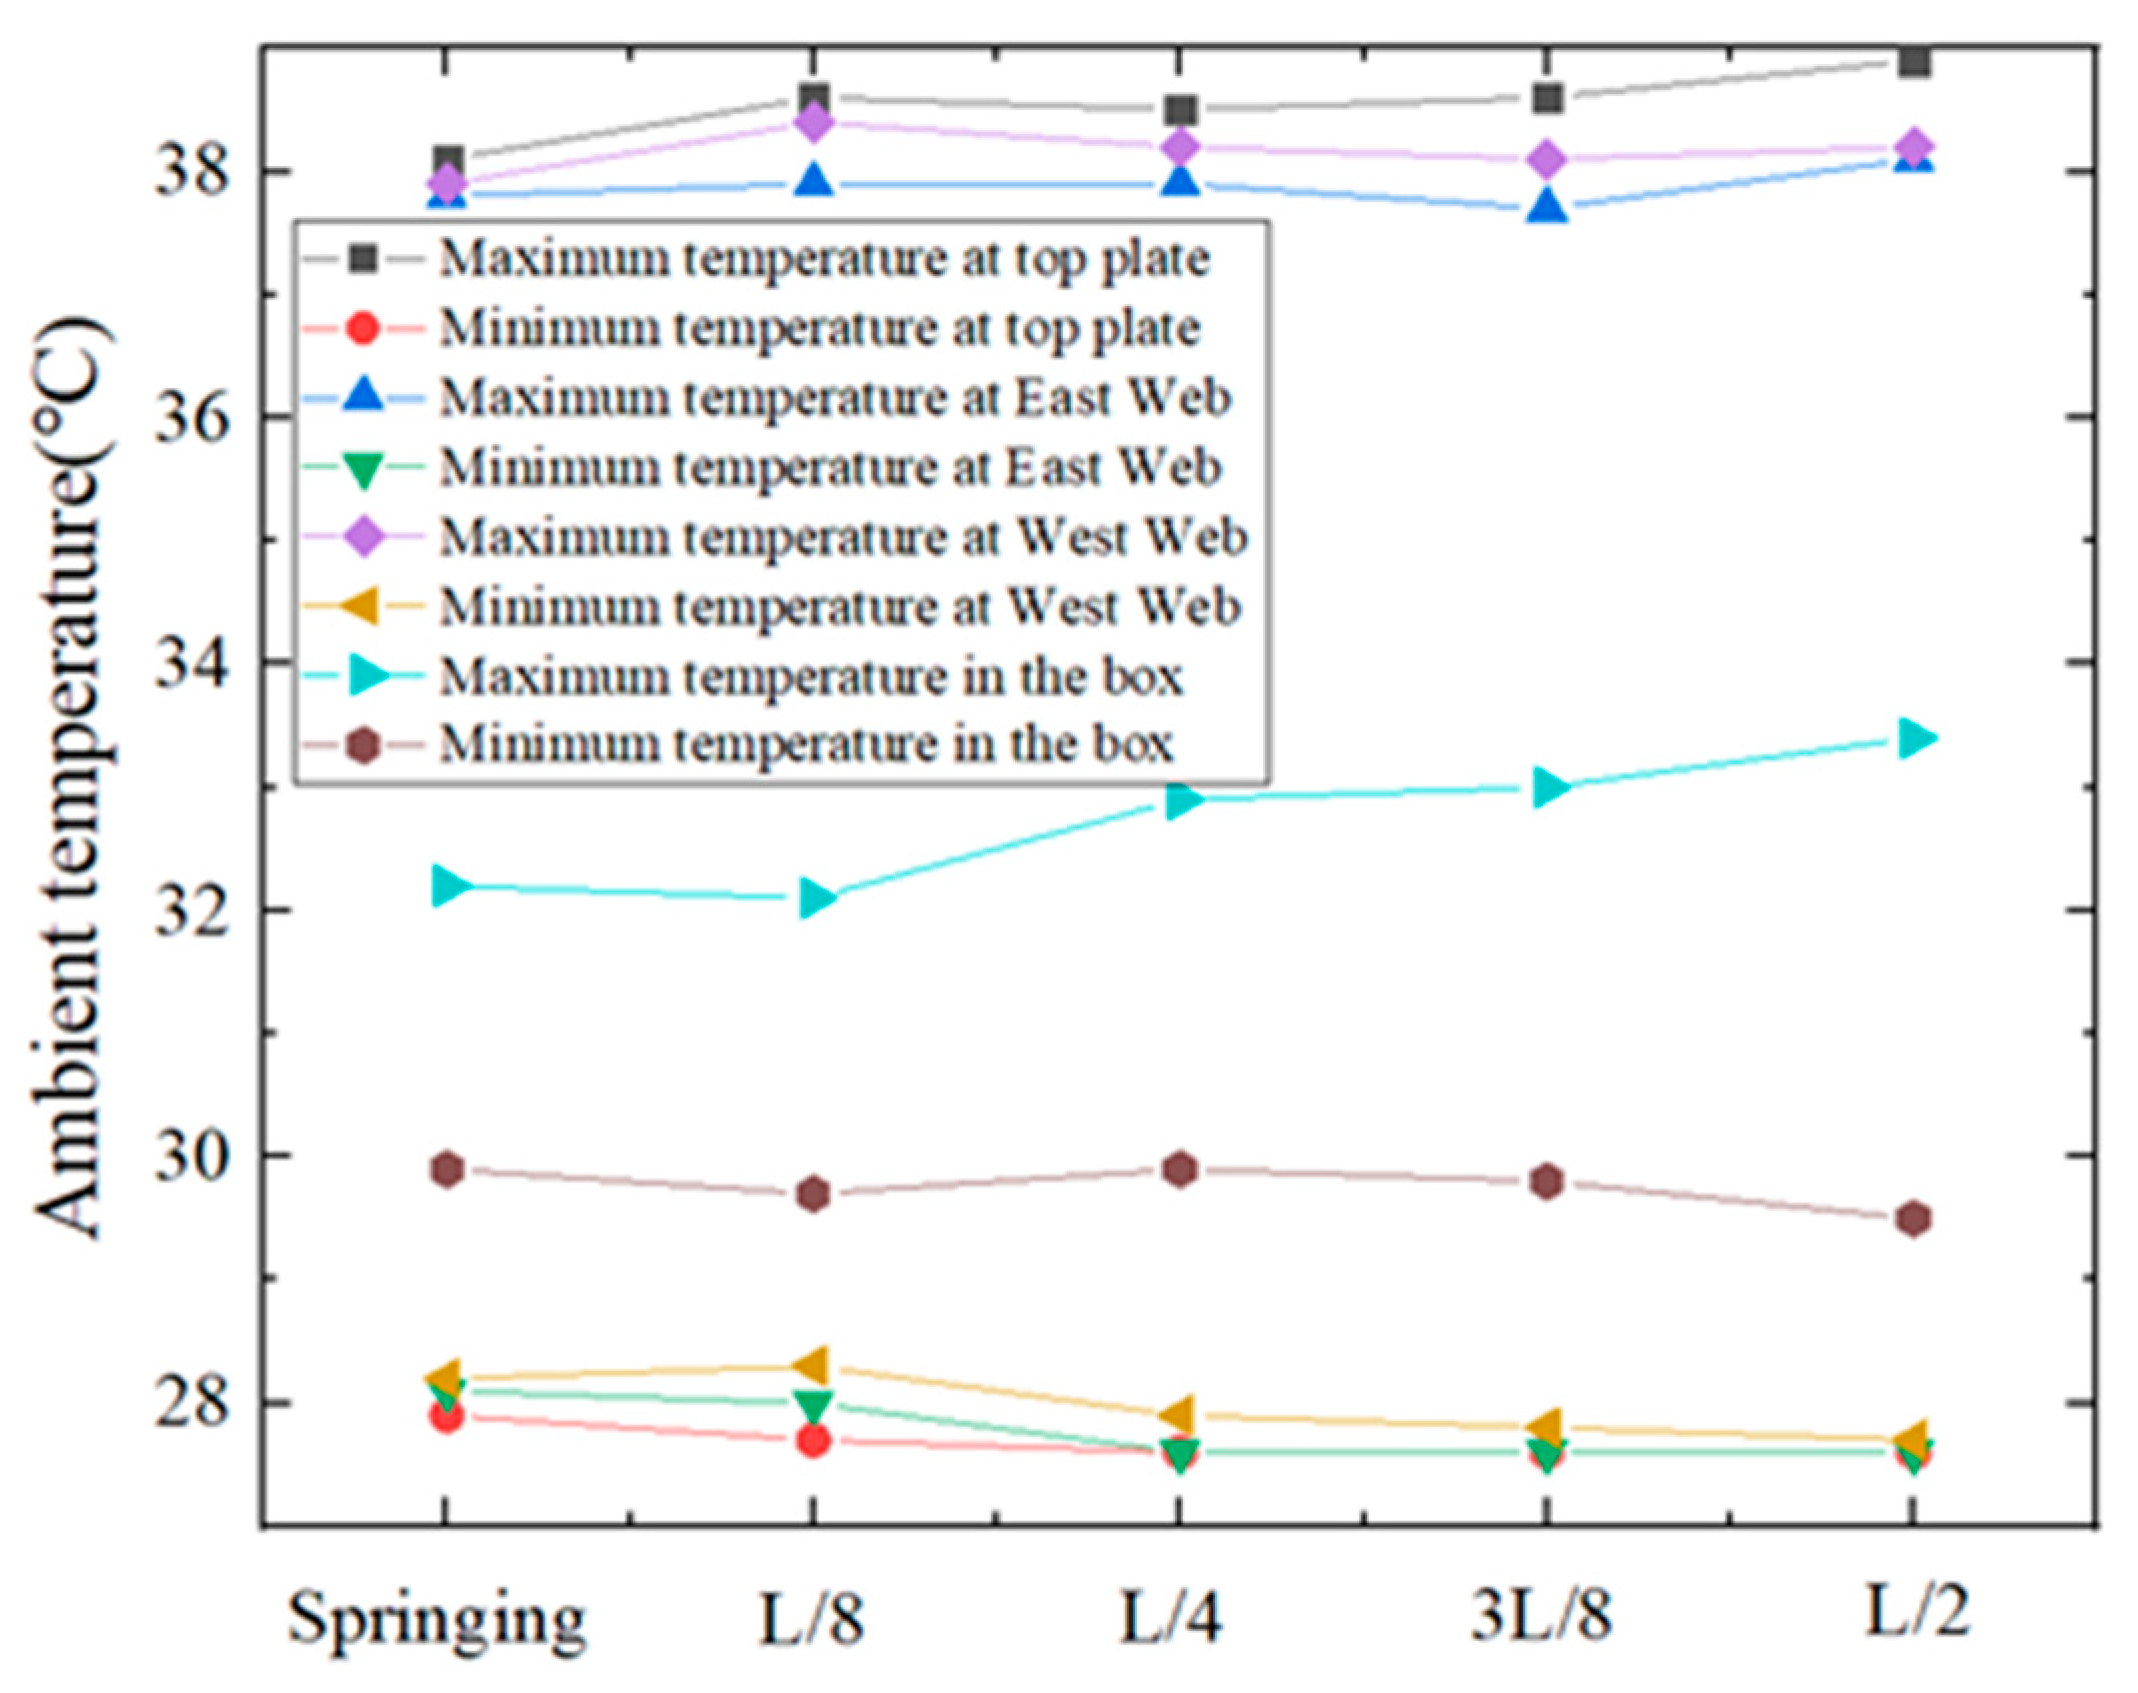
Figure 7 depicts the ambient temperature distribution at the crucial cross-sections of the arch rib. In
Figure 7, the difference in ambient temperature at each key section from the springing to L/2 is very small, and the temperature difference is within 1 °C. As depicted in
Figure 8,
Figure 9,
Figure 10,
Figure 11 and
Figure 12, they are the temperature variations of the measuring points in the cross-section at the arch springing.
From
Figure 8,
Figure 9,
Figure 10,
Figure 11 and
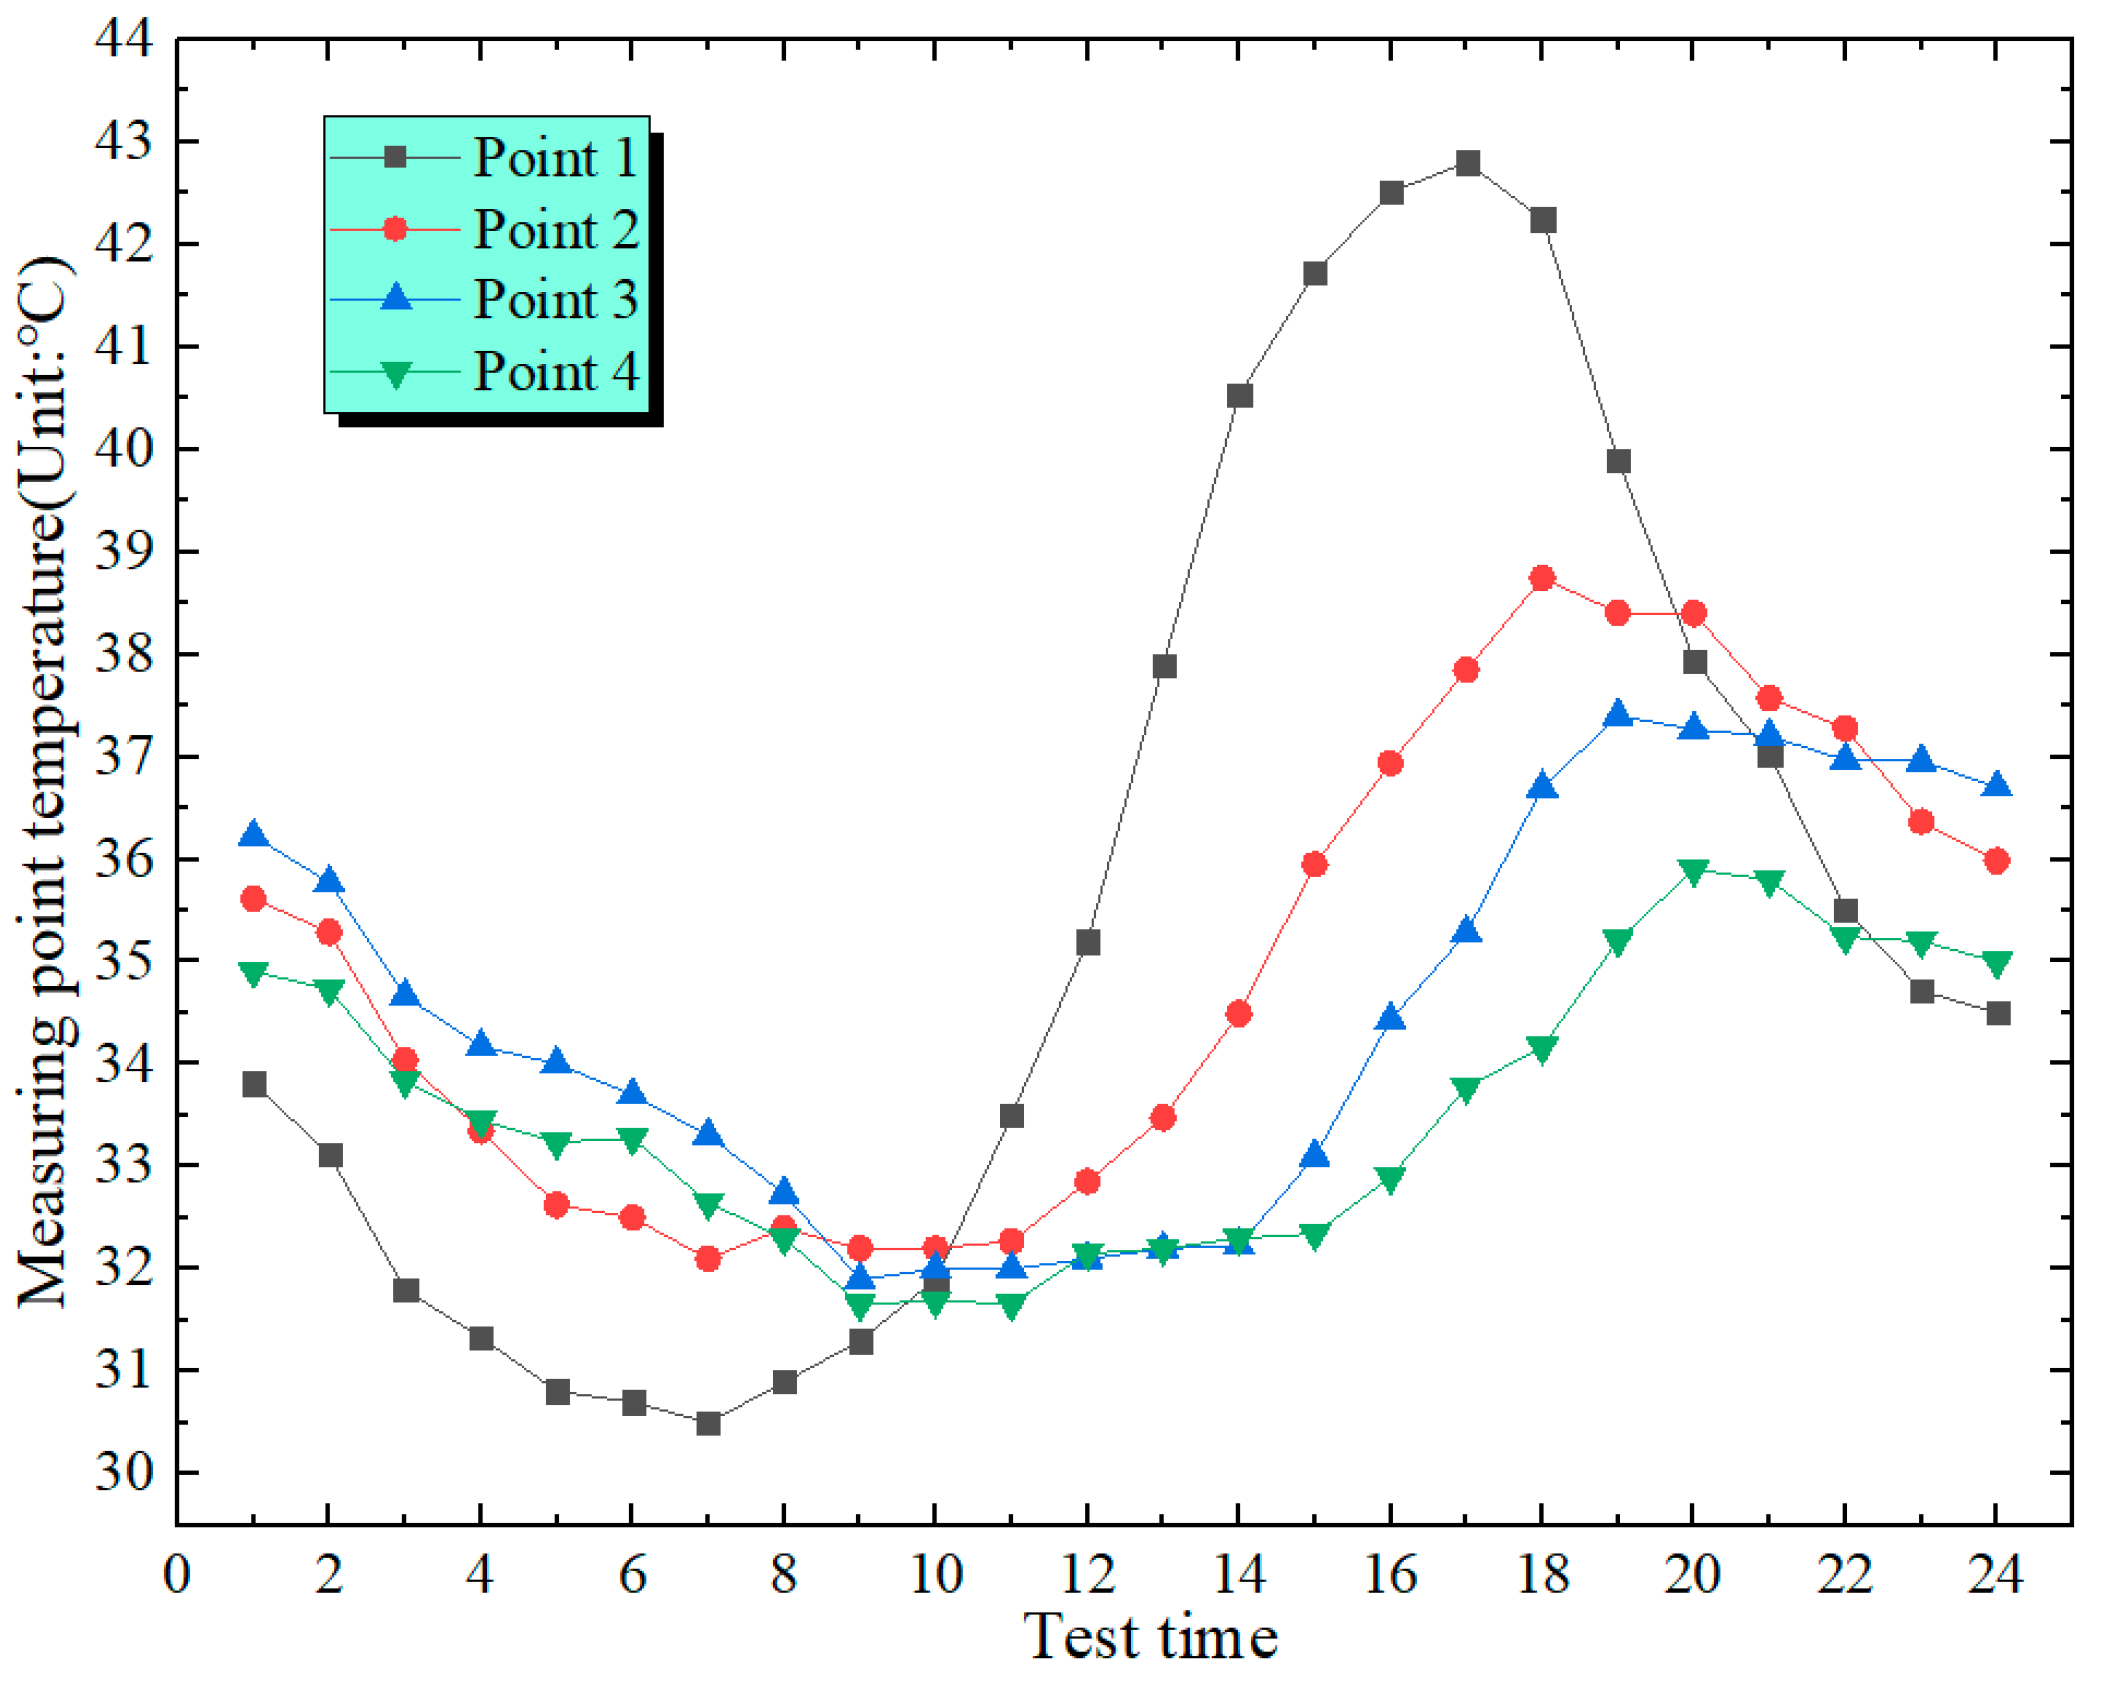
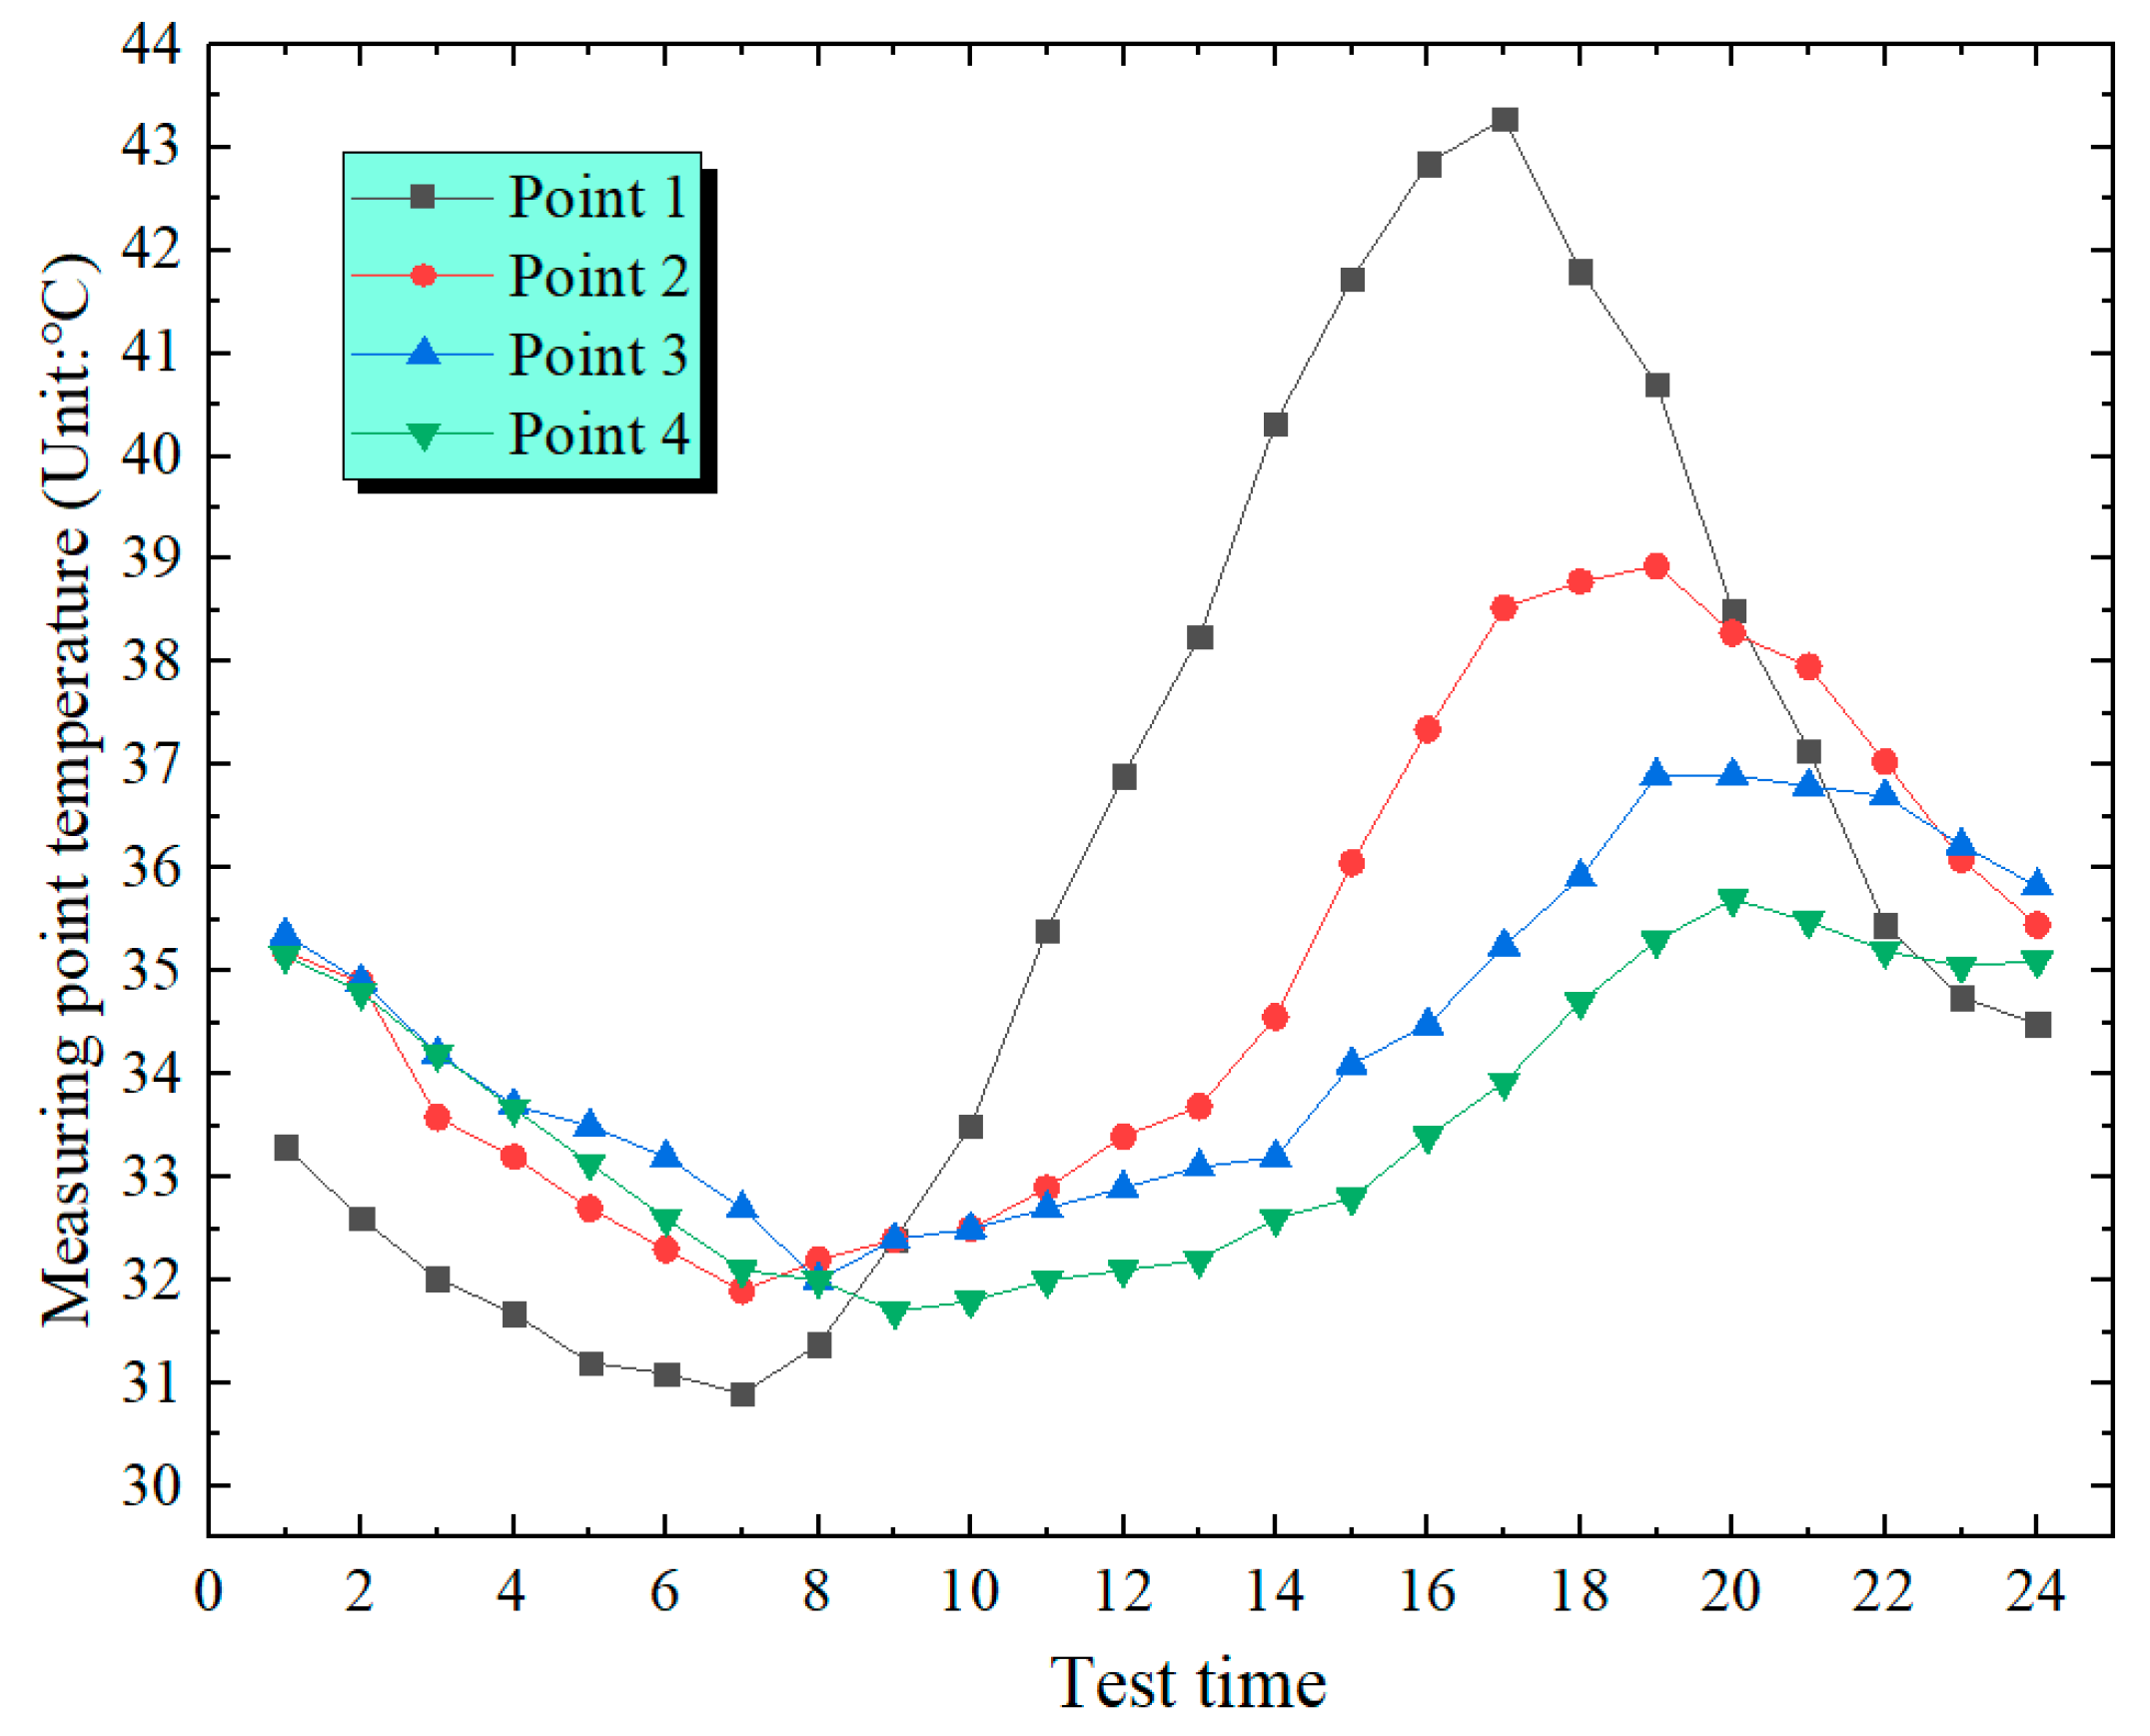
Figure 12, The temperatures of each measuring point fluctuate with time in a sinusoidal function curve, and the laws of change are alike. Along the direction of concrete thickness, the change in temperature shows a lag phenomenon. When contrasted with the temperatures at the measuring points on the web and the bottom plate, those at the measuring points on the top plate exhibit the highest temperature and the greatest temperature difference.
In
Figure 8 and
Figure 9, the temperature variation on the left side of the box’s top plate is 12.3 °C, while the value on the right side is 12.4 °C. The temperature at Point 1 is markedly higher than the temperatures at Measurement Points 2 to 4. This results from the lag effect of concrete temperature, which is the phenomenon where the temperature variation of concrete does not fully synchronize with the variation of the external ambient temperature. According to the comparison of the two figures, the maximum temperatures on the left and right of the top plate are 42.9 °C and 43.3 °C, respectively, with a difference of 0.5 °C. The lowest temperatures are 30.5 °C and 30.9 °C, and the difference is 0.4 °C. As illustrated in
Figure 10, the general trend of the bottom plate temperature of the box is rather steady, with a maximum temperature of 33.3 °C, a minimum temperature of 29.8 °C and a temperature difference of 3.5 °C. In
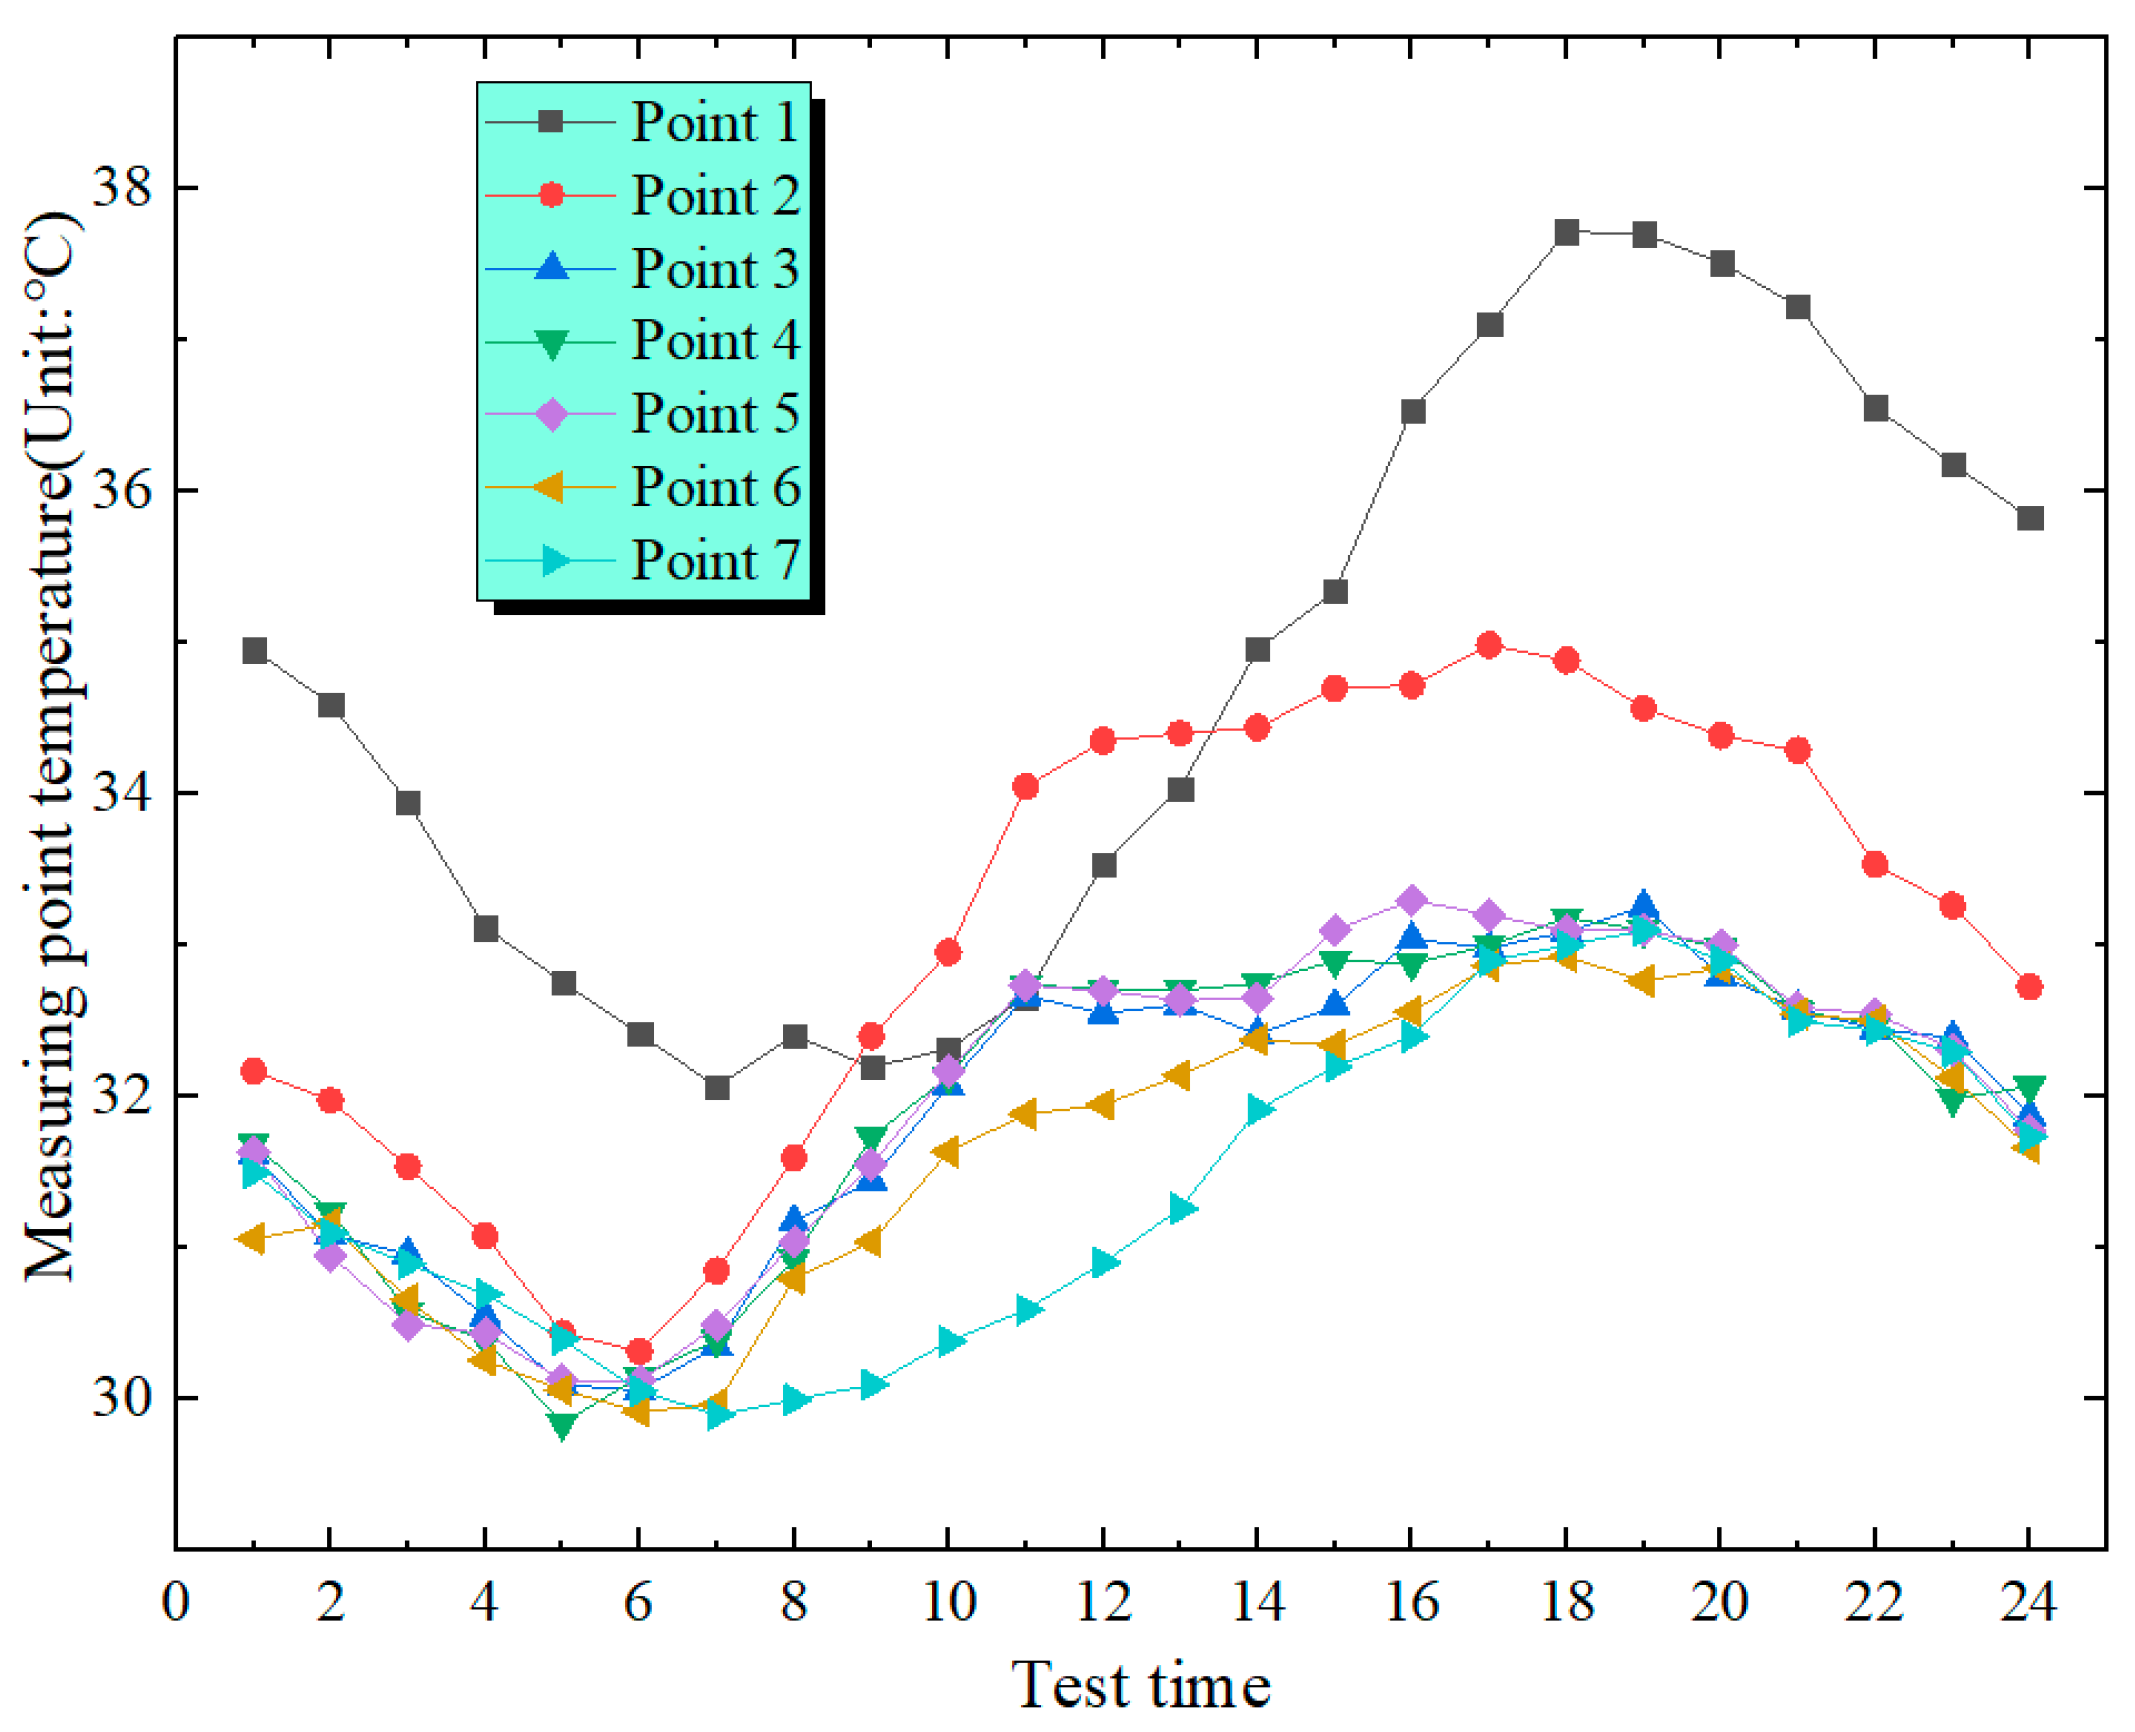
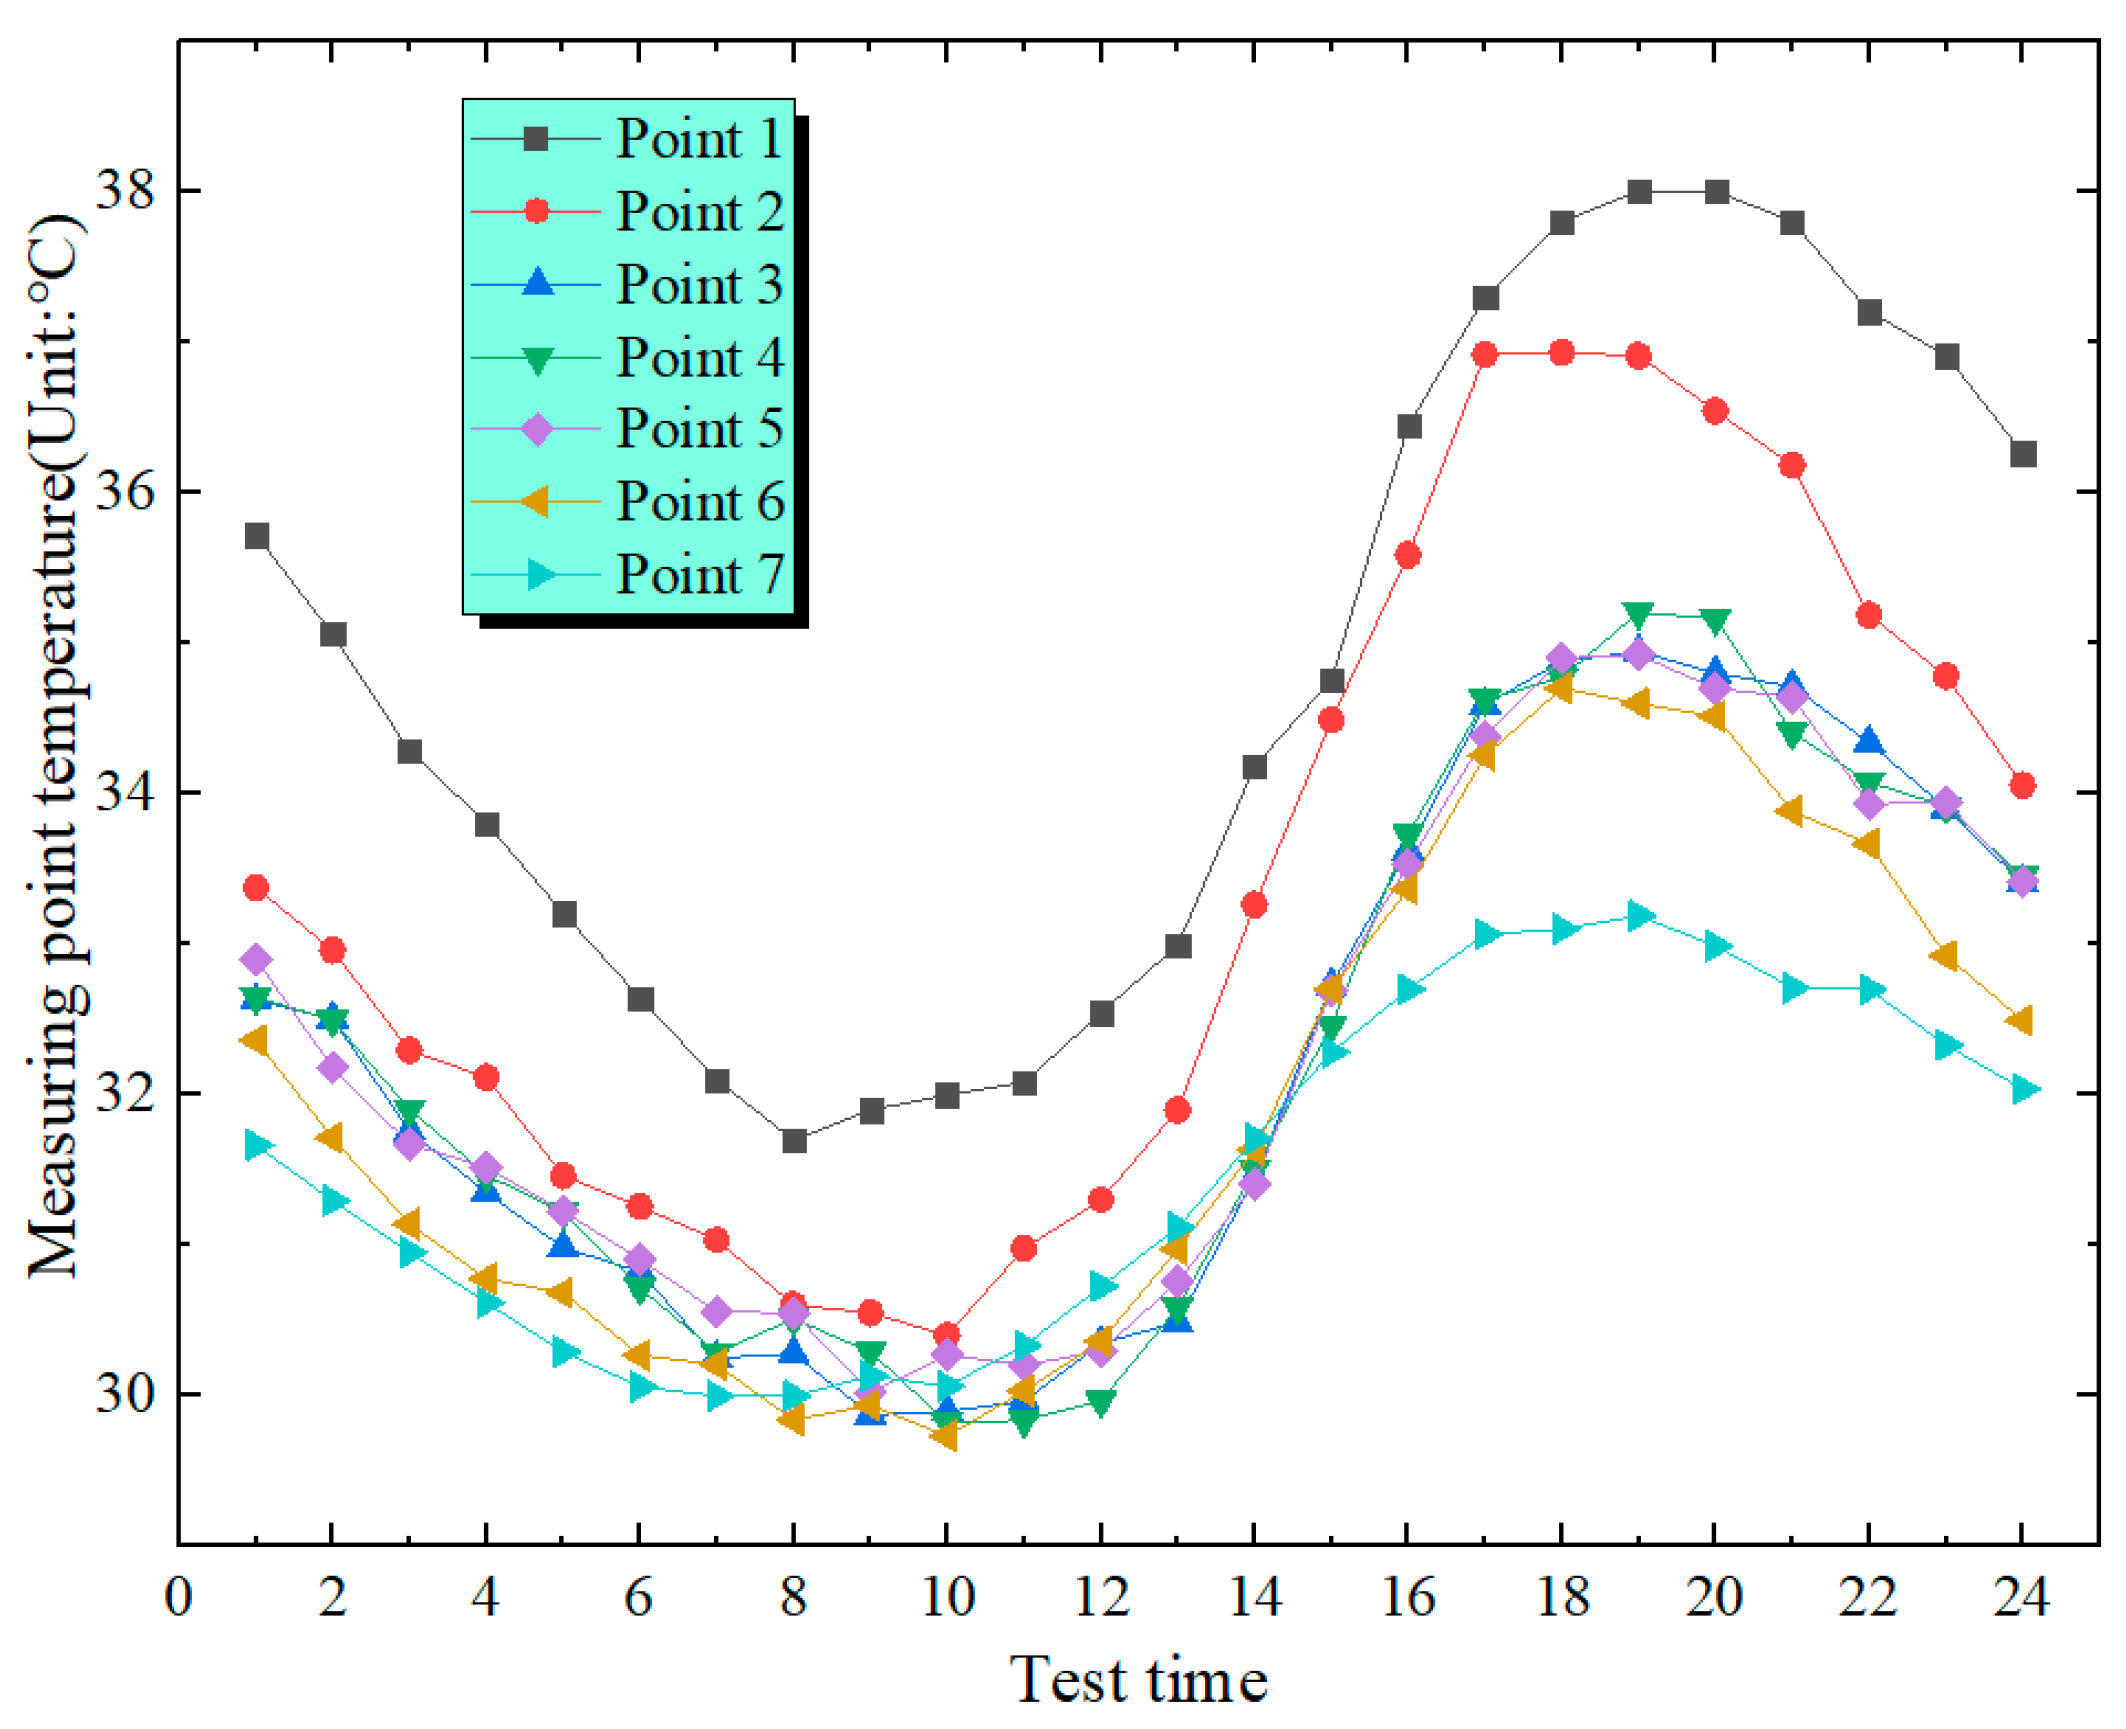
Figure 11 and
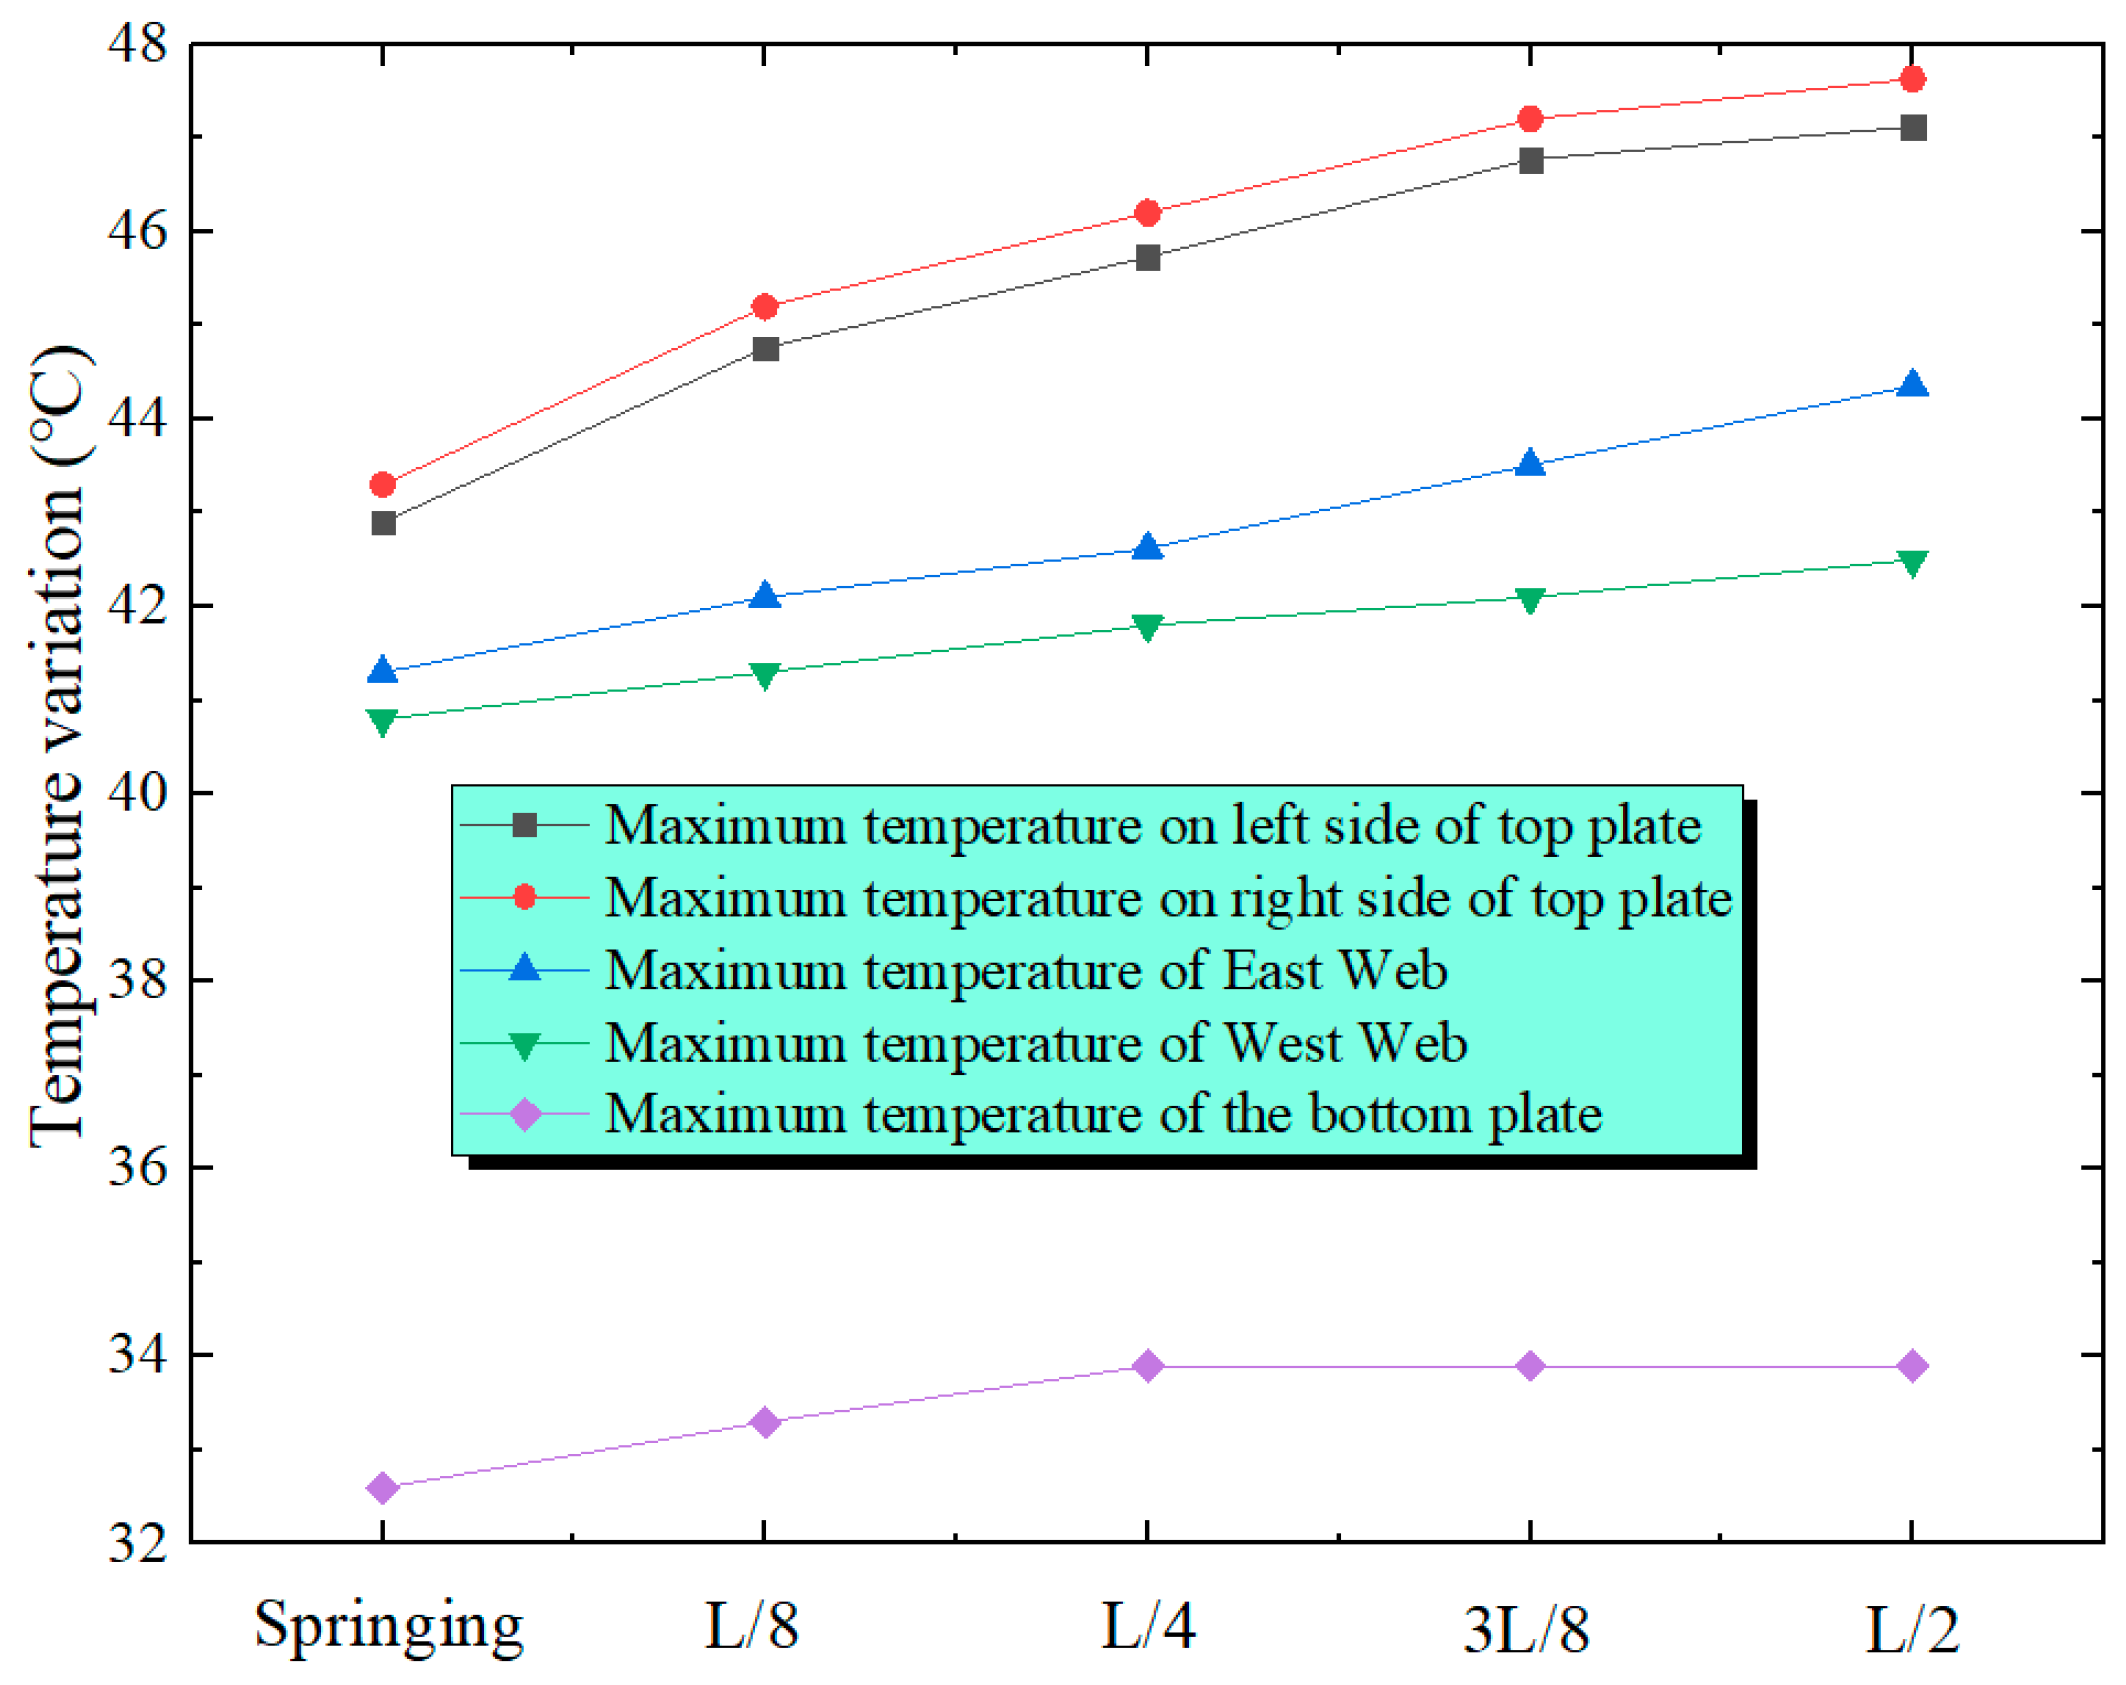
Figure 12, the temperature variation patterns of the temperature measuring points on the two side web plates of the box over time are similar. However, the temperature of the east-side web plate increases more rapidly than that of the west-side web plate, which is related to the fact that the east-side web plate is the first to be irradiated by the sun. The highest temperatures at Measurement Point 1 on the east-side web and the west-side web are 37.7 °C and 38 °C, respectively. The temperatures of the two are close. The maximum temperature variation of the east-side web is 5.6 °C, while that of the west-side web is 6.3 °C. The value of the east web is marginally smaller than that of the west web. The changing rule of the maximum temperatures at the measuring points of the box’s bottom top plate, web plate and top plate as they vary along the arch span is shown in
Figure 13. Along the span from the arch springing to L/2, the maximal temperatures of the measuring points on the bottom plate, web plate and top plate show a gradually increasing pattern of change. The top plate has the greatest temperature differential. The temperature variation between the L/2 point o and the springing is 4.3 °C. The web plate follows with a smaller temperature differential. Specifically, the east-side web plate has a temperature differential of 3.1 °C, and the west-side web plate has 1.7 °C. The bottom plate has the smallest temperature differential, merely 1.3 °C.
4. Vertical Temperature Gradient Model of Arch Rib
Figure 14,
Figure 15,
Figure 16,
Figure 17 and
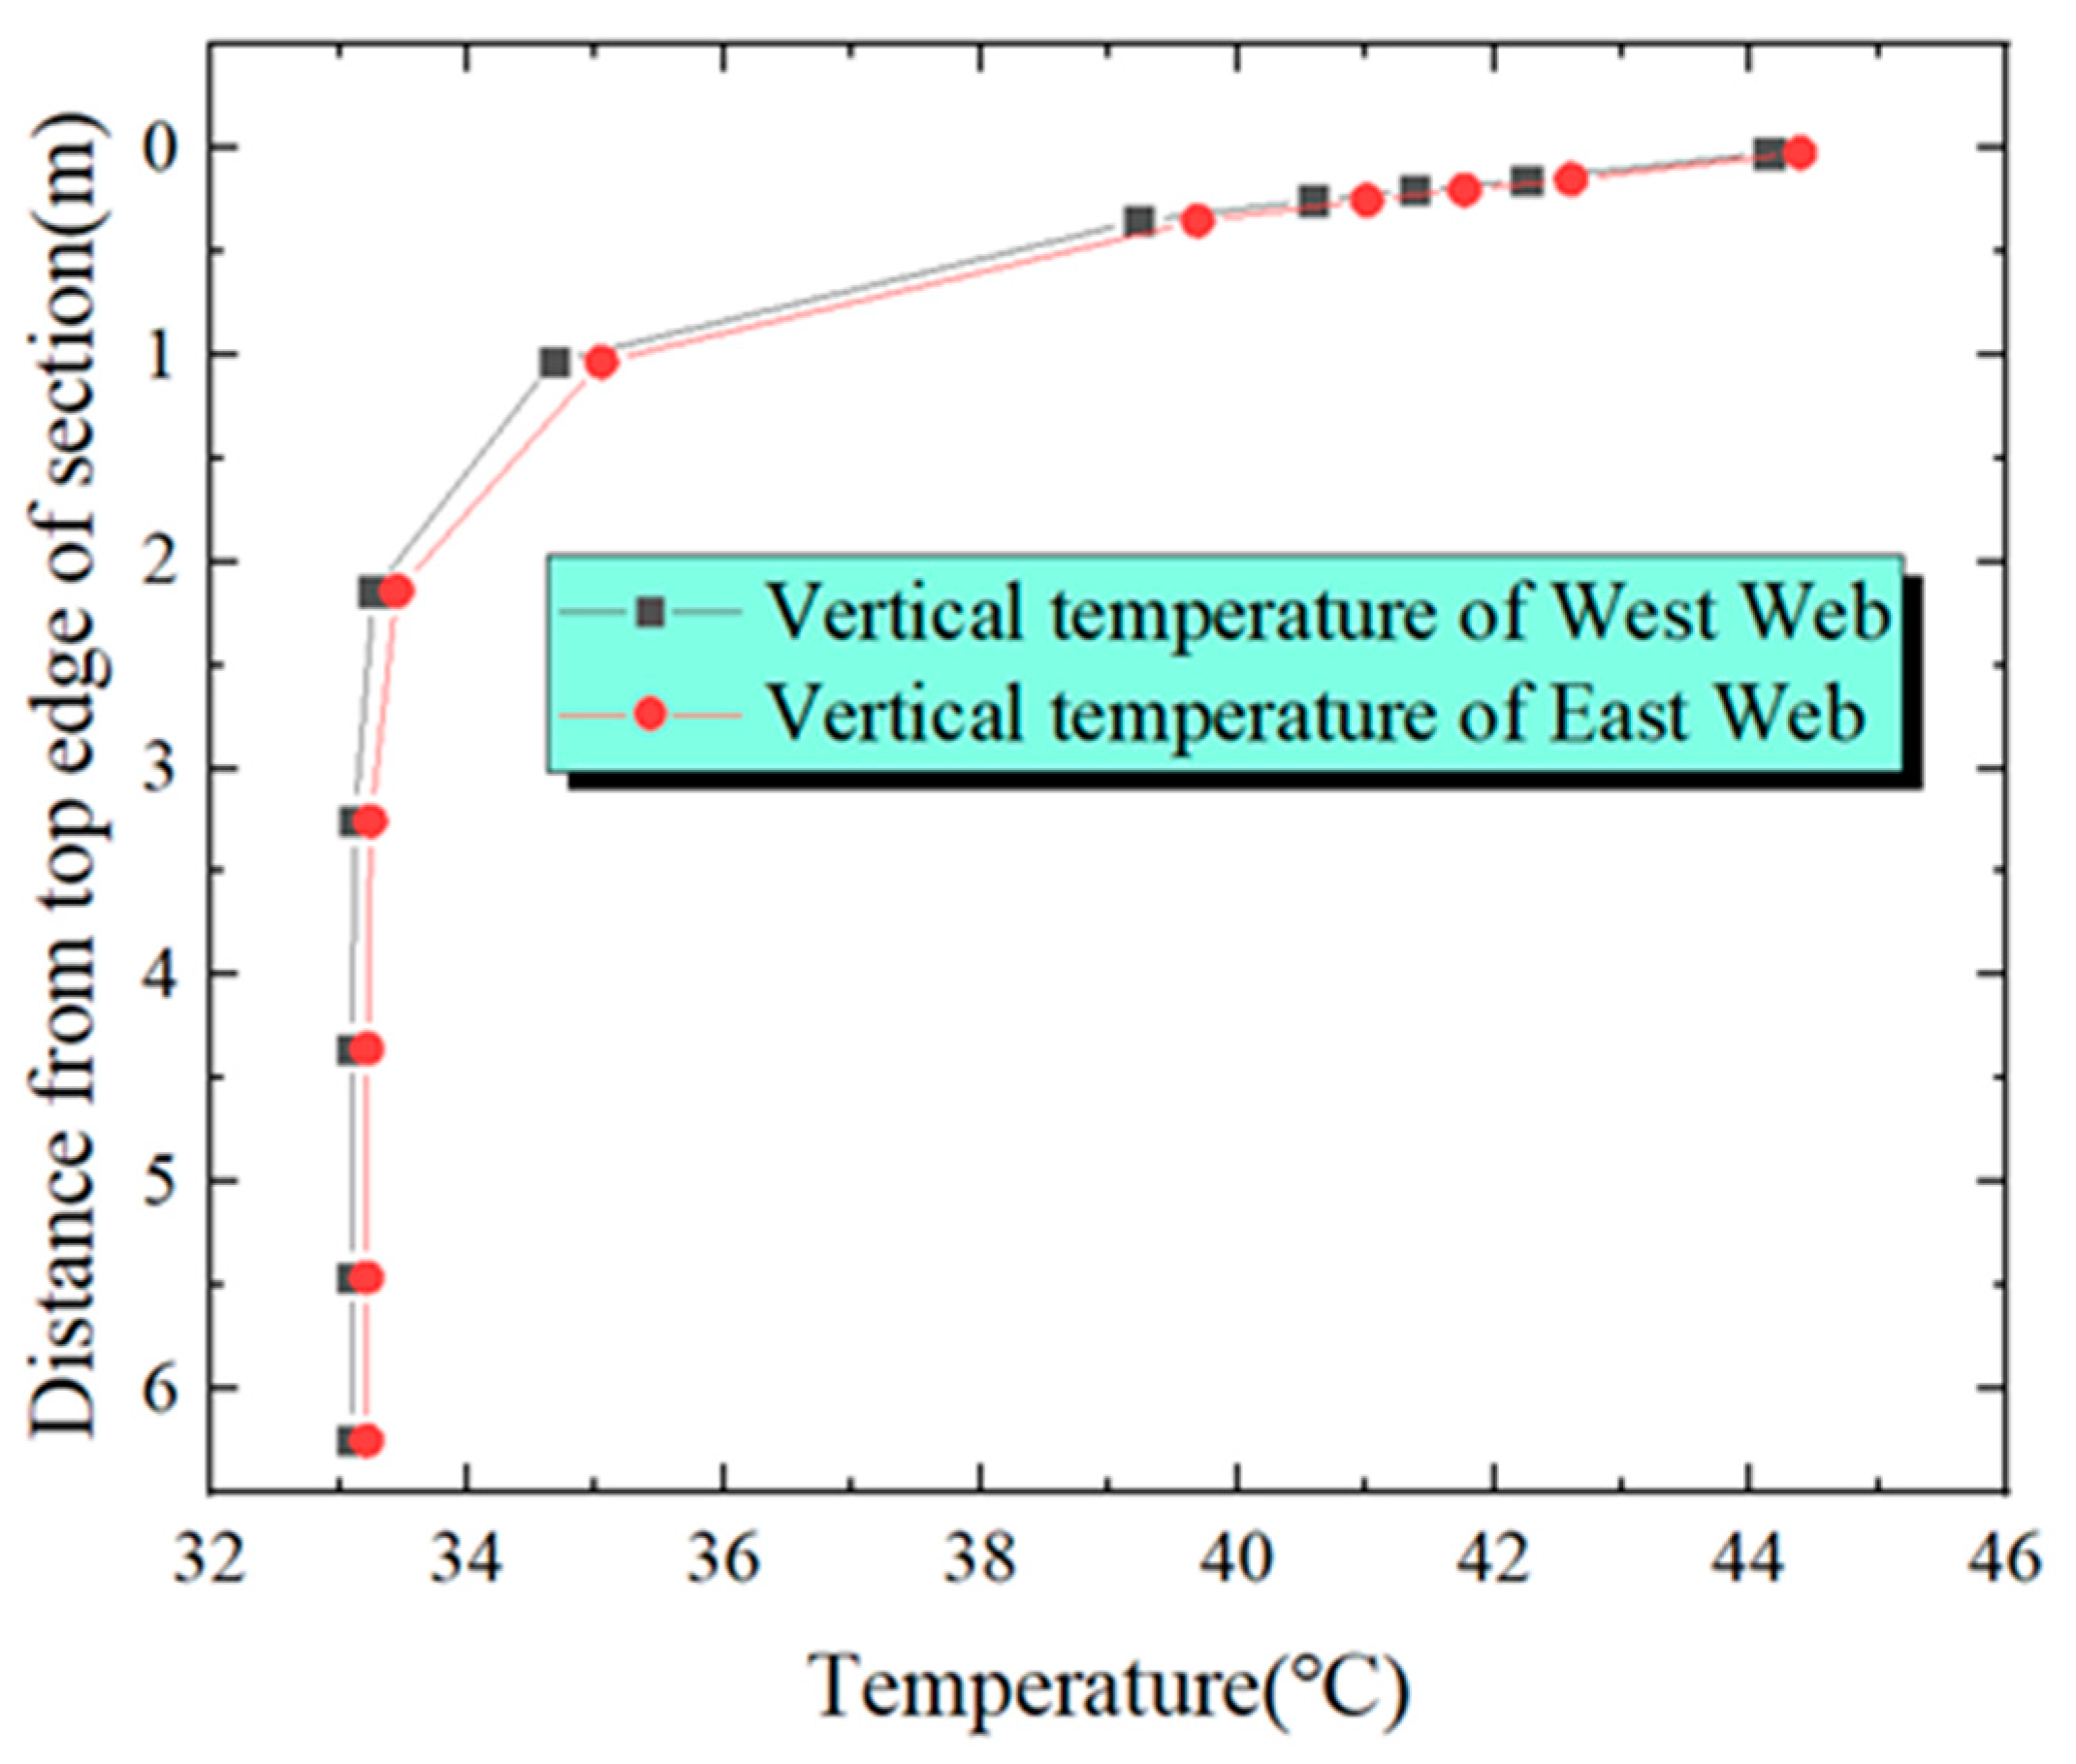
Figure 18 show the temperature gradient distribution of the cross-sections at key positions along the span of the arch rib from the springing to L/2. The temperature distribution refers to the temperature values with the most obvious temperature differences among the measuring points on the top plate and web of the box-shaped cross-section during the high-temperature period. The temperature difference is the temperature difference of each measuring point along the cross-section height at the same time.
From the test data in
Figure 14,
Figure 15,
Figure 16,
Figure 17 and
Figure 18, the vertical temperature distribution of each key section has similar variation rules. Within the range of 0.98 m from the top of the section, the temperature decay is the fastest, and the temperature difference is the largest. And the curve has obvious turning characteristics at 0.98 m from the top of the section. In
Figure 14, at the springing cross-section, the highest temperature and the lowest temperature of the east-side web are 43.3 °C and 30.9 °C, respectively, with a temperature difference of 12.4 °C. The highest temperature and the lowest temperature of the west-side web are 42.9 °C and 30.8 °C, respectively, with a temperature difference of 12.1 °C. In
Figure 15, at the L/8 cross-section, the highest temperature and the lowest temperature of the east-side web are 44.5 °C and 31.3 °C, respectively, with a temperature difference of 13.2 °C. The highest temperature and the lowest temperature of the west-side web are 43.9 °C and 31.1 °C, respectively, with a temperature difference of 12.8 °C. In
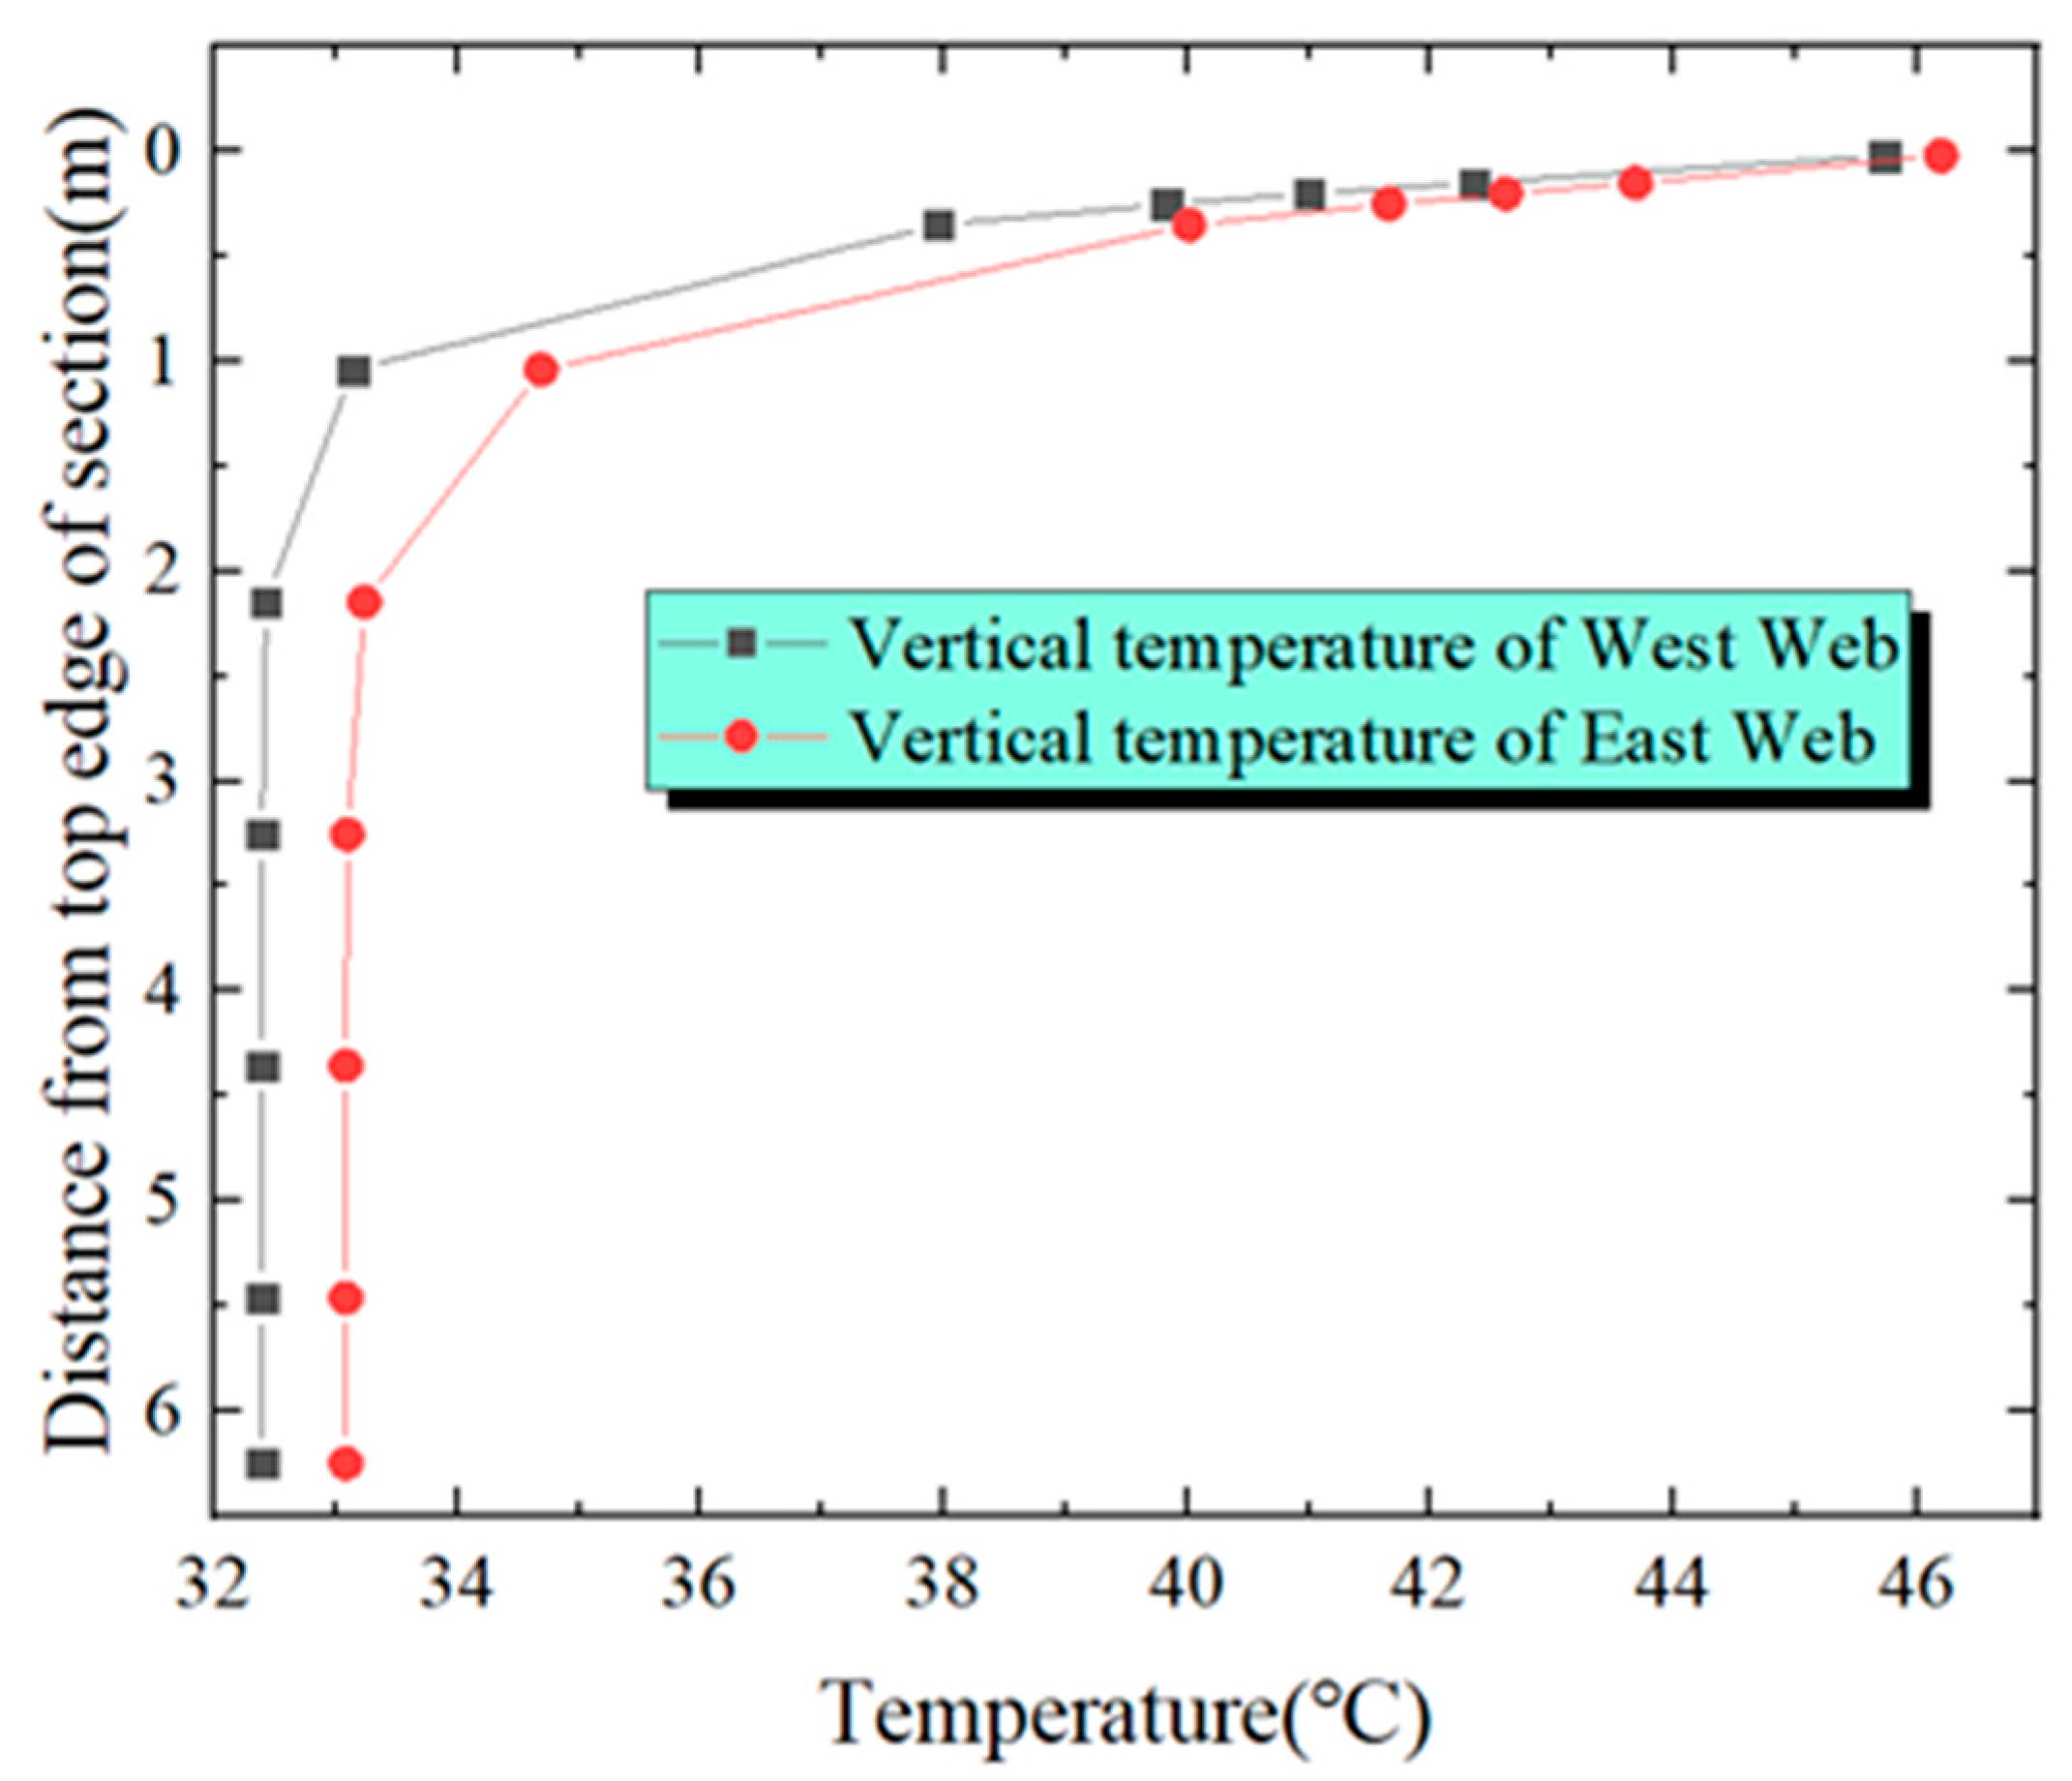
Figure 16, at the cross-section of L/4, the highest temperature and the lowest temperature of the east-side web are 45.6 °C and 31.7 °C, respectively, with a temperature difference of 13.9 °C. The highest temperature and lowest temperature of the west-side web are 45.1 °C and 31.4 °C, respectively, and the temperature variance is 13.7 °C. In
Figure 17, at the 3L/8 cross-section, the highest temperature and the lowest temperature of the east-side web are 46.6 °C and 32.1 °C, respectively, with a temperature difference of 14.5 °C. The highest temperature and the lowest temperature of the west-side web are 46 °C and 31.7 °C, respectively, with a temperature difference of 14.3 °C. In
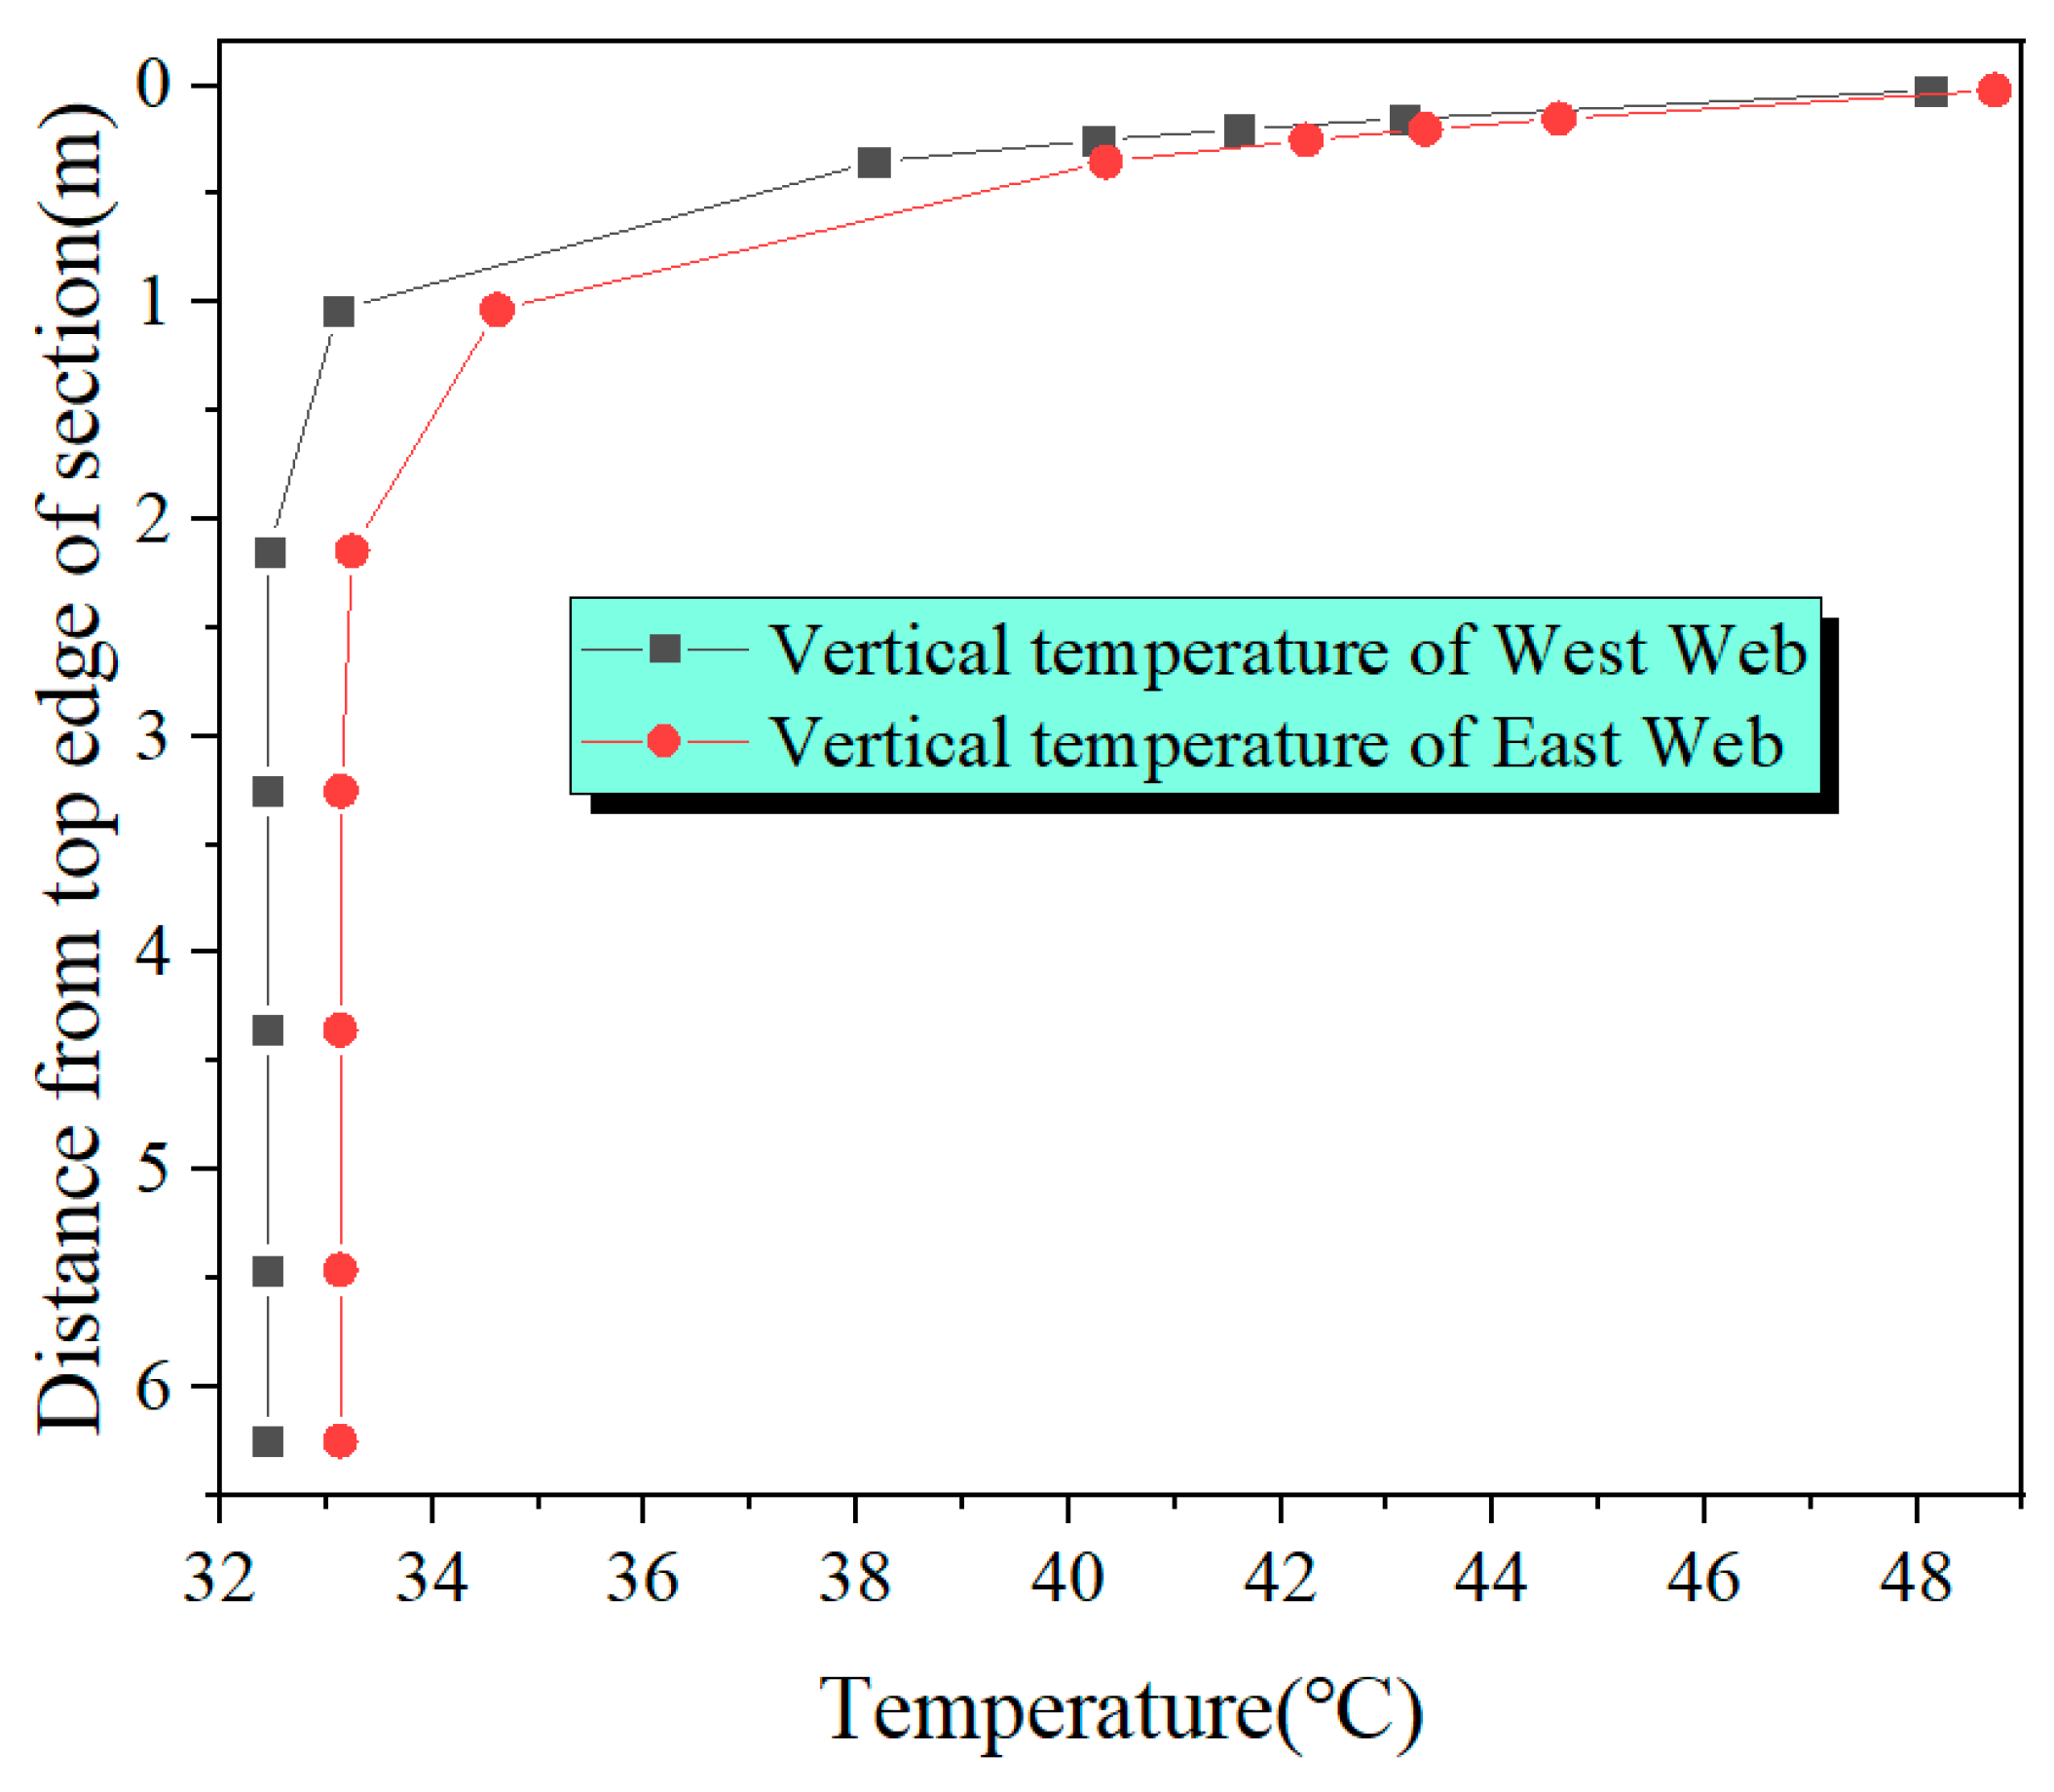
Figure 18, at the L/2 cross-section, the highest temperature and the lowest temperature of the east-side web are 48.7 °C and 32.4 °C, respectively, with a temperature difference of 16.3 °C. The highest temperature and the lowest temperature of the west-side web are 48.1 °C and 32.3 °C, respectively, with a temperature difference of 15.8 °C.
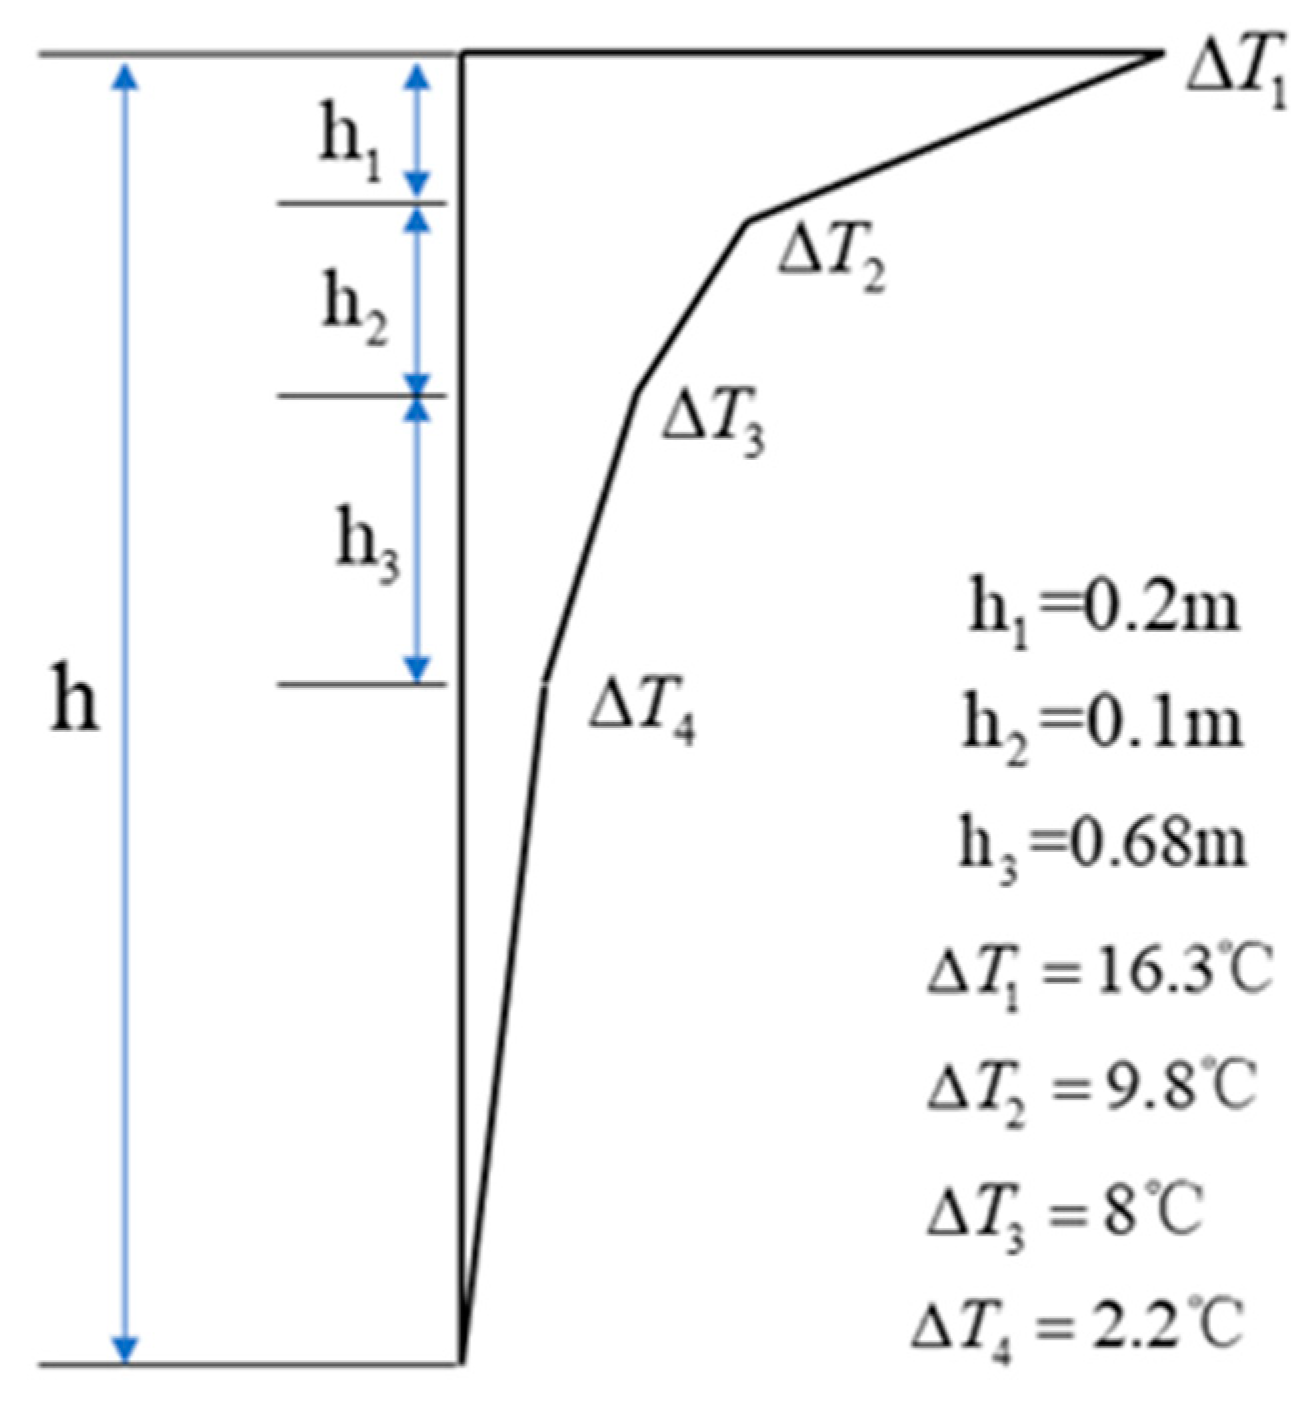
At each key cross-section, the temperature of the east-side web is higher than that of the west-side web, but the difference is not obvious. The main reason is the small width of the section. Secondly, there is no flange plate at the top of the cross-section, so there is nothing to block the sun from shining on the web plate. The vertical temperature differential of the critical cross-sections of the arch rises gradually from the springing to L/2. At the L/2 cross-section, the temperature differential reaches a maximum of 16.3 °C, exceeding that of the springing cross-section by 4.2 °C. For ease of calculation, taking into account a relatively disadvantageous scenario, we utilize the temperature distribution of the section at L/2 of the arch rib to fit the temperature gradient curve. Consequently, a four-fold nonlinear temperature gradient model is derived, as depicted in
Figure 19. The temperature difference is large, within 0.2 m and 0.1 m from the top edge of the section, and the curve shows obvious turning characteristics. The four temperature base points away from the top edge of the section are 0 m, 0.2 m, 0.3 m and 0.98 m, respectively, corresponding to 16.3 °C, 9.8 °C, 8 °C and 2.2 °C, respectively.
The comparison between the proposed temperature gradient pattern and the specification is depicted in
Figure 20. Among them, the specification adopts the General Specification for Design of Highway Bridges and Culverts (JTG D60-2015) [
31] in China. The specification [
31] adopts a double-fold line, with a temperature distribution height of 0.4 m and a temperature difference of 20 °C.
The temperature model used in this paper is a four-fold line. The height range where the temperature change is distributed is mainly concentrated within 1 m, with a temperature difference of 16.3 °C. Compared with the temperature gradient distribution range specified in the specification, the vertical temperature gradient has a wider distribution range in the cross-section height, and the temperature varies more quickly along the cross-section height.
5. Structural Response Under Different Temperature Modes
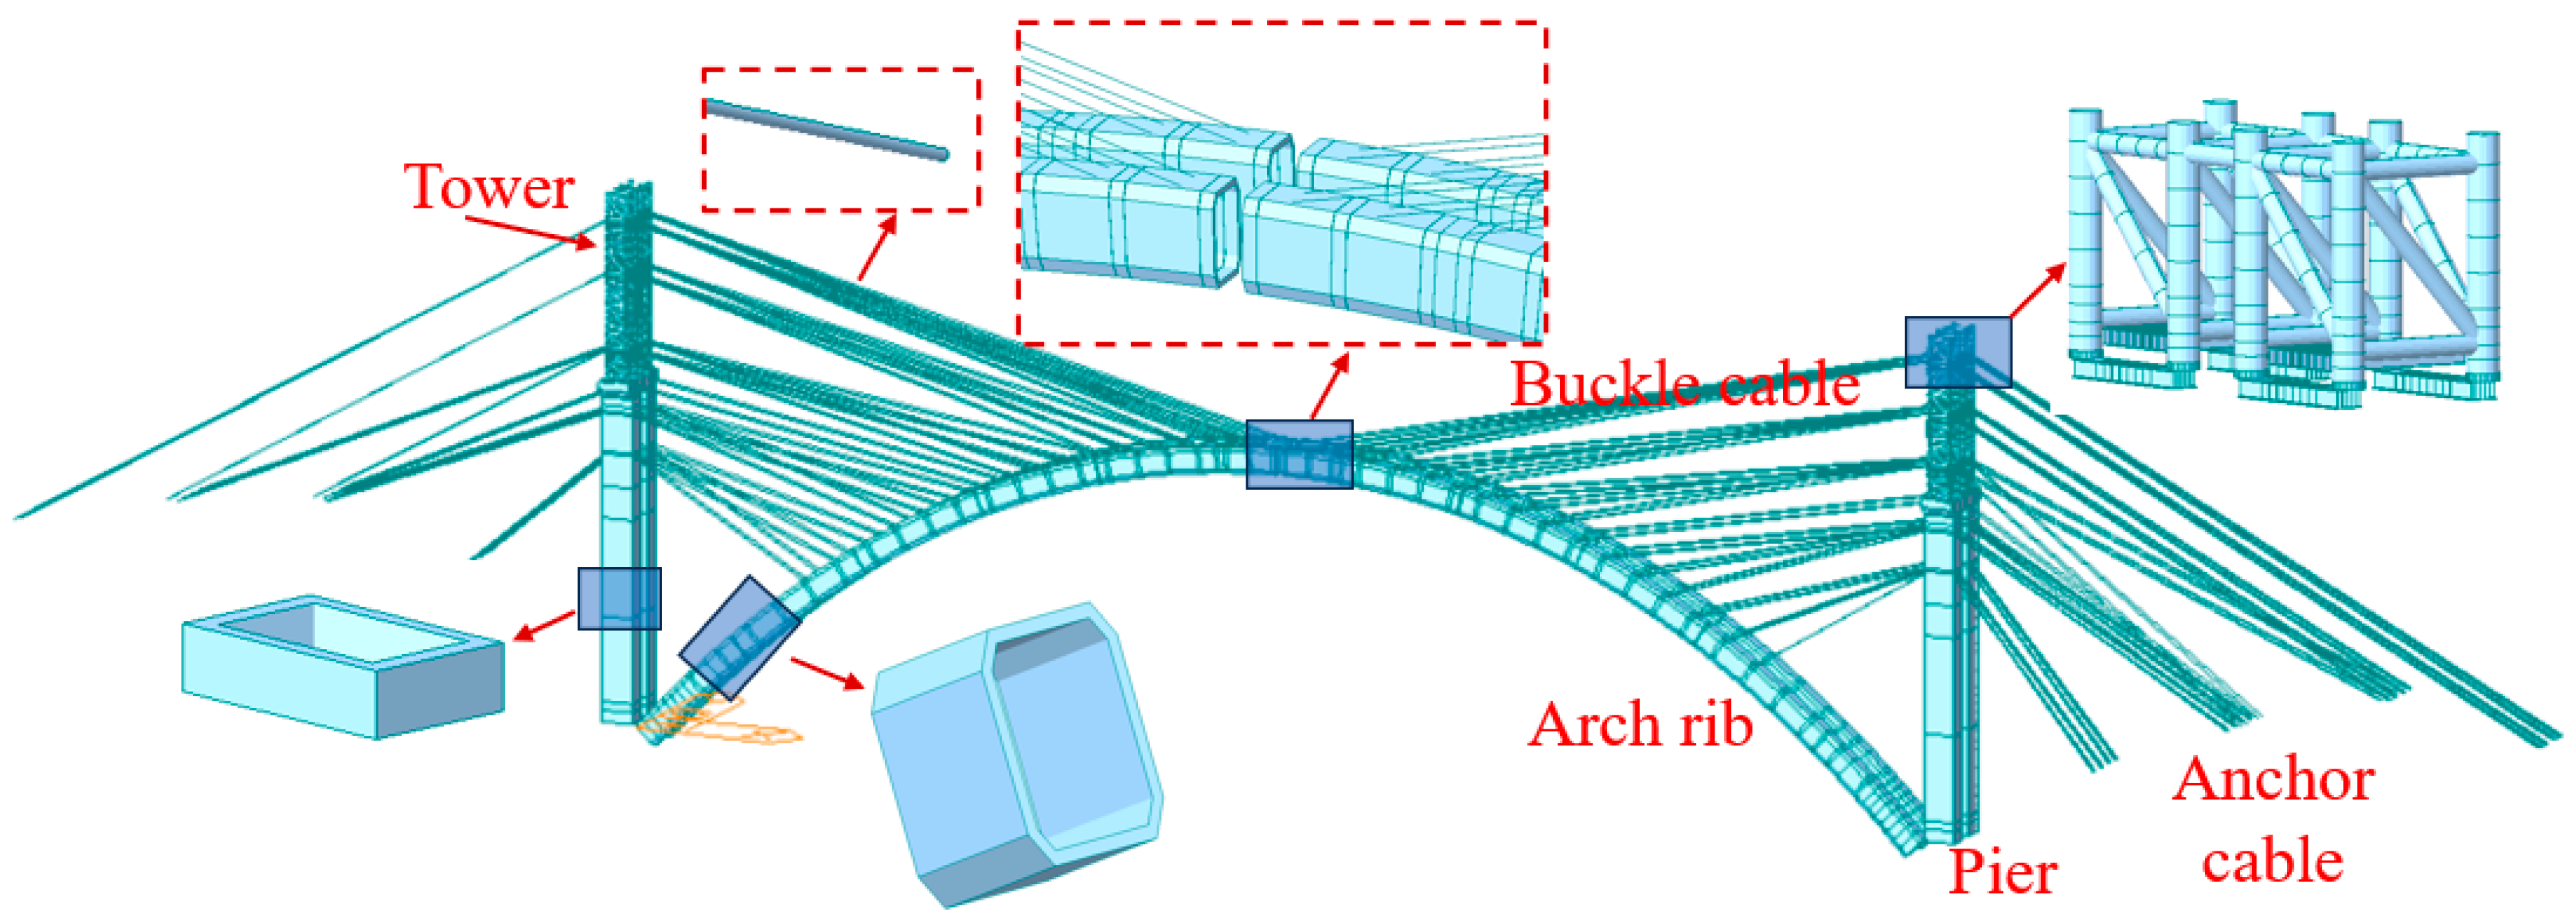
When the cantilever casting technique is used for the construction of a concrete arch bridge, the arch rib is supported by cables. The arch’s weight is transferred to the tower and pier through the cable and, finally, to the earth. The arch rib is equivalent to a cantilever curved beam during cantilever casting and is supported by buckle cables and anchor cables. As depicted in
Figure 21, stress on the arch rib is most disadvantageous when it is in the maximal cantilever condition. A simulation model of the arch rib construction process is established by midas Civil [
32,
33,
34,
35]. Beam elements are used to simulate the arch rib, tower and pier. The stay cables are modeled using truss elements, which are only capable of withstanding tensile forces, and nodal loads are used for the hanging basket. Fixed supports are adopted at the bottom of the bridge pier to simulate the constraints of the ground on the bridge pier. The connection between the bridge pier and the tower is a rigid connection. Rigid connections are also used between the cables and the tower, as well as between the cables and the arch rib. There are 2392 beam elements, 396 tension-only truss elements, and 2982 nodes in the model. The simulation model is depicted in
Figure 22.
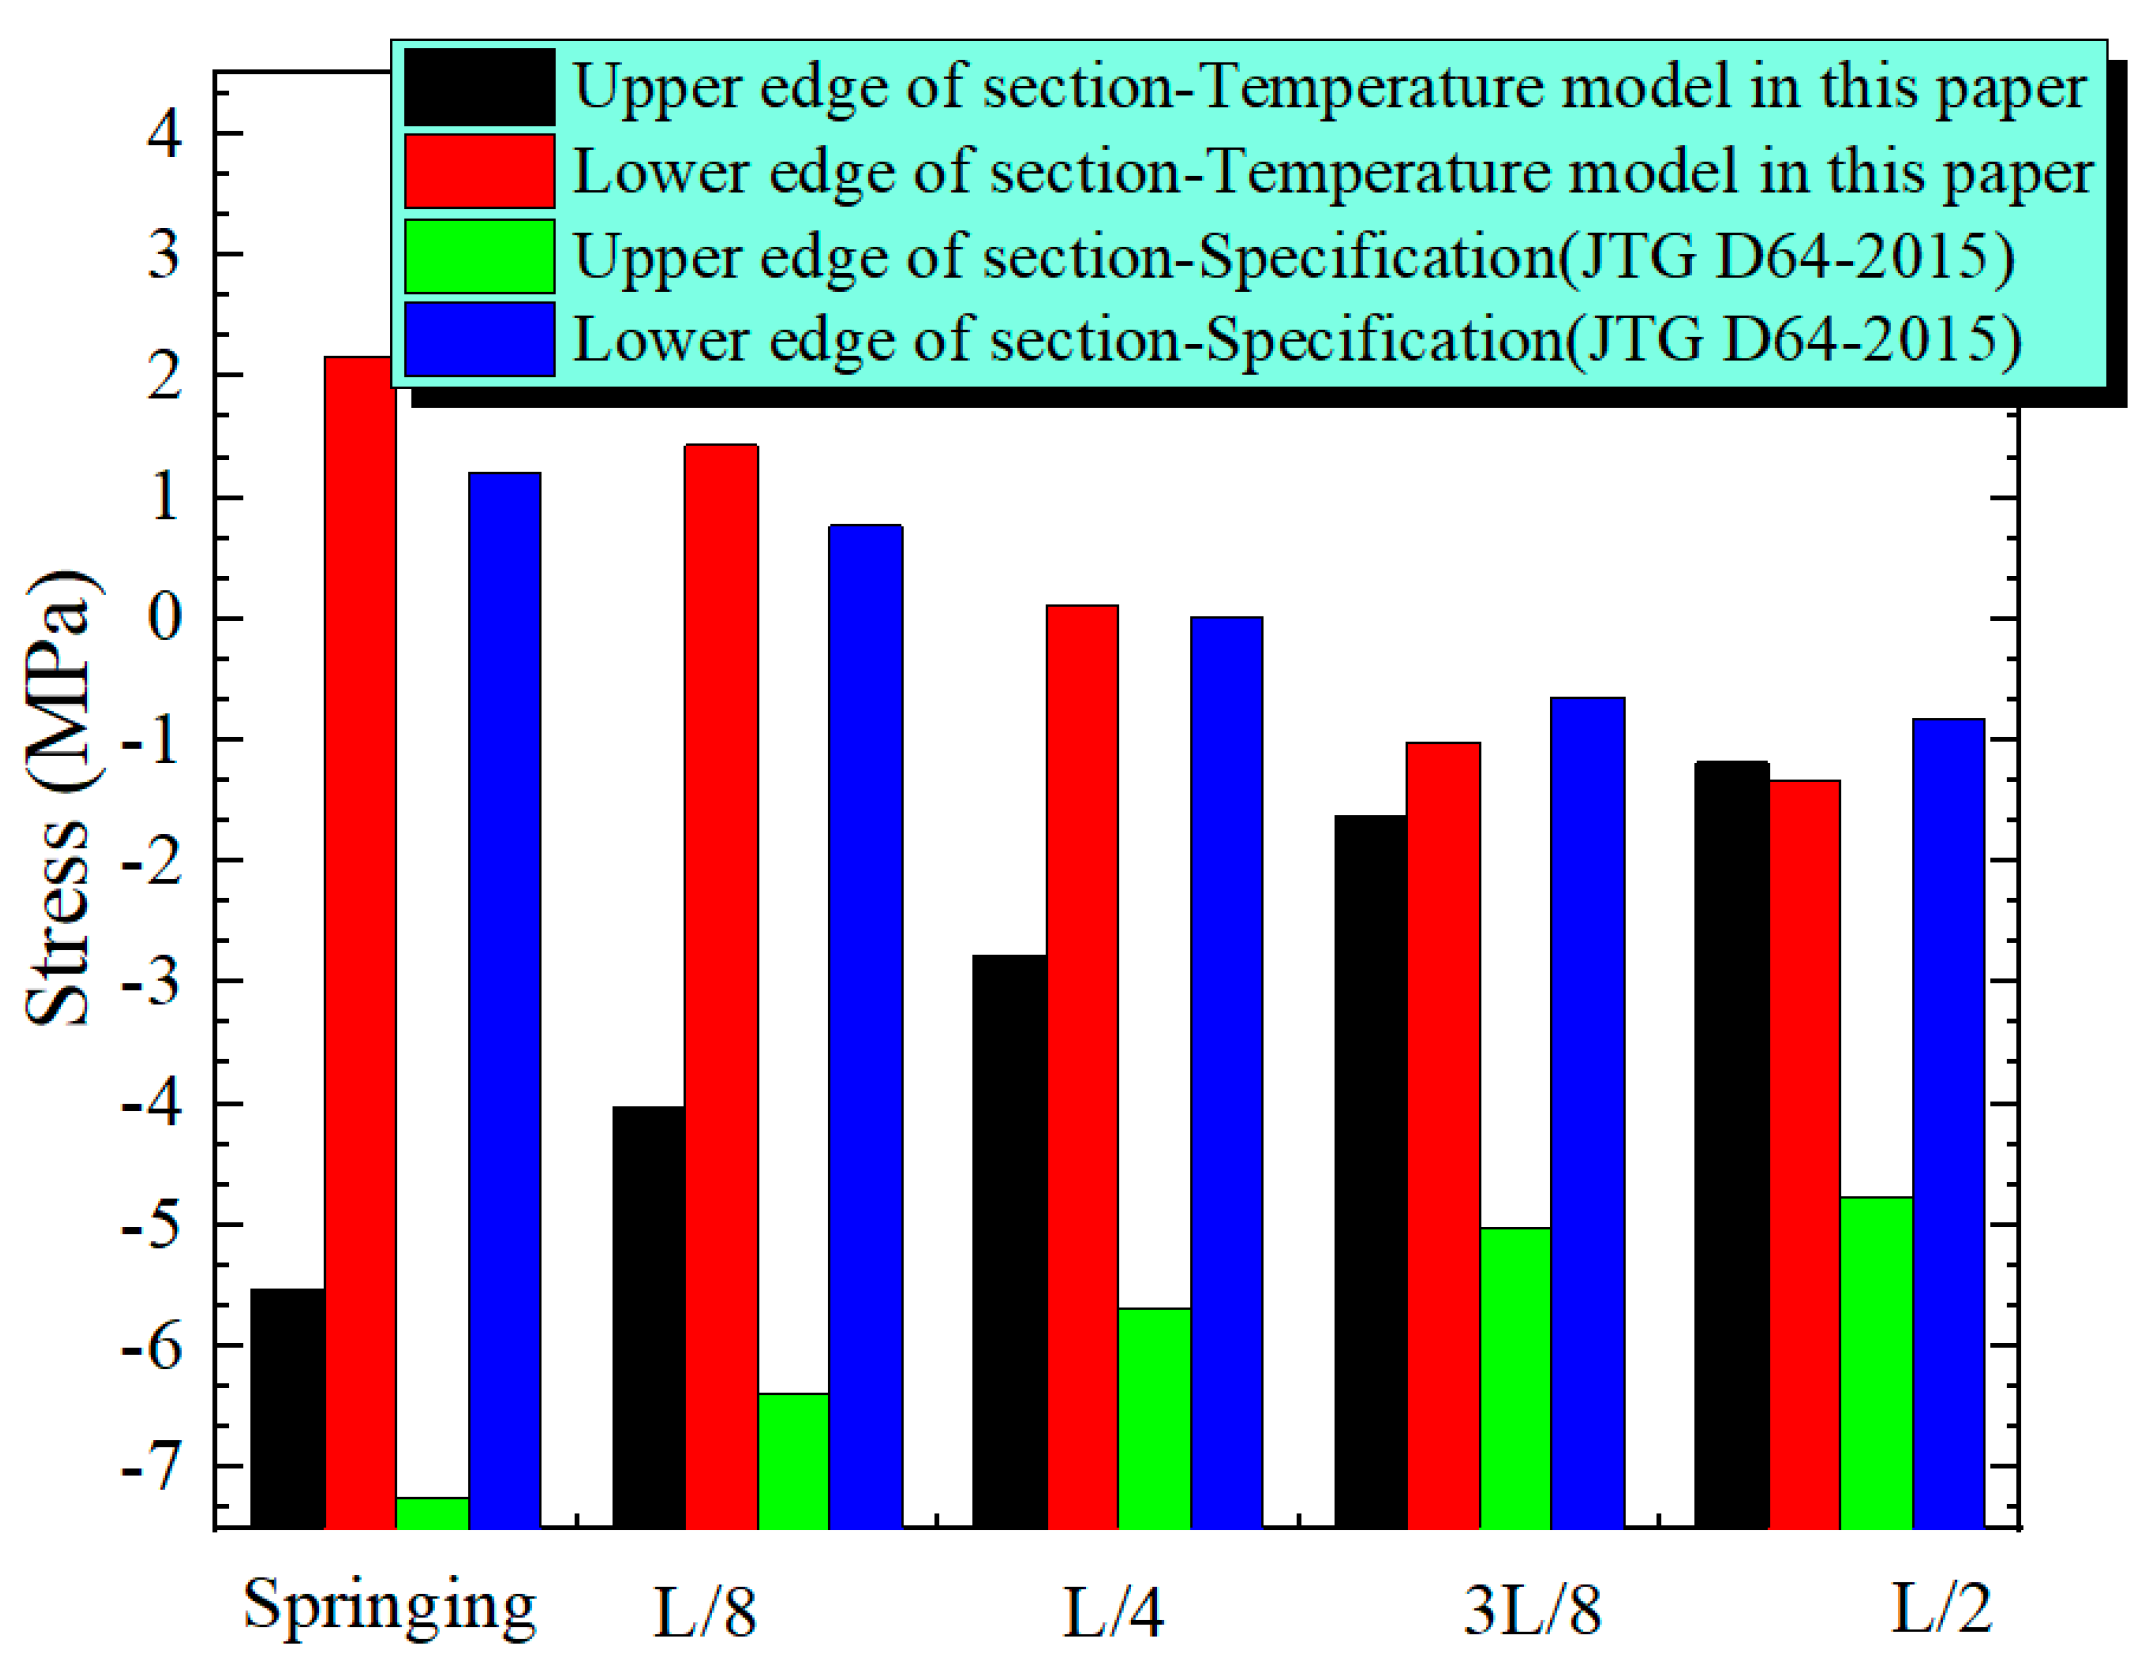
According to the maximal cantilever condition of the arch rib, the influence of the vertical temperature gradient mode in this paper and the temperature mode in the specification on the structural stress is compared. The comparison of the deformation and stress of the arch is described in
Figure 23 and
Figure 24. In
Figure 23, the two temperature modes have similar influencing roles on the vertical deformation of the arch. Compared with the temperature pattern in the specification, between the springing and L/4, the upward deformation of the arch under the temperature mode in this paper is larger. Between L/4 and L/2 of the arch rib, the downward deformation of the arch rib under the temperature mode in this paper is large. When the arch rib is L/2, the difference in the arch rib’s deformation is the greatest. The deformation at L/2 under the temperature mode of this paper and the specification is 7.1 cm and 4.1 cm, respectively. The deformation of the arch rib under the temperature mode in this paper is 3 cm larger, since the arch rib is equivalent to a cantilever curved beam during cantilever casting. Due to the vertical temperature gradient, the upper part of the arch rib is subjected to tension, and the lower part is subjected to compression. As a result, compressive stress and tensile stress are produced in these two parts, respectively. In
Figure 24, the influencing rules of the two temperature modes on the stress of the arch rib are essentially alike, yet there exist disparities in the influencing extents on the tensile and compressive stresses of the arch rib. Between the springing and L/4, the temperature mode in this paper makes the arch rib generate greater tensile stress. Between L/4 and L/2, the effect of the temperature mode presented in this paper on the tensile stress of the arch is smaller than that of the temperature mode specified in the specification. The influence of temperature mode in this paper on the compressive stress of the arch is smaller than that of the temperature mode in the specification. Under the temperature mode in this paper and the temperature mode in the specification, the maximal compressive stresses on the top of the arch rib cross-section are −5.53 MPa and −7.26 MPa, respectively. The maximal tensile stresses in the lower part of the arch rib cross-section are 2.17 MPa and 1.22 MPa, respectively. Even though the temperature gradient value presented in this paper is less than that of the code, the temperature gradient has a wider distribution range along the height of the cross-section, which makes the deformation and tensile stress of the arch rib larger. Therefore, the temperature gradient mode put forward in this paper has a more adverse impact on the stress condition of the arch rib.
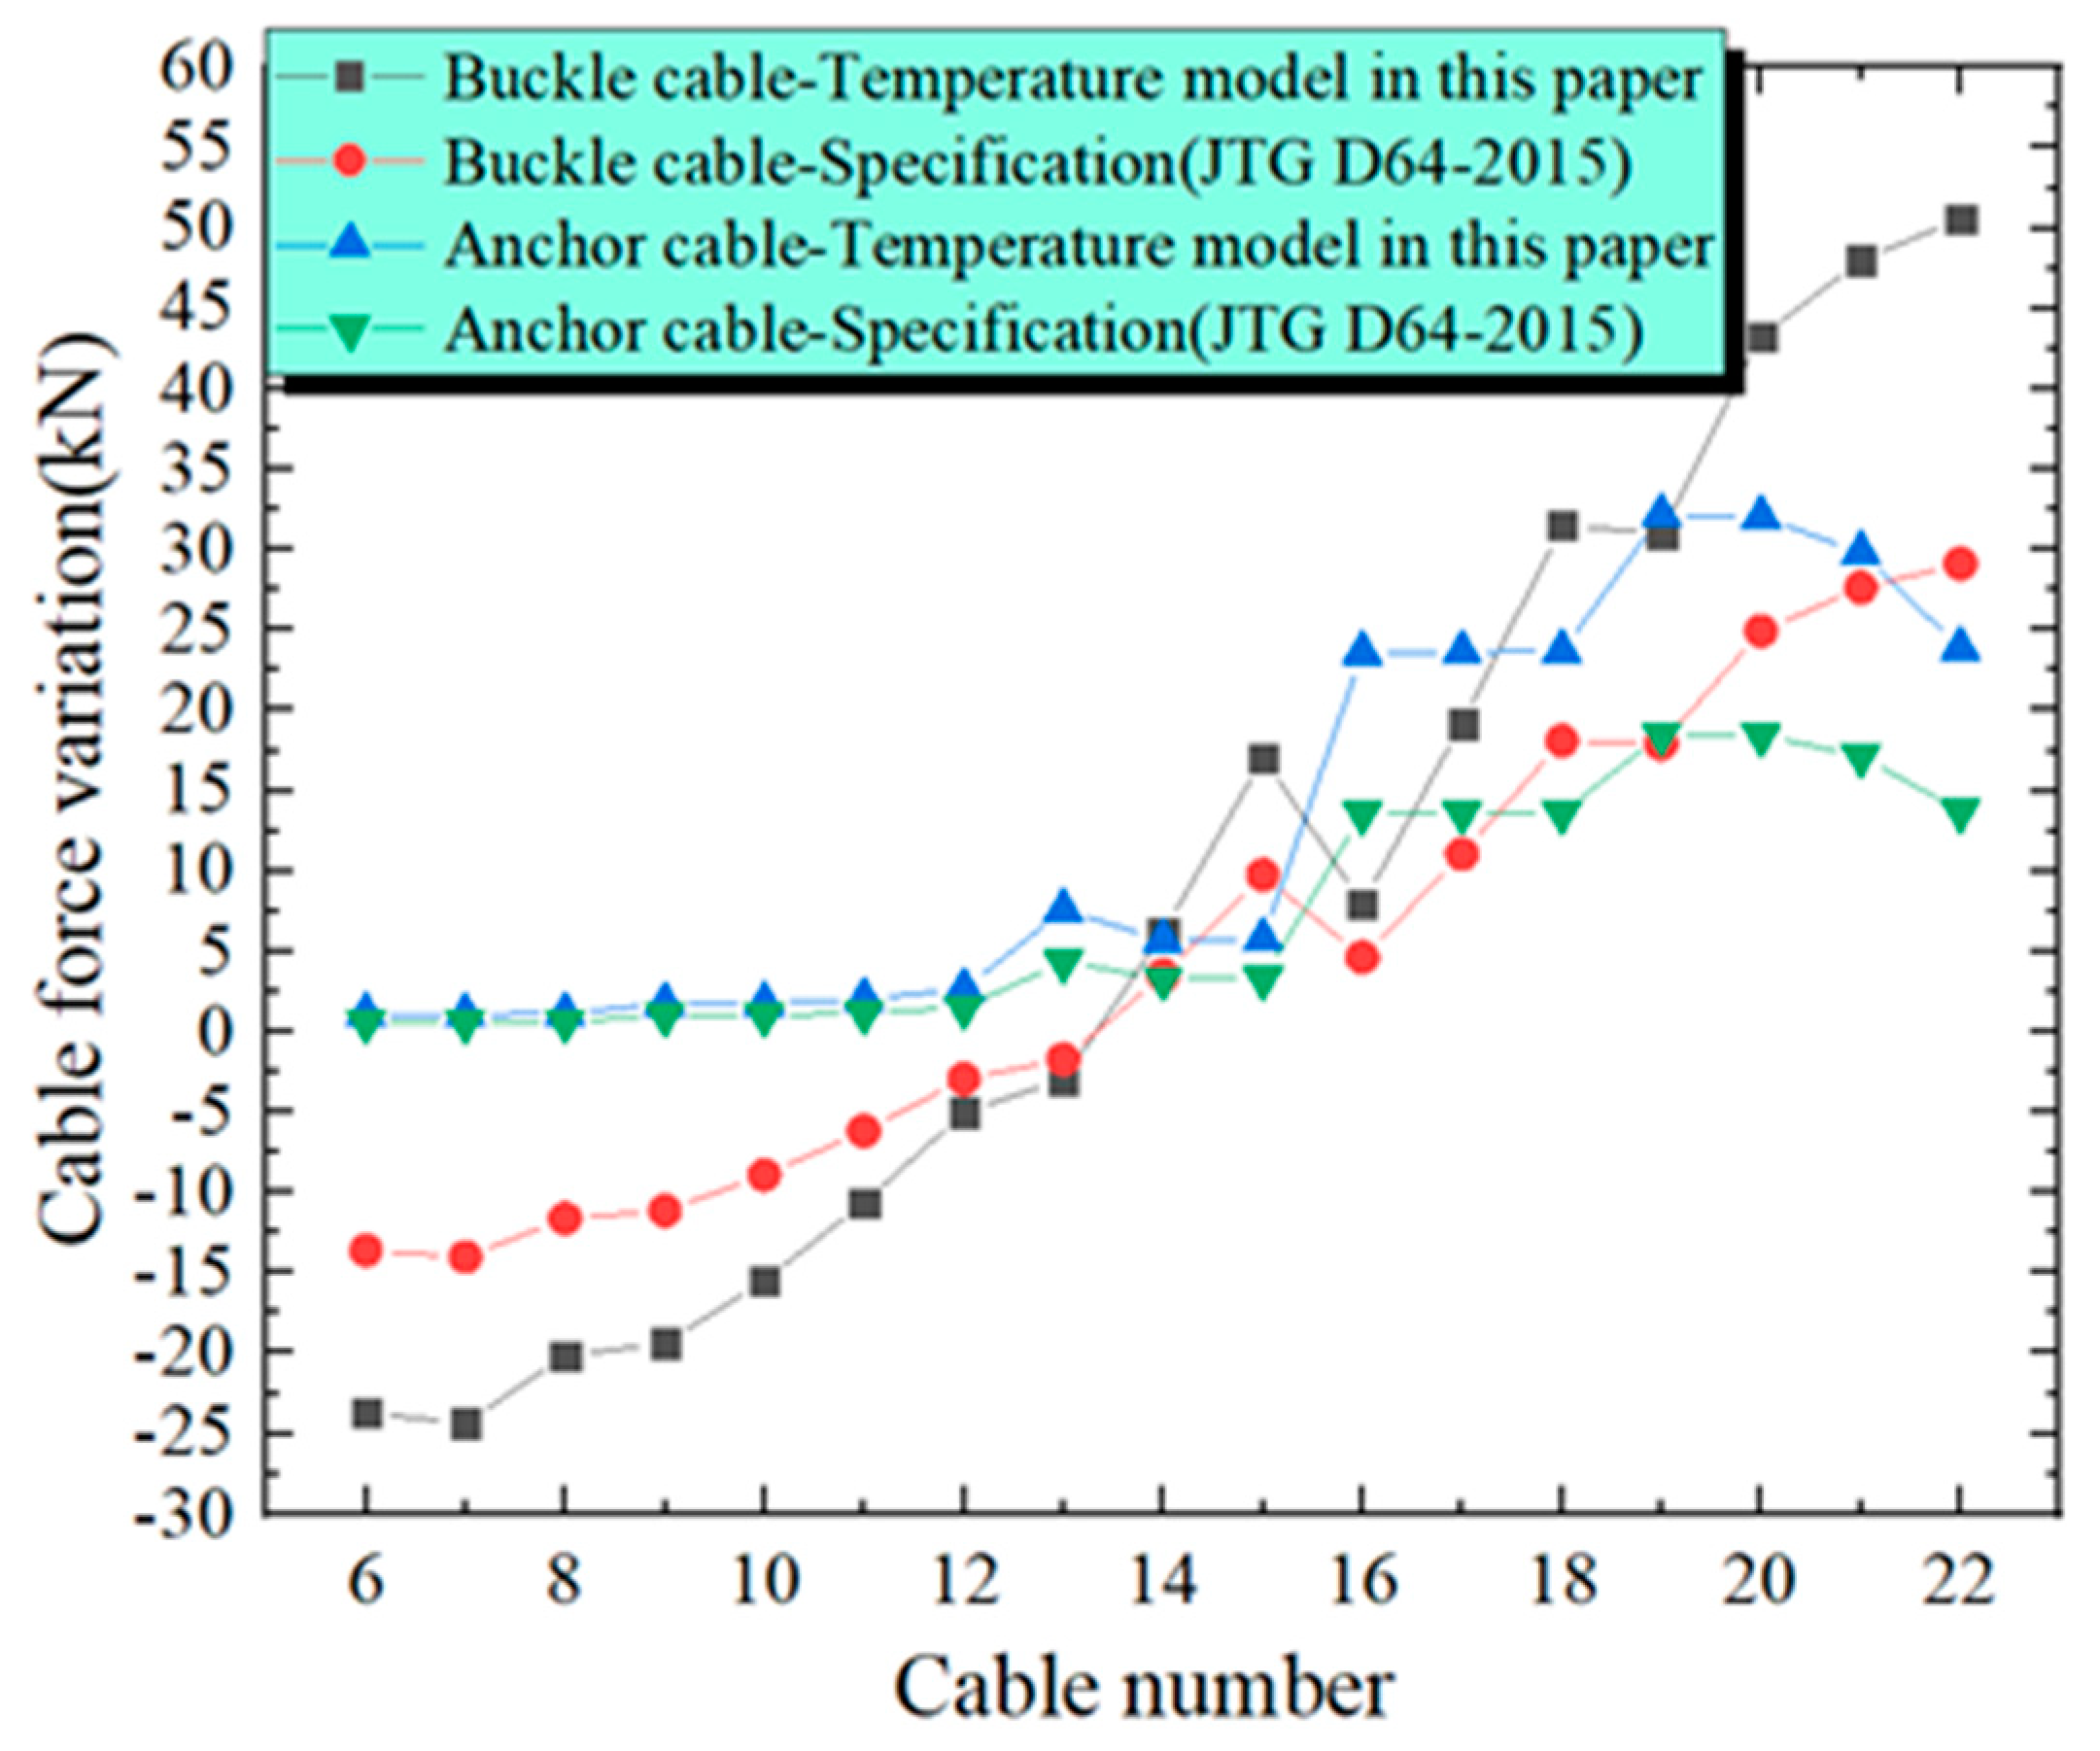
The impacts of various temperature gradient modes on the cable forces and the deformations of the tower are shown in
Figure 25 and
Figure 26. The arch will deform under the action of vertical temperature, leading to the extension or shortening of the cable, which will affect the cable force. As the arch is in the maximal cantilever condition, the cable numbers are 6 to 22. During the construction process of the arch, to guarantee that the structural stress remains within the permitted range, No. 1 to No. 5 cables were removed. In
Figure 25, the influence of the two temperature gradient modes on the force of the buckle cable and the anchor cable is similar. However, the influence of temperature mode in this paper on the cable force is more significant than that in the specification. The maximum increase and decrease of cable force caused by the temperature mode in the specification are 29.1 kN and −13.6 kN, respectively. The maximum increase and decrease of cable force caused by the temperature mode in this paper are 50.6 kN and −23.7 kN, respectively, and the deviation is 21.5 kN and 10.1 kN, respectively. In
Figure 26, the two temperature gradient patterns have distinct impacts on the horizontal deformation of the pier and tower are also different, yet the difference in values is minor. The horizontal deformation occurring at the top of the tower caused by the temperature mode in this paper is 7.6 mm larger than that caused by the temperature mode in the specification.
6. Conclusions
(1) According to the test temperature data, the temperature gradient of the box’s top plate is the largest, that of the web plate is the second largest, and that of the bottom plate is the smallest. Along the span from the springing to L/2, the maximal temperature of the top plate, web plate and bottom plate measurement points showed a gradual increase. The top plate has the greatest temperature differential. The temperature variation between the L/2 point o and the springing is 4.3 °C. The web plate follows with a smaller temperature differential. Specifically, the east-side web plate has a temperature differential of 3.1 °C, and the west-side web plate has a differential of 1.7 °C. The bottom plate has the smallest temperature differential, merely 1.3 °C.
(2) The vertical temperature difference of the critical sections of the arch gradually increases from the arch springing to L/2. The maximal temperature difference at the section of L/2 is 16.3 °C, which is 4.2 °C larger than that of the springing. The temperature gradient of the box section without the flange plate arch rib proposed in this paper is a four-fold nonlinear model. The four temperature base points from the top edge of the section are 0 m, 0.2 m, 0.3 m and 0.98 m, respectively, and the corresponding four temperature base points are 16.3 °C, 9.8 °C, 8 °C and 2.2 °C, respectively. Compared with the temperature gradient distribution range specified in the specification, the vertical temperature gradient proposed has a wider distribution range in the cross-section height, and the temperature varies more quickly along the cross-section height. The temperature model proposed in this paper can provide a theoretical basis for the temperature calculation of box-shaped cross-section arch ribs without flange plates and can offer a reference for the selection of temperature models in the design and construction of this type of arch bridge.
(3) In comparison with the temperature gradient model specified in the specification, the temperature gradient model proposed in this paper has more adverse effects on the structural mechanical behavior. The deformation of the arch rib under the temperature mode in this paper is 3 cm larger. Under the temperature mode in this paper and the temperature mode in the specification, the maximal compressive stresses on the top of the arch rib cross-section are −5.53 MPa and −7.26 MPa, respectively. The maximal tensile stresses in the lower part of the arch rib cross-section are 2.17 MPa and 1.22 MPa, respectively. The influence of temperature mode in this paper on the cable force is more significant than that in the specification. The maximum increase and decrease in cable force caused by the temperature mode in the specification are 29.1 kN and −13.6 kN, respectively. The maximum increase and decrease in cable force caused by the temperature mode in this paper are 50.6 kN and −23.7 kN, respectively, and the deviation is 21.5 kN and 10.1 kN, respectively. Therefore, to ensure the structural safety of long-span concrete arch bridges, apart from considering the temperature effect during the design stage, corresponding concrete materials can be developed according to the temperature distribution model of the arch ribs to reduce the temperature gradient effect. Alternatively, protective materials for the concrete surface can be developed to mitigate the impact of sunlight on the temperature of the arch structure.

