Article

The Effect of Substrate Roughness and Impact Angle on Droplet Spreading in Spraying

1
Faculty of Printing, Packaging Engineering and Digital Media Technology, Xi’an University of Technology, Xi’an 710054, China
2
Shanghai Putailai New Energy Technology Co., Ltd., Shanghai 201315, China
3
KATOP Automation Co., Ltd., Shenzhen 518118, China
*
Authors to whom correspondence should be addressed.
Coatings 2025, 15(2), 242; https://doi.org/10.3390/coatings15020242
Submission received: 30 December 2024 / Revised: 26 January 2025 / Accepted: 17 February 2025 / Published: 18 February 2025

Abstract

:
The effects of substrate roughness and impact angle on the spreading behavior of Polyvinylidene Fluoride (PVDF) slurry droplets during the spraying process using a dispersing disk are investigated, aiming to enhance the quality of lithium-ion battery separators. In this study, through theoretical modeling and simulation analysis, mathematical expressions for the maximum spreading coefficient and the final shrinking coefficient of the droplets are derived. A simulation model for droplet impact and diffusion on the substrate surface is established based on the Lattice Boltzmann Method (LBM) and the Lagrangian function. Simulation results indicate that the maximum spreading coefficient of the droplet decreases with increasing substrate roughness and impact angle, while the final shrinking coefficient increases with substrate roughness but decreases as the impact angle increases. Finally, spray coating experiments for lithium-ion battery separators are conducted, and the results show that as the surface roughness and impact angle of the substrate increase, the average diameter of the droplets decreases, thereby validating the accuracy of the simulation results.

1. Introduction

As global energy consumption continues to rise and environmental issues worsen, particularly with the increasing emission of carbon dioxide, the development of more environmentally friendly renewable energy systems to reduce dependence on fossil fuels has become urgent [1,2]. At the same time, as the power lithium battery industry evolves to meet societal demands, battery separators are undergoing a significant transformation from passive components to actively involved elements in the system [3,4,5]. As a critical component of lithium-ion batteries, the quality of the separator is vital for extending battery lifespan and ensuring safe operation. Currently, separator manufacturing technologies have advanced significantly. Improvements in production processes have enhanced separator performance while also reducing production costs, further driving the high-quality development of the lithium-ion battery industry. The coating methods for lithium-ion battery separators primarily include gravure coating and slot die extrusion coating [6] and spraying techniques. Among these, spray coating is a commonly used industrial method. Spray coating is a non-contact deposition technique involving micro-droplet jetting, and the spreading behavior of the droplets on the substrate directly determines the quality of the separator [7]. The primary equipment for spraying is the dispersing disk, where PVDF slurry is dispersed into fine droplets under the centrifugal force of the disk. These droplets undergo a brief flight in the air before impacting the surface of the substrate, spreading, and drying to ultimately form the lithium-ion battery separator. In Figure 1, (a) is an actual image of the spray unit taken from the spray equipment, (b) is the structure diagram of the dispersing disk, also an actual image from the equipment, and (c) illustrates the schematic diagram of the spraying process. In recent years, increasing attention has been devoted to the study of droplet spreading characteristics by researchers worldwide.
Heungsup et al. [8] conducted experimental and theoretical studies on the spreading and shrinkage behavior of single droplets impacting smooth surfaces at room temperature. Their research involved four different liquids (distilled water, n-octane, n-tetradecane, and n-hexadecane) impacting four distinct surfaces (glass slides, uncoated silicon wafers, hexamethyldisilazane-coated silicon wafers, and Teflon films). Harlow et al. [9] and Nepomnyashchy et al. [10] studied the impact and spreading processes of droplets on different surfaces through simulations and experiments, analyzing the factors that govern the interaction between droplets. The impact of the droplets on the substrate surface is influenced by the surface tension, gravity, and the surface microstructure of the droplets [11,12,13]. Wijshoff et al. [14] and Arogeti et al. [15] investigated the formation and dynamic behavior of droplets during their impact and spreading processes, providing expressions for the maximum spreading coefficient for different types of target bodies. Regarding the dynamic analysis of droplets after impact, some scholars derived formulas for the maximum spreading radius after impact based on energy conservation equations [16,17]. Using mass and momentum conservation laws, they divided the droplet spreading process into four stages and proposed a dynamic model for droplet expansion [18]. Ilia et al. [19] and Guan et al. [20] studied the effect of substrate surface roughness on droplet spreading. The research indicated that on rough substrates, the Weber number is the primary parameter influencing droplet splashing. Y Shang et al. [21] investigated the effect of surface supercooling on droplet diffusion dynamics under different droplet sizes and impact velocities.
It is evident that scholars both domestically and internationally have conducted extensive theoretical, simulation, and experimental studies on droplet spreading characteristics. However, there is limited research on the spreading behavior of micron-sized droplets, particularly in the context of spray coating methods for lithium-ion battery separator fabrication. Furthermore, studies combining diffusion spreading and shrinkage spreading are relatively rare. The spreading process is influenced by various factors, such as the physical properties of the substrate and the impact angle. Therefore, this study aims to investigate the effects of substrate surface roughness and droplet impact angle on the spreading behavior of micro-droplets during impact. The findings of this research are of significant importance for optimizing the fabrication of high-quality lithium-ion battery separators.

2. Numerical Models and Methods

2.1. Mathematical Model of Droplet Spreading Process

This study is based on the perspective of Chandra et al. [17] and performs a theoretical analysis of the droplet impact process from the viewpoint of energy conservation. The energy during the droplet flight and spreading process primarily consists of the following components (Figure 2): kinetic energy E1, surface energy Es1, and potential energy Ep1 during the flight phase; kinetic energy E2, surface energy Es2, and potential energy Ep2 during the diffusion phase; kinetic energy E3, surface energy Es3, and potential energy Ep3 during the shrinkage phase; as well as dissipated energy W1 in the diffusion phase and W2 in the shrinkage phase. The droplet kinetic energy during the flight phase before spreading can be expressed as follows:
E 1 = ( ρ d U 0 2 / 2 ) ( π D 0 3 / 6 )
where ρ d is the droplet density, U0 is the droplet flight velocity, and D0 is the droplet diameter.
The potential energy of the droplet during the flight phase before spreading can be expressed as follows:
E p 1 = π 6 ρ d g D 0 3 h
where h is the height difference between the center point of the droplet as it detaches from the dispersing plate and the center point of the droplet when it impacts the substrate surface. During the flight of the droplet, due to its small initial diameter, the droplet’s gravitational force can be neglected. Therefore, the droplet’s trajectory can be considered as a horizontally accelerated linear motion. As a result, the change in potential energy before and after the droplet spreads can be ignored.
Surface tension is a significant factor influencing the surface energy of the droplet. During the flight phase, its surface energy can be described as follows:
E s 1 = π D 0 2 σ
By the principle of energy conservation, the kinetic energy during the droplet diffusion process can be expressed as follows:
E 2 = ρ d 0 V 1 2 ( u r 2 + u y 2 ) d V
where ur is the radial velocity component of the droplet after impact with the substrate, uy is the axial velocity component of the droplet after impact, and V is the volume of the droplet during the diffusion process.
According to Young’s equation, the surface energy during the droplet diffusion process can be expressed as follows:
E s 2 = σ ( A π R max 2 cos θ m )
where A is the wetted area of the droplet and Rmax is the maximum diffusion radius of the droplet. The primary dissipative energy during the droplet diffusion process is viscous dissipation, which can be expressed as follows:
W v = π μ D max 2 R e 20
where Dmax is the maximum diffusion diameter of the droplet, μ is the viscosity of the droplet, and Re is the Reynolds number. This leads to the following theoretical model for the maximum spreading coefficient during droplet diffusion:
β max = D max D 0 = 5 3 12 σ + ρ d U 0 2 D 0 5 σ ( 1 cos θ m ) + μ ρ d U 0 3 D 0
Similarly, based on the energy conservation equation during the shrinkage phase, the final shrinking coefficient of the droplet can be derived as follows:
γ end = D end D max = 4 σ ( 1 cos θ max ) 4 σ ( 1 cos θ end ) + μ ρ d U 0 3 D 0
where Dend is the diameter of the droplet at the completion of shrinkage and θ max is the wall contact angle at the completion of shrinkage.
The primary influencing factors in the droplet diffusion and shrinkage process are the droplet diameter, impact velocity, viscosity, and surface tension. The theoretical models for the maximum spreading coefficient and final shrinking coefficient derived in this study are only applicable to small droplets with a certain impact velocity and to spreading states where the droplet forms a spherical cap shape upon impacting the substrate, excluding scenarios such as droplet splashing or coalescence.

2.2. Solution Method

In recent years, the Lattice Boltzmann Method (LBM) [22,23] has made significant advancements in the field of fluid mechanics. It is effective in simulating fluid flow in complex geometries, including porous media flow, thermal flow, turbulence, and multiphase flow, and has been widely applied in both theoretical research and engineering applications. The LBM simulates the overall movement of the fluid by calculating two processes: the collision and migration of microscopic particles, using statistical averaging to model the fluid dynamics and further analyze the corresponding macroscopic phenomena [24]. Compared to traditional computational fluid dynamics methods, the LBM offers several advantages. First, it is not constrained by grid structures, allowing for the easy handling of large deformations at fluid surfaces. Second, the algorithm is more streamlined, requiring less computational effort, making it highly suitable for the research presented in this paper.
In the actual production of lithium-ion battery separators, commonly used slurries include Polyvinylidene Fluoride (PVDF), Polyimide (PI), and Polyvinyl Alcohol (PVA), while typical substrates are Polyethylene (PE) films, aluminum oxide (Al2O3) films, boehmite films, and PP (Polypropylene) films. In this study, PVDF solution was utilized as the slurry due to its excellent chemical stability, thermal stability, and mechanical properties for lithium-ion battery separator preparation [25]. The substrates included PE films, Al2O3 films, and boehmite films, which exhibited varying levels of surface roughness.
As the shear strain rate increases, the apparent viscosity of the PVDF slurry increases. The fluid type of the slurry is classified as a dilatant fluid within the non-Newtonian category, and its rheological equation is as follows:
τ = k ( d u d y ) n , n > 1
where τ is the shear stress, k is the consistency index, d u d y is the rate of change in velocity in the normal direction of the flow layer, known as the shear strain rate, and n is the flow behavior index.
The data obtained from measurements were fitted, and the rheological parameters for the PVDF solution in this study are listed in Table 1. The consistency index k affects the viscosity of the droplet, while the flow behavior index n influences the droplet’s shear thinning behavior. In this chapter, all viscosity-related investigations use the consistency index to represent droplet viscosity.
The surface roughness of the substrates was measured using the Bruker ContourGT-X instrument (Bruker Corporation, Billerica, MA, USA). The measured roughness values for PE films, Al2O3 films, and boehmite films are shown in Table 2:
This study employed DS Simulia XFlow 2022 Build 116.00 fluid dynamics simulation software, which utilizes the Lattice Boltzmann Method (LBM) and the complete Lagrangian function to effectively solve complex fluid dynamics problems.
First, a simulation was performed on the spreading process of a PVDF slurry droplet with a diameter of 200 μm on a PE substrate surface. The steps for simulating the droplet spreading process in XFlow were as follows:
A model of the required cavity (4 mm × 4 mm × 4 mm) for the simulation experiment was created. The substrate roughness was set based on the data obtained from the experiment. The kernel was selected as 3D, with the flow model set to multiphase flow using the phase field model. The analysis type was set to internal flow, and the temperature model was configured as a constant temperature of 25 °C. Gravity was added through an external acceleration function, and the initial velocity field was set to 10 m/s. Material 1 was set to liquid, and all relevant parameters measured by the instrument were imported. Material 2 was set to gas, with air parameters also imported. The simulation time was set to 0.002 s, with a time step size of 4 × 10⁻⁸ s. The solution scale was set to 4 × 10⁻⁵ m, and the frame frequency was set to 200,000 Hz. After the simulation began, an isosurface was added to display the interface between the droplet and the air. The flow field was set to Volume of Fluid (VOF) with a value of 0.1. The isosurface visualization material was set to resemble the color of a pure water droplet.

3. Simulation Results and Discussion

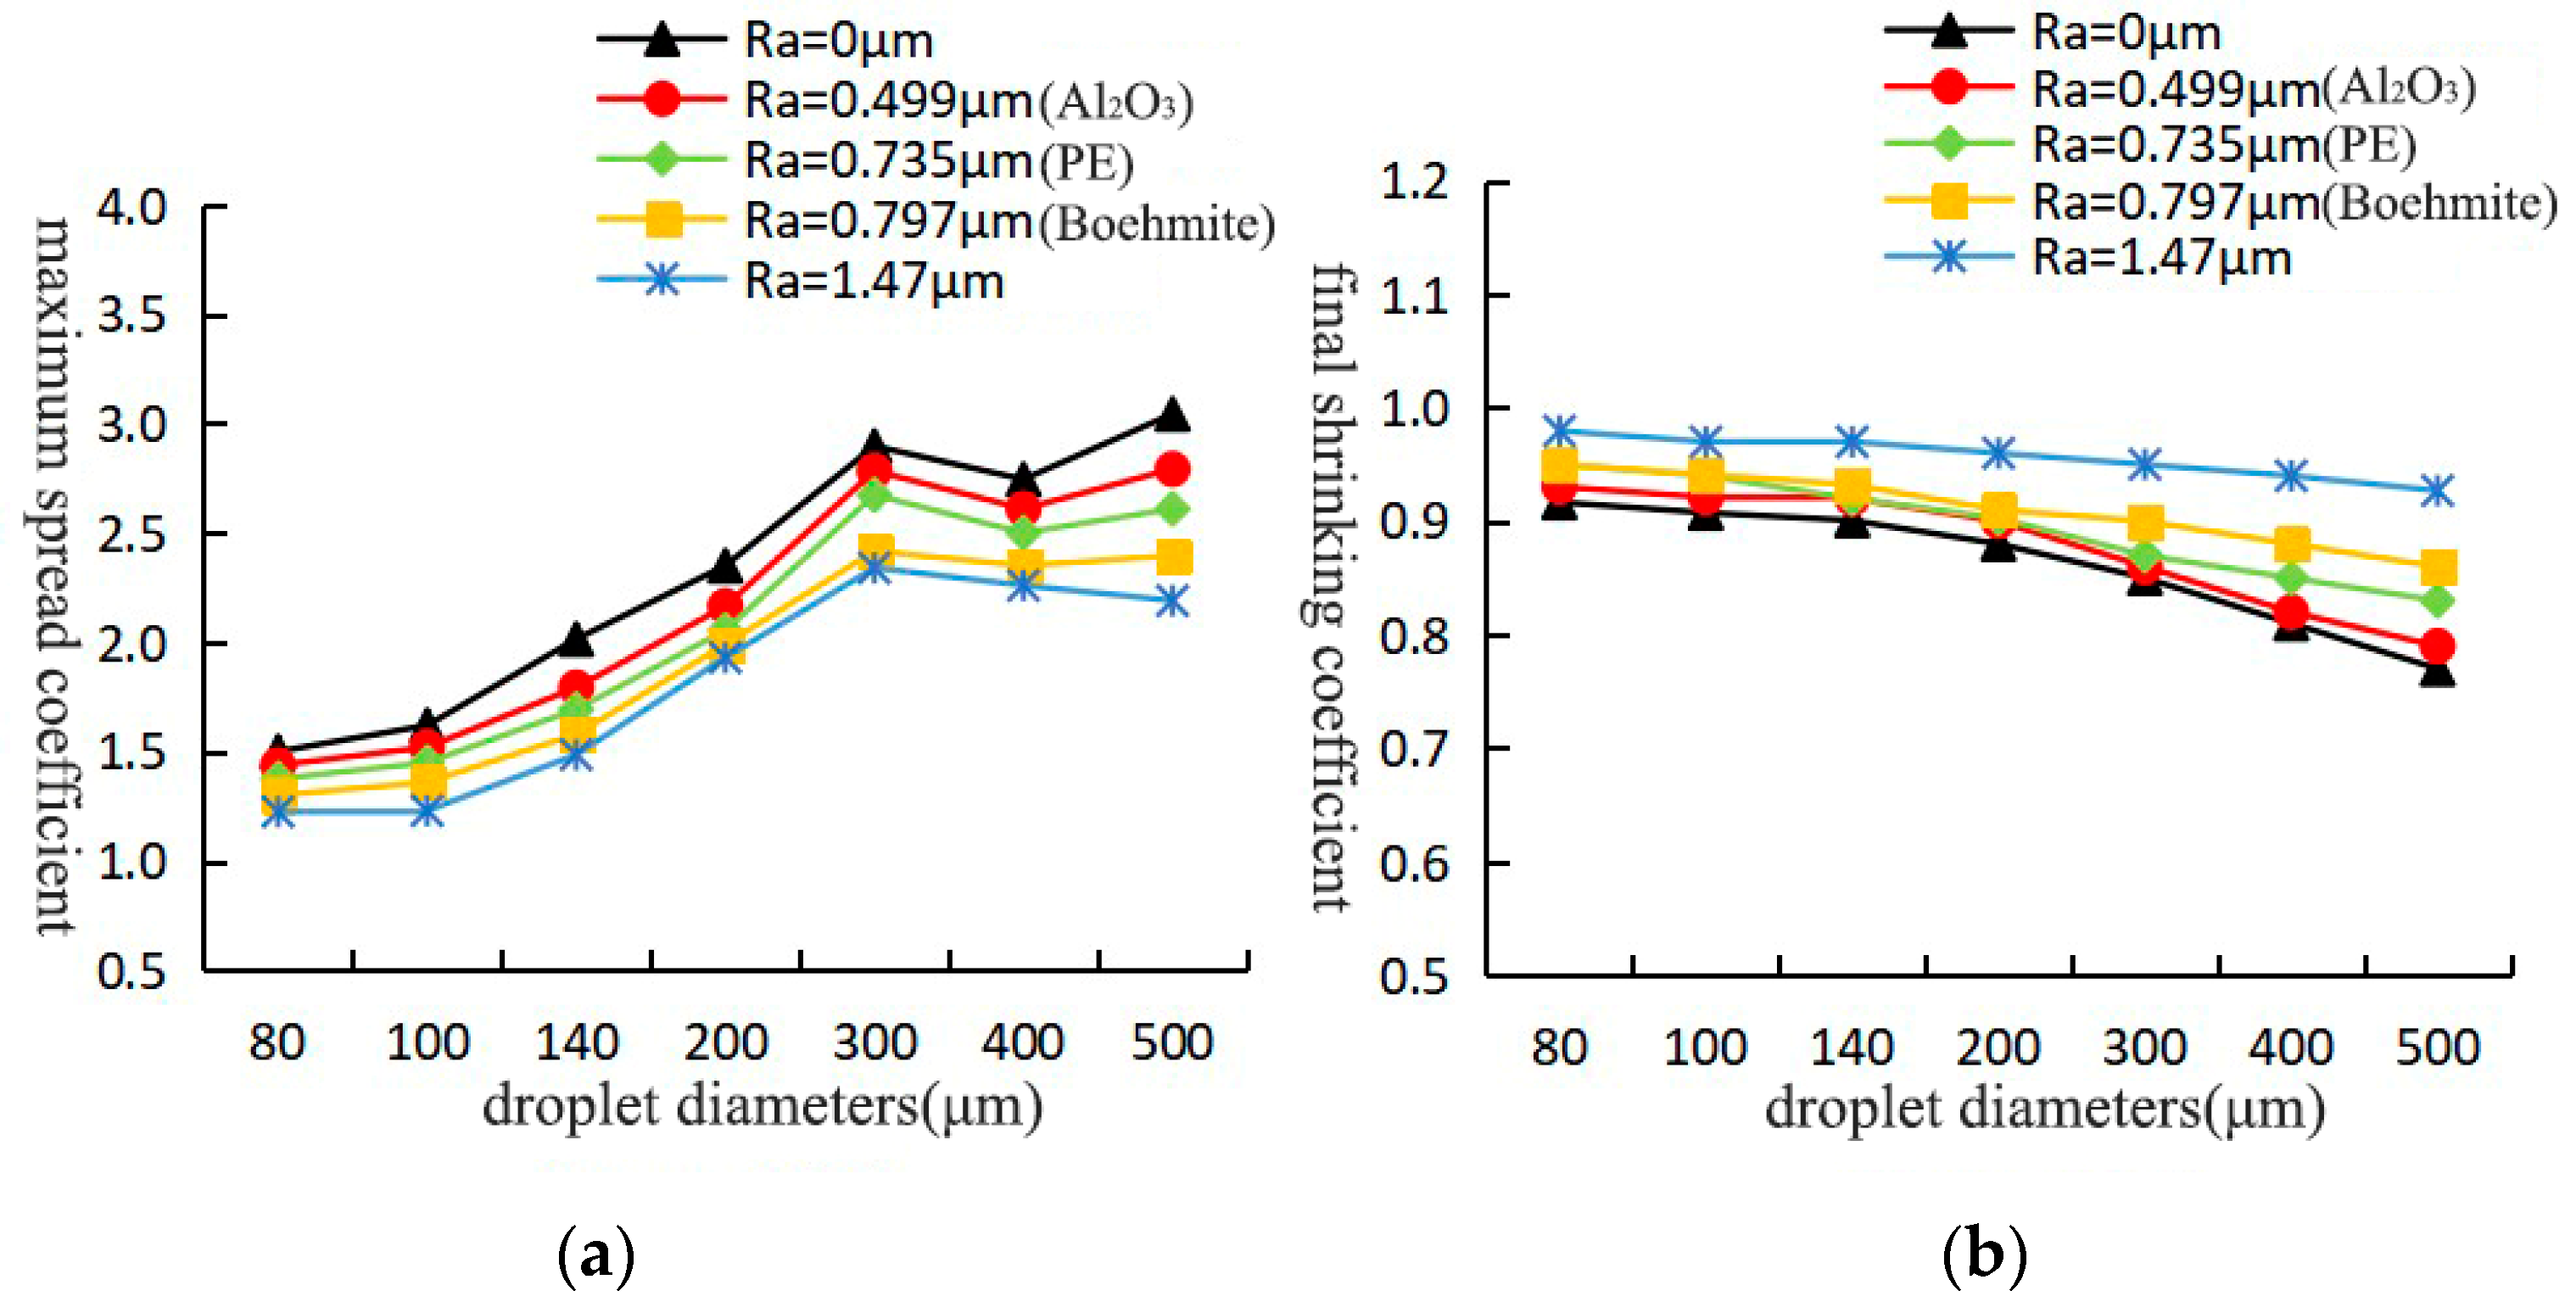
3.1. Effect of Substrate Surface Roughness on the Spreading Process

The simulation was conducted for a droplet with a diameter of 140 μm, impacting substrates with roughness values of 0.499 μm, 0.735 μm, and 0.797 μm, at an impact velocity of 10 m/s. The spreading process is shown in Figure 3.
As shown in Figure 3, when droplets impact substrates with three different surface roughness levels, a portion of the impact kinetic energy is converted into surface energy, while another portion is dissipated due to viscosity. The droplet gradually transforms from a spherical shape to a pancake-like shape. Over time, the impact kinetic energy is progressively dissipated. The diffusion process lasts for 145 μs, 135 μs, and 110 μs for the three substrates, at which point the droplet’s impact kinetic energy is fully dissipated, and the surface energy reaches its maximum. At this stage, the droplet achieves its maximum spread diameter. Following this, under the influence of surface energy, the droplet begins the shrinkage process. Additionally, as the substrate’s surface roughness increases, the shrinkage effect becomes less pronounced.
As shown in Figure 4, the data obtained in the simulation process were calculated and integrated by substituting the relevant equations to obtain the curves of the droplet spreading coefficient and shrinkage coefficient versus spreading time under the surface roughness of the substrate. As time progresses, the spreading and shrinkage coefficients of the droplets on substrates with different surface roughness levels first increase and then decrease. For droplets on substrates with varying roughness, the maximum spreading diameter is reached within the first 400 μs, after which the shrinkage process begins. During the diffusion phase (0–400 μs), the spreading coefficient decreases as the substrate surface roughness increases, while the shrinkage coefficient remains largely unchanged. In the shrinkage phase (400–2000 μs), the spreading coefficient continues to decrease with increasing roughness, whereas the shrinkage coefficient increases. This is because, during the spreading process, as the droplet impact angle decreases, the component of the inertial force along the inclined plane of the substrate increases, while the vertical component decreases, resulting in a larger spreading diameter.
When the droplet diameter varied, the data for the time to reach the maximum spreading moment and the final shrinking moment under different substrate surface roughness conditions were consolidated. The relationship curves between the maximum spreading coefficient, the final shrinking coefficient, and the substrate surface roughness were obtained, as shown in Figure 5.
As shown in Figure 5, when droplets with different diameters impact the substrate, the maximum spreading coefficient decreases and the final shrinking coefficient increases as the surface roughness of the substrate increases. This effect is more pronounced for larger droplets. For the ideal smooth substrate (surface roughness of 0 μm), the maximum spreading coefficient is highest when the droplet diameter is 500 μm. For substrates with other surface roughness values, the maximum spreading coefficient reaches its peak when the droplet diameter is 300 μm. Regarding substrates with surface roughness ranging from 0 μm to 1.47 μm, the maximum value of the final shrinking coefficient occurs when the droplet diameter is 500 μm, while the minimum shrinking coefficient is observed for droplets with a diameter of 80 μm.

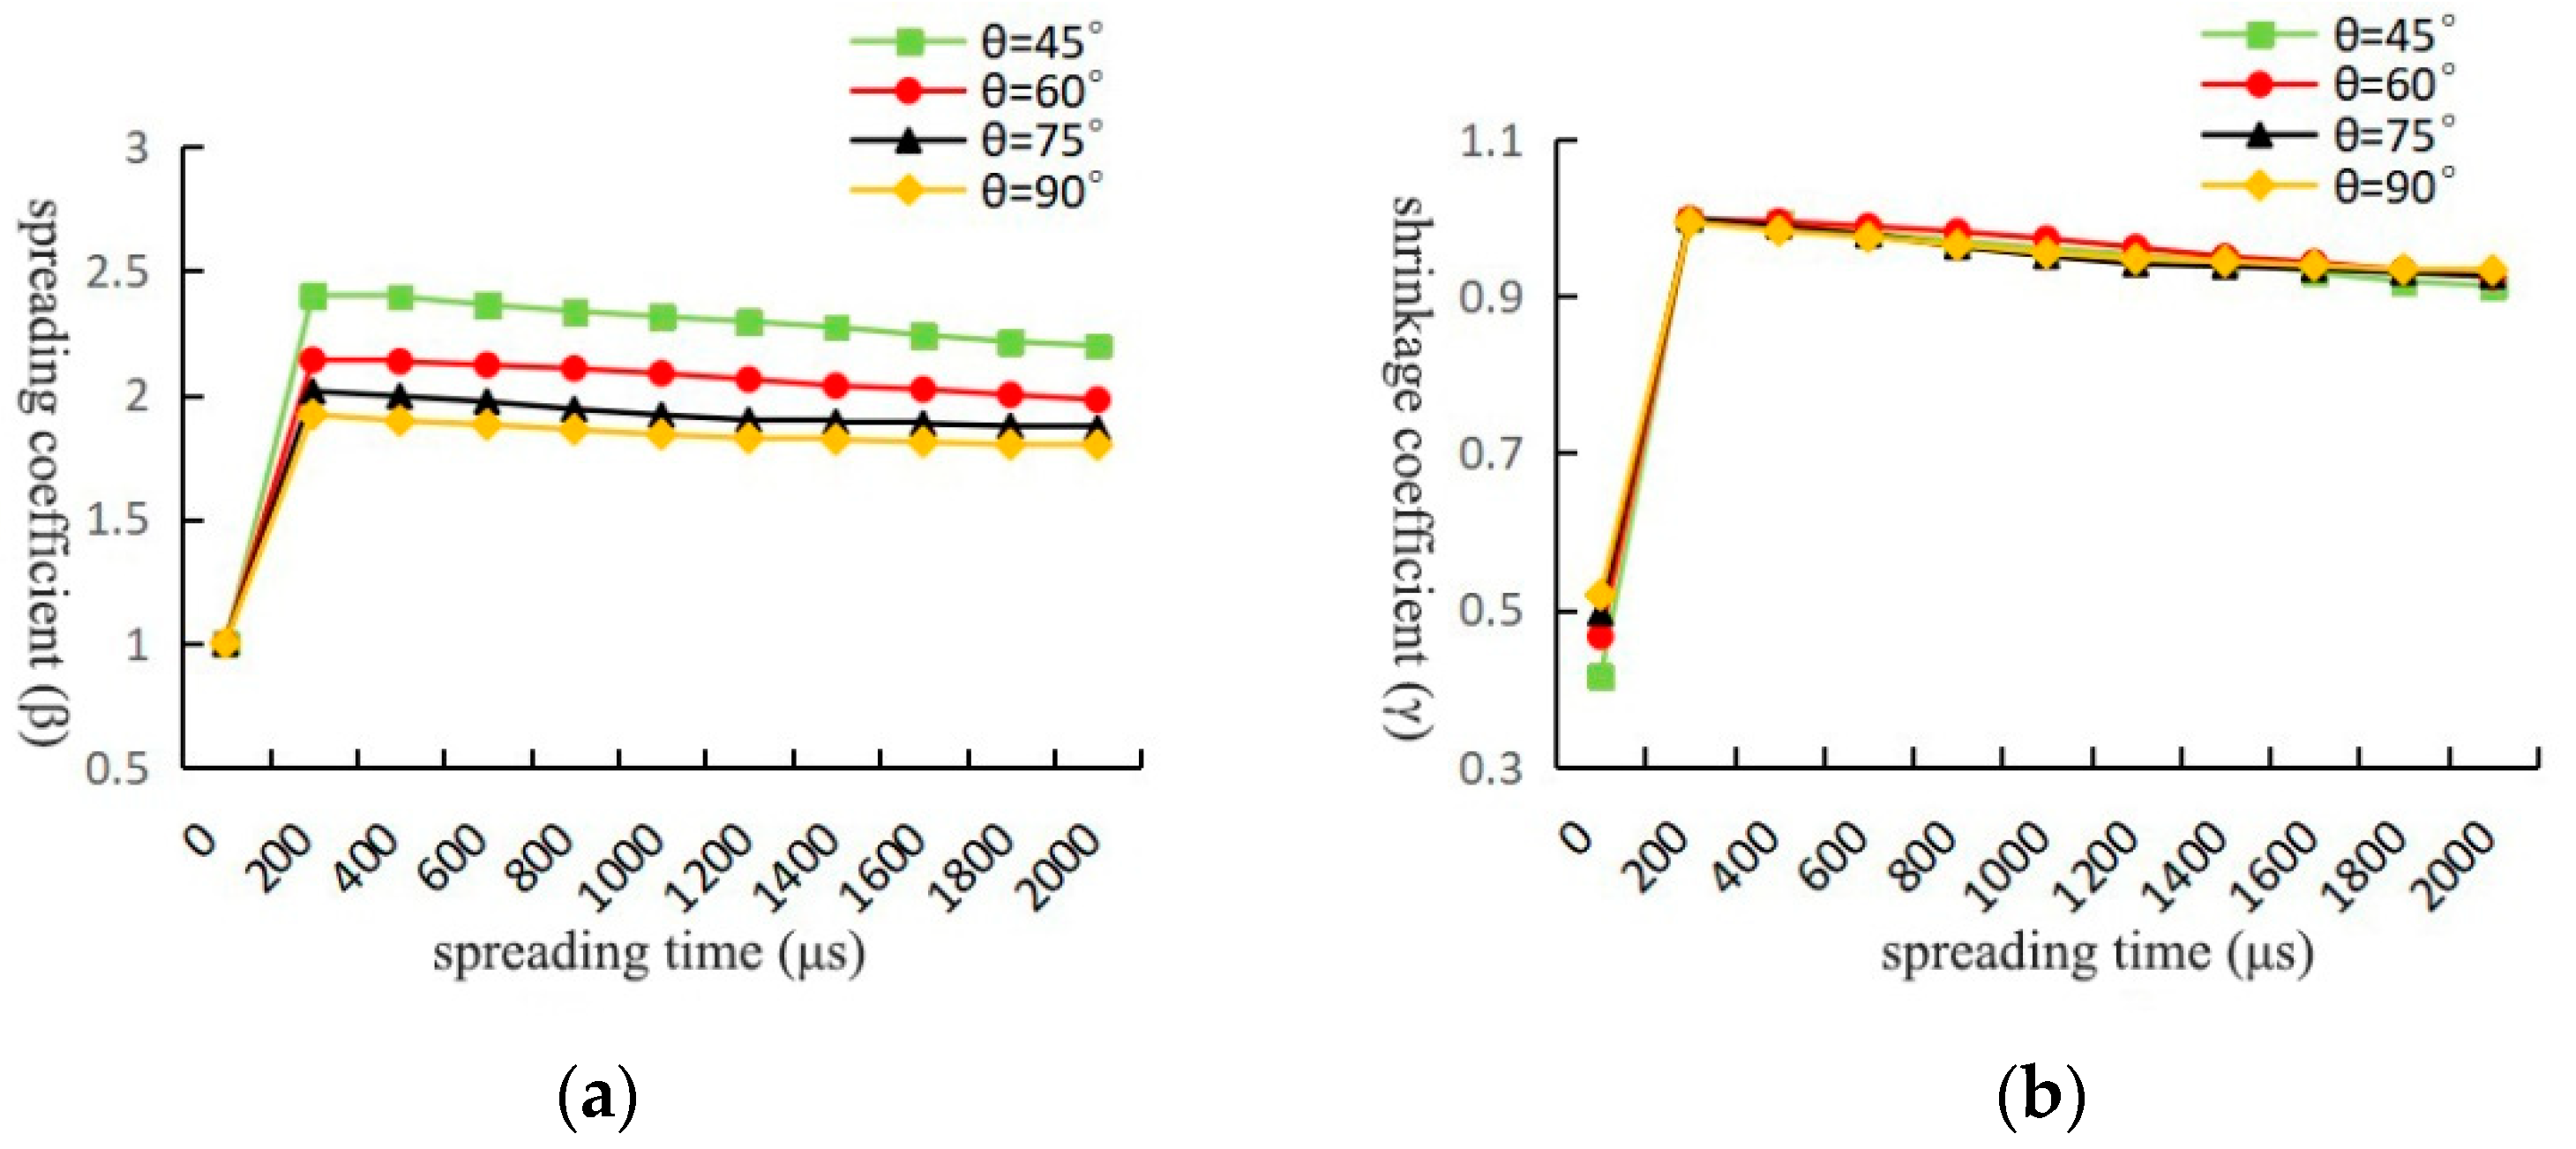
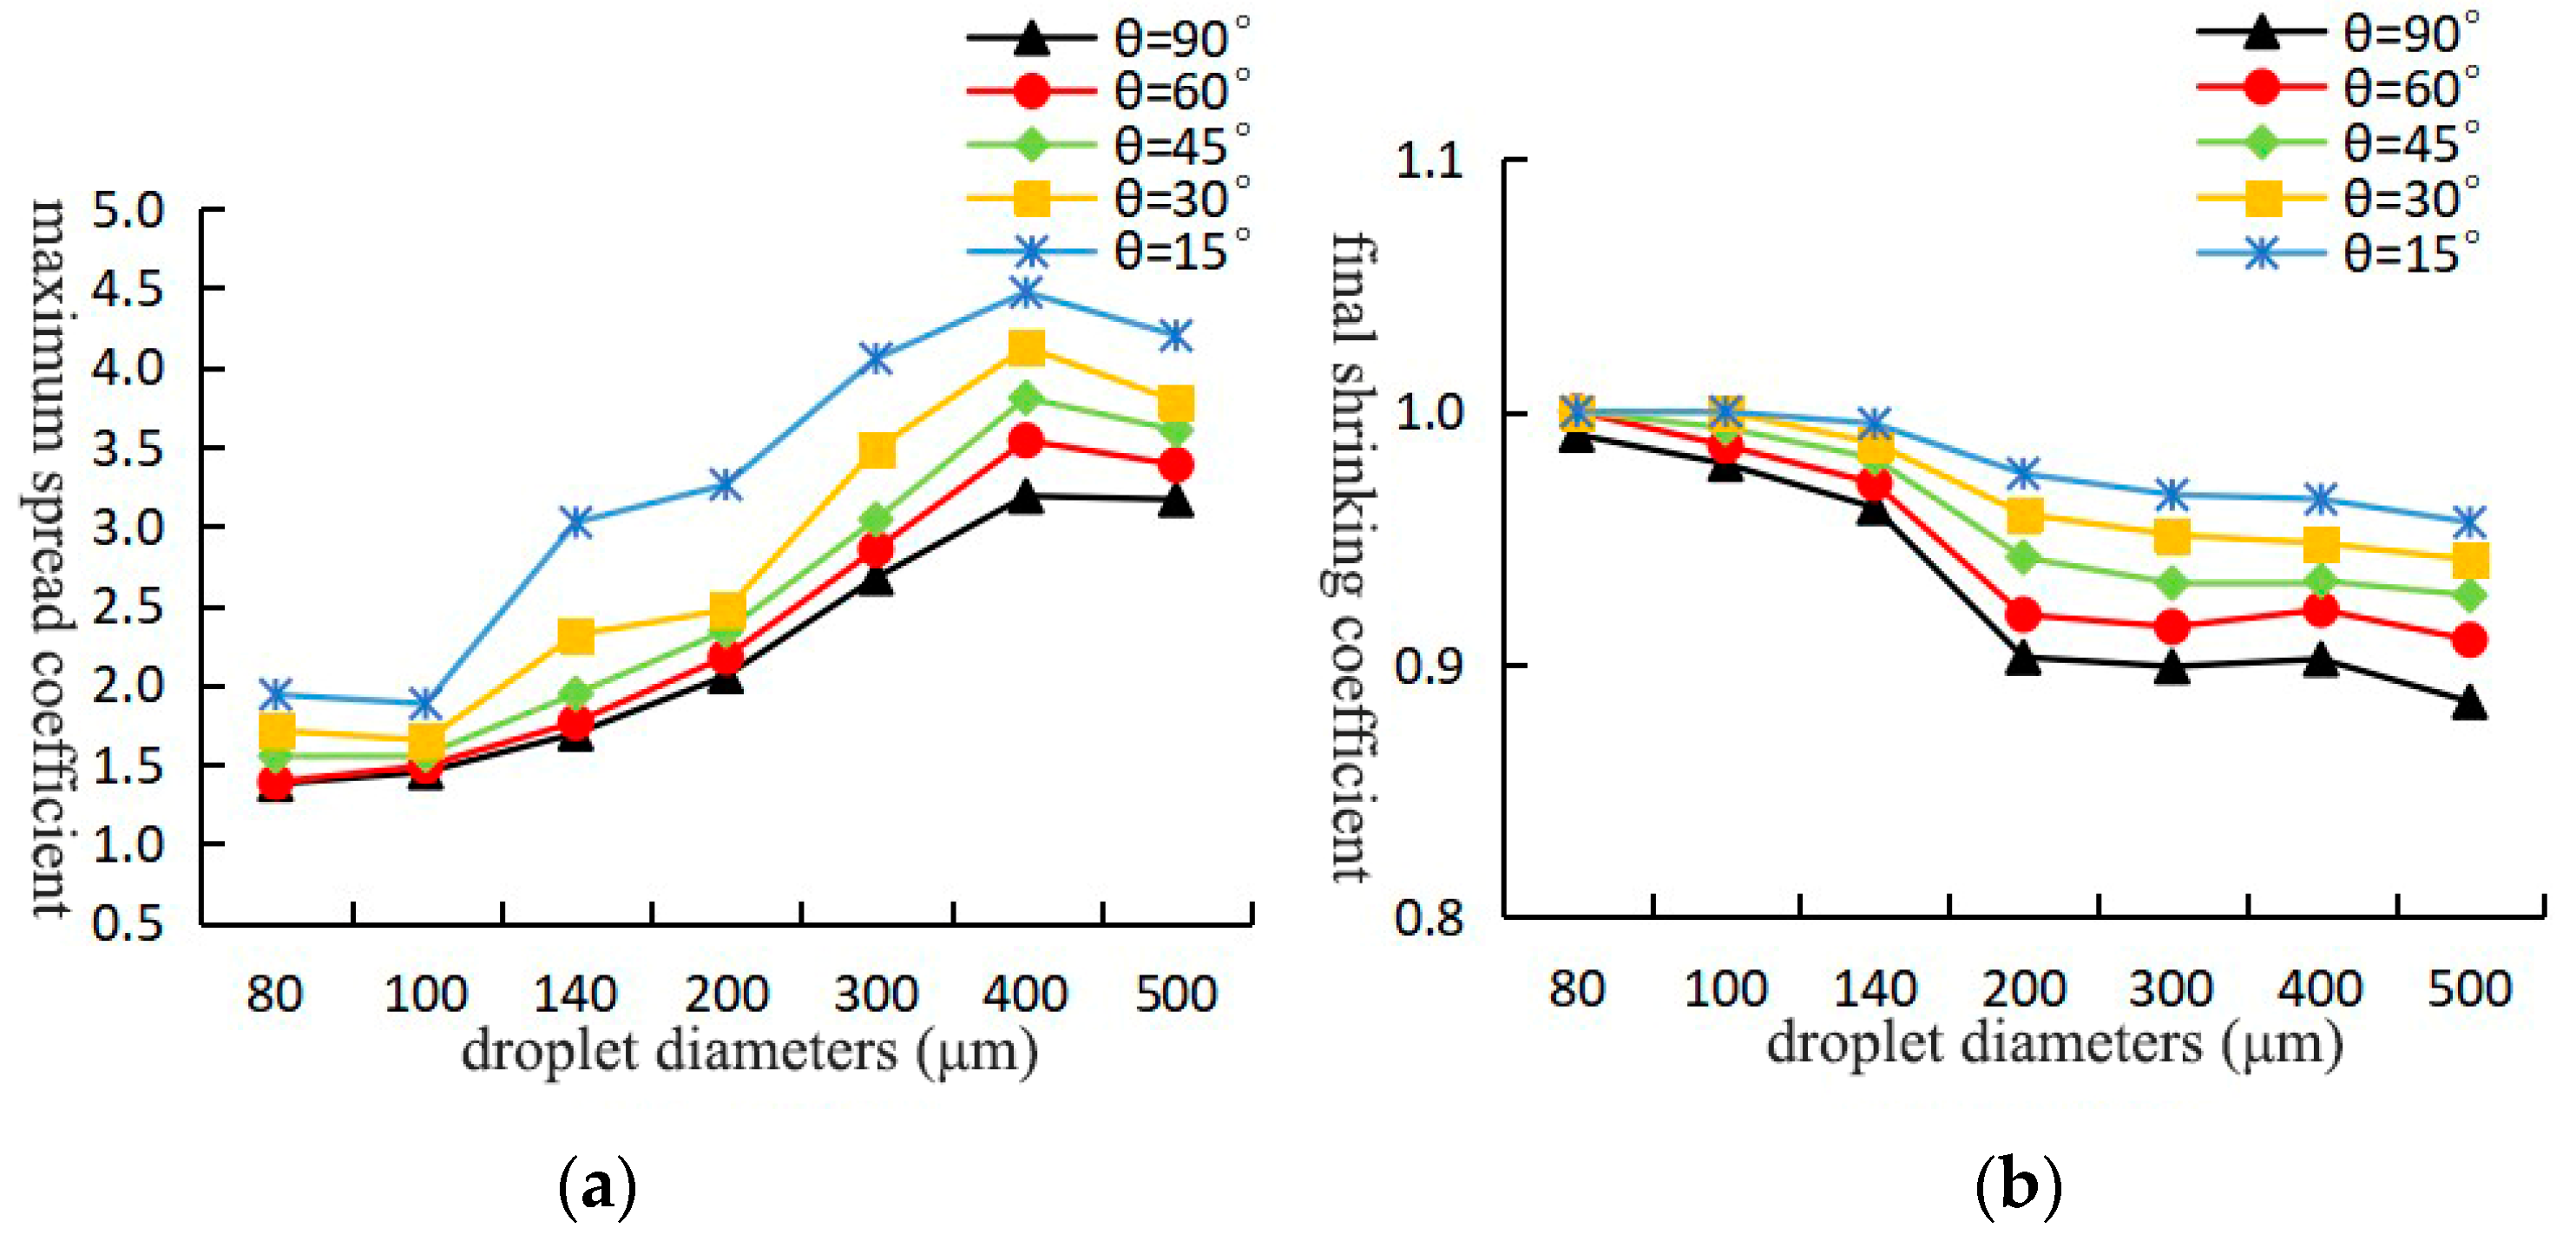
3.2. Effect of Droplet Impingement Angle on Spreading Process

Using PE film as the substrate, with a surface roughness of 0.735 μm, we conducted simulations for droplets with an impact velocity of 10 m/s, a diameter of 140 μm, and impact angles of 15°, 30°, and 45°. The spreading processes are shown in Figure 6.
From Figure 6, it can be seen that, as time progresses, the moment at which the spreading reaches its maximum diameter occurs at 215 μs, 275 μs, and 265 μs for the droplets impacting at 15°, 30°, and 45°, respectively. During this time, the droplet’s kinetic energy is fully dissipated, and the surface energy reaches its maximum, causing the droplet to attain its maximum spreading diameter. Afterward, under the influence of surface energy, the droplet begins the shrinkage process. As the impact angle increases, the shrinkage effect becomes more pronounced.
The data obtained in the simulation process were calculated and integrated by substituting them into the relevant equations to obtain the curves of the droplet spreading coefficient and shrinkage coefficient versus spreading time under different impact angles, as shown in Figure 7.
Figure 7 shows the relationship between spreading and shrinkage coefficients and spreading time for droplets with different impact angles. It can be observed that both the spreading coefficient and receding coefficient first increase and then decrease over time. All droplets reach their maximum spreading diameter within the first 400 μs, after which they begin to shrink. In the spreading phase (0–400 μs) and the shrinkage phase (400–2000 μs), droplets with larger impact angles exhibit a smaller spreading coefficient, and the shrinkage coefficient remains almost unchanged.
This can be explained by the fact that, during the spreading phase, the smaller the impact angle, the greater the component of the droplet’s inertia force in the direction along the sloped surface, which reduces the vertical component. This results in a larger spreading diameter. However, the surface energy that drives the shrinkage process and the viscous dissipation that resists it are nearly the same for all impact angles, causing the shrinkage coefficient to remain essentially constant.
When the droplet diameter values differed, the data for the moments when droplets reach their maximum spreading and final shrinkage at different impact angles were calculated, resulting in the relationship curve between the maximum spreading coefficient and the final shrinking coefficient with droplet impact angle, as shown in Figure 8.
As shown in Figure 8, for droplets impacting the substrate surface at various impact angles, it can be observed that as the impact angle increases, both the maximum spreading coefficient and the final shrinking coefficient continuously decrease. This phenomenon is more pronounced for droplets with larger diameters. For droplets with impact angles ranging from 15° to 90°, the maximum spreading coefficient reaches its highest value when the droplet diameter is 400 μm. Similarly, for droplets with the same range of impact angles, the final shrinking coefficient reaches its maximum value for droplets with a diameter of 80 μm, and its minimum value for droplets with a diameter of 500 μm.

4. Experimental Verification

To investigate the effects of substrate roughness and droplet impact angle on droplet spreading, experiments were conducted using PVDF solution as the slurry and PE film, Al2O3 film, and boehmite film as the three substrate materials.

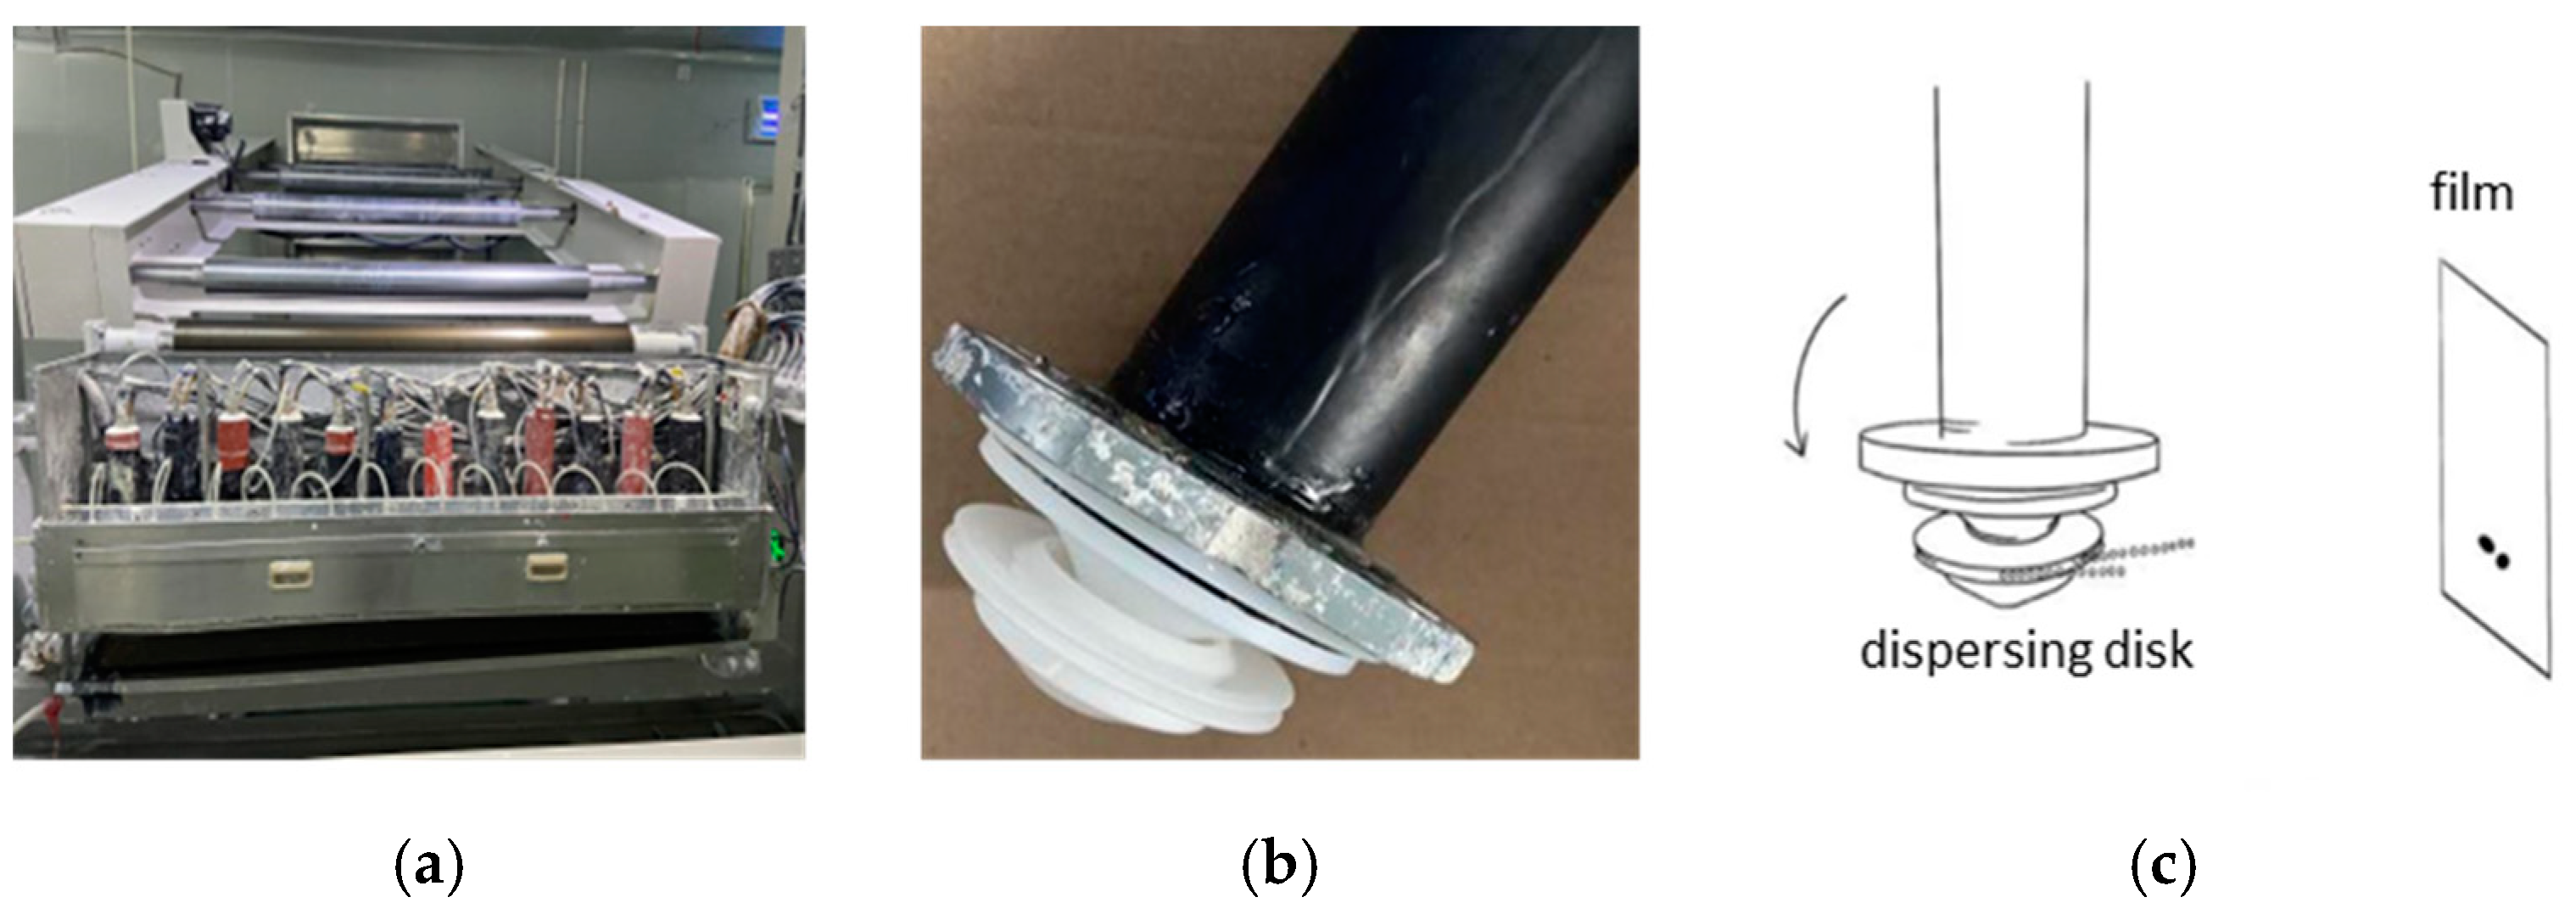
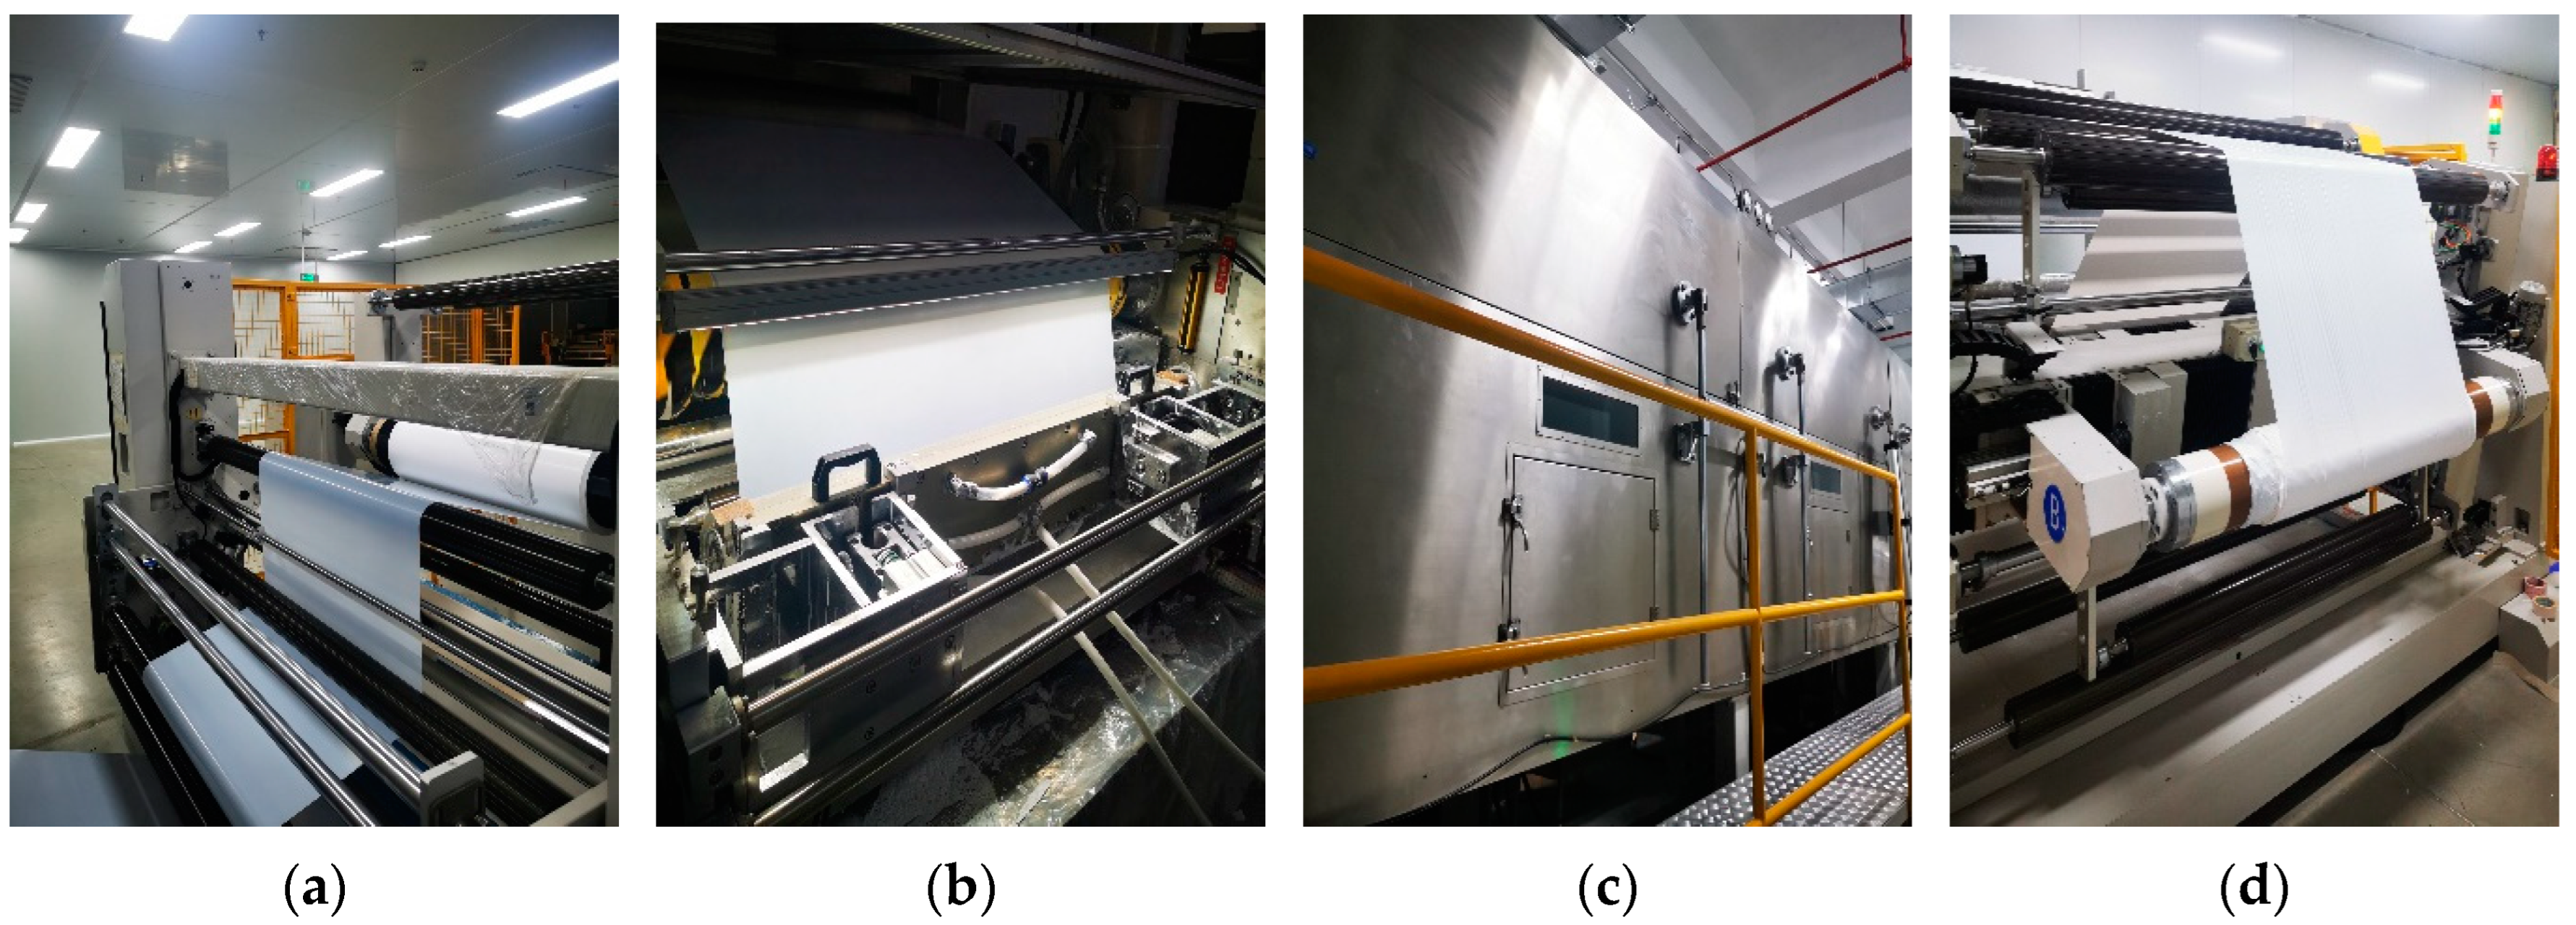
4.1. Experimental Equipment

In this study, the final diameter of the droplet spreading was taken as the key experimental variable. For vertical impact spreading droplets, a larger final spreading diameter indicated better spreading performance, which aligned more closely with practical production requirements. However, for oblique impact spreading droplets, a larger spreading diameter resulted in poorer spreading, and in practical production, such situations should be avoided. Figure 9 shows the equipment in the experiment, which included the unwinding unit, spray coating unit, oven drying unit, and rewinding unit. The spray coating process began with the unwinding unit releasing the substrate, followed by coating in the spray coating unit. After the slurry was applied to the substrate, the oven drying unit cured the coated material. Finally, the rewinding unit rolled up the finished product. The droplet spreading and shrinkage processes occurred within the spray coating unit.
The slurry used in the experiments was the PVDF solution. The same dispersion disk was used in all experiments, with the rotation speed and feed rate fixed. Three experiments were conducted using different substrates: Al2O3, PE, and boehmite substrates. The goal was to investigate the droplet spreading diameter distribution on different substrates.
For each of the three experimental conditions, a 50 m track was run, and samples approximately 1 m in length were collected. Circular samples were cut from the track using a circular cutter at the same horizontal level. Six circular regions of equal size were selected as test samples, labeled from left to right as regions 1, 2, 3, 4, 5, and 6, as shown in Figure 10a. In the spraying unit, multiple dispersing disks formed a dispersing disk group. In regions 1–2, droplets were blocked by other dispersing disks on the left side and could not reach the substrate surface. Region 3 was where droplets were ejected vertically from the dispersing disk and impacted the substrate. When the droplet impacted the substrate at a position further to the right, the impact angle decreased, as shown in Figure 10b. The diameter of the droplet spreading in each circular region was measured using a Keyence optical microscope, as shown in Figure 10c.

4.2. Results

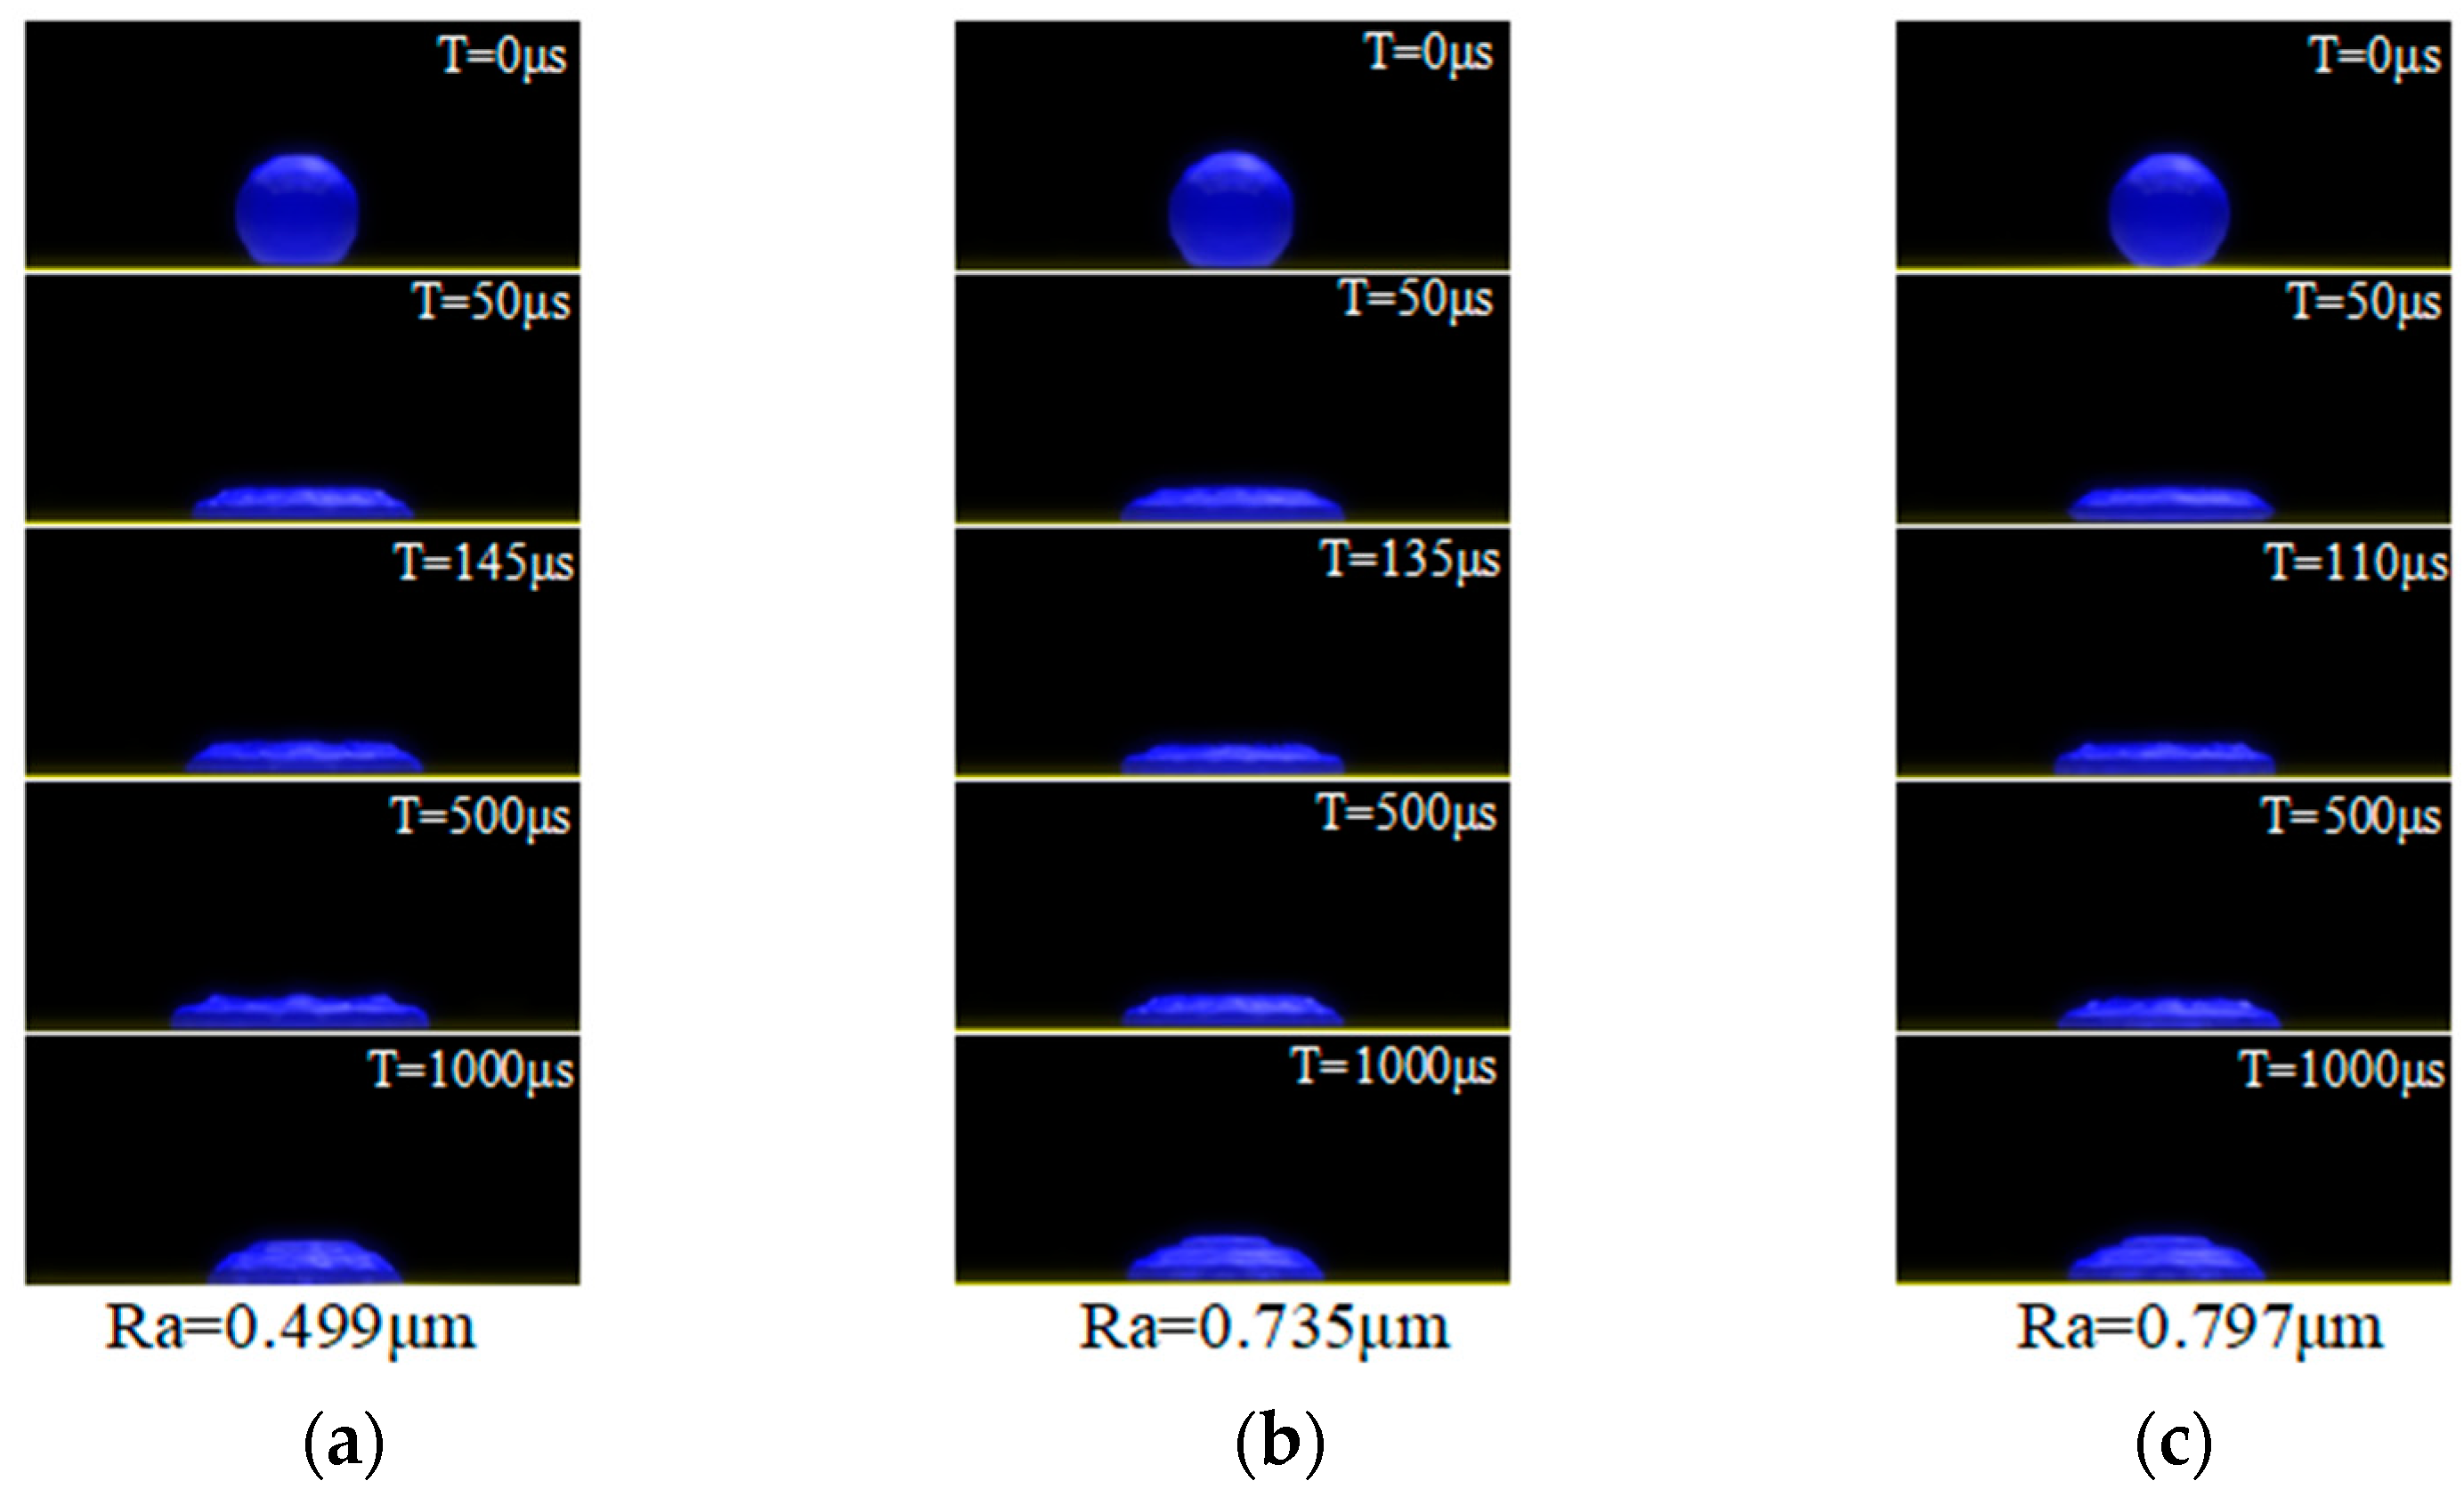
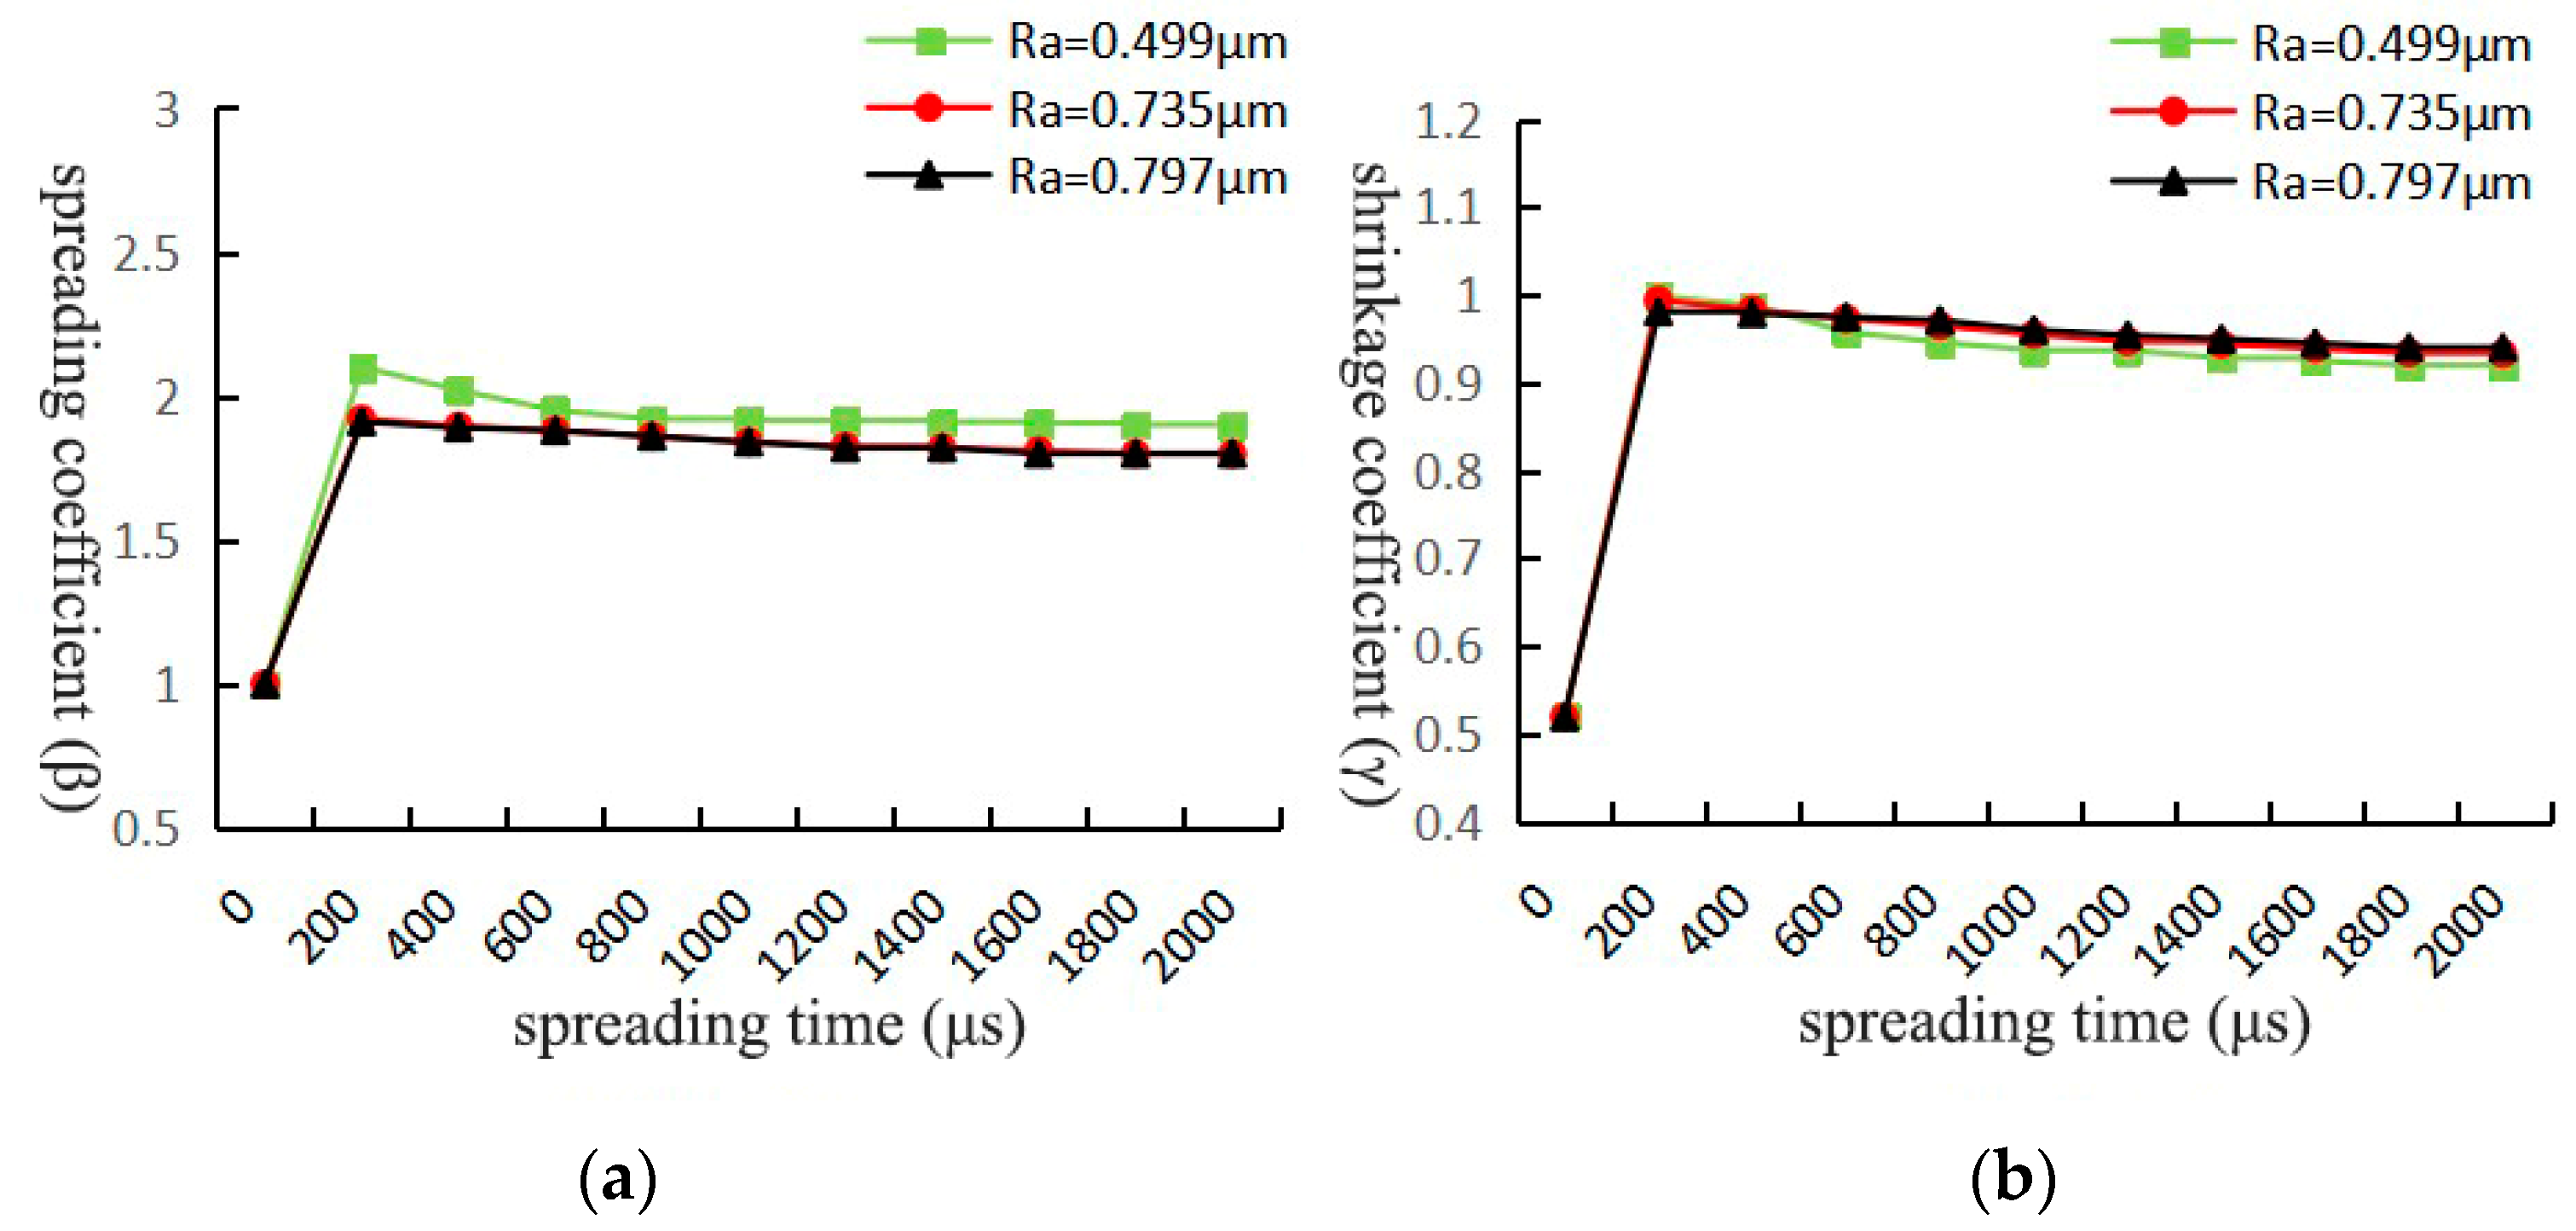
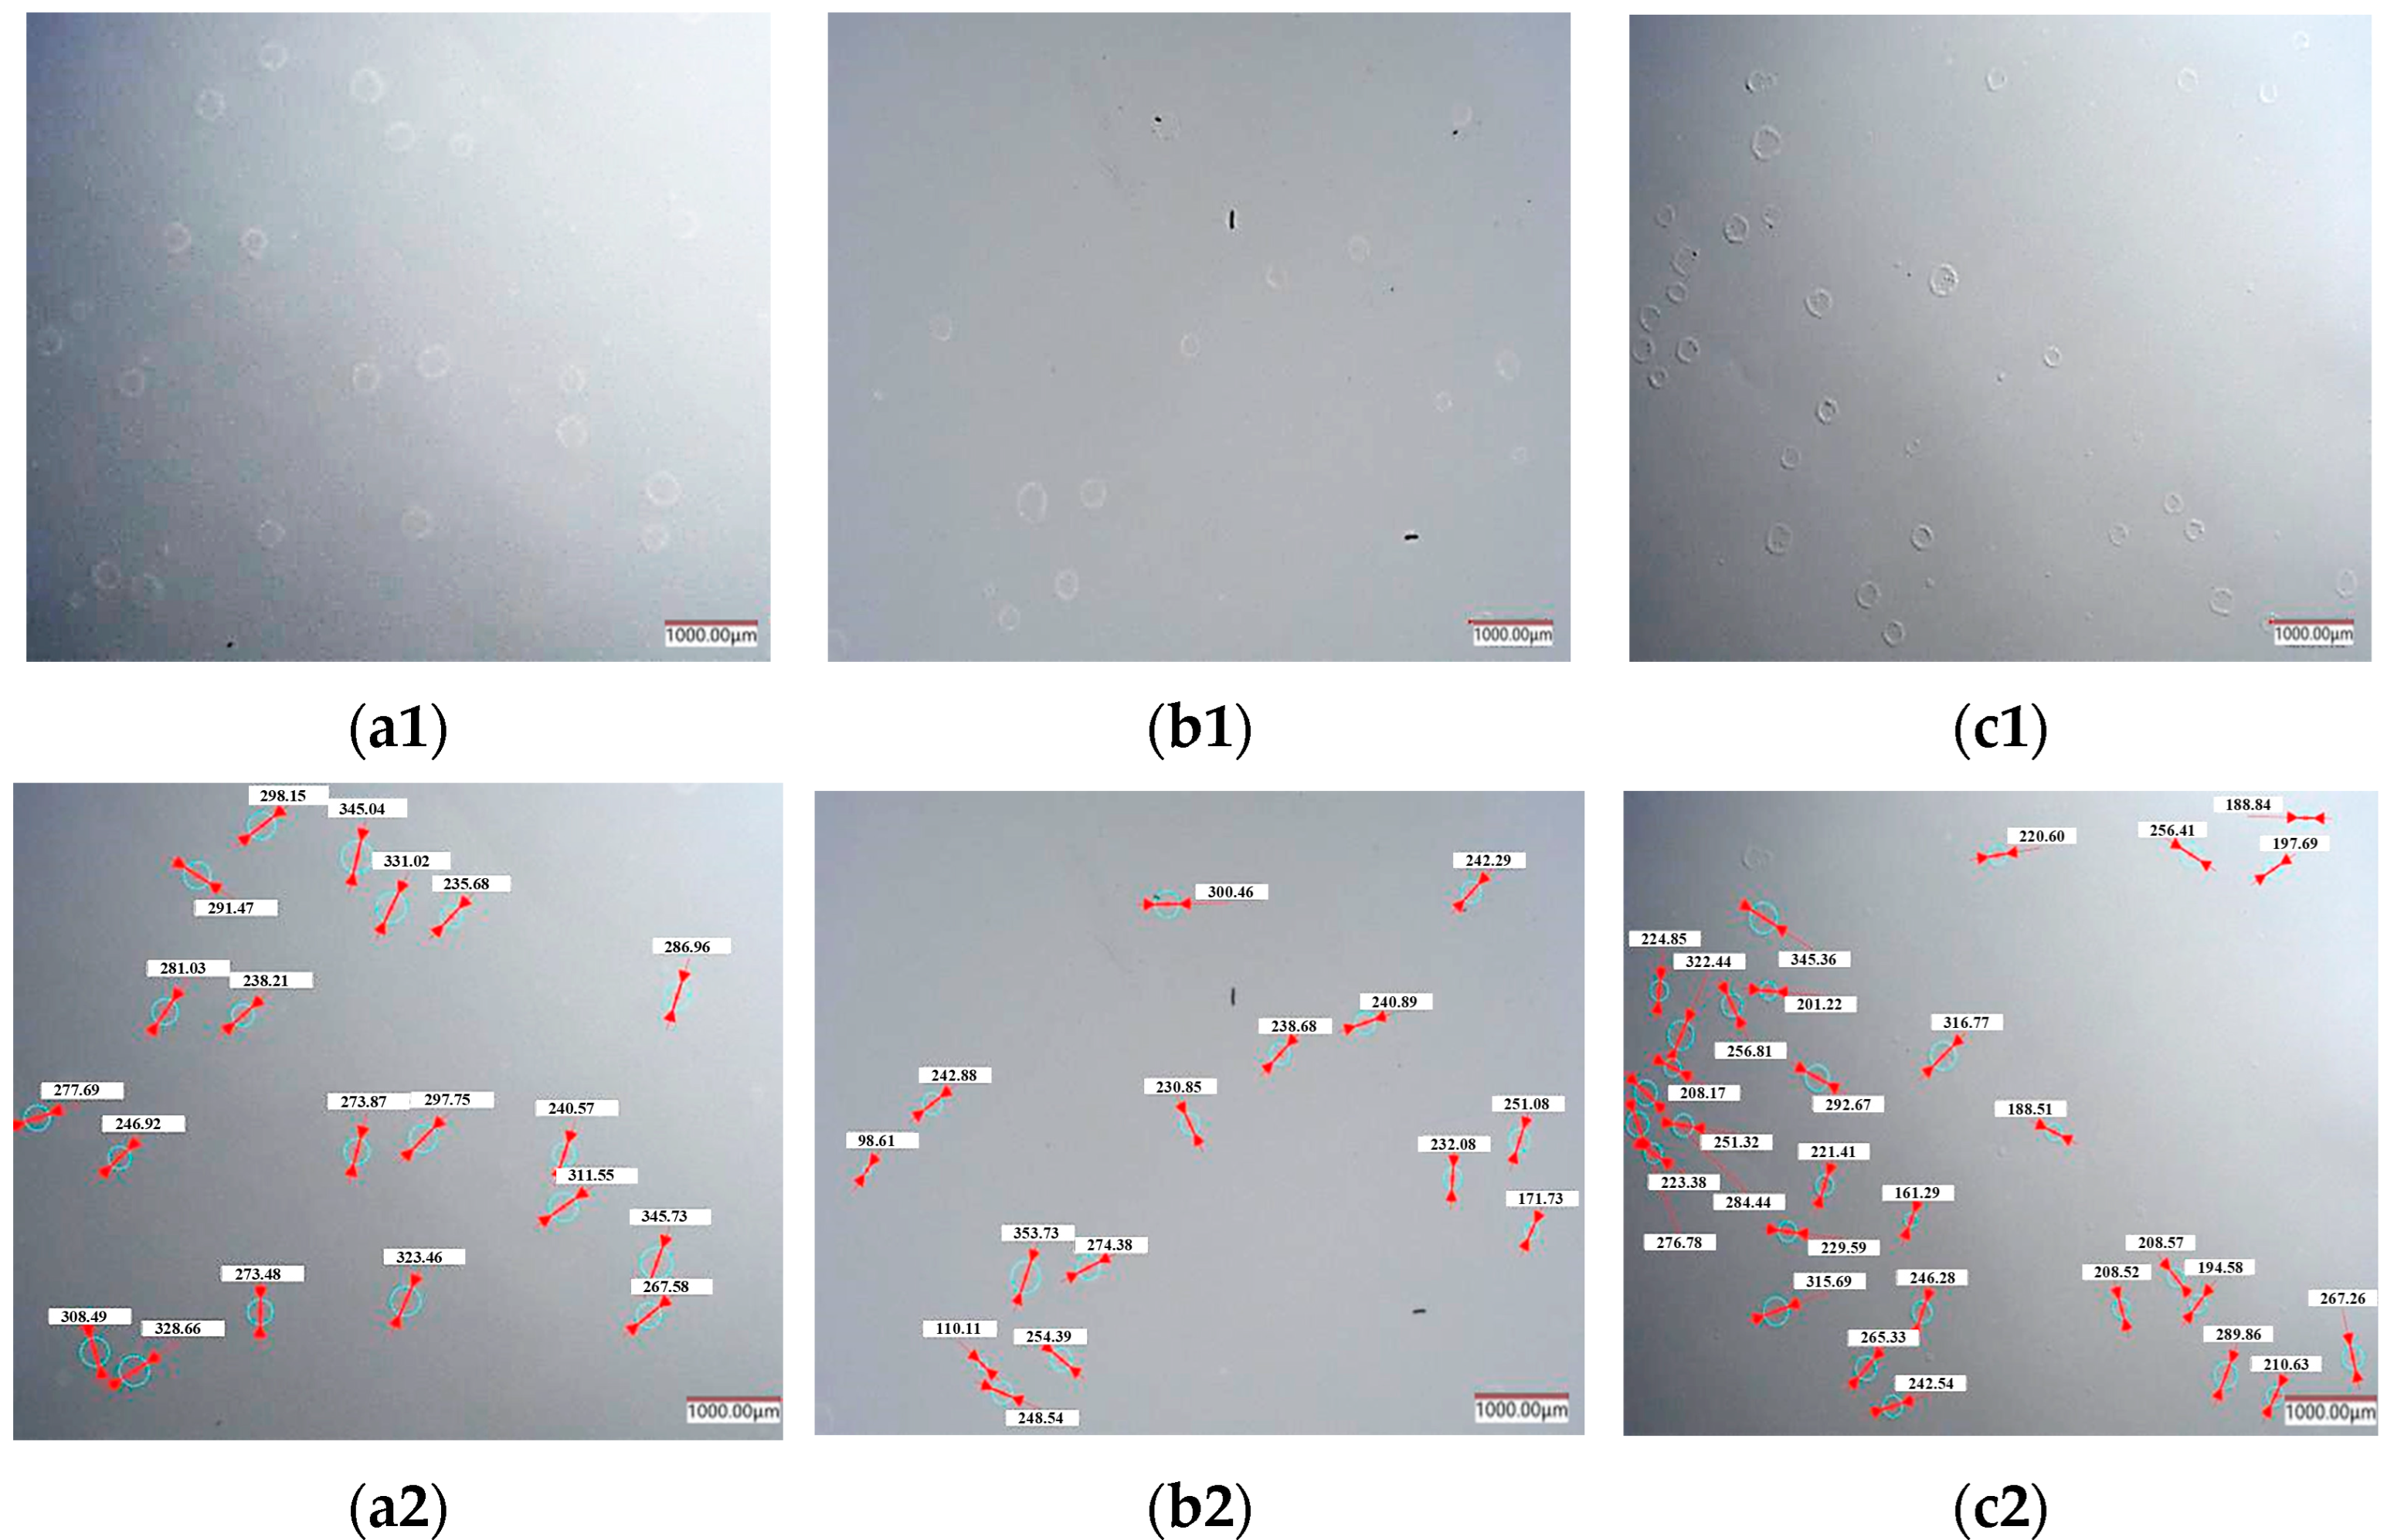
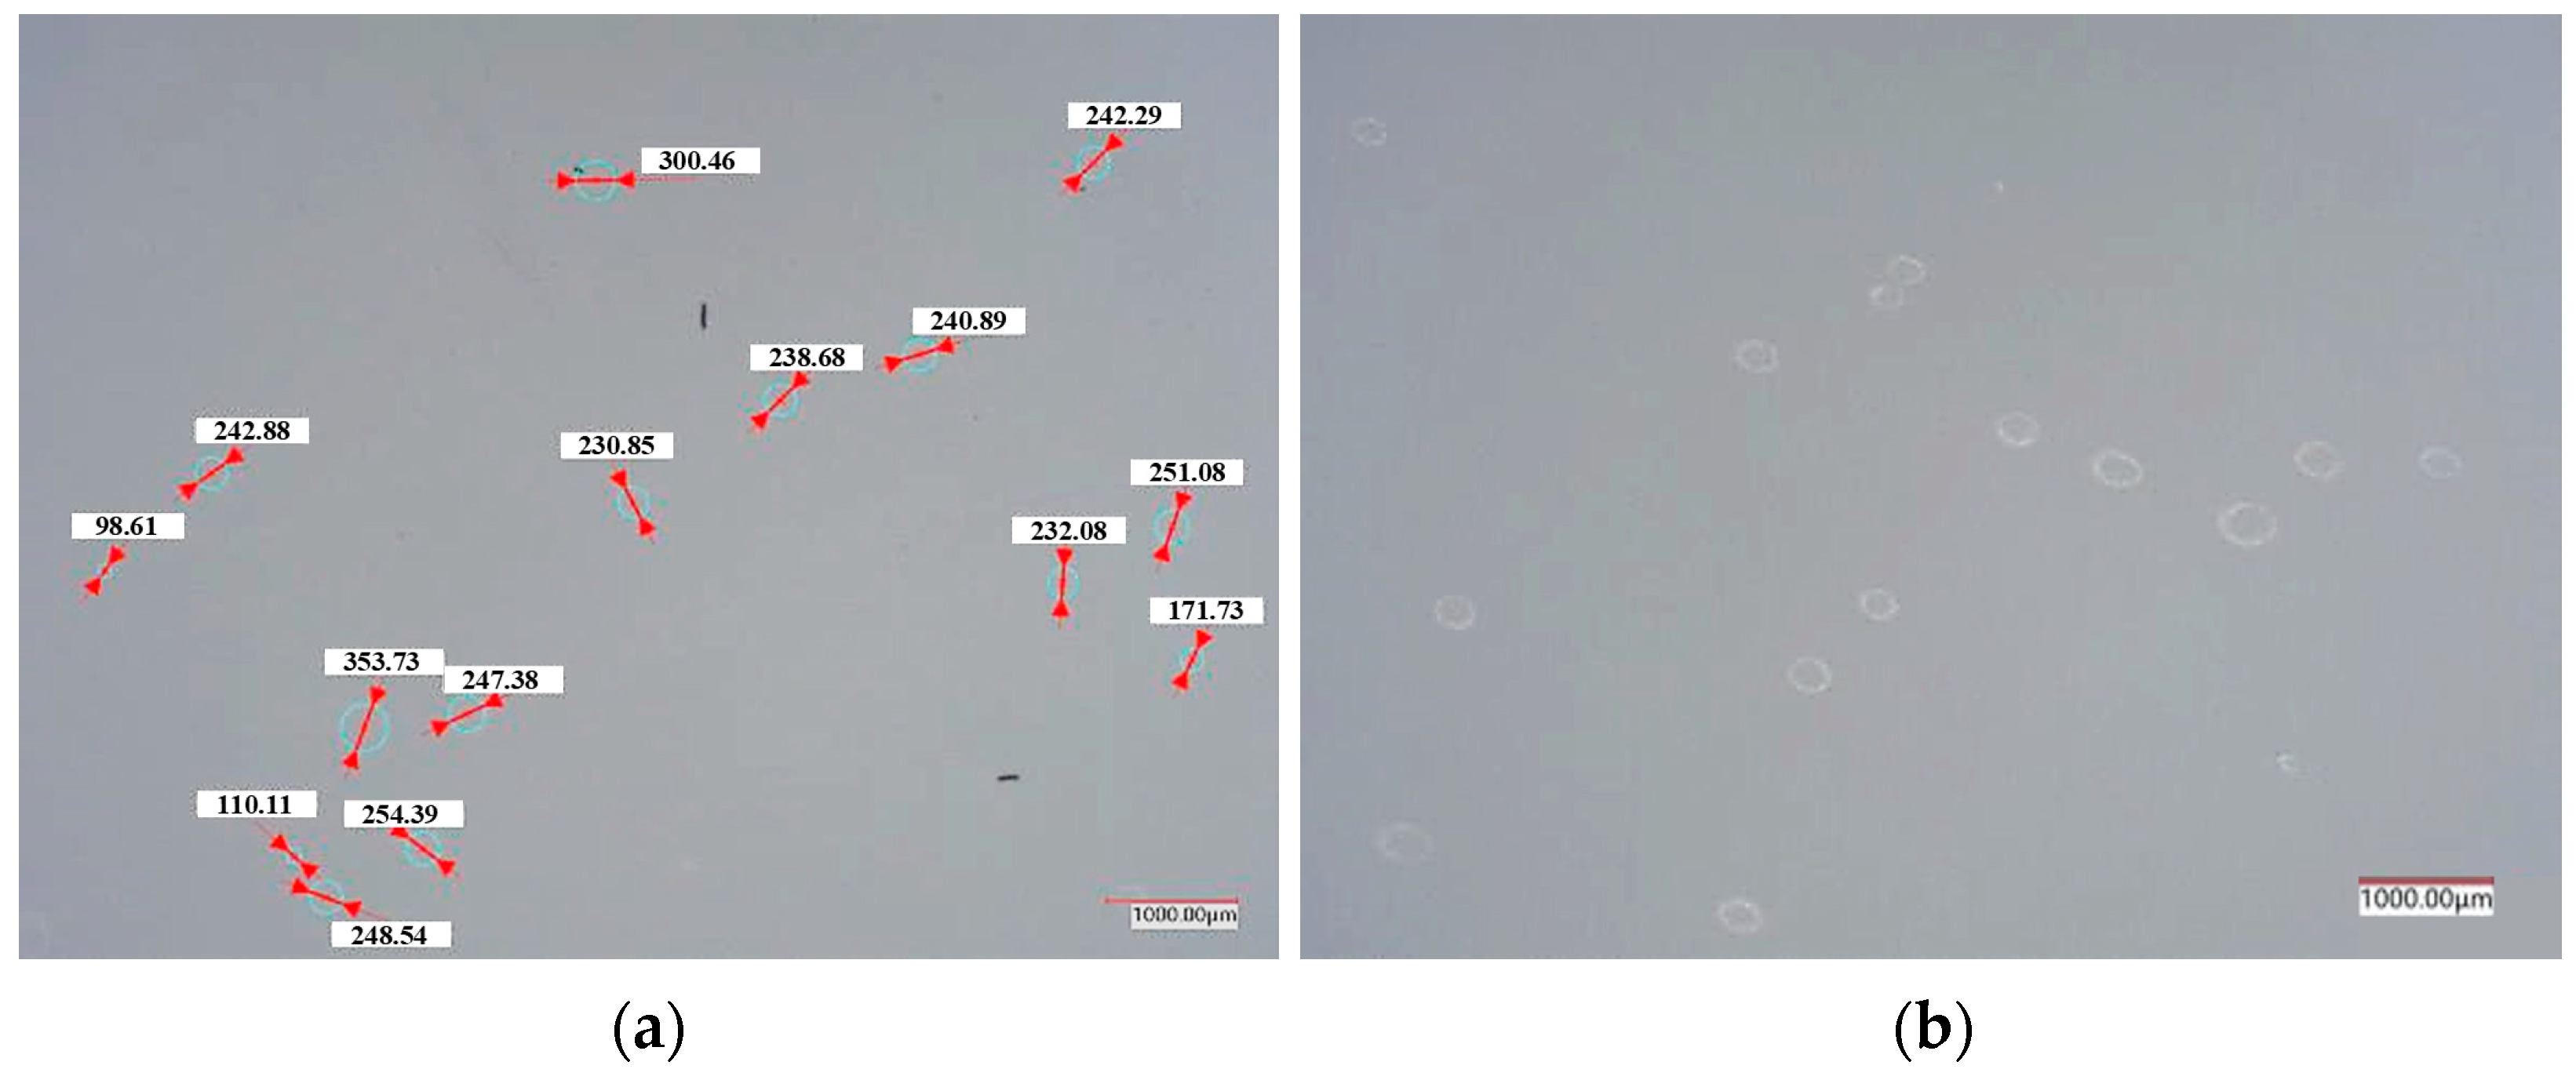
4.2.1. Effect of Substrate Roughness on Spreading of PVDF Slurry Droplets

The substrate films used in this experiment were Al2O3 film (Ra = 0.499 μm), PE film (Ra = 0.735 μm), and boehmite film (Ra = 0.797 μm). The droplet morphology as well as the spreading diameter under different substrate films in region 3, for example, are shown in Figure 11.
In Figure 11, the spreading morphology and diameters of the droplets on the three different substrates (aluminum oxide, PE, and boehmite films) are presented. The droplet spreading behavior was observed using a Keyence optical microscope, with a particular focus on the droplet in the third region, which represents the most vertical impact. The results show that as the surface roughness of the substrate increases, the average spreading diameter of the droplet decreases. This is because a substrate with higher roughness generates more resistance during the spreading process, causing a greater loss of the droplet’s kinetic energy and, consequently, a smaller final spreading diameter. After organizing the data from regions 4, 5, and 6, the relationship curve between the average droplet spreading diameter in different regions and the surface roughness of the substrate film was obtained, as shown in Figure 12.
In Figure 12, the relationship between the surface roughness of the substrates and the average droplet spreading diameter is plotted. As the distance between the dispersing plate and the substrate increases, the average spreading diameter of the droplets also increases across all substrates. Notably, the PE and boehmite films show very similar droplet spreading diameters due to their comparable surface roughness. The experimental results were compared with the simulation outcomes, confirming the accuracy of the simulation’s conclusions.

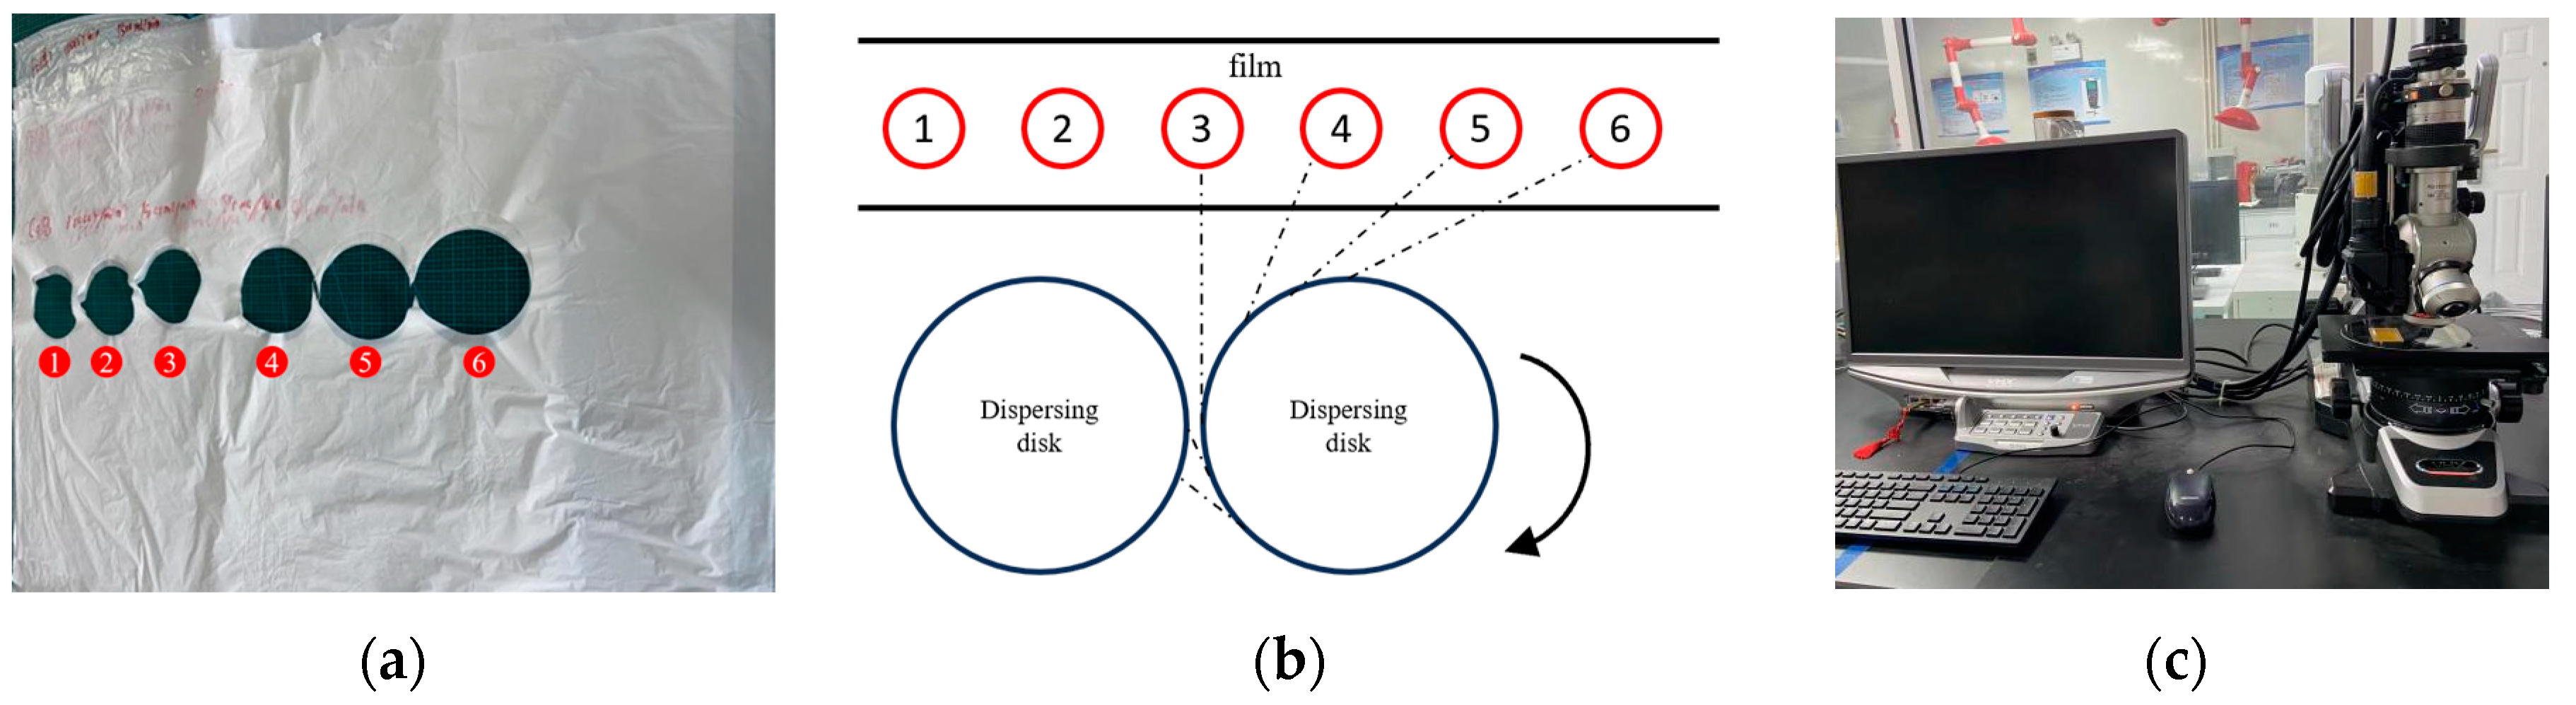
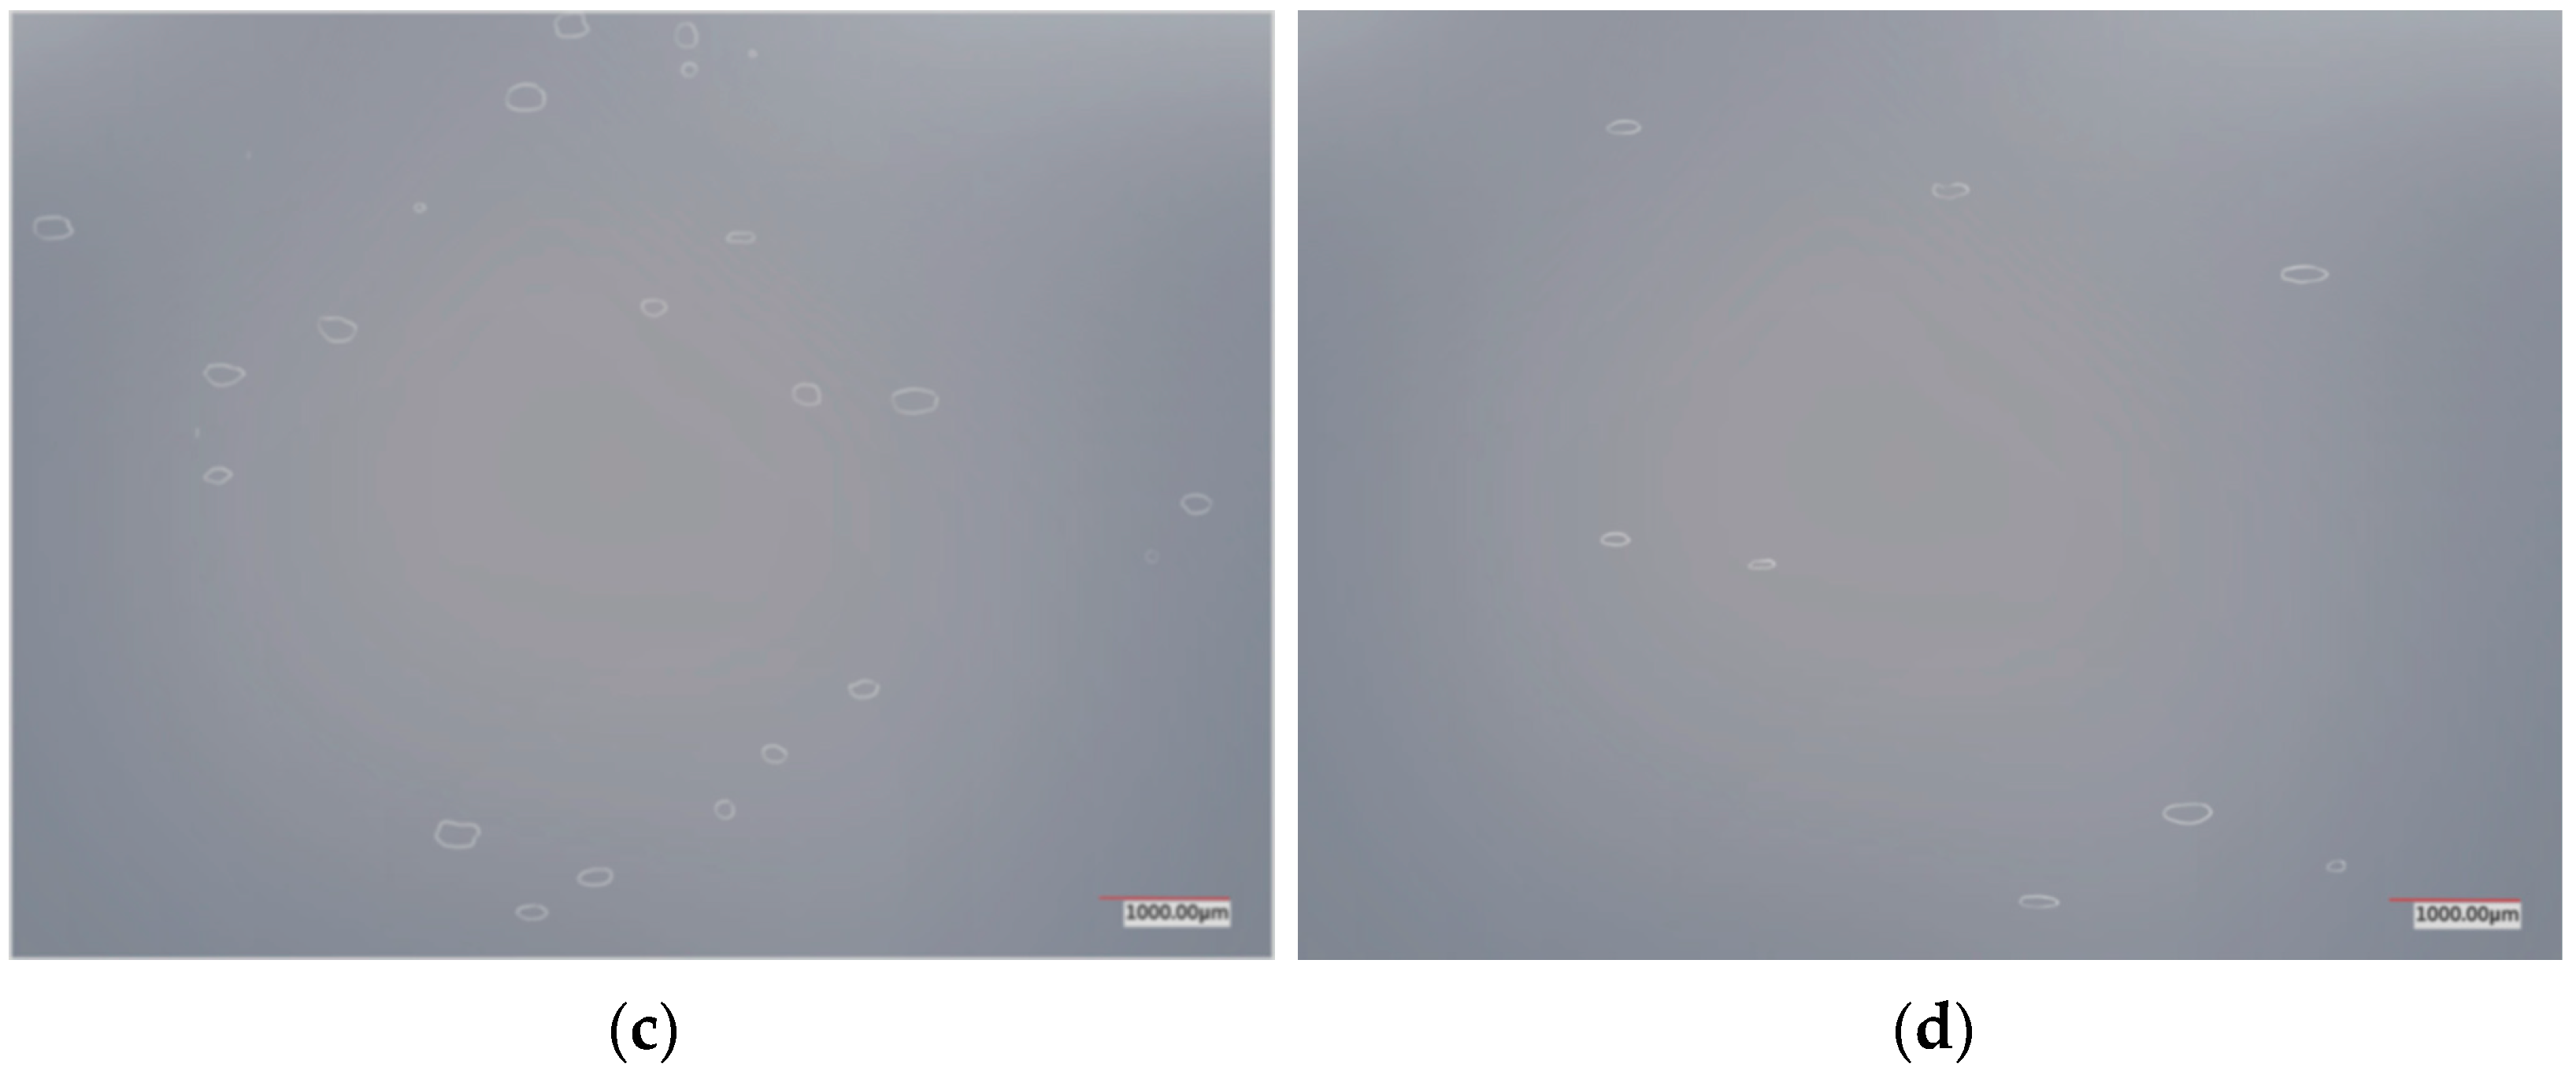
4.2.2. Effect of Impact Angle on Spreading of PVDF Slurry Droplets

In this experiment, the spreading behavior of droplets was observed in regions 3 to 6 to investigate the effect of the impact angle on the morphology of droplets after spreading. Taking the experimental group with PE film as the substrate as an example, the droplet morphology under different impact angles and the spreading diameter in region 3 are shown in Figure 13.
From Figure 13, it can be observed that as the impact angle decreases, the droplet spreads more easily after impact and forms an elliptical shape. This is because at smaller impact angles, the tangential velocity of the droplet relative to the surface is higher, and the distance the droplet slides on the surface increases, causing the droplet to take an elliptical shape. Additionally, the surface tension of the droplet forces the edges to diffuse outward, further increasing the spreading degree and leading to a larger average diameter. However, as the impact angle decreases, the droplet spends more time in the air, where it is subjected to more air resistance and gravity, resulting in a greater loss of kinetic energy and speed, which causes the droplet to eventually fall into the collection tray. Therefore, at more distant locations, the droplet’s spreading area density is lower. The direction of the droplet’s elliptical spreading is perpendicular to the movement direction of the conveyor belt, which is caused by the droplet’s tangential velocity and is independent of the conveyor speed. By comparing the experimental results with the simulation results, the accuracy of the simulation conclusions was verified.

5. Conclusions

This study focuses on the maximum spreading coefficient and final shrinking coefficient of droplets in the dispersing disk spray coating process. The energy changes during the droplet diffusion phase are analyzed, and the mathematical expressions for the maximum spreading coefficient and final shrinking coefficient are derived. The main factors influencing the droplet spreading process are identified, and theoretical modeling and analysis of droplet spreading are achieved.
Through XFlow simulations of the droplet spreading process, a simulation model was established to numerically investigate the spreading characteristics of PVDF slurry droplets impacting films. The analysis results indicate that both the surface roughness of the substrate and the impact angle have correlations with the spreading coefficient, shrinkage coefficient, maximum spreading coefficient, and final shrinking coefficient. During the diffusion phase, the shrinkage coefficient remains largely unchanged. As the surface roughness of the substrate increases, the spreading coefficient decreases. Additionally, as the impact angle increases, the spreading coefficient also decreases. In the shrinkage phase, as the surface roughness of the substrate increases, the spreading coefficient decreases and the shrinkage coefficient increases. Both the maximum spreading coefficient and the final shrinking coefficient decrease as the impact angle increases. The smaller the impact angle, the more pronounced the droplet sliding phenomenon becomes.
Experimental studies show that changes in the type of substrate lead to variations in surface roughness. Regardless of the impact angle, when droplets spread on the substrate, a rougher surface results in a smaller average spreading diameter. Additionally, as the impact angle increases, the average spreading diameter of the droplets decreases. A comparison and analysis of the experimental and simulation results reveal consistency between the two, thus providing evidence for the validity of the simulation model.
The spray coating process for preparing lithium-ion battery separators is quite complex. This study primarily investigates the spreading characteristics of droplets during this process. However, due to time constraints and research limitations, the current work still requires further extension and in-depth exploration. In subsequent research, the influence of material properties (such as viscosity, surface tension, etc.) on droplet spreading is planned to be considered through experimental investigation. By utilizing simulations to understand the influencing mechanisms and designing experiments to validate the conclusions, we aim to enhance the authority and reliability of our findings.

Author Contributions

Writing—original draft, L.M. and Y.M.; writing—review and editing, K.Y., H.X., J.H., Y.L., K.W. and D.S.; project administration, L.M. All authors have read and agreed to the published version of the manuscript.

Funding

This research was funded by the Key Research and Development Program of Shaanxi Province (grant number 2024QY2-GJHX-30) and the Undergraduate Innovation Training Program of Shaanxi Province (grant number S202410700194).

Institutional Review Board Statement

Not applicable.

Informed Consent Statement

Not applicable.

Data Availability Statement

Data are contained within the article.

Conflicts of Interest

Author Dongyue Sun was employed by the companies Shanghai Putailai New Energy Technology Co., Ltd. and KATOP Automation Co., Ltd. The remaining authors declare that the research was conducted in the absence of any commercial or financial relationships that could be construed as a potential conflict of interest.

References

  1. Meinshausen, M.; Meinshausen, N.; Hare, W.; Raper, S.C.B.; Frieler, K.; Knutti, R.; Frame, D.J.; Allen, M.R. Greenhouse-gas emission targets for limiting global warming to 2 °C. Nature 2009, 458, 1158–1162. [Google Scholar] [CrossRef]
  2. Twidell, J. Renewable Energy Resources; Routledge: London, UK, 2021. [Google Scholar]
  3. Wen, Z.; Fang, W.; Chen, L.; Guo, Z.; Zhang, N.; Liu, X.; Chen, G. Anticorrosive copper current collector passivated by self-assembled porous membrane for highly stable lithium metal batteries. Adv. Funct. Mater. 2021, 31, 2104930. [Google Scholar] [CrossRef]
  4. Hao, Z.; Zhao, Q.; Tang, J.; Zhang, Q.; Liu, J.; Jin, Y.; Wang, H. Functional separators towards the suppression of lithium dendrites for rechargeable high-energy batteries. Mater. Horiz. 2021, 8, 12–32. [Google Scholar] [CrossRef]
  5. Lee, H.; Yanilmaz, M.; Toprakci, O.; Fu, K.; Zhang, X. A review of recent developments in membrane separators for rechargeable lithium-ion batteries. Energy Environ. Sci. 2014, 7, 3857–3886. [Google Scholar] [CrossRef]
  6. Pan, S.; Chen, J.; Wei, Y.; Wu, C.; Jia, J.; Yao, K. Simulation Analysis of the Influence of Operating Parameters on the Pressure Profile in the Coating Bead. Coatings 2024, 14, 1413. [Google Scholar] [CrossRef]
  7. Wang, X.; Xu, B.; Guo, S.; Zhao, Y.; Chen, Z. Droplet impacting dynamics: Recent progress and future aspects. Adv. Colloid Interface Sci. 2023, 317, 102919. [Google Scholar] [CrossRef] [PubMed]
  8. Park, H.; Carr, W.W.; Zhu, J.; Morris, J.F. Single drop impaction on a solid surface. AIChE J. 2003, 49, 2461–2471. [Google Scholar] [CrossRef]
  9. Harlow, F.H.; Shannon, J.P. The Splash of a Liquid Drop. J. Appl. Phys. 1967, 38, 3855–3866. [Google Scholar] [CrossRef]
  10. Nepomnyashchy, A. Droplet on a liquid substrate: Wetting, dewetting, dynamics, instabilities. Curr. Opin. Colloid Interface Sci. 2021, 51, 101398. [Google Scholar] [CrossRef]
  11. Vafaei, S.; Podowski, M.Z. Analysis of the relationship between liquid droplet size and contact angle. Adv. Colloid Interface Sci. 2005, 113, 133–146. [Google Scholar] [CrossRef] [PubMed]
  12. Vafaei, S.; Podowski, M.Z. Theoretical analysis on the effect of liquid droplet geometry on contact angle. Nucl. Eng. Des. 2005, 235, 1293–1301. [Google Scholar] [CrossRef]
  13. Yan, Z.; Li, Y.; Li, C. Numerical simulation study of droplet impact on various solid surfaces. J. Therm. Sci. Tech. 2018, 17, 8. [Google Scholar]
  14. Wijshoff, H. Drop dynamics in the inkjet printing process. Curr. Opin. Colloid Interface Sci. 2018, 36, 20–27. [Google Scholar] [CrossRef]
  15. Arogeti, M.; Sher, E.; Bar-Kohany, T. Drop Impact on Small Targets With Different Target-to-Drop Diameters Ratio. Chem. Eng. Sci. 2018, 193, 89–101. [Google Scholar] [CrossRef]
  16. Bennett, T.; Poulikakos, D. Splat-quench solidification: Estimating the maximum spreading of a droplet impacting a solid surface. J. Mater. Sci. 1993, 28, 963–970. [Google Scholar] [CrossRef]
  17. Chandra, S.; Avedisian, C.T. On the collision of a droplet with a solid surface. Proc. R. Soc. A Math. Phys. Eng. Sci. 1991, 432, 13–41. [Google Scholar] [CrossRef]
  18. Eggers, J.; Fontelos, M.A.; Josserand, C.; Zaleski, S. Drop dynamics after impact on a solid wall: Theory and simulations. Phys. Fluids 2010, 22, 062101. [Google Scholar] [CrossRef]
  19. Roisman, I.V.; Lembach, A.; Tropea, C. Drop splashing induced by target roughness and porosity: The size plays no role. Adv. Colloid Interface Sci. 2015, 222, 615–621. [Google Scholar] [CrossRef]
  20. Guan, C.; Lv, X.; Han, Z.; Chen, C. The wetting characteristics of aluminum droplets on rough surfaces with molecular dynamics simulations. Phys. Chem. Chem. Phys. 2020, 22, 2361–2371. [Google Scholar] [CrossRef] [PubMed]
  21. Shang, Y.; Zhang, Y.; Hou, Y.; Bai, B.; Zhong, X. Effects of surface subcooling on the spreading dynamics of an impact water droplet. Phys. Fluids 2020, 32, 123–309. [Google Scholar] [CrossRef]
  22. Sakakibara, B.; Inamuro, T. Lattice Boltzmann simulation of collision dynamics of two unequal-size droplets. Int. J. Heat Mass Transf. 2008, 51, 3207–3216. [Google Scholar] [CrossRef]
  23. Wei, Y.; Qian, Y. Coalescence of Two Colliding Liquid Droplets with Lattice Boltzmann Method. In Proceedings of the 65th Annual Meeting of the APS Division of Fluid Dynamics, San Diego, CA, USA, 18–20 November 2012. [Google Scholar]
  24. Deng, Z.; Zhang, C.; Chen, Y.; Zhang, L.; Shi, M. Study on Dynamics Behaviors of Droplet Coalescence. J. Eng. Thermophys. 2015, 36, 1321–1324. [Google Scholar]
  25. Li, P.; Huang, Y.; Yu, Y.; Ma, X.; Wang, Z.; Shao, G. Recent advances and future prospects for PVDF-based solid polymer electrolytes. J. Power Sources 2025, 628, 235855. [Google Scholar] [CrossRef]
Figure 1. Schematic of spraying equipment and spraying process. (a) Dispersing disk assembly of spraying machine, (b) individual dispersing disk, (c) spraying process.
Coatings 15 00242 g001
Figure 2. Diagram of droplet flight and spreading process. (a) Flight phase, (b) diffusion phase, (c) shrinkage phase.
Coatings 15 00242 g002
Figure 3. Droplet spreading process on substrates with different surface roughness values. (a) Ra = 0.499 μm, (b) Ra = 0.735 μm, (c) Ra = 0.797 μm.
Coatings 15 00242 g003
Figure 4. Curves of droplet spreading coefficients (a) and shrinkage coefficients (b) versus spreading time for different substrate surface roughness amounts.
Coatings 15 00242 g004
Figure 5. Curves of maximum spreading coefficients (a) and final shrinking coefficients (b) of droplets of different diameters as a function of film surface roughness.
Coatings 15 00242 g005
Figure 6. The spreading process of droplets at different impact angles (15°, 30°, and 45°).
Coatings 15 00242 g006
Figure 7. Curves of droplet spreading coefficient (a) and retraction coefficient (b) versus spreading time for different droplet impact angles.
Coatings 15 00242 g007
Figure 8. Curves of maximum spreading coefficients (a) and final shrinking coefficients (b) of droplets of different diameters versus droplet impact angle.
Coatings 15 00242 g008
Figure 9. Experimental equipment. (a) Unwinding unit, (b) spray coating unit, (c) oven drying unit, (d) rewinding unit.
Coatings 15 00242 g009
Figure 10. Sample preparation and measurement instrumentation. (a) Sample film sectioning for testing, (b) coating process using single dispersing disk, (c) Keyence optical microscope used for measurement.
Coatings 15 00242 g010
Figure 11. Droplet spreading morphology and diameter under different substrate films. (a1) Spread morphology on Al2O3 film, (b1) spread morphology on PE film, (c1) spread morphology on Bohm stone film, (a2) droplet spreading diameter on Al2O3 film, (b2) droplet spreading diameter on PE film, (c2) droplet spreading diameter on boehmite film.
Coatings 15 00242 g011
Figure 12. Relationship between surface roughness and average droplet spreading diameter in different regions.
Coatings 15 00242 g012
Figure 13. Droplet spreading morphology and diameter in different regions. (a) Spreading diameter in region 3, (b) spreading morphology in region 4, (c) spreading morphology in region 5, (d) spreading morphology in region 6.
Coatings 15 00242 g013aCoatings 15 00242 g013b
Table 1. Rheological parameters of PVDF solution.
SymbolValueProperty
k0.0929Consistency index (Pa·s)
n1.0681Flow behavior index
τ 0 4.6501Yield stress (Pa)
μ 0 0.0910Yield viscosity (Pa·s)
Table 2. The surface roughness of the three substrates.
Substrate TypeRoughness ( μ m )
Al2O30.499
PE0.735
boehmite0.797
Disclaimer/Publisher’s Note: The statements, opinions and data contained in all publications are solely those of the individual author(s) and contributor(s) and not of MDPI and/or the editor(s). MDPI and/or the editor(s) disclaim responsibility for any injury to people or property resulting from any ideas, methods, instructions or products referred to in the content.

